

SUMMARY
Damage to the corticospinal tract (CST) in stroke patients has been associated with functional reorganization in the ipsilesional and contralesional sensorimotor cortices. However, it is unknown whether a quantitative relationship exists between the extent of structural damage to the CST and functional reorganization in stroke patients. The purpose of the current study was to examine the relationship between structural CST damage and motor task-related cortical activity in chronic hemiparetic stroke patients. In ten chronic hemiparetic stroke patients with heterogeneous lesions, CST damage was quantified using conventional structural magnetic resonance imaging and tractography based on diffusion tensor imaging. Cortical activity was measured using functional magnetic resonance imaging during repetitive flexion/extension movements of the digits. We found that the two measures of CST damage were strongly correlated. Moreover, greater CST damage was significantly and linearly correlated with increased activation during affected hand movement in the hand area of the contralesional primary sensorimotor cortex (M1/S1) and in the ipsilesional M1/S1 ventral to the hand area. To our knowledge, this is the first demonstration of a quantitative relationship between the extent of structural damage to the CST and functional reorganization in stroke patients. This relationship was observed in stroke patients with heterogeneous lesions, suggesting that CST damage is a factor relevant to the variation in functional reorganization in the clinical population.
Damage to the primary motor cortex (M1) and/or its efferents that travel along the corticospinal tract (CST) impairs motor performance of the digits (Hepp-Reymond and Wiesendanger, 1972; Wenzelburger et al., 2005). Recovery of motor skill after focal damage to the M1 or CST has been shown to be paralleled by functional reorganization in intact sensorimotor cortices of the ipsilesional and contralesional hemispheres (Frost et al., 2003; Gerloff et al., 2006; Jaillard et al., 2005; Lotze et al., 2006; Loubinoux et al., 2003; Nudo and Milliken, 1996; Tombari et al., 2004; Weiller et al., 1993). Animal studies have shown that the extent of focal damage to the M1 results in a proportionate level of functional reorganization in remote cortices (Biernaskie et al., 2005; Dancause et al., 2006; Frost et al., 2003). A few animal and patient studies have explicitly demonstrated that functional reorganization in remote sensorimotor cortices after focal damage to the M1 or CST is involved in compensating for the lesion-induced deficits in motor behavior (Biernaskie et al., 2005; Fridman et al., 2004; Frost et al., 2003; Lotze et al., 2006).
The lesion in hemiparetic stroke patients, however, is typically not limited to the M1 or CST. Rather, the location and size of the lesion among patients are generally quite heterogeneous. Paralleling this lesion heterogeneity, patterns of functional reorganization among hemiparetic stroke patients tend to vary greatly. One factor shown to influence the pattern of functional reorganization in hemiparetic stroke patients is whether the M1 was spared or damaged; a stroke involving damage to the M1 has been associated with greater enhancement of motor task-related functional activity in the contralesional M1 (Feydy et al., 2002; Stinear et al., 2007). In hemiparetic stroke patients with heterogenous subcortical lesions, the degree of loss in the functional integrity of the corticospinal system, measured using transcranial magnetic stimulation (TMS) that tests the composite excitability of several elements of the descending motor system (e.g., cortical circuitry, corticospinal tract, spinal circuitry), has been shown to be correlated with increased motor task-related activity in several sensorimotor cortices of the ipsilesional and contralesional hemispheres (Ward et al., 2006). Together, these findings suggest that amidst the variability in lesion location and size among hemiparetic stroke patients, the extent of functional reorganization in ipsilesional and contralesional hemispheres relates to damage of key components of the descending motor system (i.e., M1 and CST). To our knowledge, however, no study has examined whether there exists a quantitative relationship between the extent of structural damage to the CST and motor task-related functional reorganization in hemiparetic stroke patients. Therefore, the purpose of the current study was to examine the relationship between the extent of structural damage to the CST and motor task-induced cortical activity in chronic hemiparetic stroke patients with variable lesion size and location.
To accomplish our goal, structural magnetic resonance imaging (MRI) and functional MRI (fMRI) was conducted in a cohort of chronic hemiparetic stroke patients with heterogeneous lesions. The extent of structural damage of the CST was quantified using two approaches. One approach used morphometry of the cerebral peduncles based on conventional structural magnetic resonance images. The ipsilesional cerebral peduncle of hemiparetic stroke patients atrophies over time due to Wallerian degeneration of the CST, and this atrophy can be detected with structural imaging (Feydy et al., 2002; Kuhn et al., 1989; Stovring and Fernando, 1983; Warabi et al., 1987; Warabi et al., 1990).
The second approach for quantifying the extent of structural damage of the CST employed diffusion tensor imaging (DTI), an MRI technology that measures the random diffusion of water molecules (Basser et al., 1994; Pierpaoli et al., 1996). The diffusion measurements can be used to calculate the fractional anisotropy (FA) metric that reflects the degree of directional preference in water diffusion (Basser, 1995). DTI studies in hemiparetic stroke patients have reported early (Thomalla et al., 2004), progressive (Moller et al., 2007; Thomalla et al., 2005) and chronic (Pierpaoli et al., 2001; Werring et al., 2000) loss of FA along the ipsilesional CST reflective of Wallerian degeneration. Tractography applied to DTI data can be used to reconstruct major cerebral white matter tracts by successively following the path of the preferred direction of water diffusion when FA is higher than a selected threshold (Basser et al., 2000; Conturo et al., 1999; Jones et al., 1999b; Mori et al., 1999). Tractography was used recently to reveal a reduced number of reconstructed ipsilesional CST fibers in patients with congenital hemiparesis (Thomas et al., 2005). We reasoned that in chronic hemiparetic stroke patients there would be a reduced number of reconstructed ipsilesional CST fibers proportionate to the extent of structural damage to the ipsilesional CST caused by primary axonal damage or Wallerian degeneration. Therefore, in the current study, the number of reconstructed fibers of the ipsilesional CST was measured to quantify structural damage of the CST in the chronic stroke patients.
We examined the relationship between the morphometry- and tractography-based approaches employed to measure structural damage of the ipsilesional CST, and correlated each against motor task-related cortical activation measured using fMRI. Characterizing a quantitative relationship between structural damage of the CST and functional activation in stroke patients would be expected to advance our understanding of the factors driving functional reorganization after stroke.
MATERIALS AND METHODS
Subjects
Ten patients with chronic stroke, former in-patients at Greater Boston area hospitals, were enrolled (Table 1). These patients fulfilled the following entry criteria: (1) first-ever ischemic stroke incurred > 6 months earlier; (2) acute unilateral loss of hand strength to ≤ 4 on the Medical Research Council (MRC) scale (0–5, 5 = normal) (Medical Research Council, 1976) based on physician notes entered into the medical record of the initial hospitalization within ~24 hours after stroke; (3) no prior or subsequent symptomatic stroke; (4) able to competently perform the motor task applied during fMRI with the affected and unaffected hands; (5) language and cognitive status sufficient to allow full cooperation with study procedures. Notably, the stroke location and size among the patients were heterogeneous (Table 1, Figure 1). All patients had received and completed physical rehabilitation after their stroke. Premorbid hand dominance was evaluated by having the patients complete the Edinburgh Inventory (Oldfield, 1971) based on recall. Some data acquired from these patients have been used for other analyses, the results of which have been recently described (Schaechter and Perdue, 2007).
Table 1.
Patient Characteristics
| Patient | Premorbid Hand Dominance | Stroke-Affected Hand | Age (yr) | Gender | Time Post- Stroke (yr) | Acute UL (hand) MRC Score | Lesion
|
|
|---|---|---|---|---|---|---|---|---|
| Location | Volume (cm3) | |||||||
| 1 | R | L | 52 | M | 0.5 | 3 | R CR, BG, temporal lobe | 15.2 |
| 2 | R | R | 47 | M | 3.9 | 0 (0) | L CR, BG, IC, inferior frontal lobe | 77.3 |
| 3 | R | R | 41 | F | 5.9 | 0–3 (0) | L medial temporal lobe, PLIC | 0.9 |
| 4 | R | R | 69 | M | 1.6 | 4 | L CR, BG, temporal lobe | 61.2 |
| 5 | R | L | 76 | F | 2 | 1 (0) | R CR, temporal lobe | 3.4 |
| 6 | R | R | 62 | F | 1.2 | 3–4+(3+) | L CR | 0.7 |
| 7 | R | L | 48 | F | 1.7 | 0 (0) | R frontal and parietal lobe white matter | 10.1 |
| 8 | L | R | 60 | M | 5.8 | 0–3(0) | L CR, BG | 4.2 |
| 9 | R | R | 61 | M | 2.2 | 0 (0) | L frontal lobe, parietal lobe | 33.8 |
| 10 | R | L | 69 | M | 1.2 | 1–3 (1) | R BG | 0.7 |
| Summary | 9R/1L | 6R/4L | 59 ± 11 | 4F/6M | 2.6 ± 1.9 | |||
M, male; F, female; R, right; L, left; UL, upper limb; IC, internal capsule; PLIC, posterior limb of IC; BG, basal ganglia; CR, corona radiata. UL MRC scores are strength measures (scale 0–5; 0 = no power, 5 = normal) for muscles of the affected upper limb acutely after stroke, as reported in the medical record; hand MRC scores are given in parentheses if available. Summary values are mean ± SD.
Figure 1.

T2-weighted image (parallel to intercommissural plane) from each patient at the level where the infarct (red circle) most involved or most closely approximated the path of the CST. Patient numbers correspond with those in Table 1.
For the purpose of characterizing the morphometric and tractography approaches for measuring structural integrity of the CST, we also enrolled ten normal healthy subjects with no history of stroke and a normal neurological examination. Hand dominance was determined by the Edinburgh Inventory (Oldfield, 1971). The normal subjects were well matched to the stroke patients for age (normals: 60 ± 10 years; patients: 59 ± 11 years; mean ± standard deviation (SD)), handedness (normals and patients: 9 right hand dominant, 1 left hand dominant) and gender (normals: 3 females; patients: 4 females).
All subjects provided written informed consent in accordance with the Human Subjects Committee of the Partners Institutional Review Board.
Behavioral Testing
Motor function of the affected and unaffected hands of the stroke patients was assessed using two tests. Maximum speed of index finger tapping was measured in 2 × 10-s trials (Shimoyama et al., 1990). Fine manual dexterity was measured using the Purdue Pegboard test in 3 × 30-s trials (Desrosiers et al., 1995; Tiffin and Asher, 1948). As independent finger movement, finger movement speed, and fine manual dexterity are motor functions impaired by damage to the CST (Wiesendanger, 1984), these tests relate to structural integrity of the CST. Test scores were averaged over trials. Average test scores for the affected hand were normalized by dividing by the average test scores of the unaffected hand, multiplied by 100, and reported in percent.
Motor Task during fMRI
The motor task performed by the patients during fMRI was unilateral flexion/extension of the five digits in unison, with the digits moving through their full range-of-motion at 0.25 Hz (1 cycle per 4 s). Movement epochs (22.5 s × 5) alternated with rest epochs (22.5 s × 6) in which the hand fully relaxed. Separate functional runs were conducted during performance of each hand of the patients, with the hand performing first randomized across patients. Conditions were cued by visual stimuli generated by a Macintosh G3 iBook running MacStim software (v2.6), back-projected onto a translucent screen, and viewed via a tilted mirror. Movement stimuli were schematic representations of a hand that alternated every 2 s between digit flexion and extension, and were colored green for the 22.5-s epoch, except for the last 2.5 s when the schematic changed to red to cue preparation to stop moving. Stimuli cueing rest were shaped as an asterisk, sized similar to the movement stimuli, and alternated between being colored blue and red at the same frequency as the movement stimuli (every 2 s). Before scanning, patients were trained until they could comfortably perform the motor task with either hand.
Monitoring Motor Task Performance during fMRI
Motor task performance was recorded on-line from the patients using a custom-built device that has been described previously in detail (Schaechter et al., 2006). The device utilizes micro-electromechanical system (MEMS) gyroscopes to measure angular velocity of each of the ten digits. The angular velocity data were used to compute the mean duration, frequency, amplitude, speed, acceleration and jerk of the five digits of the moving hand, as well as mirror movements of the hand contralateral to the task-performing hand, as described previously (Schaechter et al., 2006; Schaechter and Perdue, 2007).
Image Acquisition
Magnetic resonance images were acquired using a 3T Siemens Trio magnetic resonance scanner and a transmitter/receiver Bruker circular polarization head coil. With the subject lying supine on the scanner bed, a custom-formed bite bar was used to limit head motion. For patients participating in fMRI, the elbows were slightly flexed so that both pronated forearms rested on the lower trunk and thighs. Splints were used to support the wrists at about 20° extension. Straps and cushions were used to stabilize the trunk and arms.
Blood oxygenation level-dependent (BOLD) images were acquired from the patients using a T2*-weighted gradient-echo, echo planar imaging sequence (repetition time (TR) = 1500 ms; echo time (TE) = 30 ms; flip angle (α) = 90°; field-of-view (FOV) = 200 mm × 200 mm; matrix size = 64 × 64; slice thickness = 5 mm; interslice gap = 1 mm; number of slices = 23; acquisitions/slice = 165) equipped with automatic alignment of the slices parallel to the intercommissural plane (van der Kouwe et al., 2005) and prospective acquisition correction of head motion (Thesen et al., 2000). BOLD image collection was preceded by four dummy scans to allow for equilibration of the MRI signal.
Structural volumes were collected from all subjects using a T1-weighted MPRAGE sequence (TR = 7 ms; TE = 3 ms; α = 7°; FOV = 256 × 256 mm; matrix size = 192 × 256; effective slice thickness = 1.33 mm). These images were used for cortical surface reconstruction, anatomical localization of functional activity, and morphometry of the cerebral peduncles.
T2-weighted turbo spin-echo images (TR = 5300 s; TE = 103 ms; α = 180°; FOV = 210 × 210 mm; matrix size = 256 × 256) were obtained from the patients for determination of lesion location and volume, using the same slice specifications as for the BOLD images.
Diffusion tensor images were collected from all subjects using a single-shot, twice-refocused spin echo (Reese et al., 2003) sequence (TR = 10.7 s; TE = 91 ms; α = 90°; FOV = 256 × 256 mm; matrix size = 128 × 128; slice thickness = 2 mm; interslice gap = 0 mm; number of acquisitions = 70, 60 non-collinear directions with b-value 700 s/mm2, 10 with b-value 0 s/mm2; voxel size = 2 × 2 × 2 mm; number of slices = 75) with automatic alignment of the slices parallel to the intercommissural plane (van der Kouwe et al., 2005). These images were used for tractography of the CST.
Image Analysis
Tractography
The DTI task card software (v1.70) run on a Siemens Medical Solutions Numaris 4 satellite console (www.nmr.mgh.harvard.edu/~rpwang/siemens/dti_taskcard) was used for analysis of the DTI data. Visual inspection of the diffusion-weighted images acquired from each of the stroke patients and normal subjects revealed no artifacts and stable head position. The mean post-averaged signal-to-noise ratio of the diffusion-weighted images across the subjects was 20. The diffusion tensor, associated eigensystem, and FA metric was calculated at each voxel using a linear least square regression method.
The CST in each hemisphere was reconstructed using a fiber assignment by continuous tracking (FACT) algorithm (Basser et al., 2000; Conturo et al., 1999; Jones et al., 1999b; Mori et al., 1999) using two regions-of-interest (ROIs), the precentral gyrus and the posterior limb of the internal capsule (PLIC). Great care was taken to standardize placement and size of the ROIs bilaterally. The size of the left relative to the right precentral gyrus ROI across the subjects was 0.98; this ratio for the PLIC ROIs was 1.00. The precentral gryus ROI was drawn on the single axial slice of the image with no diffusion weighting (b-value 0 s/mm2) in which the precentral and central sulci of the hand knob region (Yousry et al., 1997) were most noticeable (14–20 mm inferior from the vertex of the brain). The remaining borders of the precentral gyrus ROI were the interhemispheric fissure medially and the surface of the brain laterally. Based on extensive pilot testing of CST tractography for within-subject reproducibility (see below), we opted to draw the PLIC ROI on four consecutive axial slices, with the most inferior axial slice displaying: i) marked hyperintensity in this white matter region on the FA map, and ii) anterior and posterior horns of the lateral ventricle as well as the third ventricle in the image with no diffusion weighting. The PLIC ROI was delimited medially by the thalamus; laterally by the globus pallidus; anteriorly by the genu of the internal capsule; and posteriorly at the level of the posterior thalamus. For images from patients in which the stroke involved the PLIC or distorted the PLIC region due to brain atrophy (Patients #1, 2, 3, 5 and 8), the ipsilesional PLIC ROI was: i) drawn on each of the same four consecutive axial slices as the PLIC ROI in the opposite hemisphere; ii) positioned in the hyperintense region of the FA map that approximately mirrored the position of the PLIC ROI in the opposite hemisphere; and iii) sized to approximate that of the PLIC ROI in the opposite hemisphere.
Fiber tracts were reconstructed using the precentral gyrus ROI and each of the ipsilateral PLIC ROIs in two stages. First, voxels of the precentral gyrus ROI served as seeds and the PLIC ROI served as the target. Then, voxels of the PLIC ROI served as seeds and the precentral gyrus ROI served as the target. Tracking followed the direction of fastest diffusion in 0.5 mm step lengths, and was terminated if FA was less than 0.15 or the tract angle between successive steps was greater than 20°. These parameters are similar those used by others who applied the FACT algorithm for CST reconstruction (Holodny et al., 2005; Moller et al., 2007; Sage et al., 2007; Thomas et al., 2005). All fibers reconstructed between the two ROIs were considered to be the CST. The reconstructed CST fibers were found to pass through the posterior portion of the PLIC, consistent with tract tracing studies in monkeys that showed this region to contain fibers descending from the arm region of the M1 (Fries et al., 1993; Morecraft et al., 2002). Prior tractography studies in humans have also observed reconstructed CST fibers descending from the precentral gyrus to course through this posterior region of the PLIC (Holodny et al., 2005; Newton et al., 2006). In most patients (#1, 2, 3, 4, 5, 6 and 8), the reconstructed CST fibers were observed to abut the region of the infarct, visualized as a hyperintense region in images with the no diffusion weighting (see Supplementary Material). In the remaining patients, the reconstructed CST fibers were observed to course through (Patient #7) or were remote from (Patients #9 and 10) the hyperintense region.
The number of reconstructed CST fibers between the precentral gyrus ROI and each PLIC ROI was counted. While the number of reconstructed fibers relative to the real number of axons within a tract is not known (Johansen-Berg and Behrens, 2006), counting the number of reconstructed fibers has been used previously to estimate structural integrity of major white matter pathways (Thomas et al., 2005). Extensive pilot testing was conducted to evaluate the effect on the number of reconstructed CST fibers as function of which axial slice the PLIC and precentral gyrus ROIs were drawn. We did find some within-subject variability (approximately 20%) in CST fiber count depending on which slice the PLIC ROI was drawn. The variability in CST fiber count associated with shifting the PLIC ROI superiorly/inferiorly was due to voxels along the medial and lateral borders of the PLIC containing differential fractions of gray matter. This partial volume effect yields an estimate of the diffusion tensor and eigensystem that does not reflect the true diffusion properties of the biologic tissue, resulting in inaccuracies in tract reconstruction to and from these voxels. To minimize the impact of these inaccuracies on estimating CST damage, we opted to average ipsilaterally the number of reconstructed CST fibers connecting the precentral gyrus ROI to each of the four PLIC ROIs. In contrast, we found only minor differences (< 5%) in CST fiber count when the slice on which the precentral gyrus ROI was drawn was shifted superiorly or inferiorly (2–4 mm). This lack of effect of precentral gyrus ROI slice selection held true even for the one patient (#9) whose stroke involved the superior aspect of the precentral gyrus. However, the infarct in this patient involved tissue lateral to the hand knob region, and was thus lateral to the white matter region where reconstructed CST fibers typically coursed.
The average number of reconstructed CST fibers counted in one hemisphere was normalized to that of the other hemisphere. For patients, this normalization was conducted by dividing the average ipsilesional CST fiber count by the average contralesional CST fiber count. For normal subjects, the average left hemisphere CST fiber count was divided by the average right hemisphere CST fiber count. These ratios were multiplied by 100 to convert to percent, with higher percent values reflecting greater structural integrity of the ipsilesional CST. Percent values were used in subsequent analyses.
Morphometry
An experienced neuradiologist, who was blind to the tractography-based measurements of CST integrity, used Alice software (Hayden Image Processing Solutions, Denver, CO) to measure the cross-sectional area of the left and right cerebral peduncles based on the T1-MPRAGE images acquired from each subject. As the structural images were acquired using an automated slice positioning procedure (van der Kouwe et al., 2005), the slices were symmetric left to right. For each set of images, the single axial slice in which the lateral notch most prominently divided the tegmentum from the crus cerebri was selected. A line was drawn from the notch perpendicular to the long axis of the crus cerebri. As the substantia nigra was not clearly distinguished from the cerebral peduncle in the T1-weighted images, the line was drawn through the substantia nigra. The cross-sectional area of the cerebral peduncle was measured bilaterally. Images from some patients (#2, 3, 5 and 8) showed T1 signal hypointensity in the ipsilesional cerebral peduncle. This hypointense region was included in the cross-sectional area measurement. The ipsilesional peduncle area from the patients was divided by the contralesional peduncle area. For normal subjects, the left peduncle area was divided by the right peduncle area. These ratios were multiplied by 100 to convert to percent, with higher percent values reflecting greater structural integrity of the ipsilesional CST. Percent values were used in subsequent analyses.
Lesion Volume
An experienced neuroradiologist manually outlined the signal abnormality slice by slice in T2-weighted images acquired from the patients using Alice software, and computed the total volume of lesioned tissue.
fMRI
We wished to compare cortical activation during affected versus unaffected hand movement in patients on a voxel-by-voxel basis. To accomplish this comparison, images were processed so that the left hemisphere was always contralateral to the moving hand, and the right hemisphere was always ipsilateral to the moving hand. Accordingly, BOLD and MPRAGE images were processed in their native orientation as well as after being flipped across the midsagittal plane.
Freesurfer software (http://surfer.nmr.mgh.harvard.edu) was used to compute a model of the cortical surface based on the MPRAGE images using procedures described in detail previously (Dale et al., 1999; Fischl et al., 1999a). Each cortical surface model was spatially-normalized to a spherical surface template using an automated procedure that optimally aligns major cortical gyri and sulci (Fischl et al., 1999b), then transformed, using SUMA software (http://afni.nimh.nih.gov/afni/suma), to a standard cortical surface composed of nodes forming a triangular mesh.
Preprocessing and statistical analysis of functional images were performed using AFNI software (http://afni.nimh.nih.gov/afni). The functional volumes from each patient were preprocessed by correcting retrospectively for motion, normalizing signal intensity, and co-registering with the structural volume. The BOLD data along the normal vector through the gray/white matter border – pial surface were mapped to the standard cortical surface. The surface-mapped BOLD data were spatially-smoothed using a two-dimensional Gaussian filter (Chung et al., 2003) with a full-width at half maximum of 6 mm.
Statistical analysis of the functional data was conducted using a general linear model fit at each node of the cortical surface, with data acquired during affected and unaffected hand movement fit separately. The model included a stimulus input function defined as a boxcar convolved with a canonical hemodynamic response, baseline and linear drift terms, and motion-correction parameters as nuisance regressors. The resultant beta coefficient maps that reflect BOLD signal change during motor task performance relative to rest were entered into two-tailed one-sample t-tests to evaluate group-average activation during affected and unaffected hand movement, and into two-tailed paired t-tests to evaluate within-group differences in activation during affected versus unaffected hand movement.
Linear regression analyses were conducted to examine the possible relationship between cortical activation during affected hand movement in the patients and each of ten structural and behavioral measures. Each of ten analyses fit a simple linear regression model at each cortical surface node to determine the correlation across the patients between activation (beta coefficient; BOLD signal change, in percent) and: i) structural integrity of the ipsilesional CST measured by tractography (in percent); ii) structural integrity of the ipsilesional CST measured by morphometry (in percent); iii) lesion volume (in cm3); iv) affected hand motor function measured by index finger tapping speed (in percent); v) affected hand motor function measured by the Purdue Pegboard test (in percent); and vi-x) each kinematic parameter (amplitude, speed, acceleration, jerk, mirroring) of task performance measured during fMRI. Two additional regression analyses were conducted at each cortical surface node to examine the correlation between activation during unaffected hand movement in the patients and structural integrity of the ipsilesional CST measured by tractography and morphometry.
Group-level statistical maps were corrected for multiple comparisons by controlling for false positives using a combination of individual node-level probability and minimum cluster size (Forman et al., 1995), values determined from Monte Carlo simulations (10,000 iterations) performed on synthesized white Gaussian noise data. One-sample t-test maps were corrected to a cluster-wise significance level of 0.01 by setting the individual node probability to 0.01 and minimum cluster size to 234 mm2. The paired t-test map and regression maps were corrected to a cluster-wise significance level of 0.05 by setting the individual node probability to 0.05 and minimum cluster size to 323 mm2. Regression maps in which the individual node probability was set at 0.10 and minimum cluster size to 405 mm2 were considered to exhibit a cluster-wise nonsignificant trend at a level of 0.10.
In cortical regions exhibiting a correlation between structural integrity of the CST and activation during affected hand movement (see Results), we determined the cortical node exhibiting the most significant correlation, and plotted CST integrity (based on tractography and morphometry, in percent) against BOLD signal change (in percent) at this node for each patient.
Statistical Analysis
Results are expressed as the mean ± SD. StatView (version 4.5) was used for statistical procedures. Differences in behavioral scores and kinematic parameters of fMRI task performance associated with the affected hand versus the unaffected hand of the patients were evaluated using two-tailed paired t-tests. Differences in CST integrity associated with the patients versus normal subjects were evaluated using two-tailed unpaired t-tests. Pearson’s correlation coefficient was used to evaluate the relationship between the two metrics of CST integrity, as well as each metric of CST integrity versus each behavioral measure of affected hand motor function. The significance of a correlation was determined using a z-test following Fisher’s r to z transformation. Alpha was set to 0.05 for all tests.
RESULTS
Behavioral Testing
Behavioral testing revealed that the chronic stroke patients exhibited a range of motor function of the affected hand (~30 to 100% function relative to the unaffected hand; Table 2). On a group basis, the affected hand exhibited significant residual motor impairments evidenced by reduced index finger tapping speed (affected hand: 2.6 ± 1.0 taps/s, unaffected hand: 3.7 ± 1.0 taps/s; P < 0.05, paired t-test) and fine manual dexterity measured by the Purdue Pegboard test (affected hand: 9.6 ± 3.3 pegs, unaffected hand: 12.9 ± 1.6 pegs; P < 0.05, paired t-test).
Table 2.
Motor Function of the Affected Hand of Patients
| Patient | Behavioral Test
|
|
|---|---|---|
| IT (%) | PP (%) | |
| 1 | 79.8 | 82.3 |
| 2 | 34.1 | 39.4 |
| 3 | 107.1 | 97.7 |
| 4 | 91.3 | 112.4 |
| 5 | 58.2 | 52.8 |
| 6 | 59.3 | 88.0 |
| 7 | 98.8 | 92.5 |
| 8 | 85.3 | 50.8 |
| 9 | 93.3 | 100.0 |
| 10 | 39.2 | 48.5 |
| Mean ± SD | 74.6 ± 25.4 | 76.4 ± 26.0 |
IT = index finger tapping speed; PP = Purdue Pegboard test
Motor Task Performance during fMRI
Analysis of the finger motion sensor data acquired during fMRI revealed no significant differences in the kinematics of the motor task performed by the affected hand compared to the unaffected hand of the patients (each P > 0.05, paired t-test; Table 3). Further, there was no significant difference in mirror movements of the “resting” hand when the motor task was performed by the affected hand (0.12 ± 0.80%) compared to the unaffected hand (0.16 ± 0.42%).
Table 3.
Motor performance of patients during fMRI
| Movement parameter | Hand | |
|---|---|---|
| Affected | Unaffected | |
| Duration (s) | 22.5 ± 0.7 | 22.4 ± 0.6 |
| Frequency (Hz) | 0.25 ± 0.00 | 0.25 ± 0.00 |
| Amplitude (% max range-of-motion) | 78.2 ± 9.1 | 81.1 ± 5.2 |
| Speed (deg/s) | 75.5 ± 16.2 | 84.5 ± 27.2 |
| Acceleration/102 (deg/s2) | 15.2 ± 5.4 | 18.3 ± 8.2 |
| Jerk/103 (counts > 5 × 10⁴ deg/s3) | 18.8 ± 11.5 | 16.1 ± 7.3 |
Structural Integrity of the CST
Figure 2 (A and B) shows an example of measurements of the structural integrity of the CST in a stroke patient (#5) using the tractography and morphometry approaches. Tractography revealed significantly less symmetry in the number of reconstructed CST fibers in the two hemispheres of the patients compared to the normal subjects (patients: 55 ± 23%; normals: 101 ± 12%; P < 0.0001, unpaired t-test). Similarly, morphometry revealed significantly less symmetry in the cross-sectional area of the cerebral peduncles in the patients relative to normals (patients: 78 ± 14%; normals: 96 ± 9%; P < 0.005, unpaired t-test). In the patients, structural integrity of the ipsilesional CST measured using the two approaches was strongly and significantly correlated (r = 0.83; P < 0.005; Figure 2C).
Figure 2.
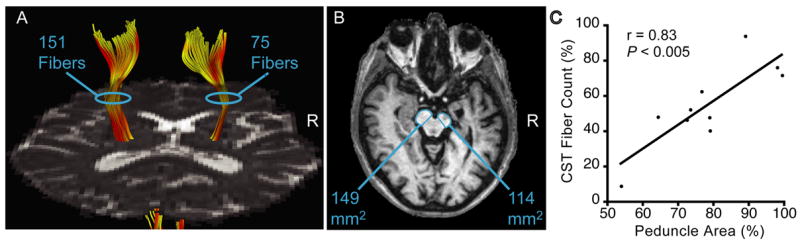
Quantification of ipsilesional CST damage using tractography and morphometry in chronic stroke patients. (A) Number of reconstructed CST fibers based on DTI-tractography in a patient (#5) with a right (R) hemisphere stroke. (B) Cross-sectional area of the cerebral peduncles visualized in T1-weighed images from the same patient as in A. (C) Significant correlation across the stroke patients between ipsilesional CST damage measured using tractography and morphometry (r = 0.83, P < 0.005).
Functional Activation
Group-level analysis of the fMRI data acquired from the patients revealed that affected hand movement elicited marked activation in the hand area of the sensorimotor cortex (i.e., M1, primary somatosensory cortex (S1), premotor cortex) (Yousry et al., 1997) in the contralateral (ipsilesional) hemisphere (cluster-level corrected P < 0.01, one-sample t-test, Figure 3A). Activation in the contralateral hemisphere was also observed in the posterior parietal cortex, supplementary motor area and cingulate cortex. Affected hand movement elicited activation in several regions of the ipsilateral (contralesional) hemisphere as well, in the hand area of the M1 and premotor cortex, posterior parietal cortex, frontal operculum, parietal operculum, supplementary motor area, and cingulate cortex. Movement of the unaffected hand of the patients elicited a similar pattern of activation as described for the affected hand, yet with additional clusters of significant activation in the contralateral parietal operculum and frontal operculum, and lacking significant activation in the ipsilateral M1, frontal operculum, and posterior parietal cortex (Figure 3B). Within-group comparison revealed significant increases in activation during affected hand movement relative to unaffected hand movement in two regions of the ipsilateral (contralesional) hemisphere (cluster-level corrected P < 0.05, paired t-test, Figure 3C). One region was in the hand area of the sensorimotor cortex, involving the posterior bank of the precentral gyrus (corresponding to area 4, Geyer et al., 1996); crown and anterior bank of the precentral gyrus (corresponding to area 6, Geyer et al., 1996; Geyer et al., 2000); central sulcus (corresponding to area 3a, Geyer et al., 1999); and anterior bank of the postcentral gyrus (corresponding to area 3b, Geyer et al., 1999). The second region was in the supplementary motor area extending into the cingulate cortex.
Figure 3.

Functional MRI results of motor task-related cortical activation in chronic stroke patients. Shown are group-average statistical activation maps (cluster-level corrected P < 0.01, one-sample t-tests) during affected hand movement (A) and unaffected hand movement (B). Color bar reflects node-level P-values. Also show is the statistical map of within-subject differences in activation (cluster-level corrected P < 0.05, paired t-test) (C). Maps are overlaid on a model of the group-average, inflated cortical surface of the contralateral hemisphere (CH) and ipsilateral hemisphere (IH). Top row are lateral surfaces of the hemisphere; bottom row are medial surfaces of the hemisphere. Dark gray regions are the fundus of a sulcus; light gray regions are the crowns of a gyrus. Green arrowheads point to central sulcus.
Correlations
We examined the linear relationship between structural integrity of the ipsilesional CST and functional activation during affected hand movement in the patients. Structural integrity of the ipsilesional CST, measured by tractography, was found to be significantly (cluster-level corrected P < 0.05) and negatively correlated with functional activation in two cortical regions (Figure 4). One region was in the hand area of the contralesional M1/S1. More specifically, this region was located in the posterior bank of the precentral gyrus (putative area 4); central sulcus (putative area 3a); anterior bank of the postcentral gyrus (putative area 3b); crown of the postcentral gyrus (corresponding to area 1, Geyer et al., 1999); and posterior bank of the postcentral gyrus (corresponding to area 2, Grefkes et al., 2001). The second region was in the ipsilesional M1/S1 (putative areas 4, 3a, 3b, 1 and 2) ventral to the hand area. Examination of this relationship using the morphometric measure of ipsilesional CST integrity similarly revealed a significant (cluster-level corrected P < 0.05) negative correlation in the hand area of the contralesional M1/S1, though only a nonsignificant trend (cluster-level corrected P < 0.10) in the ipsilesional M1/S1 ventral to the hand area. The two M1/S1 regions exhibiting a correlation between activation and the tractography-based measurement of CST integrity overlapped with the two regions exhibiting a correlation between activation and the morphometry-based measurement of ipsilesional CST integrity. There was no cortical area exhibiting a significant positive correlation between structural integrity of the ipsilesional CST, measured using either tractography or morphometry, and activation during affected hand movement. There was also no cortical area exhibiting a significant correlation between activation during unaffected hand movement and ipsilesional CST integrity measured using either approach. These results suggest that poorer structural integrity of the ipsilesional CST (i.e., greater structural damage of the CST) in the chronic stroke patients was associated with proportionate increases in motor task-related activation in two M1/S1 regions remote to the hand area of the ipsilesional sensorimotor cortex.
Figure 4.

Correlation between structural integrity of the ipsilesional CST and cortical activation in chronic stroke patients during affected hand movement. Left column shows cortical regions in the contralesional (top row) and ipsilesional (bottom row) hemispheres exhibiting this correlation, when CST integrity was measured using tractography or morphometry, and the region of overlap. These regions are displayed on the group-average, inflated cortical surface and, in insets, on the folded surface in the region of the central sulcus. Note that the contralesional region is location in the hand area of the M1/S1, whereas the ipsilesional region is located ventral to the hand area of the M1/S1. Clusters are significant at corrected level of P < 0.05, with the exception of the ipsilesional M1/S1 cluster identified using morphometry that showed a correlation at corrected level of P < 0.10. The middle and right columns are plots of these relationships at the cortical node of maximum correlation within each cluster when CST integrity was measured using tractography or morphometry.
We examined whether the ventral region of the ipsilesional M1/S1 in which we observed a correlation between activation and structural damage of the CST involved the infarct in any patient. We found that the infarct in one patient (#9) overlapped with the precentral gyrus portion of the ventral, ipsilesional M1/S1 region. Eliminating this overlapping region from the regression analysis that used the tractography-based measurement of CST integrity still yielded a cluster that was significant at a corrected cluster-wise corrected level of 0.05. Similarly, eliminating this overlapping region from the regression analysis that used the morphometry-based measurement of CST integrity still yielded a cluster that exhibited a nonsignificant trend at a cluster-wise corrected level of P < 0.10.
We examined the linear relationship between cortical activation during affected hand movement and several structural and behavioral measures. We found no cortical area exhibiting a significant correlation between activation during affected hand movement and: i) lesion volume; ii) affected hand motor function measured by index finger tapping speed or the Purdue Pegboard test; or iii) any kinematic parameter (amplitude, speed, acceleration, jerk, mirroring) measured by the finger motion sensors during fMRI.
We tested the linear relationship between affected hand motor function and ipsilesional CST integrity. We found modest correlations, though not reaching statistical significance, between affected hand motor function measured by the Purdue Pegboard test and ipsilesional CST integrity based on tractography (r = 0.59, P = 0.07) and morphometry (r = 0.55, P = 0.10). Poorer correlations were found between affected hand motor function measured by index finger tapping speed and either approach for estimating ipsilesional CST integrity (tractography: r = 0.50, P = 0.15; morphometry: r = 0.30, P = 0.40).
DISCUSSION
The current study examined the relationship between the extent of structural damage to the CST, the major pathway in the brain controlling hand motor performance, and functional activation in chronic hemiparetic stroke patients with heterogeneous lesions. We found that reduced structural integrity (i.e., greater structural damage) of the ipsilesional CST correlated with increased activation during affected hand movement in the hand area of the contralesional M1/S1 and in the ipsilesional M1/S1 ventral to the hand area. Previous studies in hemiparetic stroke patients showed that focal damage to the PLIC, hence presumably the CST, was associated with increased activation in the hand area of the contralesional M1/S1 (Lotze et al., 2006; Loubinoux et al., 2003; Tombari et al., 2004) and ventral, ipsilesional M1/S1 (Weiller et al., 1993) relative to that in controls. The current study provides the first demonstration, to our knowledge, of a quantitative relationship between the extent of structural damage to the CST and cortical activation in stroke patients with variable lesion size and location.
Measurement of CST Damage
The extent of structural damage to the CST was quantified in vivo in the chronic stroke patients using two independent approaches based on MRI - morphometry and tractography. Our morphometry approach measured the cross-sectional area of the cerebral peduncles in the chronic stroke patients. Sequential changes in signal intensity in the ipsilesional cerebral peduncle, likely reflecting axonal and myelin degradation, have been previously observed over the first months to years after hemiparetic stroke using conventional structural imaging (Inoue et al., 1990; Kuhn et al., 1989; Orita et al., 1994). Cerebral peduncle atrophy is a relatively late manifestation of Wallerian degeneration of the CST typically observed within the first years after stroke (Inoue et al., 1990; Kuhn et al., 1989; Stovring and Fernando, 1983), though has been reported to occur by 6 to 8 months after stroke. Thus, our finding of atrophy of the ipsilesional cerebral peduncle in the stroke patients who incurred a stroke at least 6 months earlier is consistent with Wallerian degeneration of the ipsilesional CST.
Our tractography approach for measuring the extent of structural damage to the CST detected a reduced number of reconstructed ipsilesional CST fibers in the chronic stroke patients. This result parallels the recent finding made by Thomas and colleagues who reported a reduced number of reconstructed CST fibers ipsilesionally in children with hemiparetic cerebral palsy (Thomas et al., 2005). Several mechanisms may have contributed to our observed decrease in reconstructed ipsilesional CST fibers. In chronic stroke patients, there is loss of diffusion anisotropy in white matter directly damaged by the infarct due to axonal degeneration and gliosis, and at remote white matter sites affected by Wallerian degeneration (Jones et al., 1999a; Wieshmann et al., 1999; Yang et al., 1999). Severe loss of FA in CST axons could have reduced the number of reconstructed ipsilesional CST fibers by causing premature termination of tracking from seed to target. Less severe loss of FA in CST axons may have permitted tracking, though a change in the preferred direction of diffusion may have caused the reconstructed path to deviate from the real CST. Such deviant paths may have failed to hit the target ROI, contributing to the reduced number of reconstructed CST fibers. It is also possible that compression of intact CST fibers, due to stroke-related tissue loss and ventricular expansion, could have contributed to the reduced number of reconstructed CST fibers. The relative impact these mechanisms had on reducing the number of reconstructed ipsilesional CST fibers in the chronic stroke patients is not known.
The tractography- and morphometry-based measures of structural damage to the CST in the chronic stroke patients were highly correlated (r = 0.83), indicating relatively high concurrent validity. The correlations relating CST damage to functional activation, and CST damage to hand motor function measures, were higher with use of tractography compared to morphometry. This result suggests that tractography may provide a more accurate estimate of ipsilesional CST damage than morphometry, though further study involving a larger cohort of chronic stroke patients is required. Also noteworthy are the higher correlations between CST damage (measured by tractography or morphometry) and the Purdue Pegboard test compared to index finger tapping speed, consistent with the strong reliance of fine manual dexterity on the CST (Wiesendanger, 1984).
Both approaches for quantifying CST damage relied on time-dependent degenerative processes occurring after stroke. The time interval between the stroke and study enrollment varied among the patients in the current study (0.5 – 5.9 years). This variability may have affected our morphometry- and tractography-based measurements of CST damage since degenerative processes may have evolved to different points among the patients. However, the observed high correlation between the two measures suggests that the relative magnitude of degenerative changes among the patients was more robust than potential error introduced by differences in stroke chronicity.
It is possible that our morphometry-based measurement of CST damage involved some error due to the fact that the cerebral peduncle contains not only the CST but also other corticofugal tracts (e.g., frontopontine fibers) (Carpenter, 1976), and the measured area included the substantia nigra. In our patients with heterogenous lesions, Wallerian degeneration of corticofugal axons other than those of the CST may have contributed to atrophy of the ipsilesional peduncle.
A possible source of error in our tractography-based measurement of CST damage may have stemmed from the known limitation in estimating the orientation of fibers at each voxel using a single tensor model. There are voxels along the longitudinally oriented CST that also contain other major tracts with a different orientation (e.g., superior longitudinal fasciculus oriented in the anterior-posterior direction). In these voxels containing crossing fibers, diffusion anisotropy will be reduced, resulting in some of the CST not being detected by tractography based on single tensor modeling. The specific location of the stroke in the patients relative to the CST fibers not detected by tractography may have contributed to an error in estimating CST damage. Such a potential error might be minimized in future studies by applying multi-orientation diffusion modeling (Behrens et al., 2007) or model-free imaging (Wedeen et al., 2005).
Ipsilesional CST Damage and Functional Activation
We found that poorer structural integrity of the ipsilesional CST was correlated with increased activation in bilateral M1/S1 in the chronic stroke patients. A recent study by Ward and colleagues examined the correlation between functional integrity of the corticospinal system, measured using TMS, and brain activation in chronic subcortical stroke patients (Ward et al., 2006). Consistent with our results, they found significant negative correlations in the hand region of the contralesional area 4a of the M1 and area 1 of the S1, as well as in a ventral region of the ipsilesional area 4p of the M1. However, whereas Ward and colleagues found correlations in these discrete areas of the M1 and S1, we detected significant correlations in broader regions of the M1 (involving putative area 4p as well as putative area 4a), and the S1 (involving putative areas 3a, 3b and 2 as well as area 1). Further, Ward and colleagues found significant correlations in several secondary sensorimotor cortices of the ipsilesional and contralesional hemispheres. One possible reason for these different results is that the Ward study measured functional integrity of the corticospinal system, whereas the current study measured structural integrity of the CST. Structural integrity of the CST is one of several components influencing the functional integrity of the corticospinal system. Another factor may have been that the two studies utilized different motor tasks during fMRI (Ward et al.: handgrip at varying forces; current: digit flexion/extension). These tasks may have elicited brain activation that differed with regard to magnitude and distribution of activation, contributing to differences in the correlation between activation and corticspinal tract/system integrity.
Cortical activation during affected hand movement of the patients was found to be greater in the hand area of the ipsilateral (contralesional) M1/S1 compared to that during unaffected hand movement. This result is consistent with several other reports that demonstrated enhanced motor task-related activation in the contralesional M1/S1 in hemiparetic stroke patients relative to controls (Butefisch et al., 2005; Chollet et al., 1991; Cramer et al., 1997; Foltys et al., 2003; Gerloff et al., 2006; Lotze et al., 2006; Schaechter and Perdue, 2007; Weiller et al., 1993). The functional significance of enhanced contralesional activation in stroke patients has been much debated. This debate has been due, in part, to inconsistent results of TMS studies that found that inactivation of the contralesional M1 in hemiparetic stroke patients improved (Mansur et al., 2005; Takeuchi et al., 2005), degraded (Lotze et al., 2006), or left unchanged (Werhahn et al., 2003) motor performance of the affected hand. The current findings suggest that the degree of enhanced motor task-related activation in the contralesional M1/S1 of chronic stroke patients is directly proportionate to the extent of damage of the ipsilesional CST. They do not allow us to clearly determine whether this regional increase in activation played a functional role in compensating for the ipsilesional CST damage in the patients. It is noteworthy, however, that detailed kinematics (amplitude, speed, acceleration, jerk, mirroring) of the movement performed by the affected hand during fMRI were not significantly different from the kinematics of unaffected hand movement. TMS-induction of an M1 “virtual lesion” in normal adults has been shown to enhance excitability of the “contralesional M1” without a measurable loss in hand motor function (Schambra et al., 2003). Accordingly, it is conceivable that the enhanced contralesional M1/S1 activation observed in the chronic stroke patients might reflect altered interhemispheric interactions that provided compensatory support for voluntary movement of the affected hand in face of the ipsilesional CST damage.
Poorer structural integrity of the ipsilesional CST was also associated with increased activation in the ventral region of the contralateral (ipsilesional) M1/S1 during affected hand movement in the patients. Notably, the level of activation in this ventral M1/S1 region during affected hand movement was not significantly different from that occurring during unaffected hand movement. Other imaging studies suggest complex changes occurring in this ventral region of the ipsilesional M1/S1 in stroke patients. Decreased activation in the ventral, ipsilesional M1/S1 during affected hand movement has been reported in chronic stroke patients relative to controls (Zemke et al., 2003). Conversely, increased activation in the ventral, ipsilesional M1/S1 has been demonstrated in chronic stroke patients relative to controls in association with an infarct involving the PLIC (Weiller et al., 1993) or the motor cortex (Cramer and Crafton, 2006), and with a ventral shift in the somatotopic representation of the fingers (Cramer and Crafton, 2006). These prior reports, considered together with the current findings, tentatively suggest that activity in the ventral region of the ipsilesional M1/S1 may be generally depressed in chronic stroke patients; yet this depression may be proportionally offset by greater CST damage.
We observed increased activation in the ipsilateral (contralesional) supplementary motor area, extended into the neighboring cingulate cortex, during movement of the affected hand relative to the unaffected hand of the chronic stroke patients. Several prior functional imaging studies have reported increased activation of these midline regions in stroke patients relative to controls, though the laterality of the enhancement has been variable across studies (Foltys et al., 2003; Nair et al., 2007; Schaechter and Perdue, 2007; Weiller et al., 1993). We found that activation in the contralesional supplementary motor area/cingulate cortex was not, however, linearly related to the extent of CST damage. These results suggest that factors other than the severity of CST damage also contribute to reorganization of functional activity in stroke patients. These factors may include the distribution and severity of damage in the wider motor network.
A quantitative relationship between the extent of structural damage to the CST and activation in sensorimotor cortices has been demonstrated in patient populations other than stroke. Increased lesion load along the CST in patients who experienced a single attack of hemiparesis due to presumptive multiple sclerosis has been shown to correlate with increased activation in bilateral M1/S1 (Pantano et al., 2002). Increased axonal injury along the CST has also been shown to correlate with increased activation in the contralesional motor cortex in patients with cerebral autosomal dominant arteriopathy with subcortical infarcts and leukoencephalopathy (CADASIL) (Reddy et al., 2002). These findings, together with our results from stroke patients, suggest that CST damage to the human brain elicits a proportionate level of functional reorganization in sensorimotor cortices. Prior studies in animals similarly demonstrated that increased damage to the motor cortex resulted in a proportionate level of functional reorganization in remote sensorimotor cortices (Biernaskie et al., 2005; Dancause et al., 2006; Frost et al., 2003). Cumulatively, these findings in humans and animals suggest that the brain may respond to structural damage of key structures involved in hand motor performance (i.e., M1 or CST) by proportionately increasing activity in remote sensorimotor cortices.
In sum, the current study demonstrated that greater structural damage to the ipsilesional CST, as measured by tractography and morphometry, was linearly related to increased motor task-related activation in bilateral M1/S1 regions remote to the ipsilesional hand area in chronic hemiparetic stroke patients with heterogeneous lesions. This finding suggests that the extent of CST damage is a factor relevant to the extent of functional reorganization in the sensorimotor cortex within the clinical population. Given that motor outcome of the patients in this study was generally good and their lesions were generally small and subcortical, future studies are needed to determine whether the structure-function relationship detected in the current study generalizes in a sample of stroke patients who represent the broader clinical population.
Supplementary Material
Supplementary Material. Localization of infarct relative to reconstructed CST fibers in the chronic stroke patients. Images are the axial slice with no diffusion weighting that shows the closest spatial relationship between the region of signal hyperintensity (arrow) and the reconstructed ipsilesional CST fibers (red). Patient numbers correspond with those in Table 1. Axial images from Patients #3 and 4 have been tilted to better visualize the infarct-tract proximity. The reconstructed fibers seen in the contralesional hemisphere of the image from Patients #9 are extensions of the reconstructed ipsilesional CST fibers.
Acknowledgments
This study was supported by grants from the National Institutes of Health K23-HD044425 (to J.D.S.), NCRR (P41-RR14075), and MIND Institute. We thank Mingwang Zhu, M.D., Ph.D. for calculating lesion volumes and cerebral peduncle sizes; Brendan Connell for assisting in MRI data acquisition; and Mark Vangel, Ph.D. and Thomas Benner, Ph.D. for helpful discussions.
Footnotes
Publisher's Disclaimer: This is a PDF file of an unedited manuscript that has been accepted for publication. As a service to our customers we are providing this early version of the manuscript. The manuscript will undergo copyediting, typesetting, and review of the resulting proof before it is published in its final citable form. Please note that during the production process errors may be discovered which could affect the content, and all legal disclaimers that apply to the journal pertain.
References
- Basser PJ, Mattiello J, LeBihan D. Estimation of the effective self-diffusion tensor from the NMR spin echo. J Magn Reson B. 1994;103:247–254. doi: 10.1006/jmrb.1994.1037. [DOI] [PubMed] [Google Scholar]
- Basser PJ. Inferring microstructural features and the physiological state of tissues from diffusion-weighted images. NMR Biomed. 1995;8:333–344. doi: 10.1002/nbm.1940080707. [DOI] [PubMed] [Google Scholar]
- Basser PJ, Pajevic S, Pierpaoli C, Duda J, Aldroubi A. In vivo fiber tractography using DT-MRI data. Magn Reson Med. 2000;44:625–632. doi: 10.1002/1522-2594(200010)44:4<625::aid-mrm17>3.0.co;2-o. [DOI] [PubMed] [Google Scholar]
- Behrens TE, Berg HJ, Jbabdi S, Rushworth MF, Woolrich MW. Probabilistic diffusion tractography with multiple fibre orientations: What can we gain? Neuroimage. 2007;34:144–155. doi: 10.1016/j.neuroimage.2006.09.018. [DOI] [PMC free article] [PubMed] [Google Scholar]
- Biernaskie J, Szymanska A, Windle V, Corbett D. Bi-hemispheric contribution to functional motor recovery of the affected forelimb following focal ischemic brain injury in rats. Eur J Neurosci. 2005;21:989–999. doi: 10.1111/j.1460-9568.2005.03899.x. [DOI] [PubMed] [Google Scholar]
- Butefisch CM, Kleiser R, Korber B, Muller K, Wittsack HJ, Homberg V, Seitz RJ. Recruitment of contralesional motor cortex in stroke patients with recovery of hand function. Neurology. 2005;64:1067–1069. doi: 10.1212/01.WNL.0000154603.48446.36. [DOI] [PubMed] [Google Scholar]
- Carpenter MB. Human Neuroanatomy. Williams and Wilkins Co; Baltimore: 1976. [Google Scholar]
- Chollet F, DiPiero V, Wise RJS, Brooks DJ, Dolan RJ, Frackowiak RSJ. The functional anatomy of motor recovery after stroke in humans: a study with positron emission tomography. Ann Neurol. 1991;29:63–71. doi: 10.1002/ana.410290112. [DOI] [PubMed] [Google Scholar]
- Chung MK, Worsley KJ, Robbins S, Paus T, Taylor J, Giedd JN, Rapoport JL, Evans AC. Deformation-based surface morphometry applied to gray matter deformation. Neuroimage. 2003;18:198–213. doi: 10.1016/s1053-8119(02)00017-4. [DOI] [PubMed] [Google Scholar]
- Conturo TE, Lori NF, Cull TS, Akbudak E, Snyder AZ, Shimony JS, McKinstry RC, Burton H, Raichle ME. Tracking neuronal fiber pathways in the living human brain. Proc Natl Acad Sci USA. 1999;96:10422–10427. doi: 10.1073/pnas.96.18.10422. [DOI] [PMC free article] [PubMed] [Google Scholar]
- Cramer SC, Nelles G, Benson RR, Kaplan JD, Parker RA, Kwong KK, Kennedy DN, Finklestein SP, Rosen BR. A functional MRI study of subjects recovered from hemiparetic stroke. Stroke. 1997;28:2518–2527. doi: 10.1161/01.str.28.12.2518. [DOI] [PubMed] [Google Scholar]
- Cramer SC, Crafton KR. Somatotopy and movement representation sites following cortical stroke. Exp Brain Res. 2006;168:25–32. doi: 10.1007/s00221-005-0082-2. [DOI] [PubMed] [Google Scholar]
- Dale A, Fischl B, Sereno M. Cortical surface-based analysis. I: Segmentation and surface reconstruction. Neuroimage. 1999;9:179–194. doi: 10.1006/nimg.1998.0395. [DOI] [PubMed] [Google Scholar]
- Dancause N, Barbay S, Frost SB, Zoubina EV, Plautz EJ, Mahnken JD, Nudo RJ. Effects of small ischemic lesions in the primary motor cortex on neurophysiological organization in ventral premotor cortex. J Neurophysiol. 2006;96:3506–3511. doi: 10.1152/jn.00792.2006. [DOI] [PubMed] [Google Scholar]
- Desrosiers J, Hebert R, Bravo G, Dutil E. The Purdue Pegboard test: normative data for people aged 60 and over. Disabil Rehabil. 1995;17:217–224. doi: 10.3109/09638289509166638. [DOI] [PubMed] [Google Scholar]
- Feydy A, Carlier R, Roby-Brami A, Bussel B, Cazalis F, Pierol L, Burnod Y, Maier MA. Longitudinal study of motor recovery after stroke: recruitment and focusing of brain activation. Stroke. 2002;33:1610–1617. doi: 10.1161/01.str.0000017100.68294.52. [DOI] [PubMed] [Google Scholar]
- Fischl B, Sereno MI, Dale AM. Cortical surface-based analysis. II: Inflation, flattening, and a surface-based coordinate system. Neuroimage. 1999a;9:195–207. doi: 10.1006/nimg.1998.0396. [DOI] [PubMed] [Google Scholar]
- Fischl B, Sereno MI, Tootell RBH, Dale AM. High-resolution intersubject averaging and a coordinate system for the cortical surface. Hum Brain Mapp. 1999b;8:272–284. doi: 10.1002/(SICI)1097-0193(1999)8:4<272::AID-HBM10>3.0.CO;2-4. [DOI] [PMC free article] [PubMed] [Google Scholar]
- Foltys H, Krings T, Meister IG, Sparing R, Boroojerdi B, Thron A, Topper R. Motor representation in patients rapidly recovering after stroke: a functional magnetic resonance imaging and transcranial magnetic stimulation study. Clin Neurophysiol. 2003;114:2404–2415. doi: 10.1016/s1388-2457(03)00263-3. [DOI] [PubMed] [Google Scholar]
- Forman SD, Cohen JD, Fitzgerald M, Eddy WF, Mintum MA, Noll DC. Improved assessment of significant activation in functional magnetic resonance imaging (fMRI): use of a cluster-size threshold. Magn Reson Med. 1995;33:636–647. doi: 10.1002/mrm.1910330508. [DOI] [PubMed] [Google Scholar]
- Fridman EA, Hanakawa T, Chung M, Hummel F, Leiguarda RC, Cohen LG. Reorganization of the human ipsilesional premotor cortex after stroke. Brain. 2004;127:747–758. doi: 10.1093/brain/awh082. [DOI] [PubMed] [Google Scholar]
- Fries W, Danek A, Scheidtmann K, Hamburger C. Motor recovery following capsular stroke: role of descending pathways from multiple motor areas. Brain. 1993;116:369–382. doi: 10.1093/brain/116.2.369. [DOI] [PubMed] [Google Scholar]
- Frost SB, Barbay S, Friel KM, Plautz EJ, Nudo RJ. Reorganization of remote cortical regions after ischemic brain injury: a potential substrate for stroke recovery. J Neurophysiol. 2003;89:3205–3214. doi: 10.1152/jn.01143.2002. [DOI] [PubMed] [Google Scholar]
- Gerloff C, Bushara K, Sailer A, Wassermann EM, Chen R, Matsuoka T, Waldvogel D, Wittenberg GF, Ishii K, Cohen LG, Hallett M. Multimodal imaging of brain reorganization in motor areas of the contralesional hemisphere of well recovered patients after capsular stroke. Brain. 2006;129:791–808. doi: 10.1093/brain/awh713. [DOI] [PubMed] [Google Scholar]
- Geyer S, Ledberg A, Schleicher A, Kinomura S, Schormann T, Burgel U, Klingberg T, Larsson J, Zilles K, Roland PE. Two different areas within the primary motor cortex of man. Nature. 1996;382:805–807. doi: 10.1038/382805a0. [DOI] [PubMed] [Google Scholar]
- Geyer S, Schleicher A, Zilles K. Areas 3a, 3b, and 1 of human primary somatosensory cortex. 1. Microstructural organization and interindividual variability. Neuroimage. 1999;10:63–83. doi: 10.1006/nimg.1999.0440. [DOI] [PubMed] [Google Scholar]
- Geyer S, Matelli M, Luppino G, Zilles K. Functional neuroanatomy of the primate isocortical motor system. Anat Embryol (Berl) 2000;202:443–474. doi: 10.1007/s004290000127. [DOI] [PubMed] [Google Scholar]
- Grefkes C, Geyer S, Schormann T, Roland P, Zilles K. Human somatosensory area 2: observer-independent cytoarchitectonic mapping, interindividual variability, and population map. Neuroimage. 2001;14:617–631. doi: 10.1006/nimg.2001.0858. [DOI] [PubMed] [Google Scholar]
- Hepp-Reymond MC, Wiesendanger M. Unilateral pyramidotomy in monkeys: effect on force and speed of a conditioned precision grip. Brain Res. 1972;36:117–131. doi: 10.1016/0006-8993(72)90770-6. [DOI] [PubMed] [Google Scholar]
- Holodny AI, Gor DM, Watts R, Gutin PH, Ulug AM. Diffusion-tensor MR tractography of somatotopic organization of corticospinal tracts in the internal capsule: initial anatomic results in contradistinction to prior reports. Radiology. 2005;234:649–653. doi: 10.1148/radiol.2343032087. [DOI] [PubMed] [Google Scholar]
- Inoue Y, Matsumura Y, Fukuda T, Nemoto Y, Shirahata N, Suzuki T, Shakudo M, Yawata S, Tanaka S, Takemoto K, et al. MR imaging of Wallerian degeneration in the brainstem: temporal relationships. AJNR Am J Neuroradiol. 1990;11:897–902. [PMC free article] [PubMed] [Google Scholar]
- Jaillard A, Martin CD, Garambois K, Lebas JF, Hommel M. Vicarious function within the human primary motor cortex? A longitudinal fMRI stroke study. Brain. 2005;128:1122–1138. doi: 10.1093/brain/awh456. [DOI] [PubMed] [Google Scholar]
- Johansen-Berg H, Behrens TE. Just pretty pictures? What diffusion tractography can add in clinical neuroscience. Curr Opin Neurol. 2006;19:379–385. doi: 10.1097/01.wco.0000236618.82086.01. [DOI] [PMC free article] [PubMed] [Google Scholar]
- Jones DK, Lythgoe D, Horsfield MA, Simmons A, Williams SC, Markus HS. Characterization of white matter damage in ischemic leukoaraiosis with diffusion tensor MRI. Stroke. 1999a;30:393–397. doi: 10.1161/01.str.30.2.393. [DOI] [PubMed] [Google Scholar]
- Jones DK, Simmons A, Williams SC, Horsfield MA. Non-invasive assessment of axonal fiber connectivity in the human brain via diffusion tensor MRI. Magn Reson Med. 1999b;42:37–41. doi: 10.1002/(sici)1522-2594(199907)42:1<37::aid-mrm7>3.0.co;2-o. [DOI] [PubMed] [Google Scholar]
- Konishi J, Yamada K, Kizu O, Ito H, Sugimura K, Yoshikawa K, Nakagawa M, Nishimura T. MR tractography for the evaluation of functional recovery from lenticulostriate infarcts. Neurology. 2005;64:108–113. doi: 10.1212/01.WNL.0000148477.65273.0C. [DOI] [PubMed] [Google Scholar]
- Kuhn MJ, Mikulis DJ, Ayoub DM, Kosofsky BE, Davis KR, Taveras JM. Wallerian degeneration after cerebral infarction: evaluation with sequential MR imaging. Radiology. 1989;172:179–182. doi: 10.1148/radiology.172.1.2740501. [DOI] [PubMed] [Google Scholar]
- Kunimatsu A, Aoki S, Masutani Y, Abe O, Hayashi N, Mori H, Masumoto T, Ohtomo K. The optimal trackability threshold of fractional anisotropy for diffusion tensor tractography of the corticospinal tract. Magn Reson Med Sci. 2004;3:11–17. doi: 10.2463/mrms.3.11. [DOI] [PubMed] [Google Scholar]
- Lee JS, Han MK, Kim SH, Kwon OK, Kim JH. Fiber tracking by diffusion tensor imaging in corticospinal tract stroke: Topographical correlation with clinical symptoms. Neuroimage. 2005;26:771–776. doi: 10.1016/j.neuroimage.2005.02.036. [DOI] [PubMed] [Google Scholar]
- Lotze M, Markert J, Sauseng P, Hoppe J, Plewnia C, Gerloff C. The role of multiple contralesional motor areas for complex hand movements after internal capsular lesion. J Neurosci. 2006;26:6096–6102. doi: 10.1523/JNEUROSCI.4564-05.2006. [DOI] [PMC free article] [PubMed] [Google Scholar]
- Loubinoux I, Carel C, Pariente J, Dechaumont S, Albucher JF, Marque P, Manelfe C, Chollet F. Correlation between cerebral reorganization and motor recovery after subcortical infarcts. Neuroimage. 2003;20:2166–2180. doi: 10.1016/j.neuroimage.2003.08.017. [DOI] [PubMed] [Google Scholar]
- Mansur CG, Fregni F, Boggio PS, Riberto M, Gallucci-Neto J, Santos CM, Wagner T, Rigonatti SP, Marcolin MA, Pascual-Leone A. A sham stimulation-controlled trial of rTMS of the unaffected hemisphere in stroke patients. Neurology. 2005;64:1802–1804. doi: 10.1212/01.WNL.0000161839.38079.92. [DOI] [PubMed] [Google Scholar]
- Medical Research Council (Great Britian) Aids to the examination of the peripheral nervous system. London: H. M. Stationery Office; 1976. [Google Scholar]
- Moller M, Frandsen J, Andersen G, Gjedde A, Vestergaard-Poulsen P, Ostergaard L. Dynamic changes of corticospinal tracts after stroke detected by fibertracking. J Neurol Neurosurg Psychiatry. 2007;78:587–592. doi: 10.1136/jnnp.2006.100248. [DOI] [PMC free article] [PubMed] [Google Scholar]
- Morecraft RJ, Herrick JL, Stilwell-Morecraft KS, Louie JL, Schroeder CM, Ottenbacher JG, Schoolfield MW. Localization of arm representation in the corona radiata and internal capsule in the non-human primate. Brain. 2002;125:176–198. doi: 10.1093/brain/awf011. [DOI] [PubMed] [Google Scholar]
- Mori S, Crain BJ, Chacko VP, van Zijl PC. Three-dimensional tracking of axonal projections in the brain by magnetic resonance imaging. Ann Neurol. 1999;45:265–269. doi: 10.1002/1531-8249(199902)45:2<265::aid-ana21>3.0.co;2-3. [DOI] [PubMed] [Google Scholar]
- Nair DG, Hutchinson S, Fregni F, Alexander M, Pascual-Leone A, Schlaug G. Imaging correlates of motor recovery from cerebral infarction and their physiological significance in well-recovered patients. Neuroimage. 2007;34:253–263. doi: 10.1016/j.neuroimage.2006.09.010. [DOI] [PMC free article] [PubMed] [Google Scholar]
- Newton JM, Ward NS, Parker GJ, Deichmann R, Alexander DC, Friston KJ, Frackowiak RS. Non-invasive mapping of corticofugal fibres from multiple motor areas--relevance to stroke recovery. Brain. 2006;129:1844–1858. doi: 10.1093/brain/awl106. [DOI] [PMC free article] [PubMed] [Google Scholar]
- Nudo RJ, Milliken G. Reorganization of movement representations in primary motor cortex following focal ischemic infarcts in adult squirrel monkeys. J Neurophysiol. 1996;75:2144–2149. doi: 10.1152/jn.1996.75.5.2144. [DOI] [PubMed] [Google Scholar]
- Oldfield RC. The assessment and analysis of handedness: the Edinburgh Inventory. Neuropsychologia. 1971;9:97–113. doi: 10.1016/0028-3932(71)90067-4. [DOI] [PubMed] [Google Scholar]
- Orita T, Tsurutani T, Izumihara A, Kajiwara K. Early, evolving Wallerian degeneration of the pyramidal tract in cerebrovascular diseases: MR study. J Comput Assist Tomogr. 1994;18:943–946. doi: 10.1097/00004728-199411000-00019. [DOI] [PubMed] [Google Scholar]
- Pantano P, Mainero C, Iannetti GD, Caramia F, Di Legge S, Piattella MC, Pozzilli C, Bozzao L, Lenzi GL. Contribution of corticospinal tract damage to cortical motor reorganization after a single clinical attack of multiple sclerosis. Neuroimage. 2002;17:1837–1843. doi: 10.1006/nimg.2002.1313. [DOI] [PubMed] [Google Scholar]
- Pierpaoli C, Jezzard P, Basser PJ, Barnett A, Di Chiro G. Diffusion tensor MR imaging of the human brain. Radiology. 1996;201:637–648. doi: 10.1148/radiology.201.3.8939209. [DOI] [PubMed] [Google Scholar]
- Pierpaoli C, Barnett A, Pajevic S, Chen R, Penix L, Virta A, Basser P. Water diffusion changes iin Wallerian degeneration and their dependence on white matter architecture. Neuroimage. 2001;13:1174–1185. doi: 10.1006/nimg.2001.0765. [DOI] [PubMed] [Google Scholar]
- Reddy H, De Stefano N, Mortilla M, Federico A, Matthews PM. Functional reorganization of motor cortex increases with greater axonal injury from CADASIL. Stroke. 2002;33:502–508. doi: 10.1161/hs0202.103337. [DOI] [PubMed] [Google Scholar]
- Reese TG, Heid O, Weisskoff RM, Wedeen VJ. Reduction of eddy-current-induced distortion in diffusion MRI using a twice-refocused spin echo. Magn Reson Med. 2003;49:177–182. doi: 10.1002/mrm.10308. [DOI] [PubMed] [Google Scholar]
- Sage CA, Peeters RR, Gorner A, Robberecht W, Sunaert S. Quantitative diffusion tensor imaging in amyotrophic lateral sclerosis. Neuroimage. 2007;34:486–499. doi: 10.1016/j.neuroimage.2006.09.025. [DOI] [PubMed] [Google Scholar]
- chaechter JD, Stokes C, Connell BD, Perdue K, Bonmassar G. Finger motion sensors for fMRI motor studies. Neuroimage. 2006;31:1549–1559. doi: 10.1016/j.neuroimage.2006.02.029. [DOI] [PubMed] [Google Scholar]
- Schaechter JD, Perdue KL. Enhanced cortical activation in the contralesional hemisphere of chronic stroke patients in response to motor skill challenge. Cereb Cortex. 2007 doi: 10.1093/cercor/bhm096. Epub, June 29. [DOI] [PubMed] [Google Scholar]
- Schambra HM, Sawaki L, Cohen LG. Modulation of excitability of human motor cortex (M1) by 1 Hz transcranial magnetic stimulation of the contralateral M1. Clin Neurophysiol. 2003;114:130–133. doi: 10.1016/s1388-2457(02)00342-5. [DOI] [PubMed] [Google Scholar]
- Shimoyama I, Ninchoji T, Uemura K. The finger-tapping test. A quantitative analysis. Arch Neurol. 1990;47:681–684. doi: 10.1001/archneur.1990.00530060095025. [DOI] [PubMed] [Google Scholar]
- Stinear CM, Barber PA, Smale PR, Coxon JP, Fleming MK, Byblow WD. Functional potential in chronic stroke patients depends on corticospinal tract integrity. Brain. 2007;130:170–180. doi: 10.1093/brain/awl333. [DOI] [PubMed] [Google Scholar]
- Stovring J, Fernando LT. Wallerian degeneration of the corticospinal tract region of the brain stem: demonstration by computed tomography. Radiology. 1983;149:717–720. doi: 10.1148/radiology.149.3.6647849. [DOI] [PubMed] [Google Scholar]
- Takeuchi N, Chuma T, Matsuo Y, Watanabe I, Ikoma K. Repetitive transcranial magnetic stimulation of contralesional primary motor cortex improves hand function after stroke. Stroke. 2005;36:2681–2686. doi: 10.1161/01.STR.0000189658.51972.34. [DOI] [PubMed] [Google Scholar]
- Thesen A, Heid O, Mueller E, Schad LR. Prospective acquisition correction for head motion with image-based tracking for real-time fMRI. Magn Reson Med. 2000;44:457–465. doi: 10.1002/1522-2594(200009)44:3<457::aid-mrm17>3.0.co;2-r. [DOI] [PubMed] [Google Scholar]
- Thomalla G, Glauche V, Koch MA, Beaulieu C, Weiller C, Rother J. Diffusion tensor imaging detects early Wallerian degeneration of the pyramidal tract after ischemic stroke. Neuroimage. 2004;22:1767–1774. doi: 10.1016/j.neuroimage.2004.03.041. [DOI] [PubMed] [Google Scholar]
- Thomalla G, Glauche V, Weiller C, Rother J. Time course of wallerian degeneration after ischaemic stroke revealed by diffusion tensor imaging. J Neurol Neurosurg Psychiatry. 2005;76:266–268. doi: 10.1136/jnnp.2004.046375. [DOI] [PMC free article] [PubMed] [Google Scholar]
- Thomas B, Eyssen M, Peeters R, Molenaers G, Van Hecke P, De Cock P, Sunaert S. Quantitative diffusion tensor imaging in cerebral palsy due to periventricular white matter injury. Brain. 2005;128:2562–2577. doi: 10.1093/brain/awh600. [DOI] [PubMed] [Google Scholar]
- Tiffin J, Asher EJ. The Purdue Pegboard: norms and studies of reliability and validity. J Appl Psychol. 1948;32:234–247. doi: 10.1037/h0061266. [DOI] [PubMed] [Google Scholar]
- Tombari D, Loubinoux I, Pariente J, Gerdelat A, Albucher JF, Tardy J, Cassol E, Chollet F. A longitudinal fMRI study: in recovering and then in clinically stable sub-cortical stroke patients. Neuroimage. 2004;23:827–839. doi: 10.1016/j.neuroimage.2004.07.058. [DOI] [PubMed] [Google Scholar]
- van der Kouwe AJ, Benner T, Fischl B, Schmitt F, Salat DH, Harder M, Sorensen AG, Dale AM. On-line automatic slice positioning for brain MR imaging. Neuroimage. 2005;27:222–230. doi: 10.1016/j.neuroimage.2005.03.035. [DOI] [PubMed] [Google Scholar]
- Warabi T, Miyasaka K, Inoue K, Nakamura N. Computed tomographic studies of the basis pedunculi in chronic hemiplegic patients: topographic correlation between cerebral lesion and midbrain shrinkage. Neuroradiology. 1987;29:409–415. doi: 10.1007/BF00341735. [DOI] [PubMed] [Google Scholar]
- Warabi T, Inoue K, Noda H, Murakami S. Recovery of voluntary movement in hemiplegic patients. Correlation with degenerative shrinkage of the cerebral peduncles in CT images. Brain. 1990;113:177–189. doi: 10.1093/brain/113.1.177. [DOI] [PubMed] [Google Scholar]
- Ward NS, Newton JM, Swayne OB, Lee L, Thompson AJ, Greenwood RJ, Rothwell JC, Frackowiak RS. Motor system activation after subcortical stroke depends on corticospinal system integrity. Brain. 2006;129:809–819. doi: 10.1093/brain/awl002. [DOI] [PMC free article] [PubMed] [Google Scholar]
- Wedeen VJ, Hagmann P, Tseng WY, Reese TG, Weisskoff RM. Mapping complex tissue architecture with diffusion spectrum magnetic resonance imaging. Magn Reson Med. 2005;54:1377–1386. doi: 10.1002/mrm.20642. [DOI] [PubMed] [Google Scholar]
- Weiller C, Ramsay SC, Wise RJS, Friston KJ, Frackowiak RSJ. Individual patterns of functional reorganization in the human cerebral cortex after capsular infarction. Ann Neurol. 1993;33:181–189. doi: 10.1002/ana.410330208. [DOI] [PubMed] [Google Scholar]
- Wenzelburger R, Kopper F, Frenzel A, Stolze H, Klebe S, Brossmann A, Kuhtz-Buschbeck J, Golge M, Illert M, Deuschl G. Hand coordination following capsular stroke. Brain. 2005;128:64–74. doi: 10.1093/brain/awh317. [DOI] [PubMed] [Google Scholar]
- Werhahn KJ, Conforto AB, Kadom N, Hallett M, Cohen LG. Contribution of the ipsilateral motor cortex to recovery after chronic stroke. Ann Neurol. 2003;54:464–472. doi: 10.1002/ana.10686. [DOI] [PubMed] [Google Scholar]
- Werring DJ, Toosy AT, Clark CA, Parker GJ, Barker GJ, Miller DH, Thompson AJ. Diffusion tensor imaging can detect and quantify corticospinal tract degeneration after stroke. J Neurol Neurosurg Psychiatry. 2000;69:269–272. doi: 10.1136/jnnp.69.2.269. [DOI] [PMC free article] [PubMed] [Google Scholar]
- Wiesendanger M. Pyramidal tract function and the clinical “pyramidal syndrome”. Hum Neurobiol. 1984;2:227–234. [PubMed] [Google Scholar]
- Wieshmann UC, Clark CA, Symms MR, Franconi F, Barker GJ, Shorvon SD. Anisotropy of water diffusion in corona radiata and cerebral peduncle in patients with hemiparesis. Neuroimage. 1999;10:225–230. doi: 10.1006/nimg.1999.0456. [DOI] [PubMed] [Google Scholar]
- Yamada K, Ito H, Nakamura H, Kizu O, Akada W, Kubota T, Goto M, Konishi J, Yoshikawa K, Shiga K, Nakagawa M, Mori S, Nishimura T. Stroke patients’ evolving symptoms assessed by tractography. J Magn Reson Imaging. 2004;20:923–929. doi: 10.1002/jmri.20215. [DOI] [PubMed] [Google Scholar]
- Yang Q, Tress BM, Barber PA, Desmond PM, Darby DG, Gerraty RP, Li T, Davis SM. Serial study of apparent diffusion coefficient and anisotropy in patients with acute stroke. Stroke. 1999;30:2382–2390. doi: 10.1161/01.str.30.11.2382. [DOI] [PubMed] [Google Scholar]
- Yousry TA, Schmid UD, Alkadhi H, Schmidt D, Peraud A, Buettner A, Winkler P. Localization of the motor hand area to a knob on the precentral gyrus. A new landmark. Brain. 1997;120:141–157. doi: 10.1093/brain/120.1.141. [DOI] [PubMed] [Google Scholar]
- Zemke AC, Heagerty PJ, Lee C, Cramer SC. Motor cortex organization after stroke is related to side of stroke and level of recovery. Stroke. 2003;34:e23–28. doi: 10.1161/01.STR.0000065827.35634.5E. [DOI] [PubMed] [Google Scholar]
Associated Data
This section collects any data citations, data availability statements, or supplementary materials included in this article.
Supplementary Materials
Supplementary Material. Localization of infarct relative to reconstructed CST fibers in the chronic stroke patients. Images are the axial slice with no diffusion weighting that shows the closest spatial relationship between the region of signal hyperintensity (arrow) and the reconstructed ipsilesional CST fibers (red). Patient numbers correspond with those in Table 1. Axial images from Patients #3 and 4 have been tilted to better visualize the infarct-tract proximity. The reconstructed fibers seen in the contralesional hemisphere of the image from Patients #9 are extensions of the reconstructed ipsilesional CST fibers.