

Abstract
Adenosine Deaminases that act on RNA (ADARs) edit gene transcripts through site-specific conversion of adenosine to inosine by hydrolytic deamination at C6 of the adenosine. ADAR2 gene transcripts are substrates for the ADAR1 and ADAR2 enzymes and their expression is regulated by editing at the − 1 and − 2 sites. Our previous experiments demonstrated up-regulation of type I interferon (IFN) inducible 150 kDa ADAR1 in systemic lupus erythematosus (SLE) T cells. In this study we investigate the role of ADAR1 and ADAR2 in editing of ADAR2 gene transcripts of healthy controls and SLE patients. The ADAR2 gene transcripts were cloned into pCR2.1-TOPO vectors. A total of 150 clones from SLE and 150 clones from controls were sequenced. Sequence analysis demonstrated A to I editing at − 1, + 10, + 23 and + 24 in normal T cells. In SLE clones site-selective editing of the − 2 site was observed as a result of type I IFN-inducible 150 kDa ADAR1 expression. These results are confirmed by analysing ADAR2 transcripts of normal T cells activated with type I IFN-α. Editing of the + 23 and + 24 sites was decreased in SLE T cells compared to normal controls. In addition to A to G changes, U to C discrepancies were observed in normal and SLE T cells. In SLE cells, positions − 6 and + 30 were frequently edited from U to C compared to normal controls. Taken together, these results demonstrate altered and site-selective editing in ADAR2 transcripts of SLE patients. Based on these results, it is proposed that altered transcript editing contributes to the modulation of gene expression and immune functions in SLE patients.
Keywords: cloning, deamination, gene transcripts, RNA editing, systemic lupus erythematosus, transcript mutations
Introduction
Systemic lupus erythematosus (SLE) is an autoimmune disorder of indeterminate aetiology characterized by B-lymphocyte and T-lymphocyte immune effector dysfunctions.1 The aetiopathogenesis of the abnormal immune response in SLE remains incompletely understood. T lymphocytes are pivotal cells that regulate immune effector functions and play a major role in antibody production by B-lymphocytes. Systemic lupus erythematosus is characterized by the presence of autoantibodies to a wide variety of self antigens and circulating immune complexes. Its clinical manifestations range from a benign skin disorder to severe, life-threatening, multi-system disease. During the recent past considerable evidence has been accumulated on the cellular immune defects associated with lupus pathogenesis.2 Hormonal, genetic, dietary, environmental and infectious risk factors are involved in the aetiology of SLE.3–5 The prevalence of SLE in the USA ranges from 20 to 60 per 100 000 persons. The average annual incidence of SLE in the USA approximates two to eight cases per 100 000 persons per year.3 The disease predominantly afflicts females in the child-bearing years about six-fold to 10-fold more frequently than males. Both the prevalence and incidence of the disease are three-fold greater among African-Americans than American-Caucasians. SLE is characterized by diverse T-cell immune effector dysfunctions during both active and inactive disease.1 These disordered T-cell functions include (1) impaired T-cell proliferation by antigen or mitogen; (2) diminished antibody-mediated and cell-mediated cytotoxicity; (3) altered suppressor and/or helper T-cell functions; and (4) dysregulated production of cytokines. These diverse T-cell dysfunctions are associated with abnormal expression of several gene products.6,7
The term RNA editing encompasses a wide range of activities that lead to the specific alteration of the primary sequence of an RNA molecule and play an important role in increasing the flexibility of eukaryotic gene expression.8 RNA editing is the cotranscriptional or post-transcriptional modification of RNA that results in the insertion, deletion or substitution of nucleotides. RNA editing can therefore correct, extend or diversify the information encoded within the corresponding genomic sequence, and frequently can alter the function of the affected RNAs. Therefore, RNA editing plays an important role in the regulation of gene expression and produces phenotypic variability.9,10
Our previous research has revealed aberrant gene expression and signal transduction in SLE T cells. In seeking to elucidate the mechanism of this deregulation, we recently discovered mRNA transcript editing and up-regulation of the RNA editing gene 150 kDa ADAR1 (Adenosine Deaminases that act on RNA), in SLE T lymphocytes.11 Studies by other investigators revealed similar findings.12,13 Constitutive expression of interferons (IFNs) was observed in SLE patients.14 The expression and up-regulation of several type I IFN-regulated genes are associated with SLE pathogenesis and its severity and magnitude.12,15,16 Type I IFNs play a major role in the onset of SLE pathogenesis.17 Also, IFNs induce the up-regulation of the 150 kDa ADAR1 RNA editing enzyme and APOBEC3G gene expression as well as transcript mutations in lupus T cells, peripheral blood mononuclear cells, natural killer cells, B cells and hepatocytes.11–13,18–20 Based on these findings it is hypothesized that the over-expression of ADAR1 in response to type I IFNs is a mechanism for abnormal regulation of genes and contributes to the immunopathogenesis of SLE. ADAR2 gene transcripts are substrates for the enzymes ADAR1 and ADAR2 and their expression is regulated by editing at the intronic − 2, − 1 sites.21 Therefore, in this study we investigate (1) the role of type I IFN-inducible ADAR1 p150 in the editing of ADAR2 gene transcripts and (2) the occurrence of editing in ADAR2 transcripts from normal and SLE patients.
Materials and methods
Patient and control populations
Systemic lupus erythematosus and control T-cell specimens were obtained from the Lupus Clinic at Wake Forest University Baptist Medical Center using the institute's Institutional Review Board (IRB) approval. All enrolled patients had physician-identified SLE and met the American College of Rheumatology criteria for the classification of SLE. The systemic lupus erythematosus disease activity index (SLEDAI) of the SLE patients was analysed using standard published procedure and ranged between 4 and 12.22 All patients with active SLE were receiving treatment with prednisone and/or an immunosuppressive agent. Patients with moderately active SLE were on maintenance therapy with a non-steroidal anti-inflammatory drug (NSAID), hydroxychloroquine, an immunosuppressive agent and/or prednisone. Patients were scheduled to have their blood drawn 24 hr after their last dose of prednisone, but could still be taking NSAID. The duration of their disease ranged between 3 and 27 years. All SLE patients were positive for antinuclear antibodies. Normal subjects who were not on any medication and who were matched for age and race were used as controls. The ages of the SLE patients and controls ranged between 25 and 60 years. None of the SLE patients were hospitalized at the time of blood being taken.
T-lymphocyte isolation and phenotypic characterization
T lymphocytes from healthy control subjects and from SLE patients were purified from peripheral blood mononuclear cells and characterized as previously described.11 The purity of the isolated T cells ranged from 91 to 98%. Fresh, quiescent T cells that had not been exposed to any activators or inhibitors were utilized in these experiments.
Isolation of genomic DNA, RNA and cDNA synthesis
Genomic DNA and total cellular RNA were extracted from 10 × 106 T lymphocytes of normal subjects and SLE patients as described elsewhere.11 Single-stranded complementary DNA (sscDNA) was synthesized from 1 to 2 μg total RNA by using random primer (Pharmacia, Piscataway, NJ) and Moloney murine leukaemia virus H– reverse transcriptase according to the manufacturer's instructions (Gibco BRL, Gaithersburg, MD).
Oligonucleotide primers for polymerase chain reaction amplification
Oligonucleotide primers for ADAR2 were designed based on published sequences21 using the Oligomer version 5·0 program (Molecular Biology Insights, Cascade, CO) and were synthesized by Sigma Genosys (Woodlands, TX).
Amplification of ADAR2 cDNA and genomic DNA
ADAR2 cDNA and genomic DNA was amplified by using the following primer set as described earlier:21 forward primer 5′-GGA ATT CTA TTA GTC ACT AAG CAA AGT GTC AG-3′; and reverse primer 5′- GCG GTA CCC AGG TGT GCT GCC ATC CTT GG-3′. RNA replaced the cDNA in negative control polymerase chain reaction (PCR) tubes to rule out the contamination of DNA in cDNA samples. The cDNA and genomic DNA samples from control and SLE groups were amplified as follows. Each reaction mixture consisted of 10% of a single sscDNA reaction, 25 pmol of each primer, 1× PCR buffer [10 mm Tris–HCl (pH 8·3), 50 mm KCl], 2·5 mm MgCl2, 200 μm of each dNTP, 1·25 units of Taq polymerase (Perkin-Elmer-Cetus, Emeryville, CA) and double-distilled water to a final volume of 50 μl. The reaction mixture was subjected to 30 cycles of denaturation (94° for 1 min), primer annealing (57° for 1 min), and extension for 2 min at 72° plus 2 seconds added for each cycle utilizing a DNA Thermal Cycler (Perkin-Elmer-Cetus, Emeryville, CA). Ten microlitres of reaction mixture was then analysed on a 2% agarose gel in Tris–HCl/acetate/ethylenediaminetetraacetic acid (TAE) buffer. One microgram of HaeIII-digested øx174 DNA (Gibco BRL) was utilized as molecular weight markers: 1353, 1078, 872, 603, 310 and 234 base pairs (bp). PCR products were purified using the Wizard Plus purification system (Promega, Madison, WI). Specific gene amplification was confirmed by sequencing the PCR products using an ABI Prism 377 automatic DNA sequencer (Applied Biosystems, Foster City, CA).
Construction of ADAR2 gene MIMICs for ADAR2 competitive PCR
λDNA (Promega) was used to construct ADAR2 gene-specific MIMICs, as previously described.11 Composite primers containing ADAR2 gene-specific sequences in addition to 20 nucleotides that hybridize to neutral DNA fragments were designed using the Oligomer Version 6·0 program (Molecular Biology Insights, Cascade, CO). ADAR2 gene-specific MIMICs were generated using composite and ADAR2 gene-specific primers in PCR amplification of neutral λDNA fragments, as described earlier.11 The size of the ADAR2 MIMICs was adjusted to 336 bp by choosing appropriate sequences along the neutral DNA fragment as the primer template to distinguish ADAR2 PCR products of 291 bp length. This yielded neutral DNA fragments with ADAR2 gene-specific sequences incorporated at the ends and designated as ADAR2 MIMICs. Previously constructed ADAR1p150 MIMICs were used in this study.11
Quantification of ADAR1 and ADAR2 transcripts by competitive PCR in SLE and control T cells
Two-fold dilutions of ADAR1 and ADAR2 MIMICs were added into the PCR reaction tubes containing equal amounts of cDNA samples (5% of sscDNA synthesized from 1 μg total cellular RNA from SLE and normal T cells) and amplified as described earlier.11 Because MIMICs and ADAR1 and ADAR2 gene-specific PCR products have different base-pair lengths, amplified ADAR1 and ADAR2 gene transcripts and their respective MIMICs were distinguished by electrophoresis on a 2% agarose gel and staining with ethidium bromide. The amounts of ADAR1 and ADAR2 gene transcripts were estimated by comparison with different concentrations of a known standard (MIMIC) and by identifying the standard, which matched the gene product.
Editing of ADAR2 gene transcripts in normal T cells activated with type I IFN-α
The T cells were treated with 1000 units IFN-α for 0–48 hr. The expression of the 150 kDa ADAR1 was 2·8-fold higher at the 48-hr time-point in IFN-treated cells compared to controls. The cDNA was synthesized from RNA extracted from activated and control T cells and amplified by PCR using primer sets designed for ADAR2. The ADAR2 transcripts were sub-cloned and sequenced.
Cloning and sequencing of ADAR2 cDNA
The amplified cDNA products of ADAR2 from the control, IFN-α-treated and SLE groups were subcloned and sequenced as follows. The PCR products were t-tailed with Taq polymerase and ligated into pCR2.1-TOPO plasmid following the manufacturer's instructions (Invitrogen, Carlsbad, CA), and recombinant clones were sequenced using T7, M13 primers and an ABI-377 sequencer (Applied Biosystems). Genomic DNA samples from T cells of control and SLE patients were amplified using the primer sets used for cDNA amplification as described earlier and sequenced.
Data analysis and statistical methods
Statistical significance (P = 0·05) was calculated by the paired Student's t-test. Means ± standard deviations (SD) are used throughout the text.
Results
T lymphocytes from 10 SLE subjects and 10 healthy controls were analysed in this study. ADAR1 p150 and ADAR2 gene transcripts in SLE and control T cells were quantified by competitive PCR as described in the Materials and methods. The concentrations of 150 kDa ADAR1 and ADAR2 gene transcripts were calculated in attomoles per μg total RNA. The concentration of ADAR1 transcripts ranged between 0·08 and 0·47 attomol/μg with a mean value of 0·22 ± 0·13 attomol/μg of total RNA in SLE T cells. It ranged between 0·19 and 0·156 attomol/μg with a mean value of 0·064 ± 0·039 attomol/μg total RNA in controls (P = 0·002; Table 1). The concentration of ADAR2 transcripts ranged between 0·4 and 1·6 attomol/μg with a mean of 1·16 ± 0·51 attomol/μg total RNA in SLE and between 0·8 and 1·6 attomol/μg with a mean of 1·2 ± 0·13 attomol/μg total RNA in controls (P = 0·85; see Table 1). These results revealed that the ratio of ADAR1 mRNA to ADAR2 mRNA in normal T cells is 1 : 18. In SLE T cells, we observed about a threefold increase in ADAR1 mRNA content (see Table 1). This increase of ADAR1 mRNA content in SLE T cells resulted in a decrease in the ratio of ADAR1 to ADAR2 mRNA to 1 : 5·3 (see Table 1). The increase in the ADAR1 gene expression in SLE T cells suggests the regulation of ADAR1 by type I IFNs. No significant change in ADAR2 gene expression was observed in SLE compared to normal controls.
Table 1.
Concentrations of ADAR1 p150 and ADAR2 transcripts in control and SLE T cells
| Sample | ADAR1 (attomol/μg total RNA) | ADAR2 (attomol/μg total RNA) |
|---|---|---|
| Control 1 | 0·156 | 1·6 |
| Control 2 | 0·078 | 0·8 |
| Control 3 | 0·039 | 1·6 |
| Control 4 | 0·039 | 0·8 |
| Control 5 | 0·078 | 0·8 |
| Control 6 | 0·039 | 1·6 |
| Control 7 | 0·078 | 0·8 |
| Control 8 | 0·078 | 1·6 |
| Control 9 | 0·019 | 0·8 |
| Control 10 | 0·039 | 1·6 |
| Mean | 0·064 ± 0. 04 | 1·2 ± 0. 42 |
| ADAR1 p150 : ADAR2 | 1 : 18·8 | |
| SLE 1 | 0·234 | 1·6 |
| SLE 2 | 0·315 | 0·8 |
| SLE 3 | 0·315 | 1·6 |
| SLE 4 | 0·078 | 0·8 |
| SLE 5 | 0·315 | 1·6 |
| SLE 6 | 0·078 | 1·2 |
| SLE 7 | 0·156 | 0·4 |
| SLE 8 | 0·156 | 0·4 |
| SLE 9 | 0·471 | 1·6 |
| SLE 10 | 0·156 | 1·6 |
| Mean | 0·22 ± 0·13 | 1·16 ± 0. 51 |
| ADAR1 p150 : ADAR2 | 1 : 5·3 |
Editing of the ADAR2 pre-mRNA in T lymphocytes of controls and SLE patients
The cDNA was synthesized from total RNA extracted from T cells of 10 SLE patients and 10 age-matched controls. ADAR2-specific amplicons were generated by PCR using specific primers designed for the intron 2 of ADAR2 pre-mRNA.21 The amplified region of the ADAR2 transcript contains five A to I editing sites, which are designated as − 1, − 2, + 10, + 23, + 24 (Fig. 1). Both ADAR1 and ADAR2 enzymes edit ADAR2 gene transcripts at these sites.21,24 A to I editing of the − 1 site leads to alternative splicing of the ADAR2 pre-mRNA, which in turn results in a non functional enzyme.21–24ADAR2 transcript editing has been used as a specific marker for assessing ADAR enzyme activity. The cDNA strands from normal and SLE patient samples were subcloned into TA cloning vectors (pCR2.1) and a total of 150 recombinant clones from controls as well as 150 clones from SLE patients were sequenced and analysed (Tables 2 and 3). Adenosine (A) to guanosine (G) and uridine (U) to cytosine (C) discrepancies were often seen at selective sites. A to G and U to C discrepancies were observed in the control and SLE T cells with altered frequencies. In some clones multiple sites were edited.
Figure 1.

ADAR2 transcript editing observed in the T cells of the SLE patients. ADAR2 gene transcripts of the normal and SLE patients were amplified and cloned into TA cloning vectors (pCR2.1) and sequenced using an automated DNA sequencer. Figure represents normal sequence and the normal counterparts of A to G mutated bases at the − 16, − 2, − 1, + 10, + 13, + 23 and + 24 positions in different clones are boxed (yellow) and indicated by dots. Edited thymidines are indicated in purple boxes.
Table 2.
A to I editing at specific sites of ADAR2 pre-mRNA of control and SLE patients T cells
| Edited sites with number of editing events | ||||||
|---|---|---|---|---|---|---|
| Sample | − 2 | − 1 | + 10 | + 23 | + 24 | Others1 |
| Control 1 | 0 | 0 | 1 | 1 | 0 | 0 |
| Control 2 | 0 | 1 | 1 | 0 | 0 | 0 |
| Control 3 | 0 | 0 | 0 | 1 | 0 | 0 |
| Control 4 | 0 | 1 | 1 | 0 | 0 | 0 |
| Control 5 | 0 | 0 | 1 | 0 | 0 | 0 |
| Control 6 | 0 | 1 | 0 | 1 | 1 | 0 |
| Control 7 | 0 | 1 | 0 | 1 | 1 | 0 |
| Control 8 | 0 | 1 | 1 | 1 | 1 | 0 |
| Control 9 | 0 | 1 | 0 | 0 | 1 | 0 |
| Control 10 | 0 | 0 | 0 | 1 | 1 | 0 |
| Total | 0 | 6 (4. 0) | 5 (3·3) | 6 (4·0) | 5(3·3) | 0 |
| SLE 1 | 0 | 0 | 1 | 1 | 0 | 0 |
| SLE 2 | 0 | 0 | 0 | 0 | 0 | 1 |
| SLE 3 | 1 | 1 | 1 | 1 | 0 | 0 |
| SLE 4 | 0 | 0 | 1 | 0 | 0 | 1 |
| SLE 5 | 0 | 1 | 1 | 0 | 0 | 2 |
| SLE 6 | 1 | 0 | 1 | 0 | 0 | 0 |
| SLE 7 | 1 | 0 | 1 | 1 | 0 | 1 |
| SLE 8 | 0 | 0 | 1 | 0 | 0 | 0 |
| SLE 9 | 0 | 1 | 1 | 1 | 0 | 1 |
| SLE 10 | 1 | 1 | 1 | 0 | 0 | 1 |
| Total | 4 (2·7) | 4 (2·7) | 9 (6·0) | 4 (2·7) | 0 | 7 (4·6) |
Fifteen clones were analysed for each sample, giving a total of 150 clones each series.
Percentage of editing at each site is indicated in parenthesis.
Sites − 56, − 16, + 13 and + 81.
Table 3.
U to C editing at specific sites of ADAR2 pre-mRNA of control and SLE patients T cells
| Edited sites with number of editing events | |||||
|---|---|---|---|---|---|
| Sample | − 6 | + 19 | + 30 | + 32 | Others1 |
| Control 1 | 0 | 0 | 1 | 0 | 0 |
| Control 2 | 1 | 0 | 0 | 0 | 0 |
| Control 3 | 0 | 0 | 0 | 0 | 0 |
| Control 4 | 0 | 0 | 0 | 0 | 0 |
| Control 5 | 0 | 0 | 0 | 0 | 0 |
| Control 6 | 0 | 0 | 0 | 0 | 0 |
| Control 7 | 0 | 0 | 0 | 0 | 1 |
| Control 8 | 0 | 0 | 0 | 0 | 1 |
| Control 9 | 0 | 0 | 0 | 0 | 0 |
| Control 10 | 0 | 0 | 0 | 0 | 1 |
| Total | 1 (0·7) | 0 | 1 (0·7) | 0 | 3 (2·0) |
| SLE 1 | 1 | 0 | 1 | 0 | 0 |
| SLE 2 | 1 | 0 | 1 | 0 | 0 |
| SLE 3 | 0 | 0 | 1 | 0 | 2 |
| SLE 4 | 1 | 1 | 1 | 0 | 1 |
| SLE 5 | 0 | 0 | 1 | 0 | 1 |
| SLE 6 | 1 | 0 | 0 | 0 | 2 |
| SLE 7 | 0 | 0 | 1 | 0 | 0 |
| SLE 8 | 1 | 0 | 0 | 0 | 1 |
| SLE 9 | 0 | 1 | 0 | 1 | 1 |
| SLE 10 | 0 | 1 | 0 | 1 | 2 |
| Total | 5 (3·3) | 3 (2·0) | 6 (4.·0) | 2 (1·3) | 10 (6·6) |
Fifteen clones were analysed for each sample, giving a total of 150 clones each series.
Percentage of editing at each site is indicated in parenthesis.
Sites − 134, − 117, − 50, − 43, − 14, + 3, + 33, + 64.
Site-selective editing of ADAR2 pre-mRNA in normal and SLE T lymphocytes
Sequence analyses revealed A to I editing at − 1, − 16, + 10, + 23 and + 24 positions in normal T cells with editing frequencies between 3·3 and 5% in SLE T lymphocytes. Additionally, positions − 56, − 19, + 13 and + 81 were also edited with a frequency of A to I editing ranging between 2·7 and 6%. Sites more frequently edited in SLE than in control T cells were − 2 (P = 0·02) and + 10 (P = 0·03). The − 1 site is edited to almost the same extent in normal and SLE samples with a statistically insignificant difference (P = 0·20) (see Table 2 and Figs 2 and 3). Previous studies indicate that this site is predominantly edited by ADAR2, whereas ADAR1 targets the − 2 site24 more selectively. In this study the − 2 site was found to be edited exclusively in SLE samples. These results are in agreement with the observed type I IFN-induced ADAR1 expression. ADAR2 has more affinity for editing site + 23 and both ADAR1 and ADAR2 target the + 24 site equally well.23 Editing of the + 24 site was impaired in SLE T cells compared to normal controls (P = 0·007) and in some SLE samples it was below the detection limit. A to I editing at other sites in ADAR2 intron 2 was seen exclusively in SLE samples (P = 0·005) (Figs 2, 3 and 7). A similar pattern was observed in normal T cells activated with type I IFNs (Table 4). These altered editing patterns may be the result of altered expression of ADAR1 and ADAR2 in SLE and type I IFN-activated normal T cells.
Figure 2.

A to G editing observed in ADAR2 gene transcript from the T cells of the SLE patients. Panels (a) (c) (f) and (i) represent normal sequence. Normal counterparts of A to G mutated bases at the − 16, − 2, − 1, + 10, + 13, + 23 and + 24 positions in different clones are indicated by dots. Panels (b) (d) (e) (g) (h) and (j) demonstrates edited bases at the − 16, − 2, − 1, + 10, + 13, + 23 and + 24 positions, respectively, in different clones. All edited bases are indicated by arrows (↑). All sequences represent sense strands.
Figure 3.

The graph represents A to I editing frequencies observed at site − 2, − 1, + 10, + 23, + 24 and other base positions of ADAR2 gene transcripts from normal and SLE T lymphocytes. The P-values are indicated at appropriate places.
Figure 7.

Predicted secondary structure of human ADAR2 pre-mRNA with editing events. The nucleotide sequence is shown with its secondary structure as predicted by mfold. The positions of observed A to G transitions (filled arrow heads) as well as observed U to C transitions (open arrow head) are indicated. The site co-ordinates are relative to the 3′-splice junction that is known to be created through A to I editing.21,24
Table 4.
A to I editing at specific sites of ADAR2 pre-mRNA of control and IFN-activated normal T cells
| Edited sites with number of editing events | |||||||
|---|---|---|---|---|---|---|---|
| Sample | Total no. of clones analysed | − 2 | − 1 | + 10 | + 23 | + 24 | Others1 |
| Control 1 | 35 | 0 | 0 | 1 | 1 | 0 | 0 |
| Control 2 | 35 | 1 | 1 | 2 | 0 | 0 | 1 |
| Control 3 | 30 | 0 | 2 | 1 | 1 | 1 | 0 |
| Total | 100 | 1 | 3 | 4 | 2 | 1 | 2 |
| IFN | 35 | 2 | 0 | 1 | 0 | 0 | 2 |
| IFN | 35 | 2 | 1 | 2 | 0 | 1 | 3 |
| IFN | 30 | 1 | 1 | 0 | 0 | 0 | 2 |
| Total | 100 | 5 | 2 | 3 | 0 | 1 | 7 |
Sites − 48, − 45, − 27, − 15, + 2 and + 69.
U to C editing in ADAR2 pre-mRNA in SLE T lymphocytes
In addition to A to G discrepancies, U to C changes were also seen in ADAR2 transcripts of normal and SLE T cells (Figs 4 and 5). Sequence analysis demonstrated U to C changes at − 6 and + 30 in normal T cells with frequencies ranging between 0·7 and 1·4%. In SLE T cells U to C changes were observed at positions − 6, + 19, + 30 and + 32 with frequencies between 1·3 and 4·0%. Sites − 6 (P = 0·03) and + 30 (P = 0·01) were more frequently edited in SLE over normal T cells. In addition, novel editing events were identified in SLE T lymphocytes at positions − 134, − 117, − 50, − 43, − 14, + 3 and + 64. The frequency of U to C alterations in the ADAR2 transcripts of SLE T cells was increased about three-fold over that in control cells (P = 0·017) (Table 3 and Figs 5–7).
Figure 4.

ADAR2 transcript editing observed in the T cells of the SLE patients. Figure represents normal sequence and the normal counterparts of T to C mutated bases at the − 14, − 6, + 19 and + 30 positions in different clones are boxed (yellow) and indicated with dots. Edited adenosines are indicated in purple boxes.
Figure 5.
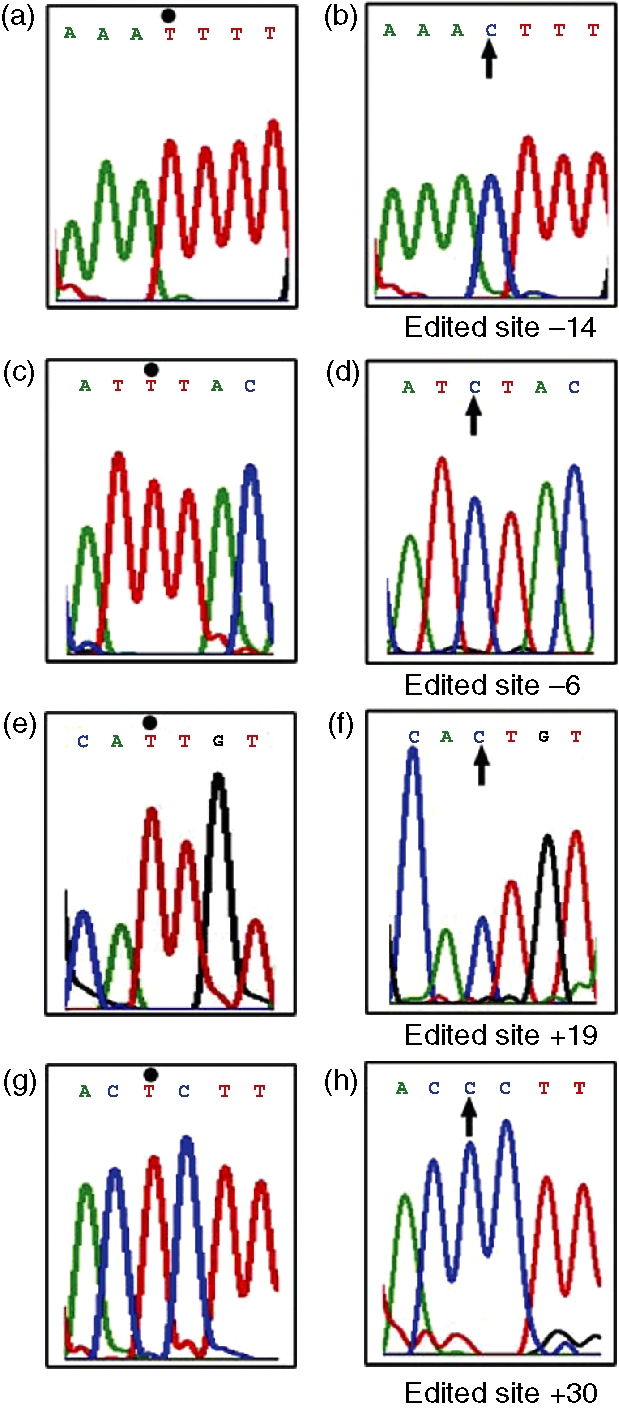
T to C editing observed in ADAR2 gene transcript from the T cells of the SLE patients. Panels (a) (c) (e) and (g) represent normal sequence. Normal counterparts of T to C mutated bases at the − 14, − 6, + 19 and + 30 positions in different clones are indicated by dots. Panels (b) (d) (f) and (h) demonstrate edited bases at the − 14, − 6, + 19 and + 30 positions, respectively, in different clones. All edited bases are indicated by arrows (↑). All sequences represent sense strands.
Figure 6.

The graph represents U to C editing frequencies observed at site − 6, + 19, + 30, + 32 and other base positions of ADAR2 gene transcripts from normal and SLE T lymphocytes. The P-values are indicated at appropriate places.
Deletion of an A to I editing site and U deletion in homopolymeric runs
At a low frequency the deletion of an adenosine was observed affecting the + 23 or + 24 A to I editing sites in the ADAR2 gene transcripts of SLE T lymphocytes. U deletions in homopolymeric runs were also observed in SLE samples, but no G or C deletions. It is possible that some of these deletions are the result of errors during reverse transcriptions caused by edited bases in the transcript
G to A editing in ADAR2 pre-mRNA in SLE T lymphocytes
In addition to A to G and U to C discrepancies, G to A alterations were seen with a frequency of 2·7% in the SLE T cells in two out of 10 patients at position + 16.
Identification of hot spots for transcript mutations in ADAR2 gene transcripts of normal and SLE T lymphocytes
Seventy-five per cent of A to G discrepancies observed in these studies were clustered in the region between nucleotides − 28 and + 30, which harbours previously known editing sites and constitutes a well-documented ADAR target.21–24 Fifty-six per cent of all observed U to C transitions were also located within this region, indicating that this RNA fold-back structure is also mediating U to C base substitutions.
Absence of mutations in ADAR2 genomic DNA
None of the mutations observed in the gene transcripts of ADAR2 were seen in the genomic DNA sequences. Absence of such mutations in the ADAR2 genomic DNA sequences of control and SLE subjects indicated both that their origin was in RNA and the occurrence of transcript editing.
Editing of the ADAR2 pre-mRNA in IFN-activated and non-activated T lymphocytes of control subjects
The cDNAs synthesized from RNA extracted from three normal non-activated samples and T cells activated with type I IFN were amplified by PCR using specific primer sets designed for the ADAR2 pre-mRNA. These transcripts were cloned into pCR2.1-TOPO vectors and analysed for transcript editing. One hundred clones from the control series and 100 clones from activated T cells were sequenced and analysed (Table 4). Sequence analyses demonstrated A to I editing at − 2, − 1, + 10, + 23 and + 24 positions in both normal and activated T cells with editing frequencies between 1 and 5%. Additionally, positions − 48, − 45, − 27, − 15, + 2 and + 69 were also edited and accounted for 2 and 7% in non-activated and activated series, respectively. The − 2 site was more frequently edited in activated cells compared to control T cells (P = 0·037) while the − 1 site was edited to almost the same extent in normal and activated samples with a statistically insignificant difference (P = 0·325) (see Table 4). Previous studies indicate that this site is predominantly edited by ADAR2, whereas ADAR1 targets the − 2 site24 more selectively. In this study the − 2 site was found to be edited more frequently in activated samples. These results are in agreement with the observed type I IFN-induced ADAR1 p150 expression in control samples and up-regulated ADAR1 in SLE subjects. ADAR2 has a higher affinity for editing site + 23 and both ADAR1 and ADAR2 target the + 2424 site equally well. Editing of the + 23 site was absent in activated T cells compared to normal controls. A to I editing at other sites was seen more frequently in SLE samples (P = 0·006). These altered editing patterns in type I IFN-activated normal T cells may be partially the result of the altered expression of ADAR1p150 and ADAR2.
Discussion
Systemic lupus erythematosus is an idiopathic autoimmune disorder with multiple immune effector dysfunctions. These diverse immune dysfunctions raised the possibility that a disorder primary to the T cell exists in SLE. These diverse T-cell dysfunctions are associated with abnormal expression of several gene products. The ADARs catalyse the covalent modification of dsRNA by hydrolytic C6 deamination of adenosine to yield inosine.10 Recently, two iosforms of the ADAR gene were identified but their selective functions are unknown.25,26 The inosine generated by the RNA editing process is typically recognized as guanine during cDNA synthesis.10 The occurrence of adenosine deamination in vivo has been reported in various organisms, ranging from viruses to mammals.10 Messenger RNA editing induced by ADARs and other editing enzymes plays an important role in the regulation of gene expression.27,28 A widespread occurrence of A to I editing of Alu-containing and intronic regions of pre-mRNAs in the human transcriptome has been identified recently.29–31 The effect of RNA editing and transcript mutations in disease pathogenesis is only now beginning to be explored and is therefore not well understood. However, altered RNA editing of gene transcripts has been observed in some pathological conditions.32–38 Therefore, studies in this direction might have profound implications and wider importance for understanding the aetiology of human diseases. In addition to the presence of structurally diverse ADAR enzymes,39,40 editosome, helicases and small nucleolar RNAs will also play a major role in the regulation of A to I editing.41,42 Several cellular factors have recently been implicated in regulating intracellular editing activity by ADARs. For example, it was shown that modification of ADARs by Small Ubiquitin Modifier (SUMO) reduces their enzyme activity43 and the requirement of inositol hexakisphosphate (IP6) for ADAR2 enzyme activity in general.44 These findings provide possible scenarios for how editing levels at particular sites in the ADAR2 gene transcripts may be modulated in SLE T cells.
In general, the nature of the transcript mutations observed in the present study differs from somatic hypermutations and the lack of such base changes in genomic DNA argues against their occurrence as a result of somatic hypermutation. Instead, it gives credible evidence to a co- or post-transcriptional modification mechanism affecting ADAR2 gene transcripts in normal and SLE T cells.
Although the mechanism for the occurrence of novel editing at specific sites and the decrease of editing at known sites exclusively in ADAR2 gene transcripts of SLE T cells and IFN-activated normal T cells remains to be established, one hypothesis is that high circulating levels of IFN-α in SLE14 up-regulate steady-state ADAR1 p150 transcript levels leading to increased enzymatic activity. This might then result in ADAR-catalysed A to I transcript editing at novel editing sites in ADAR2 gene transcripts in SLE T cells. Indeed, ADAR1 p150 mRNA content is significantly increased in SLE T cells (see Table 2). These results are confirmed by analysing ADAR2 transcripts of normal T cells activated with type I IFN-α (see Table 4). Interestingly, a recent analysis of ADAR2-overproducing mice showed an increase in the editing of ADAR2-selective editing targets and a decrease of ADAR1-selective editing at specific sites.45 A second possibility is the formation of ADAR1 and ADAR2 heterodimers,46 which might have more affinity for the observed novel edited sites, which in turn might have resulted in decreased editing at known sites in SLE T cells and IFN-treated normal T cells. Identification of such editing sites in other gene transcripts and their impact on edited gene function will help in assessing the mechanism(s) involved in the induction of SLE pathogenesis.
A low frequency of G to A changes at position + 16 was observed only in SLE T cells in the present study. Potential G to A editing has previously been reported in GluR7 receptor transcripts in human brain48 and also in gene transcripts of an RNA-binding protein, the heterogeneous nuclear ribonucleoprotein K (hnRNP K), in colorectal adenocarcinoma49 and in the transcripts of the transcription repressor, PR domain zinc finger protein 1 (PRDM1) in diffuse large B-cell lymphomas.50 Frequent occurrence of G to A alterations has been reported in human immunodeficiency virus type 1 mRNAs in H9 cells.38 The enzymatic machinery responsible for such editing and the molecular mechanism underlying such G to A changes are unknown. A novel enzyme may be responsible for the amination of GTP, which might result in the conversion of guanosine to 2,6-diaminopurine, which might base-pair like an adenosine.50 Another mechanism that has been proposed to account for transcript mutations is a defective RNA polymerase.51 Although the precise mechanisms responsible for molecular misreading by defective RNA polymerase have not yet been identified, the phenomenon has been well documented in bacteria and humans.52–55 A third possible mechanism may be transglycosylation by which a guanosine is replaced by adenosine.
U to C editing is well established in plants and has also been documented in gene transcripts of animals and humans.56–58 In the present study U to C changes were observed in ADAR2 transcripts of normal and SLE T-cell samples. The − 6 and + 30 sites are frequently edited in SLE compared to normal controls (Table 3). In general, U to C editing is about three-fold higher in SLE T cells. As for U to C alterations, the enzymes responsible for such base modifications as well as the underlying mechanisms are unknown. The chemical identity of the modified base within the RNA transcripts remains to be determined, because the base discrepancies observed in the present study are derived from reverse-transcribed and amplified sequences, where for example the product of A to I editing appears as guanosine in the analysis. Following molecular mechanisms could account for the observed U to C base changes; (1) amination of uracil catalysed by RNA-specific enzymes or a modification that results in a base that mimics cytosine during reverse transcription; (2) transglycosylation or nucleotide exchange.59 Further studies are warranted to answer these questions.
In general, the frequency of ADAR2 transcript editing in normal and SLE T lymphocytes is much lower than the frequencies observed in rat and human brain tissues.21,23,24 This may be the result of the presence of structurally diverse ADAR enzymes, editosome, helicases, small nucleolar RNAs and other cellular factors, which have recently been implicated in regulating intracellular editing activity by ADARs.39–44 The ADAR2 transcript region analysed here is entirely comprised of intronic sequence. It is not known what the impact of intronic editing in ADAR2 pre-mRNA may be on the expression of ADAR2 proteins in vivo. It has recently been demonstrated that hyper-edited dsRNAs can be subject to specific cleavage.60 Some of the A to G and U to C discrepancies in ADAR2 transcripts may induce cleavage of the edited transcripts or may influence their stability and this could account in part for the altered editing of ADAR2 and other gene products.
In summary, we have identified altered editing at known sites and novel editing sites in the ADAR2 gene products of normal and SLE T lymphocytes. This has been confirmed by the absence of such mutations in genomic DNA. Based on these findings, it is likely that the transcripts of other genes are also affected by the deregulation of the RNA-editing machinery. Because so far no genomic mutations have been linked to the onset of SLE pathogenesis, transcript editing and/or molecular misreading may be a novel unrecognized mechanism that contributes to SLE pathogenesis.
Acknowledgments
The authors thank our patients and control subjects for their generous contributions of blood samples. This research was supported by grants from the National Institutes of Health (RO1-AR48628 to D.L.) and the General Clinical Research Center of the Wake Forest University School of Medicine (MO1 RR07122).
Abbreviations
- ADAR
adenosine deaminases that act on RNA
- bp
base pair
- IFN
interferon
- IP6
inositol hexakisphosphate
- NSAID
non-steroidal anti-inflammatory drug
- PCR
polymerase chain reaction
- SLE
systemic lupus erythematosus
- sscDNA
single-stranded complementary DNA
- SUMO
small ubiquitin modifier
References
- 1.Kotzin BL. Systemic lupus erythematosus. Cell. 1996;85:303–6. doi: 10.1016/s0092-8674(00)81108-3. [DOI] [PubMed] [Google Scholar]
- 2.Cooper GS, Dooley MA, Treadwell EL, St Clair EW, Parks CG, Gilkeson GS. Hormonal, environmental and infectious risk factors for developing systemic lupus erythematosus. Arthritis Rheum. 1998;41:1714–24. doi: 10.1002/1529-0131(199810)41:10<1714::AID-ART3>3.0.CO;2-U. [DOI] [PubMed] [Google Scholar]
- 3.Moser KL, Neas BR, Salmon JE, et al. Genome scan of human systemic lupus erythematosus: evidence for linkage on chromosome 2q in African-American pedigrees. Proc Natl Acad Sci USA. 1998;95:14869–74. doi: 10.1073/pnas.95.25.14869. [DOI] [PMC free article] [PubMed] [Google Scholar]
- 4.Gaffney PM, Kears GM, Shark KB, et al. A genome-wide search for susceptibility genes in human systemic lupus erythematosus sib-pair families. Proc Natl Acad Sci USA. 1998;95:14875–9. doi: 10.1073/pnas.95.25.14875. [DOI] [PMC free article] [PubMed] [Google Scholar]
- 5.Gottlieb A, Lahita R, Chiorazzi N, Kunkel H. Immune function in systemic lupus erythematosus. Impairment of in vitro T cell proliferative and in vivo antibody response to exogenous antigen. J Clin Invest. 1979;63:885–92. doi: 10.1172/JCI109388. [DOI] [PMC free article] [PubMed] [Google Scholar]
- 6.Tsokos GC. Overview of cellular immune function in systemic lupus erythematosus. In: Lahita RG, editor. Systemic Lupus Erythematosus. New York: Churchill Livingstone; 1992. pp. 15–50. [Google Scholar]
- 7.Linker-Israeli M. Cytokine abnormalities in human lupus. Clin Immunol Immunopathol. 1992;63:10–12. doi: 10.1016/0090-1229(92)90084-2. [DOI] [PubMed] [Google Scholar]
- 8.Simpson L, Emeson RB. RNA editing. Ann Rev Neurosci. 1996;19:27–52. doi: 10.1146/annurev.ne.19.030196.000331. [DOI] [PubMed] [Google Scholar]
- 9.Herbert A, Rich A. RNA processing and the evolution of eukaryotes. Nat Genet. 1999;21:265–9. doi: 10.1038/6780. [DOI] [PubMed] [Google Scholar]
- 10.Bass BL. RNA editing by adenosine deaminases that act on RNA. Annu Rev Biochem. 2002;71:817–46. doi: 10.1146/annurev.biochem.71.110601.135501. [DOI] [PMC free article] [PubMed] [Google Scholar]
- 11.Laxminarayana D, Khan IU, Kammer GM. Transcript mutations of the alpha regulatory subunit of protein kinase A and up-regulation of the RNA editing gene transcripts in lupus T lymphocytes. Lancet. 2002;360:842–9. doi: 10.1016/s0140-6736(02)09966-x. [DOI] [PubMed] [Google Scholar]
- 12.Crow MK, Wohlgemuth J. Microarray analysis of gene expression in lupus. Arthritis Res Ther. 2003;5:279–87. doi: 10.1186/ar1015. [DOI] [PMC free article] [PubMed] [Google Scholar]
- 13.Toyabe S, Kaneko U, Uchiyama M. Decreased DAP12 expression in natural killer lymphocytes from patients with systemic lupus erythematosus is associated with increased transcript mutations. J Autoimmunity. 2004;23:371–8. doi: 10.1016/j.jaut.2004.09.003. [DOI] [PubMed] [Google Scholar]
- 14.Hooks JJ, Moutsopoulos HM, Geis SA, Stahl NI, Decker JL, Notkins AL. Immune interferon in the circulation of patients with autoimmune disease. N Engl J Med. 1979;301:5–8. doi: 10.1056/NEJM197907053010102. [DOI] [PubMed] [Google Scholar]
- 15.Baechler EC, Batliwalla FM, Karypis G, et al. Interferon inducible gene expression signature in peripheral blood cells of patients with severe lupus. Proc Natl Acad Sci USA. 2003;100:2610–15. doi: 10.1073/pnas.0337679100. [DOI] [PMC free article] [PubMed] [Google Scholar]
- 16.Bennett L, Palucka AK, Arce E, Cantrell V, Borvak J, Banchereau J, Pascual V. Interferon and granulopoiesis signature in systemic lupus erythematosus. blood. J Exp Med. 2003;197:711–23. doi: 10.1084/jem.20021553. [DOI] [PMC free article] [PubMed] [Google Scholar]
- 17.Rönnblom L, Alm GV. An etiopathogenic role for the type 1 IFN system in SLE. Trends Immunol. 2001;22:427–31. doi: 10.1016/s1471-4906(01)01955-x. [DOI] [PubMed] [Google Scholar]
- 18.Tanaka Y, Marusawa H, Seno H, et al. Anti-viral protein APOBEC3G is induced by interferon-alpha stimulation in human hepatocytes. Biochem Biophys Res Commun. 2006;341:314–19. doi: 10.1016/j.bbrc.2005.12.192. [DOI] [PubMed] [Google Scholar]
- 19.Peng G, Lei KJ, Jin W, Greenwell-Wild T, Wahl SM. Induction of APOBEC3 family proteins, a defensive maneuver underlying interferon-induced anti-HIV-1 activity. J Exp Med. 2006;203:41–6. doi: 10.1084/jem.20051512. [DOI] [PMC free article] [PubMed] [Google Scholar]
- 20.Kaneko U, Toyabe S, Hara M, Uchiyama M. Increased mutations of CD72 transcript in B-lymphocytes from adolescent patients with systemic lupus erythematosus. Pediatric Allergy Immunol. 2006;17:565–71. doi: 10.1111/j.1399-3038.2006.00466.x. [DOI] [PubMed] [Google Scholar]
- 21.Rueter SM, Dawson TR, Emeson RB. Regulation of alternative splicing by RNA editing. Nature. 1999;399:75–80. doi: 10.1038/19992. [DOI] [PubMed] [Google Scholar]
- 22.Bombardier C, Gladman DD, Urowitz MB, Caron D, Chang CH Committee on Prognosis Studies in SLE. Derivation of the SLEDAI. A disease activity index for lupus patients. Arthritis Rheum. 1992;35:630–40. doi: 10.1002/art.1780350606. [DOI] [PubMed] [Google Scholar]
- 23.Maas S, Patt S, Schrey M, Rich A. Under editing of glutamate receptor GluR-B mRNA in malignant gliomas. Proc Natl Acad Sci USA. 2001;98:14687–92. doi: 10.1073/pnas.251531398. [DOI] [PMC free article] [PubMed] [Google Scholar]
- 24.Dawson TR, Sansam CL, Emeson RB. Structure and sequence determinants required for the RNA editing of ADAR2 substrates. J Biol Chem. 2004;279:4941–51. doi: 10.1074/jbc.M310068200. [DOI] [PubMed] [Google Scholar]
- 25.Kim U, Wang Y, Sanford T, Zeng Y, Nishikura K. Molecular cloning of cDNA for double-stranded RNA adenosine deaminase, a candidate enzyme for nuclear RNA editing. Proc Natl Acad Sci USA. 1994;91:11457–61. doi: 10.1073/pnas.91.24.11457. [DOI] [PMC free article] [PubMed] [Google Scholar]
- 26.Melcher T, Maas S, Herb A, Sprengel R, Seeburg PH, Higuchi M. A mammalian RNA editing enzyme. Nature. 1996;379:460–4. doi: 10.1038/379460a0. [DOI] [PubMed] [Google Scholar]
- 27.Sommer B, Kohler M, Sprengel R, Seeburg PH. RNA editing in brain controls a determinant of ion flow in glutamate-gated channels. Cell. 1991;67:11–19. doi: 10.1016/0092-8674(91)90568-j. [DOI] [PubMed] [Google Scholar]
- 28.Burns CM, Chu H, Rueter SM, Hutchinson LK, Canton H, Sanders-Bush E, Emeson RB. Regulation of serotonin-2C receptor G-protein coupling by RNA editing. Nature. 1997;38:303–8. doi: 10.1038/387303a0. [DOI] [PubMed] [Google Scholar]
- 29.Levanon E, Eisenberg E, Yelin R, et al. Systematic identification of abundant A-to-I editing sites in the human transcriptome. Nat Biotechnol. 2004;22:1001–5. doi: 10.1038/nbt996. [DOI] [PubMed] [Google Scholar]
- 30.Athanasiadis A, Rich A, Maas S. Widespread A-to-I RNA editing of Alu-containing mRNAs in the human transcriptome. Plos Biol. 2004;2:1–15. doi: 10.1371/journal.pbio.0020391. [DOI] [PMC free article] [PubMed] [Google Scholar]
- 31.Kim DD, Kim TT, Walsh T, Kobayashi Y, Matise TC, Buyske S, Gabriel A. Widespread RNA editing of embedded alu elements in the human transcriptome. Genome Res. 2004;14:1719–25. doi: 10.1101/gr.2855504. [DOI] [PMC free article] [PubMed] [Google Scholar]
- 32.Gurevich I, Tamir H, Arango V, Dwork AJ, Mann JJ, Schmauss C. Altered editing of serotonin 2C receptor pre-mRNA in the prefrontal cortex of depressed suicide victims. Neuron. 2002;34:349–56. doi: 10.1016/s0896-6273(02)00660-8. [DOI] [PubMed] [Google Scholar]
- 33.Vissel B, Royle GA, Christie BR, et al. The role of RNA editing of kainate receptors in synaptic plasticity and seizures. Neuron. 2001;29:217–27. doi: 10.1016/s0896-6273(01)00192-1. [DOI] [PubMed] [Google Scholar]
- 34.Kortenbruck G, Berger E, Speckmann E-J, Musshoff U. RNA editing at the Q/R site for the glutamate receptor subunits GLUR2, GLUR5 and GLUR6 in hippocampus and temporal cortex from epileptic patients. Neurobiol Dis. 2001;8:459–68. doi: 10.1006/nbdi.2001.0394. [DOI] [PubMed] [Google Scholar]
- 35.Kawahara Y, Ito K, Sun H, Aizawa H, Kanazawa I, Kwak S. Glutamate receptors: RNA editing and death of motor neurons. Nature. 2004;427:801. doi: 10.1038/427801a. [DOI] [PubMed] [Google Scholar]
- 36.Kwak S, Kawahara Y. Deficient RNA editing of GluR2 and neuronal death in amyotropic lateral sclerosis. J Mol Med. 2005;83:110–20. doi: 10.1007/s00109-004-0599-z. [DOI] [PubMed] [Google Scholar]
- 37.Bourara K, Litvak S, Araya A. Generation of G-to-A and C-to-U changes in HIV-1 transcripts by RNA editing. Science. 2000;289:1564–6. doi: 10.1126/science.289.5484.1564. [DOI] [PubMed] [Google Scholar]
- 38.Maas S, Kawahara Y, Tamburro KM, Nishikura K. A-to-I RNA editing and human disease. RNA Biol. 2006;3:1–9. doi: 10.4161/rna.3.1.2495. [DOI] [PMC free article] [PubMed] [Google Scholar]
- 39.George CX, Wagner MV, Samuel CE. Expression of interferon-inducible RNA adenosine deaminase ADAR1 during pathogen infection and mouse embryo development involves tissue-selective promoter utilization and alternative splicing. J Biol Chem. 2005;280:15020–8. doi: 10.1074/jbc.M500476200. [DOI] [PubMed] [Google Scholar]
- 40.Kawahara Y, Ito K, Ito M, Tsuji S, Kwak S. Novel splice variants of human ADAR2 mRNA. Skipping of the exon encoding the dsRNA-binding domains, and multiple C-terminal splice sites. Gene. 2005;363:193–201. doi: 10.1016/j.gene.2005.07.028. [DOI] [PubMed] [Google Scholar]
- 41.Maas S, Rich A, Nishikura K. A-to-I RNA editing: recent news and residual mysteries. J Biol Chem. 2003;278:1391–4. doi: 10.1074/jbc.R200025200. [DOI] [PubMed] [Google Scholar]
- 42.Vitali P, Basyuk E, Le Meur E, Bertrand E, Muscatelli F, Cavaille J, Huttenhofer A. ADAR2-mediated editing of RNA substrates in the nucleolus is inhibited by C/D small nucleolar RNAs. J Cell Biol. 2005;169:745–53. doi: 10.1083/jcb.200411129. [DOI] [PMC free article] [PubMed] [Google Scholar]
- 43.Desterro JM, Keegan LP, Jaffray E, Hay RT, O'Connell MA, Carmo-Fonseca M. SUMO-1 modification alters ADAR1 editing activity. Mol Biol Cell. 2005;16:5115–26. doi: 10.1091/mbc.E05-06-0536. [DOI] [PMC free article] [PubMed] [Google Scholar]
- 44.Macbeth MR, Schubert HL, Vandemark AP, Lingam AT, Hill CP, Bass BL. Inositol hexakisphosphate is bound in the ADAR2 core and required for RNA editing. Science. 2005;309:1534–9. doi: 10.1126/science.1113150. [DOI] [PMC free article] [PubMed] [Google Scholar]
- 45.Feng Y, Sansam CL, Singh M, Emeson RB. Altered RNA editing in mice lacking ADAR2 autoregulation. Mol Cell Biol. 2006;26:480–8. doi: 10.1128/MCB.26.2.480-488.2006. [DOI] [PMC free article] [PubMed] [Google Scholar]
- 46.Chilibeck KA, Wu T, Liang C, Schellenberg MJ, Gesner EM, Lynch JM, MacMillan AM. FRET analysis of in vivo dimerization by RNA-editing enzymes. J Biol Chem. 2006;281:16530–5. doi: 10.1074/jbc.M511831200. [DOI] [PubMed] [Google Scholar]
- 47.Nutt SL, Hoo KH, Rampersad V, et al. Molecular characterization of the human EAA5 (GluR7) receptor: a high-affinity kainate receptor with novel potential RNA editing sites. Receptors Channels. 1994;2:315–26. [PubMed] [Google Scholar]
- 48.Tam W, Gomez M, Chadburn A, Lee JW, Chan WC, Knowles DM. Mutational analysis of PRDM1 indicates a tumor suppressor role in diffuse large B-cell lymphomas. Blood. 2006;107:4090–100. doi: 10.1182/blood-2005-09-3778. [DOI] [PubMed] [Google Scholar]
- 49.Klimek-Tomczak K, Mikula M, Dzwonek A, et al. Editing of hnRNP K protein mRNA in colorectal adenocarcinoma and surrounding mucosa. Br J Cancer. 2006;94:586–92. doi: 10.1038/sj.bjc.6602938. [DOI] [PMC free article] [PubMed] [Google Scholar]
- 50.Niswender CM. Recent advances in mammalian RNA editing. Cell Mol Life Sci. 1998;54:946–64. doi: 10.1007/s000180050225. [DOI] [PMC free article] [PubMed] [Google Scholar]
- 51.Huang Y, Intine RV, Mozlin A, Hasson S, Maraia RJ. Mutations in the RNA polymerase III subunit Rpc11p that decrease RNA-3′ cleavage activity increase 3′-terminal oligo (U) length and La-dependent tRNA processing. Mol Cell Biol. 2005;25:621–36. doi: 10.1128/MCB.25.2.621-636.2005. [DOI] [PMC free article] [PubMed] [Google Scholar]
- 52.Viswanathan A, You HJ, Doetsch PW. Phenotypic change caused by transcriptional bypass of Uracil in nondividing cells. Science. 1999;284:159–62. doi: 10.1126/science.284.5411.159. [DOI] [PubMed] [Google Scholar]
- 53.Bridges BA. Dirty transcripts from clean DNA. Science. 1999;284:62. doi: 10.1126/science.284.5411.62. [DOI] [PubMed] [Google Scholar]
- 54.van Leeuwen FW, Hol EM, Hermanussen WH, et al. Molecular misreading in non-neuronal cells. FASEB J. 2000;14:1595–602. doi: 10.1096/fj.14.11.1595. [DOI] [PubMed] [Google Scholar]
- 55.van Leeuwen FW, Fischer DF, Kemel D, et al. Molecular misreading: a new type of transcript mutation expressed during aging. Neurobiol Of Aging. 2000;21:879–91. doi: 10.1016/s0197-4580(00)00151-2. [DOI] [PubMed] [Google Scholar]
- 56.Schuster W, Hiesel R, Wissinger B, Brennicke A. RNA editing in the cytochrome b locus of the higher plant Oenothera berteriana includes a U-to-C transition. Mol Cell Biol. 1990;10:2428–31. doi: 10.1128/mcb.10.5.2428. [DOI] [PMC free article] [PubMed] [Google Scholar]
- 57.Sharma PM, Bowman M, Madden SL, Rauscher FJ, Sukumar S. RNA editing in the Wilms' tumor susceptibility gene, WT1. Genes Dev. 1994;8:720–31. doi: 10.1101/gad.8.6.720. [DOI] [PubMed] [Google Scholar]
- 58.Yoshinaga K, Linuma H, Masuzawa T, Uedal K. Extensive editing of U to C in addition to C to U substitution in the rbcL transcripts of hornwort chloroplasts and the origin of RNA editing in green plants. Nucl Acids Res. 1996;24:1008–14. doi: 10.1093/nar/24.6.1008. [DOI] [PMC free article] [PubMed] [Google Scholar]
- 59.Garcia GA, Kittendorf JD. Transglycosylation. A mechanism for RNA modification (and editing?) Bioorganic Chem. 2005;33:229–51. doi: 10.1016/j.bioorg.2005.01.001. [DOI] [PMC free article] [PubMed] [Google Scholar]
- 60.Scadden ADJ, Smith CJW. Specific cleavage of hyper-edited dsRNAs. EMBO J. 2001;20:4243–52. doi: 10.1093/emboj/20.15.4243. [DOI] [PMC free article] [PubMed] [Google Scholar]