

Abstract
Large-conductance Ca2+-activated K+ channels (BKCa channels) are regulated by the tissue-specific expression of auxiliary β subunits. β1 is predominately expressed in smooth muscle, where it greatly enhances the BKCa channel's Ca2+ sensitivity, an effect that is required for proper regulation of smooth muscle tone. Here, using gating current recordings, macroscopic ionic current recordings, and unitary ionic current recordings at very low open probabilities, we have investigated the mechanism that underlies this effect. Our results may be summarized as follows. The β1 subunit has little or no effect on the equilibrium constant of the conformational change by which the BKCa channel opens, and it does not affect the gating charge on the channel's voltage sensors, but it does stabilize voltage sensor activation, both when the channel is open and when it is closed, such that voltage sensor activation occurs at more negative voltages with β1 present. Furthermore, β1 stabilizes the active voltage sensor more when the channel is closed than when it is open, and this reduces the factor D by which voltage sensor activation promotes opening by ∼24% (16.8→12.8). The effects of β1 on voltage sensing enhance the BKCa channel's Ca2+ sensitivity by decreasing at most voltages the work that Ca2+ binding must do to open the channel. In addition, however, in order to fully account for the increase in efficacy and apparent Ca2+ affinity brought about by β1 at negative voltages, our studies suggest that β1 also decreases the true Ca2+ affinity of the closed channel, increasing its Ca2+ dissociation constant from ∼3.7 μM to between 4.7 and 7.1 μM, depending on how many binding sites are affected.
INTRODUCTION
Auxiliary subunits often tune ion channel behavior to the needs of a particular cell type (Isom et al., 1994; Gurnett and Campbell, 1996; Xu et al., 1998). This method of generating functional diversity is particularly well exploited by the large-conductance Ca2+-activated potassium channel, or BKCa channel, which is composed of pore-forming α and auxiliary β subunits (Knaus et al., 1994b; McManus et al., 1995). Four α subunits are sufficient to form a fully functional channel complete with Ca2+ sensitivity, voltage sensitivity, and a large single-channel conductance (Shen et al., 1994; DiChiara and Reinhart, 1995; Cui et al., 1997). There is only a single gene for this subunit (Atkinson et al., 1991; Adelman et al., 1992; Butler et al., 1993). In different tissues, however, BKCa channels display different phenotypes, and this is thought to be due primarily to the tissue-specific expression of some subset of four homologous BKCa β subunits (β1–β4) (Knaus et al., 1994a; McManus et al., 1995; Wallner et al., 1995, 1999; Meera et al., 1996, 2000; Tanaka et al., 1997; Xia et al., 1999, 2000; Behrens et al., 2000; Brenner et al., 2000a; Uebele et al., 2000; Weiger et al., 2000).
The β2 subunit, for example, confers rapid inactivation upon the BKCa channels of adrenal chromaffin cells (Wallner et al., 1999; Xia et al., 1999), and β4 renders many of the BKCa channels of the brain insensitive to the scorpion toxin charybdotoxin (Meera et al., 2000). Perhaps most profound, however, the BKCa β1 subunit, which is predominately expressed in smooth muscle, slows the BKCa channel's kinetic behavior and dramatically increases its Ca2+ sensitivity (McManus et al., 1995; Wallner et al., 1995; Meera et al., 1996; Cox and Aldrich, 2000; Nimigean and Magleby, 2000). In fact, mice that lack β1 have hypertension, because the BKCa channels of their vascular smooth muscle lack the Ca2+ sensitivity required for BKCa-mediated feedback regulation of smooth muscle contraction (Brenner et al., 2000b). Thus, β1 is important in the vascular system and indeed in many other smooth muscle–dependent systems as well (Nelson and Quayle, 1995; Snetkov and Ward, 1999; Bayguinov et al., 2001; Niu and Magleby, 2002; Meredith et al., 2004; Morales et al., 2004). Four β1 subunits associate with a single BKCa channel (Wang et al., 2002).
How β1 enhances the BKCa channel's Ca2+ sensitivity is not well understood. Perhaps the simplest mechanism would be for it to increase the affinities of the channel's Ca2+-binding sites, but this does not appear to be the case. Nimigean and Magleby (1999)(2000) found that β1 increases the length of time that the BKCa channel spends in bursting states and that this effect persists in the absence of Ca2+. They suggested that it is this Ca2+-independent effect that underlies most of the channel's increased Ca2+ sensitivity. Furthermore, we found previously that as the Ca2+ concentration is raised, the concentration at which the BKCa channel's conductance–voltage relation begins to shift leftward is essentially unaffected by β1 (Cox and Aldrich, 2000), a result that suggests that, at least when it is open, the channel's affinity for Ca2+ is not greatly altered by β1. In fact, this study leads us to suggest that, rather than greatly altering the channel's Ca2+-binding properties, β1 may be enhancing its voltage-sensing properties by shifting the equilibrium for voltage sensor activation, and therefore the channel's gating charge vs. voltage relation (Q–V relation) ∼100 mV toward more negative voltages. This would be expected to decrease the work that Ca2+ binding must do to open the channel at most voltages and thereby bring about an apparent increase in Ca2+ affinity at most voltages as well. Contrary to this hypothesis, however, Orio and Latorre (2005) have recently proposed that it is a decrease in effective gating charge, rather that a shift in the channel's Q–V relation, that accounts for the effects of β1.
Here, to distinguish between these possibilities, we have measured gating currents from heterologously expressed BKCa channels with and without β1 coexpression. Our results indicate that the channel's Q–V relation does shift dramatically leftward upon β1 coexpression, with no change in gating charge. Thus, β1 stabilizes the active conformation of the channel's voltage sensors, and this has a large effect on the Ca2+ sensitivity of the channel. In addition, however, in order to fully account for the increase in apparent Ca2+ affinity brought about by β1, we have also found it necessary to suppose that β1 decreases the true affinity of the closed channel for Ca2+.
MATERIALS AND METHODS
Channel Expression
Experiments were done with a BKCa channel α subunit clone from mouse mSlo-mbr5 (Butler et al., 1993) and a β1 subunit clone from bovine (bβ1) (Knaus et al., 1994a). In vitro transcription was performed with the mMessage mMachine kit with T3 or T7 RNA polymerase (Ambion). 0.05–250 ng of total cRNA was injected into Xenopus laevis oocytes 2–6 d before recording. Different amounts of cRNA were injected for different purposes, 0.05–0.2 ng for single channel recording, 10–50 ng for macroscopic current recording, and 150–250 ng for gating currents and limiting Popen recordings. bβ1 and mSlo cRNA were mixed in a molar ratio of 2:1 before injection.
Electrophysiology
All recording were done in the inside-out patch clamp configuration (Hamill et al., 1981). Patch pipettes were made of borosilicate glass (VWR micropipettes) with 0.5–4 MΩ resistances that were varied for different recording purposes. The tips of the patch pipettes were coated with sticky wax (Sticky Wax) and fire polished. Data were acquired using an Axopatch 200B patch-clamp amplifier and a Macintosh-based computer system equipped with an ITC-16 hardware interface (Instrutech) and Pulse acquisition software (HEKA Electronik). For macroscopic current recording, data were sampled at 50 kHz and filtered at 10 kHz.
In most macroscopic current experiments, capacity and leak currents were subtracted using a P/5 subtraction protocol with a holding potential of −120 mV and leak pulses opposite in polarity to the test pulse, but with BKα+β1 currents recorded at 10 and 100 μM Ca2+ no leak subtraction was performed.
Unitary currents were sampled at 100 kHz and filtered at 10 kHz. For gating current recordings, voltage commands were filtered at 7.5 kHz to limit the size of fast capacity transients, and the data were sampled at 100 kHz and filtered at 5–10 kHz. Capacity and leak currents were subtracted using a P/5 protocol with a holding potential of −120 mV and leak pulses opposite in polarity to the test pulse. All experiments were performed at room temperature, 22–24°C.
Solutions
Gating current solutions were made according to Horrigan and Aldrich (1999). Pipette solutions contained (in mM) 127 TEA-OH, 125 HMeSO3, 2 HCl, 2 MgCl2, 20 HEPES, pH 7.2 (adjusted with HMeSO3 or TEA-OH). The 0.5 nM Ca2+ internal solution contained (in mM) 141 NMDG, 135 HMeSO3, 6 HCl, 20 HEPES, 40 μM (+)-18-crown-6-tetracarboxylic acid (18C6TA), 5 EGTA, pH 7.2 (adjusted with NMDG and HMeSO3).
K+ current recording solutions were composed of the following (in mM): pipette solution, 80 KOH, 60 NMDG, 140 HMeSO3, 20 HEPES, 2 KCl, 2 MgCl2 (pH 7.20); internal solution, 80 KOH, 60 NMDG, 140 HMeSO3, 20 HEPES, 2 KCl, 1 HEDTA or 1 EGTA, and CaCl2 sufficient to give the appropriate free Ca2+ concentration (pH 7.20). EGTA (Sigma-Aldrich) was used as the Ca2+ buffer for solutions containing <1 μM free [Ca2+]. HEDTA (Sigma-Aldrich) was used as the Ca2+ buffer for solutions containing between 1 and 10 μM free Ca2+, and no Ca2+ chelator was used in solutions containing 100 μM free Ca2+. 50 μM (+)-18-crown-6-tetracarboxylic acid (18C6TA) was added to all internal solutions to prevent Ba2+ block at high voltages (Cox et al., 1997b).
The appropriate amount of total Ca2+ (100 mM CaCl2 standard solution; Orion Research Inc.) to add to the base internal solution containing 1 mM HEDTA to yield the desired free Ca2+ concentration was calculated using the program Max Chelator (http://www.stanford.edu/~cpatton/maxc.html), and the solutions were prepared as previously described (Bao et al., 2004). To change Ca2+ concentration, the solution bathing the cytoplasmic face of the patch was exchanged using a sewer pipe flow system (DAD 12) purchased from Adams and List Assoc. Ltd.
Data Analysis
All data analysis was performed with Igor Pro graphing and curve fitting software (WaveMetrics Inc.), and the Levenberg-Marquardt algorithm was used to perform nonlinear least-squares curve fitting. Values in the text are given ± SEM.
G–V Curves
Conductance–voltage (G–V) relations were determined from the amplitude of tail currents measured 200 μs after repolarizations to −80 mV following voltage steps to the test voltage. Each G–V relation was fitted with a Boltzmann function
 |
(1) |
and normalized to the maximum of the fit. The half-activation voltage (V 1/2) and the effective gating charge (z) were determined from the fitting.
Q–V Curves
The amount of activated gating charge (Q) at a given voltage was determined from the area under the gating current trace between 0 and 300 μs after the initiation of the voltage step. Repolarizations were to −80 mV. Each Q–V relation was fitted with a Boltzmann function and normalized to the maximum of the fit. The voltage sensor's half-activation voltage V hc and the gating charge z J were determined from the fitting.
Limiting Popen Analysis
Popen measurements <10−3 were made in 3 nM Ca2+ with patches that contained hundreds of channels. The number of channels in a given patch (N) was determined by switching the patch into a solution that contained either 100 μM Ca2+ (α) or 10 μM Ca2+ (α+β1) and recording macroscopic currents at moderate to high voltages. N was than calculated as N = I/(iP O), where i represents the single channel current at a given voltage and P O represents the open probability at that same voltage. Both i and P O were determined previously in separate experiments. In some experiments P O was estimated from the G–V relation determined from the same patch. After determining the number of channels in a given patch, the membrane voltage was moved to lower voltages, the patch was superfused with a 3 nM Ca2+ solution, and unitary currents were recorded for 5–30 s at progressively more negative voltages. All-points histograms were then used to determine the probability of observing 0, 1, 2, 3, … open channels at a given time, and true channel Popen was then determined as
 |
(2) |
where Ft open_n represents the fraction of time n channels are open during the recording.
Fitting τ–V Curves Based on the Model of Horrigan et al. (1999)
Relaxation time constants as a function of voltage were calculated for Scheme I (see Fig. 5) assuming its horizontal steps equilibrate much more rapidly than its vertical steps, such that they are always at equilibrium (Cox et al., 1997a; Cui et al., 1997; Horrigan et al., 1999; Horrigan and Aldrich, 2002). Under this assumption, τ(V) can be calculated as a weighted average of all the vertical rate constant in Scheme I as follows:
 |
(3) |
where δx and γx represent closed-to-open and open-to-closed rate constants, respectively, and f cx and f ox represent the fraction of closed or open channels occupying the state that precedes each transition. These fractions for the closed channel were calculated as follows:
 |
(4) |
Figure 5.

The allosteric model of BKCa voltage-dependent gating of Horrigan et al. (1999). Horizontal transitions represent voltage senor movement. Vertical transitions represent channel opening. For details of the model see RESULTS and MATERIALS AND METHODS.
For the open channel, f O0–f O4 were calculated in the same way but using Jo rather than Jc. Each vertical rate constant was also assigned a voltage dependence as follows
 |
(5) |
where x = (0, 1, 2, 3, 4, 5) and zγ + zδ = z L.. For a given vertical step, once the forward rate was specified, the backward rate was determined by the equilibrium parameters of the model.
 |
(6) |
Thus, to fit the τ–V curves in Fig. 7, 11 independent parameters were required: L, V hc, D, z J, zL, zγ, γ0(0), γ1(0), γ2(0), γ3(0), and γ4(0). For definitions of L, V hc, D, z J, and z L see RESULTS.
Figure 7.

The β1 subunit does not alter the voltage dependence of the closed-to-open conformational change. Macroscopic ionic currents were recorded from BKα (A) and BKα+β1 (B) channels in excised oocyte macropatches. Voltage steps were varied as indicated, and the time courses of relaxation were fitted with single-exponential functions. Time constants (τ) from the fits are plotted in C. For voltages of +100 mV and greater, activation time constants are plotted. Otherwise deactivation time courses are plotted. The τ–V curves in C were fitted (solid lines) to a function that approximates the kinetics of Scheme I in the limit that voltage sensor movement is fast relative to channel opening and closing (see MATERIALS AND METHODS). The fit parameters were as follows: BKα: held Vhc=151 mV, L = 2.2 × 10⁻⁶, zJ = 0.58 e, zL = 0.41 e, fitting yielded D = 12.6 ± 0.43, zγ = 0.10 ± 0.002 e, γ0(0) = 7452.3 s−1, γ1(0) = 4121.4 s−1, γ2(0) = 5645.8 s−1, γ3(0) = 851 s−1, γ4(0) = 1025 s−1, δ0(0) = 0.016 s−1, δ1(0) = 0.114 s−1, δ2(0) = 1.98 s−1, δ3(0) = 3.76 s−1, δ4(0) = 57.12 s−1; BKα+β1: held Vhc = 80 mV, zJ = 0.57 e, fitting yielded L = 3.3 × 10⁻⁶ ± 6.4 × 10⁻⁶, zL = 0.46 e, D = 10.4 ± 6.4, zγ = 0.17 e, γ0(0) = 931.7 s−1, γ1(0) = 213.2 s−1, γ2(0) = 547.8 s−1, γ3(0) = 333.5 s−1, γ4(0) = 126.7 s−1; δ0(0) = 0.003 s−1, δ1(0) = 0.007 s−1, δ2(0) = 0.198 s−1, δ3(0) = 1.251 s−1, δ4(0) = 4.934 s−1. Both curves are also fitted (dashed lines) at far negative voltages with the following function:
τ= .
.
Fit parameters are as follows: BKα (voltages <−180 mV) γ(0) = 6940.8 s−1, z = 0.11 e; BKα+β1 (voltages <−280 mV) γ(0) = 1808.7 s−1, zγ = 0.11 e.
Figure 11.
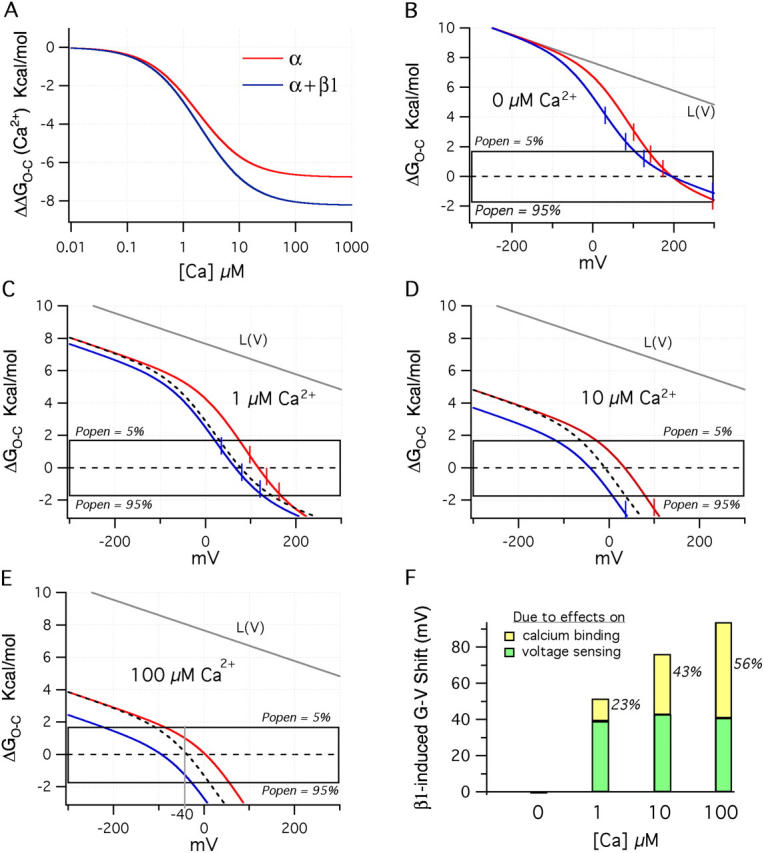
Ca2+ shifts the ΔGO−C–V relations to lower energies. (A) Plot of ΔGO−C vs. Ca2+ concentration for the BKα (red) and BKα+β1(blue) channels using the Ca2+ binding parameters determined from Fig. 11 (A and D). The plots were calculated using term 1 of Eq. 15. (B) As in Fig. 10 C, plotted here are the two model channel's ΔGO−C–V relations in the absence of Ca2+. (C) The same relations now with 1 μM Ca2+, (D) 10 μM Ca2+, and (E) 100 μM Ca2+. The dashed lines in C, D, and E indicate the BKα+β1 curve that would be observed, if there were no changes in Ca2+ bindng upon β1 coexpression. (F) Plotted are the total V1/2 shifts predicted by the BKα and BKα+β1 model channels upon β1 coexpression at 0, 1, 10, and 100 μM Ca2+. In green is the percent of the total shift due to changes in voltage sensing, and in yellow is the percentage due to changes in Ca2+ binding.
RESULTS
Steady-state Effects of β1
The BKCa channel is both Ca2+ and voltage sensitive, and the effects of these stimuli together are often displayed as a series of conductance–voltage (G–V) relations determined over a series of Ca2+ concentrations (Barrett et al., 1982). Such a series, determined from currents recorded from channels expressed in Xenopus oocyte macropatches is shown in Fig. 1 C. These G–V curves were derived from channels composed of α subunits alone. When the BKCa β1 subunit is coexpressed with the α subunit, the Ca2+-induced leftward shifting evident in Fig. 1 C becomes more pronounced (Fig. 1, D and E; see also Table I) (McManus et al., 1995; Wallner et al., 1995; Meera et al., 1996; Cox and Aldrich, 2000), and thus it may be said that β1 increases the Ca2+ sensitivity of the BKCa channel in that it increases its G–V shift in response to changes in Ca2+ concentration (McManus et al., 1995).
Figure 1.
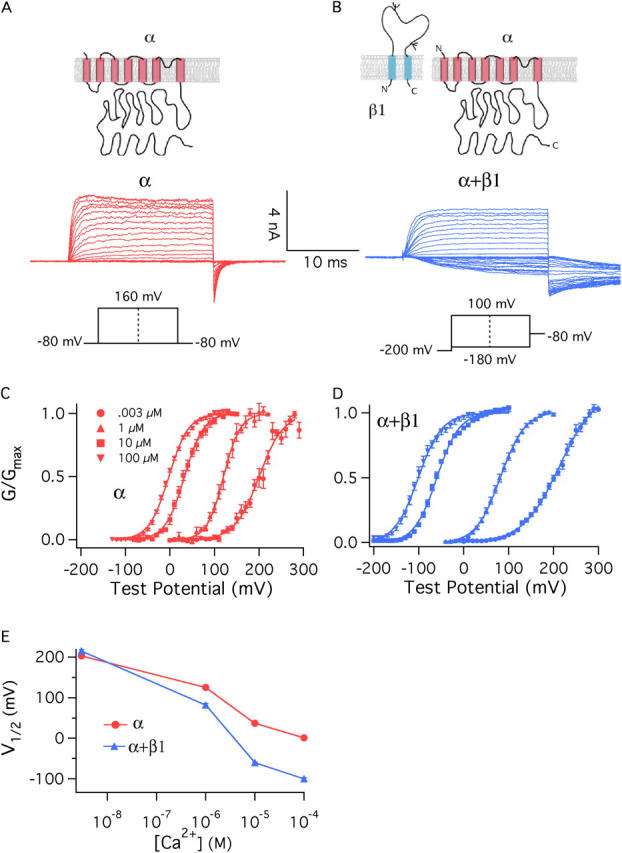
β1 increases the Ca2+ sensitivity of the BKCa channel. (A and B) Macroscopic currents recorded from BKα channels (A) and BKα+β1 channels (B). Currents are from inside-out Xenopus oocyte macropatches exposed to 10 μM internal Ca2+. (C and D) G–V relations determined at the following Ca2+ concentrations: 0.003, 1, 10, and 100 μM for the BKα channel (C) and BKα+β1 channel (D). Each curve represents the average of between 4 and 22 individual curves. Error bars indicate SEM. The solid curves are Boltzmann fits with the following parameters: BK α, 3 nM Ca2+: Q = 0.93 e, V1/2 = 200.3 mV; 1 μM Ca2+: Q = 1.36 e, V1/2 = 120.6 mV; 10 μM Ca2+: Q = 1.18 e, V1/2 = 32.8 mV; 100 μM Ca2+: Q = 1.15 e, V1/2 = −2.4 mV. BK α1 β1, 3 nM Ca2+: Q = 0.62 e, V1/2 = 213.1 mV; 1 μM Ca2+: Q = 0.94 e, V1/2 = 82.1 mV; 10 μM Ca2+: Q = 1.02 e, V1/2 = −59.5 mV; 100 μM Ca2+: Q = 0.96 e, V1/2 = −101 mV. (E) Plots of half-maximal activation voltage (V1/2) vs. Ca2+ concentration. The V1/2 values are from Table I. Error bars represent SEM.
TABLE I.
Comparing G–V Parameters
| BKa
|
BKα+β1
|
|||||
|---|---|---|---|---|---|---|
| [Ca] | V 1/2 | Q(e) | n | V 1/2 | Q(e) | n |
| μM | mV | e | mV | e | ||
| 0.003 | 203 ± 5.3 | 0.95 ± 0.03 | 4 | 215 ± 3.4 | 0.66 ± 0.03 | 16 |
| 1 | 125 ± 4.7 | 1.35 ± 0.12 | 7 | 82 ± 3.4 | 0.99 ± 0.02 | 20 |
| 10 | 37 ± 5.6 | 1.26 ± 0.07 | 8 | −60 ± 1.6 | 1.05 ± 0.05 | 7 |
| 100 | 1 ± 2.4 | 1.17 ± 0.03 | 22 | −100 ± 3.5 | 1 ± 0.06 | 10 |
The values shown are Boltzmann-fit parameters. They indicate mean ± SEM.
This increase in Ca2+ sensitivity can been viewed in a more conventional manner if a single voltage is considered. At −40 mV, for example, β1 dramatically increases both the efficacy and apparent affinity of Ca2+ in activating the BKCa channel (Fig. 2 A). Interestingly, however, and perhaps mechanistically telling, β1's effects on Ca2+ sensing are not static with respect to voltage, but rather, they diminish as the membrane potential is made more positive (Fig. 2, B and C).
Figure 2.
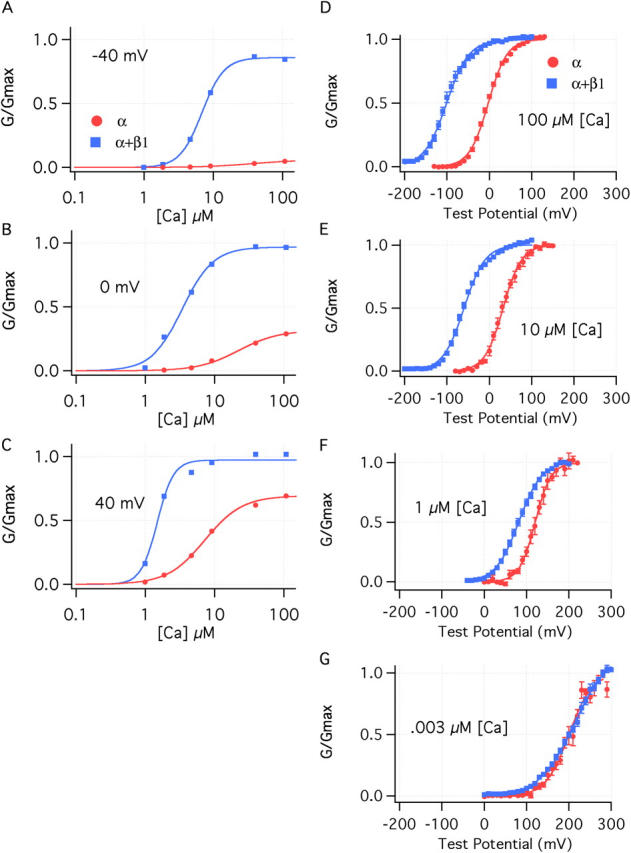
The effects of β1 are both Ca2+ and voltage dependent. (A–C) Ca2+ dose–response curves determined for the BKα and BKα+β1 channel at (A) −40, (B) 0, and (C) +40 mV. Curves are fitted with the hill equation:
 =
= .
.
Fit parameters are as follows: −40 mV, BKα (Kd = 36.5 μM, n = 1.24); BKα+β1(Kd = 6.89 μM, n = 2.7); 0 mV, BKα (Kd = 22.1 μM, n = 1.5); BKα+β1 (Kd = 3.4 μM, n = 1.9); +40 mV, BKα (Kd = 7.25 μM, n = 1.6); BKα+β1(Kd = 3.68 μM, n = 1.5). (D–G) G–V relations are shown for the BKα and the BKα+β1 channel at (D) 100 μM Ca2+, (E) 10 μM Ca2+, (F) 1 μM Ca2+, and (G) 3 nM Ca2+. The curves are fitted with Boltzmann functions as described in the legend to Fig. 1.
Conversely, if we examine β1's effects at a single Ca2+ concentration, 100 μM (Fig. 2 D), we see that β1 powerfully shifts the channel's G–V relation leftward along the voltage axis (∼100 mV), and it reduces its maximum slope (20%). Here too, however, β1's effects are not static with respect to the fixed stimulus. The β1-induced G–V shift decreases as the internal Ca2+ concentration is lowered (Fig. 2, E and F). In fact, at nominally 0 Ca2+ (3 nM in our experiments), β1 no longer produces a leftward G–V shift, but, instead, it creates a slight rightward G–V shift and a pronounced decline in G–V steepness (Fig. 2 G; Table I) (Cox and Aldrich, 2000; Nimigean and Magleby, 2000).
β1's Effects on BKCa Gating Currents
What does the β1 subunit do to the normal process of BKCa channel gating that creates these large and physiologically important effects? Previously, we addressed this question by comparing the effects of β1 to what happens to simulated currents when various parameters in models of BKCa channel gating were altered (Cox and Aldrich, 2000). From this work we concluded that multiple aspects of gating are likely altered by β1, including small changes in Ca2+ binding, gating charge, and the intrinsic energetics of channel opening. One large change we predicted, however, was a large β1-induced leftward shift in the channel's charge–voltage (Q–V) relation. This, we supposed, would lower the free energy difference between open and closed states at most voltages, and thus lower as well the work Ca2+ binding must do to open the channel (Cox and Aldrich, 2000).
Here, to directly test this prediction we have examined BKCa gating currents in the absence and presence of β1. A family of gating currents for the BKα channel is shown in Fig. 3 A. These currents were recorded in the essential absence of Ca2+ (0.5 nM) with 1-ms voltage steps. Most notable, they are small and fast, 500–1,000 times smaller than the ionic currents we typically observe under the same conditions of channel expression (Fig. 1 A), and at +160 mV (Fig. 3 A, fourth trace down) the ON gating current decays with a time constant of 57.2 ± 4.0 μs (n = 16), and the OFF gating current at −80 mV is similarly fast (τ(off) = 31.2 ± 3.3 μs, n = 20). Thus, care had to be taken to ensure that what we were observing was in fact gating current and not the result of capacity current subtraction errors. We are confident, however, that these currents are indeed gating currents, as they are not seen in uninjected oocytes (second trace down). They are not seen in response to voltage pulses of equal magnitude but opposite polarity (third trace down), and they have characteristics very similar to those reported previously for the BKα channel (Horrigan and Aldrich, 1999, 2002) (Table II).
Figure 3.
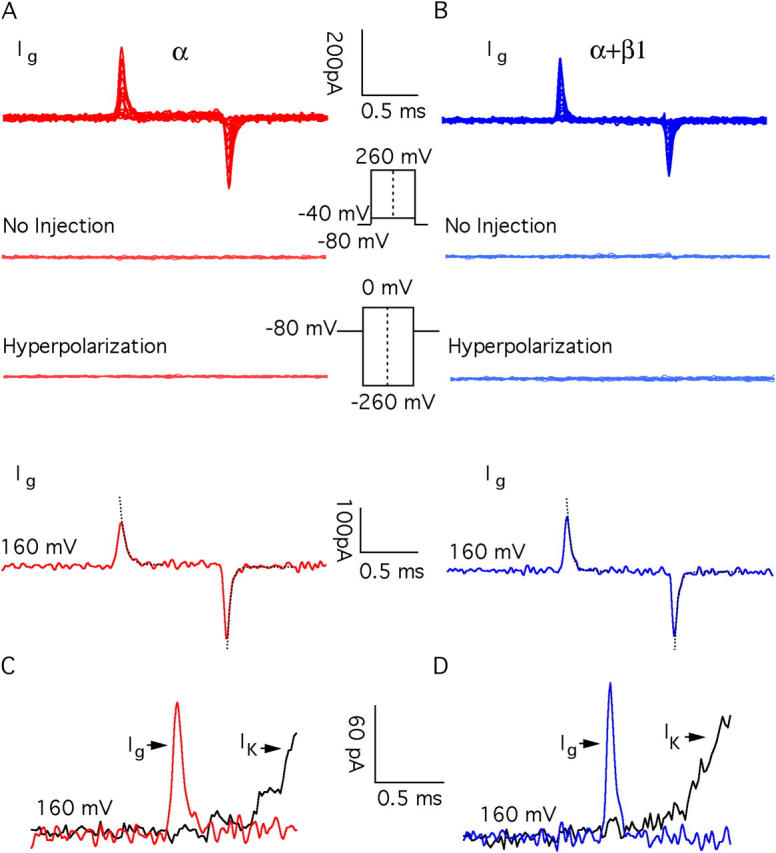
BKCa gating currents. (Top traces) Gating current families recorded from BKα (A) and BKα+β1 (B) channels with 0.5 nM internal Ca2+. The second and third traces in A and B demonstrate that gating currents are not observed in patches from oocytes that were not injected with BKCa cRNA (second) or with hyperpolarizing voltage steps (third). The lowest traces in A and B are gating currents recorded with pulses to +160 mV. Repolarizations are to −80 mV. Exponential fits to the on and off currents are indicated with dashed line. (C and D) Comparisons of on-gating current (Ig) and potassium current (IK) from BKα (C) and BKα+β1 (D) channels. Pulses were to +160 mV. Ca2+ = 0.5 nM. The gating and ionic currents compared in C and D are from different patches.
TABLE II.
Comparing Voltage Gating Parameters
| Parameter | BKα (Horrigan et al., 1999) |
BKα | BKα+β1 | Difference |
|---|---|---|---|---|
| L | 2 × 10⁻⁶ | 2.2 × 10⁻⁶ | 2.5 × 10⁻⁶ | 0.3 × 10⁻⁶ |
| zJ | 0.5 e | 0.58 e | 0.57 e | 0.01 |
| zL | 0.4 e | 0.41 e | 0.41 e | 0 |
| Vhc | 155 mV | 151 mV | 80 mV | −71 mV |
| Vho | 24 mV | 27 mV | −34 mV | −61 mV |
| D | 17 | 16.8 | 12.8 | −4 |
As shown in Fig. 3 B, we also recorded gating currents from channels composed of both α and β1 subunits, and remarkably they look very much like the BKα currents. They are small and fast (see fourth traces down in Fig. 3, A and B; τ(on) = 54.7 ± 2.6 μs, n = 13, at +160 mV; τ(off) = 34.6 ± 3.0 μs, n = 14, at −80 mV), which is interesting because β1 slows ionic current relaxations (see Fig. 1, A and B and Fig. 7). Clearly, however, this slowing does not arise from a slowing of voltage sensor movement.
The gating currents we have recorded from both BKα and BKα+β1 channels have relaxation time constants close to the theoretical time resolution of our recording system τ ∼ 40 μs, and so we have not analyzed the kinetics of these currents further, as they may be distorted by our hardware. What is clear, however, is that both with and without β1, BKCa gating currents are very fast.
An important consequence of the speed of the BKα and BKα+β1 channels' gating charge movement is illustrated in Fig. 3 (C and D). In response to a strong depolarization, both channels' voltage sensors move almost completely (Ig) before the channels begin to open (IK). The time constants of channel opening are 18 (BKα) and 177 (BKα+β1) times larger than those of gating charge movement. Thus, for both channels, rapid ON gating currents reflect voltage sensor movement in the channel's closed conformation (Stefani et al., 1997; Horrigan and Aldrich, 1999).
To determine Q–V relations we integrated both ON and OFF gating currents and plotted these integrals separately as a function of test potential. These integrals report the amount of gating charge that moves rapidly during each voltage pulse. Examples of Q–V curves from individual BKα and BKα+β1 patches are shown in Fig. 4 (A and B), and as is evident, both with and without β1, there is very little difference between the BKCa channels' rapid ON and OFF Q–V curves. Thus, charge is not immobilized by depolarization in either case.
Figure 4.
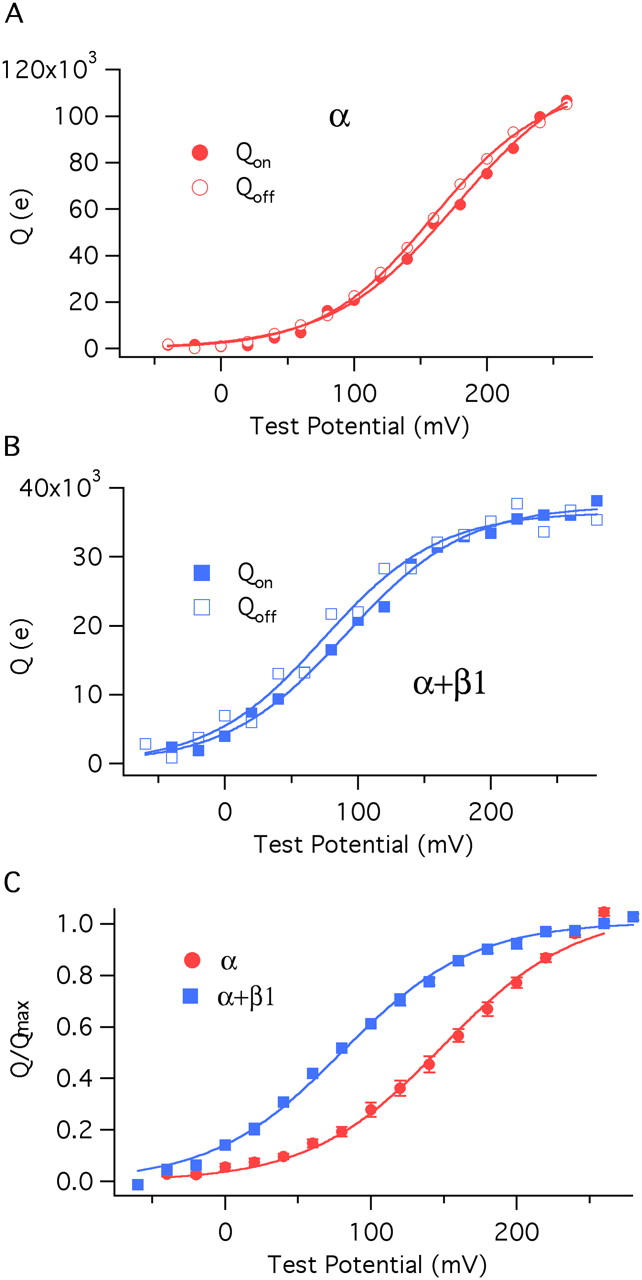
The β1 subunit shifts the closed channel's charge–voltage (Q–V) relation leftward without changing its shape. (A) On and Off Q–V relations determined from a single BKα channel patch. (B) On and Off Q–V relations determined from a single BKα+β1 channel patch. (C) Normalized averaged Qon–V relations for the BKα (11 curves averaged) and BKα+β1 channels (14 curves averaged). Each curve in C is fitted with a Boltzmann function. The fit parameters are as follows: BKα: z J = 0.577 ± 0.023e, V hc = 151 ± 1.9 mV; BKα+β1: z J = 0.571 ± 0.025 e, V hc = 80 ± 2.4 mV. The error bars in C represent SEM.
ON Q–V relations for each channel type were fitted with Boltzmann functions (Table III), and these curves were normalized to their maxima and averaged to yield the curves shown in Fig. 4 C. Of central importance, the two curves have the same shape, but the BKα+β1 curve lies far to the left of the BKα curve. Indeed, both curves are well fitted by Boltzmann functions, which suggests that each channel's voltage sensors move independently, and a single voltage sensor behaves like a two-state system (Horrigan and Aldrich, 1999). For the BKα channel, the fit yielded values of V 1/2 = 151 mV and z = 0.577 e (for standard deviations of fit parameters see figure legends). These values are very similar to those published previously for BKα gating currents (Horrigan and Aldrich, 1999, 2002) (Table II). The BKα+β1 fit yielded values of V 1/2 = 80 mV and z = 0.571 e. Thus, β1 does not change the voltage sensor's gating charge, as has been suggested (Cox and Aldrich, 2000; Orio and Latorre, 2005), but it does shift the closed channel's Q–V relation 71 mV leftward along the voltage axis such that at physiological voltages, the BKα+β1 channel's voltage sensors are much more often in their active configuration.
TABLE III.
Comparing Q–V Parameters
| V 1/2 | z | Q max | n | |
|---|---|---|---|---|
| mV | e | e | ||
| BKα | 156 ± 3.8 | 0.57 ± 0.02 | 49305 ± 6623 | 22 |
| BKα+β1 | 80 ± 3.1a | 0.57 ± 0.01 | 27548 ± 4327a | 14 |
The values shown are Boltzmann-fit parameters. They indicate mean ± SEM. Q max represents the maximum gating charge measured per patch.
Statistical significance between BKα and BKα+β1 values P < 0.05.
The Current View of BKα Voltage-dependent Gating
It is useful to view these results in the context of the current view of BKα voltage-dependent gating. A model represented by Scheme I (Fig. 5) has been shown by Horrigan, Cui, and Aldrich to very well approximate BKα gating and ionic currents in the absence of Ca2+, over a very wide range of voltages (Horrigan and Aldrich, 1999, 2002; Horrigan et al., 1999). Horizontal transitions represent movement of the channel's four voltage sensors, each of which can be either active or inactive. Vertical transitions represent the conformational change by which the channel opens. The activation of a voltage sensor is not required for channel opening, but rather it promotes opening by lowering the free energy difference between open and closed. Indeed, the factor by which the movement of a voltage sensor increases the closed-to-open equilibrium constant, referred to by Horrigan, Cui, and Aldrich as D, is given simply by J O/J C, where J O is the equilibrium constant for voltage sensor activation at 0 mV when the channel is open, and J C is this equilibrium constant when the channel is closed. J C and JO can be related to the midpoints of the open and closed channel's Q–V relation as follows:
 |
(7) |
 |
(8) |
where R, T, and F have their usual meanings, z J is the gating charge associated with a single voltage sensor, and V hc and V ho are the half-maximal activation voltages of the channel's Q–V relation, when the channel is either closed (V hc) or open (V ho). In order for voltage sensor movement to promote opening, V ho must be more negative than V hc.
Completing then the mathematical description, the open probability (Popen) of the Horrigan, Cui, and Aldrich model as a function of voltage (V) is given by Eq. 9:
 |
(9) |
where L is the equilibrium constant between open and closed at 0 mV when no voltage sensors are active, and z L is a small amount of gating charge associated with the closed-to-open conformational change.
As is the case for other voltage-gated K+ channels, it is fairly clear that the S4 region, and probably part of S3, forms the BKCa channel's voltage sensor, whose gating charge is designated here z J (Stefani et al., 1997; Diaz et al., 1998; Horrigan and Aldrich, 1999; Hu et al., 2003). The physical basis for z L, however, has yet to be determined, but without assigning some voltage dependence to the closed-to-open conformational change, it is not possible to fit the BKα ionic current data at all well (Horrigan and Aldrich, 1999, 2002; Horrigan et al., 1999; Cox and Aldrich, 2000; Cui and Aldrich, 2000; Rothberg and Magleby, 2000). Thus, the equilibrium voltage dependence of BKα gating in the absence of Ca2+ is well described by five parameters, V hc, V ho, z J, L, and z L, and to this point our data allows us to specify two of them V hc and z J. To fully determine the effects of β1 on the voltage-dependent aspects of BKCa channel gating at equilibrium, however, requires that we specify V ho, L, and z L for both channels as well. To do this we have performed the experiments described below.
Estimating β1's Effects on the Closed-to-Open Conformational Change
At far negative voltages, where no voltage sensors are active, Eq. 9 reduces to Eq. 10 (Horrigan et al., 1999)
 |
(10) |
which can be rewritten as
 |
(11) |
Eq. 11 states that as we make the membrane voltage more and more hyperpolarized, a plot of log(Popen) vs. voltage will begin to turn away from the voltage axis, and it will reach a limiting slope that is less than the maximum slope and reflects the voltage dependence of just the closed-to-open conformational change (Horrigan and Aldrich, 1999, 2002; Horrigan et al., 1999). That is, in this voltage range, the slope of the log(Popen)–V relation will be determined only by z L, and the position of the curve on the vertical axis will be determined only by L. Thus, as has been discussed previously (Horrigan and Aldrich, 1999, 2002), by determining the BKCa channel's Popen vs. voltage relation at far negative potentials we can estimate z L and L directly.
To do this, we recorded BKα and BKα+β1 macroscopic currents at depolarized voltages (+10 to +80 mV) and 10 or 100 μM Ca2+. From these currents we could determine the number of channels in a given patch (N) (see MATERIALS AND METHODS). Then, we lowered the Ca2+ concentration to 3 nM and the membrane voltage to negative values where the channels are rarely open, and recorded unitary currents. Such currents are shown in Fig. 6 (A and B). Notice, the BKα channels appear to open more frequently than the BKα+β1 channels, but the burst times of the BKα+β1 channels appear on average longer (expanded traces). From data like that in A and B, the probabilities of observing 1, 2, 3 … open channels at a given time were determined with all-points histograms, and these probabilities and N were then used to determine the true mean open probability of the channels in each patch (see MATERIALS AND METHODS). In this way, we could measure open probabilities as low as 10−6.
Figure 6.

Estimating L and z L from Popen at negative voltages. Unitary currents were recorded with 3 nM internal Ca2+ from BKα (A) and BKα+β1(B) channels. The patch in A contained 2,859 channels. The patch in B contained 3,270 channels. Mean log(Popen)–voltage relations determined from patches like that in A (12 patches) and B (15 patches) are shown in C for the BKα channel and D for the BKα+β1 channel. In C, the bottom of the curve is fitted with the following function: log(Popen) = log(L) + 0.4342z L FV/RT. The resulting parameters were log(L) = −5.66 ± 0.13, z L = 0.410 ± 0.065. In D, no submaximal limiting slope was identified.
log(Popen) vs. voltage plots are shown in Fig. 6 (C and D) for the BKα and BKα+β1 channels. As the voltage becomes more negative, the BKα plot curves upward starting at ∼−60 mV, and it reaches a limiting slope by ∼−100 mV. Fitting just the most negative part of this curve with Eq. 11 yields values for L and z L of 2.2 × 10⁻⁶ and 0.410e respectively, again similar to published values (Horrigan and Aldrich, 1999, 2002) (Table II) (for standard errors of fit parameters see figure legends). Surprisingly, however, in the BKα+β1 plot, no such submaximal limiting slope is attained. Instead, down to −120 mV, the BKα+β1 channel's log(Popen)–V relation remains roughly linear, with no clear inflection point that would suggest that the limiting slope is being approached. This is surprising, because Scheme I suggests that such an inflection point should exist, and the fact that we do not see it argues either that the β1 subunit fundamentally alters the gating behavior of the BKCa channel such that models of the form of Scheme I no longer apply, or we have yet to examine voltages negative enough to see the inflection point. Indeed, this latter possibility seems very real, as we have already discovered that it takes significantly lower voltages to hold the channel's voltage sensors in their inactive state, at least for the closed channel, when the β1 subunit is present (Fig. 4 C). Unfortunately, however, we found it technically unfeasible to make accurate Popen measurements for the BKα+β1 channel at voltages more negative than −120 mV, where Popen approaches 10−7. As described below, however, we have used ionic current kinetics to estimate where, if it exists, the inflection point should be.
τ-Relaxation vs. Voltage Relations Suggest No Change in zL
But for a brief delay, the onset and offset of BKα ionic currents can be well fitted with a simple exponential function over a very wide voltage range. β1 does not change this; however, at 0 Ca2+ it does slow both activation and deactivation. On a plot of log(τ-relaxation) vs. voltage this is seen as an upward shift in the channel's log(τ)–V curve (Fig. 7 C). The general shapes of the BKα and the BKα+β1 curves, however, remain similar. At far negative voltages there is a shallow region of positive slope. This transitions into a steeper region that persists until the plots reach a peak, and after the peak, τ-relaxation falls often steadily at high voltages. According to the Horrigan, Cui, and Aldrich model (Fig. 5, bottom), the phases of these plots are understood as follows. At far negative voltages, no voltage sensors are active, and τ-relaxation is determined by the rate constant of the O0 to C0 transition and its voltage dependence (z γ). At far positive voltages a similar situation obtains, and τ-relaxation is determined by the C4 to O4 rate constant and its voltage dependence (z δ); where z δ + zγ = z L. In the middle, no single transition determines the time constant of relaxation; but rather, as voltage sensors become active, a weighted average of all the vertical rate constants in Scheme I prevails. Thus, just as with the log(Popen)–V relation, the model predicts that there will be a transition or inflection point in the channel's log(τ)–V relation at the voltage where voltage sensors start to become activated, and at voltages more negative than this the plot will reach a limiting slope that reflects now the portion of z L associated with the closing transition (z γ) (Horrigan and Aldrich, 2002).
Viewing Fig. 7 C in this light, then, the BKα curve has a limiting positive slope of ∼0.11e (dashed line), which suggests that z γ = 0.11 e, and it starts to veer upward at ∼−60 mV, which, as expected, is the same position as the inflection point in the BKα channel's log(Popen)–V curve (Fig. 6 C). Interestingly, however, the BKα+β1 curve appears to reach the same limiting slope at negative voltages as does the BKα curve (dashed lines), so z γ appears unchanged by β1. And, at the most positive voltages tested (although here it is not clear that limiting voltages have been reached) the two curves also have the same slope, which suggests that z δ is also little altered. Thus, β1 does not appear to affect z L, and we can estimate that it is ∼0.41e for both channels. Indeed, apart from their position on the ordinate, the essential difference between the two curves in Fig. 7 C is the position of their inflection point; the BKα+β1 channel's lies ∼140 mV farther negative. In fact, the BKα+β1 inflection point it is at ∼−200 mV, which is out of the voltage range of our Popen measurements in Fig. 6 D. Thus, there is an inflection point when the channel contains β1, and its large negative value further supports the notion that β1 shifts voltage sensor activation to more negative voltages. Furthermore, as the time constant of relaxation at negative voltages is determined primarily by the distribution of active voltage sensors in the open channel (Cox et al., 1997a; Horrigan and Aldrich, 2002), this result suggests that β1 shifts the channel's Q–V relation leftward on the voltage axis when the channel is open.
Estimating L and Vho With and Without β1
To this point then we have specified V hc, z J, and z L for both channels, and left to specify are V ho for the BKα channel, and V ho and L for the BKα+β1 channel. One way we have attempted to estimate these parameters is to fit the two curves in Fig. 7 C with Eq. 12 below, which approximates Scheme I's τ–V relation in the limit that voltage sensor movement is much faster than channel opening and closing (Cox et al., 1997a; Horrigan and Aldrich, 2002; for details of the approximation see MATERIALS AND METHODS). As this condition applies for both channels over much of the voltage range, such an approximation is likely to be reasonably good. Indeed, Eq. 12 fits both curves quite well (Fig. 7 C, solid lines).
 |
(12) |
Here δi and γi are the forward and backward rate constants enumerated in Fig. 7 (bottom) and f Oi and f Ci represent the fraction of open channels or closed that occupy state Oi or Ci respectively. In fitting the BKα log(τ)–V curve we held V hc, z J, L, and z L to the values we estimated from gating current and limiting Popen measurements, leaving only V ho to vary along with zγ and five rate constants, one for each vertical step in Scheme I. The resulting fit yielded zγ = 0.11 and V ho = +39 mV. For the BKα+β1 fit we adjusted V hc to the value we obtained from our BKα+β1 gating current measurements, +80 mV, z J was again fixed, and L was now allowed to vary freely along with z L, V ho, zγ, and again five rate constants. The resulting fit yielded V ho = −25 mV, zγ = 0.15, and L = 3.3 × 10⁻⁶, z L = 0.46 (for standard deviations of fit parameters see figure legend). Thus, this analysis suggests, as we surmised above, that zL and z γ change little, if any, with β1 coexpression, but that V ho moves ∼64 mV leftward, while L perhaps increases slightly (2.2 × 10⁻⁶→3.3 × 10⁻⁶) but remains on the order of 10−6.
A more direct way to measure V ho for either channel would be to measure gating charge movement exclusively when the channel is open. This, however, requires large prolonged depolarizations that we have found technically unfeasible. Another way we can estimate V ho, however, and indeed also L for the BKα+β1 channel, is to simply fit each channel's Popen–V relation with Eq. 9, while holding the parameters we have already determined constant. Since for the BKα channel we have specified four of five parameters, and for the BKα+β1 channel three of five, we expect such fits to be very well constrained.
To do this we combined our limiting Popen data (Fig. 6) with macroscopic current data (Fig. 2 G) to obtain Popen–V curves that are well determined over large ranges of both voltage and Popen. Fig. 8 shows these curves fitted with Eq. 9. For the BKα fit in A, V hc, z J, L, and z L were set to the following values: z J = 0.58 e, Vhc = 151 mV, z L = 0.41 e, L = 2.2 × 10⁻⁶, and D was allowed to vary freely. This yielded D = 16.8, which indicates a V ho value of +27 mV, similar to a previous report (Horrigan and Aldrich, 1999) (Table II). Similarly, for the BKα+β1 fit (Fig. 8 B, solid line), V hc, z J, and z L were set as follows: z J = 0.57 e, Vhc = 80 mV, z L = 0.41 e, and the fit yielded a D value of 12.8 that equates to V ho = −34 mV, and L = 2.5 × 10⁻⁶. Thus β1 is estimated here to shift V ho leftward 61 mV (see simulations in Fig. 8 C) but it has almost no effect on L.
Figure 8.
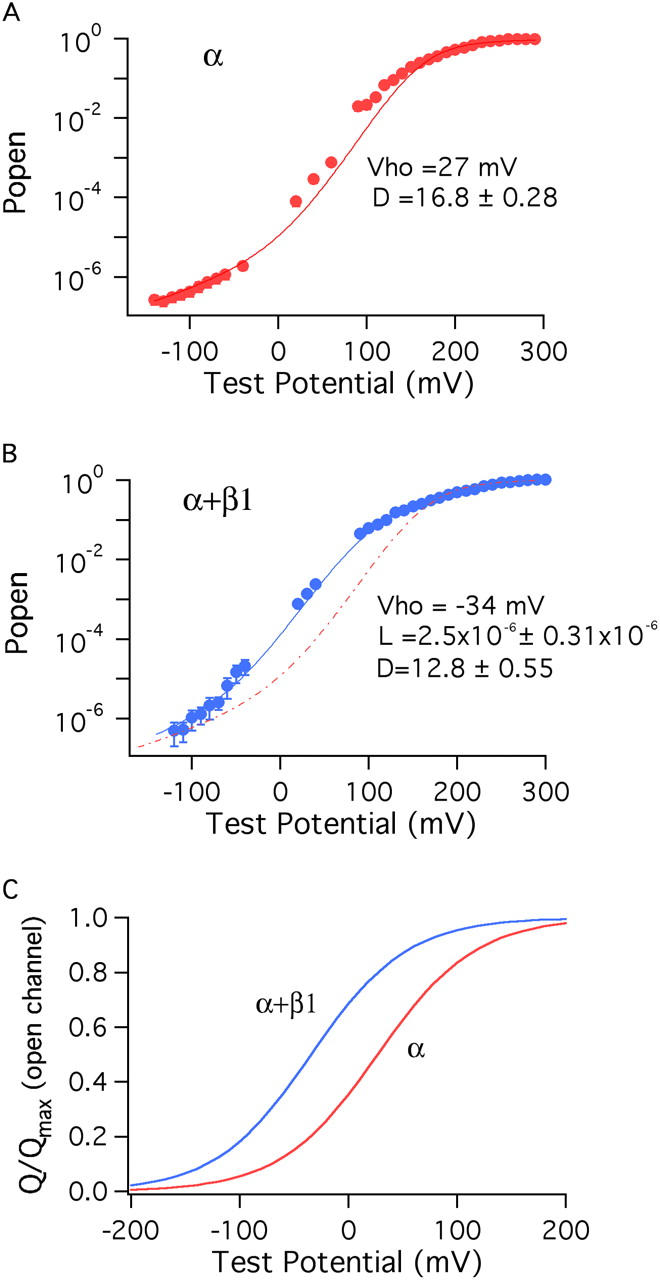
Estimating L and V ho from Popen–V curve fits. (A) The Po–V relation of the BKα channel at 3 nM Ca2+ is shown over a wide range of voltages. At +60 mV and below, the data points are from unitary current measurements; above +60 mV, the data are from macroscopic current measurements. The curve displayed represents the average of 35 experiments, and error bars represent SEM. The data are fitted with Eq. 9 as described in RESULTS. Free parameters: D = 16.8 ± 0.28. (B) The Po–V relation of the BKα+β1 channel. The curve displayed represents the average of 43 experiments, and error bars represent SEM. As in A, the data are fitted with Eq. 9. Free parameters: D = 12.8 ± 0.55, L = 2.53 × 10⁻⁶ ± 0.55 × 10⁻⁶. The dashed red curve is the fit from A placed here for ease of comparison. (C) Simulated Q–V relations for the open BKα and BKα+β1 channels demonstrating the −61 mV shift induced by β1 that the fits in A and B predict. The functions displayed are
 =
= ,
,
with V ho equal to 27 mV (BKα) and −34 mV (BKα+β1) and z J = 0.58 (BKα), z J = 0.57 (BKα+β1).
To this point then our conclusions are strikingly simple. The β1 subunit has little or no effect on the equilibrium constant of the conformational change by which the BKCa channel opens, and it does not affect the gating charge on the channel's voltage sensors, but it does stabilize voltage sensor activation both when the channel is open and when it is closed such that voltage sensors activate at more negative voltages with β1 present. Furthermore, β1 more effectively stabilizes the active voltage sensor when the channel is closed, than when it is open. That is, ||ΔVhc || > ||ΔVho||, and this reduces D the factor by which voltage sensor activation promotes channel opening by 24%, from 16.8 to 12.8.
β1 Affects Ca2+ Binding
The question still remains, however, as to whether these changes are enough to explain the changes in Ca2+ sensitivity described in Figs. 1 and 2. To address this issue we have incorporated our findings into a model of BKCa channel gating that takes into account both Ca2+ and voltage sensing.
Our recent work suggests that the BKCa channel has two sets of four high-affinity Ca2+ binding sites, which are structurally distinct but have similar binding properties (Bao et al., 2002, 2004; Xia et al., 2002). Assuming one site does not affect another, and the channel's voltage sensors and Ca2+ binding sites also act independently, this information can be combined with Scheme I to produce a model of BKCa channel gating that considers both Ca2+ binding and voltage sensing (Cox and Aldrich, 2000; Cui and Aldrich, 2000; Rothberg and Magleby, 2000; Zhang et al., 2001; Horrigan and Aldrich, 2002). The open probability of such a model is given by Eq. 13:
 |
(13) |
where now, as compared with Eq. 9, two terms has been added to the denominator that each contain a set of Ca2+ dissociation constants, one set for each binding site (K C1, KO1; KC2, KO2). Here, Ca2+ binding promotes opening by binding more tightly to the open channel than the closed, and thus two constants are specified for each type of site. The c subscript denotes the closed channel and the o subscript, the open channel. Because, both types of binding sites appear to have similar binding properties, we may simplify Eq. 13 to Eq. 14:
 |
(14) |
where now eight equivalent binding sites are considered with binding constants K C and K O.
To see, then, if the changes in V hc and V ho that we have observed upon β1 coexpression are sufficient to account for the BKα channel's enhanced Ca2+ response, for each channel type, we fitted a series of G–V relations with Eq. 14 (Fig. 9). For the BKα fit (Fig. 9 A), V hc, V ho, z J, L, and z L were held at the values we determined from our experiments in the absence of Ca2+ (Table II), and only K C and K O were allowed to vary. Still a reasonably good fit was obtained that captured well the shifting nature of the BKα channel's G–V relation as a function of Ca2+ concentration. This fit yielded K C = 3.71 μM and K O = 0.88 μM, similar to our previous estimates (Bao et al., 2002).
Figure 9.
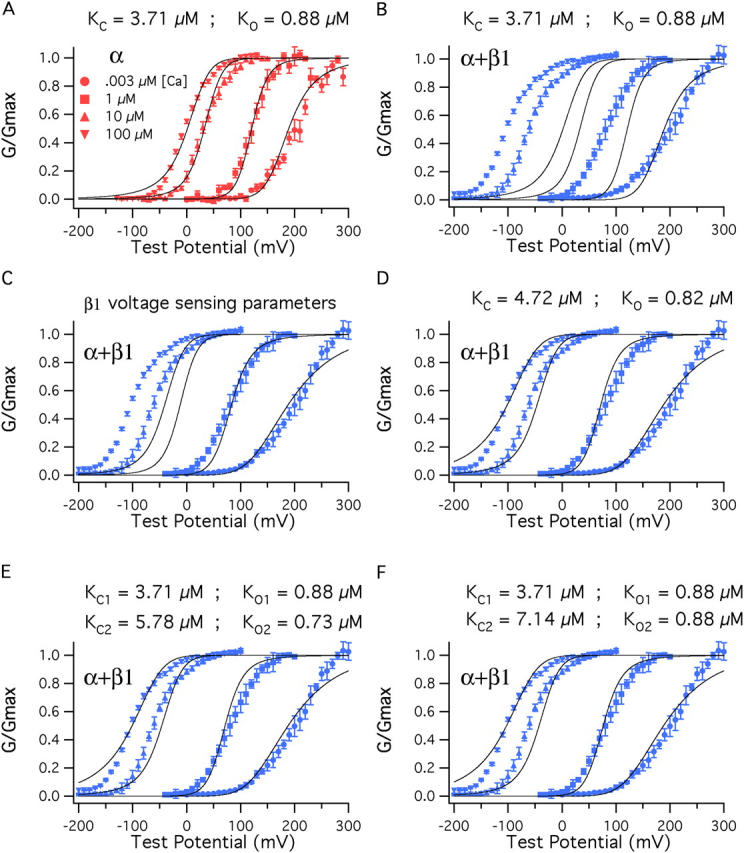
β1 also affects Ca2+ binding. (A) BKα G–V relations at a series of Ca2+ concentrations fitted simultaneously (solid curves) with Eq. 14. Only K C and K O were allowed to vary. The fit yielded K C = 3.71 μM and K O = 0.88 μM. The other parameters of the fit were determined from experiments performed with nominally 0 Ca2+ (3 nM) (V hc = 151 mV, L = 2.2 × 10⁻⁶, V ho = 27 mV, z J = 0.58, z L = 0.41). (B) The fit from A is superimposed on a series of BKα+β1 G–V curves. (C) The voltage-sensing parameters of the model were altered to reflect the changes that occur as β1 binds, V ho = (27→−34 mV), V hc = (151→80 mV), L = (2.2 × 10⁻⁶→2.5 × 10⁻⁶). (D) With BKα+β1 voltage-sensing parameters K C and K O were allowed to vary freely, yielding the fit shown and K C = 4.72 μM, K O = 0.82 μM. (E) Here, the BKα+β1 voltage-sensing parameters were used for the fit, and β1 was allowed to influence only half of the channels' eight Ca2+-binding sites. The data are fit with Eq. 13. K C1 and K O1 were held at 3.71 μM and 0.88 μM, respectively. K C2 and K O2 were allowed to vary freely, yielding K C2 = 5.78 μM, K O2 = 0.73 μM. (F) The data are again fit with Eq. 13 but now K O2 was held at 0.88 μM and only K C2 was allowed to vary. This yielded K C2 = 7.14 μM.
When the BKα fit is placed on the BKα+β1 data, of course it does not fit at all well (Fig. 9 B). Next, however, we adjusted V hc and V ho and L to mimic the effects of β1.V hc was moved from +151 to +80 mV, V ho was moved from +27 to −34 mV, and L was increased slightly, from 2.2 × 10⁻⁶ to 2.5 × 10⁻⁶. The important result is shown in Fig. 9 C. The effects of β1 on voltage sensing do greatly improve the G–V fits at low Ca2+ concentrations, 1 and 0.003 μM. But at higher concentrations, the fit is not good, and it gets progressively worse as the Ca2+ concentration is increased. High Ca2+ concentrations do not shift the model's G–V relation far enough leftward. Thus, β1's effects on voltage sensing appear important, but they are not sufficient to account for all of the BKα+β1 channel's enhanced Ca2+sensitivity.
To determine then what is required to fully account for the BKα+β1 G–V relation as a function of Ca2+, we fit the BKα+β1 G-V relations with Eq. 14, now fixing the voltage-sensing parameters to their BKα+β1 values (V hc = 80 mV and V ho = −34 mV, L = 2.5 × 10⁻⁶, z L = 0.41) and allowing K C and K O to vary. The resulting fit is shown in Fig. 9 D. To account for the additional leftward shifting K C increases from 3.71 to 4.72 μM, while K O declines slightly from 0.88 to 0.82 μM. This causes the ratio K C/KO to increase from 4.2 to 5.7.
Thus, our analysis suggests that β1 has a very small effect (<10%) or perhaps no affect on Ca2+ binding when the channel is open, consistent with our earlier study (Cox and Aldrich, 2000), and it reduces the affinity of each binding site for Ca2+ when the channel is closed, increasing K C ∼27%. It is perhaps surprising that such small changes in affinity can have such a dramatic effect on the position of the channel's G–V relation at high Ca2+ concentrations, but in fact this should be expected, as at saturating Ca2+ the equilibrium constant between open and closed depends on the eighth power of (K C/K O).
Perhaps only Half of the Channel's Binding Sites Are Affected by β1
The estimates of β1's effects on K C and K O just offered suppose that β1 affects all binding sites equally. However, the BKCa channel is thought to have two types of high-affinity binding sites (Schreiber and Salkoff, 1997; Bao et al., 2002; Xia et al., 2002), and it could reasonably be that β1 affects only one type of site. In this case, to account for the effects of β1, the ratio K C/K O for the site that is affected would have to increase more. To determine how much more we fitted the BKα+β1 G–V data with Eq. 13, which supposes two types of Ca2+ binding sites, referred to as 1 and 2 (Fig. 9 E). For the fit we again used the BKα+β1 voltage-sensing parameters, but now we set one set of Ca2+-binding constants to the values we determined for the BKα channel (K C1 = 3.71 μM and K O1 = 0.88 μM), and we let the second set vary. This yielded a fit similar to the one that was obtained when all sites were assumed to be affected equally (see Fig. 11 D), but now, with only half the sites affected, K C2 increased to 5.78 μM and K O2 decreased to 0.73 μM. Thus, K C increased an additional 22%, and now a larger change in K O was also produced (0.88 μM→0.73 μM, 17% decline). To determine, however, whether this change in K O2 was in fact needed, we reran the fit, now also holding K O2 to 0.88 μM. The result is shown in Fig. 9 F. A similar fit is obtained, now with K C2 increased to 7.14 μM.
Thus, whether we allow all eight or only four of the model channel's Ca2+-binding sites to be modified by β1, we can account for the general effects of β1 on the position of the BKCa channel's G–V relation as a function of Ca2+ concentration without supposing any change in K O, and whether K O does in fact decrease as β1 binds, we are as yet uncertain. What is clear, however, is that in order to account for the G–V shift produced by β1 at 100 μM Ca2+, the closed affinity of at least one type of high-affinity Ca2+-binding site must be lowered such that K C increases between 27% and 92%.
DISCUSSION
Here we have addressed the question of how, in a biophysical sense, the BKCa β1 subunit enhances the BKCa channel's Ca2+ sensitivity. Because previous work suggested that much of this phenomenon may be due to effects on aspects of gating that are separate from Ca2+ binding (Cox and Aldrich, 2000; Nimigean and Magleby, 2000; Qian et al., 2002), we focused first on determining to what extent β1 alters various parameters that govern Ca2+-independent gating. Fortunately, the gating of the BKα channel in the absence of Ca2+ had been carefully examined, and Horrigan, Cui, and Aldrich developed a model that provides both a good mathematical description of the BKCa channel's response to changes in voltage and an intuitive understanding of the various parameters that govern this process (Horrigan and Aldrich, 1999, 2002; Horrigan et al., 1999).
The Horrigan, Cui, and Aldrich model may be summarized as follows. The BKα channel opens and closes via a single conformational change that is weakly voltage dependent. This central conformational change is indirectly, or allosterically, affected by four voltage sensors, each of which can be either active or inactive. When a voltage sensor becomes active, it promotes opening by lowering the energy of the open conformation of the channel relative to the closed. For this to occur each voltage sensor's half-activation voltage must become more negative as the channel opens.
With this model as a guide, our task then became twofold, to determine if the Horrigan and Aldrich model still describes the gating of the BKCa channel when the β1 subunit is part of the channel, and if so, to then determine how the five parameters, V hc, V ho, z J, L, and z L that govern the model' s behavior at equilibrium change upon β1 coexpression. Calculations indicate that changes in any or all of these parameters could lead to changes in the apparent affinity of the channel for Ca2+ at many voltages (Cox and Aldrich, 2000). To determine, however, which were actually changing, following the lead of Horrigan and Aldrich (1999), we used both gating and ionic currents to constrain the parameters of the model so that each could be well determined. Our results may be summarized as follows.
With β1 coexpression, the Horrigan, Cui, and Aldrich model (Fig. 5, Scheme I) is still applicable. β1 does not slow voltage sensor movement, which remains fast relative to opening and closing. It has very little or no effect on the parameters that govern the central conformational change at equilibrium (L and z L), and it has no effect on the gating charge carried by each voltage sensor (z J). It does, however, have an important effect on the energy required for voltage sensor activation, both when the channel is open and when it is closed. That is, β1 affects V hc and V ho, both of which are shifted tens of millivolts leftward on the voltage axis. Interestingly, however, β1 shifts V hc ∼10 mV further than it shifts V ho, and this reduces by 24% the factor D by which voltage sensor movement influences opening. As will be discussed below, this reduction in D has consequences for the shape and position of the BKCa channel's G–V relation in the absence of Ca2+.
We have also found, however, that, although changes in V hc and V ho can account for much of the effects of β1 on Ca2+ sensing at low Ca2+ concentrations (1 μM and below), at higher Ca2+ concentrations, some effect of β1 on Ca2+ binding must also be supposed. In particular, our data suggest that β1 either has no effect or a very small effect on the affinity of the channel's Ca2+ binding sites when the channel is open (a decrease in K O from ∼0.9 μM to no less than 0.7 μM), but it increases the Ca2+ dissociation constant of the closed channel by ∼27% (3.7 to 4.7 μM), if all eight binding sites are affected, or by ∼57–92% (3.7 to 5.8 μM or 7.1 μM), if only four sites are affected. These numbers correspond to a change in the factor C by which Ca2+ binding influences opening by 57–93%. Thus, paradoxically, BKα+β1 channels are more sensitive to Ca2+ throughout the physiological voltage range, because they bind Ca2+ worse when they are closed and because their voltage sensors activate at lower voltages.
β1's Effects in Energetic Terms
To gain an intuitive understanding of these results as they relate to the BKCa channel's G–V and Ca2+ dose–response curves (Fig. 2, A–G), we have found it useful to consider the influence of Ca2+ and voltage on channel gating in energetic terms. For this purpose, we may write for the eight–Ca2+ binding site four–voltage sensor model the following equation, which relates the free energy difference between open and closed (ΔGO−C) to Ca2+ concentration [Ca2+] and membrane voltage.
 |
(15) |
Eq. 15 has four terms. Term 1 represents the change in ΔGO−C that occurs as Ca2+ is varied (ΔΔGO−C Ca2+), term 2 the change in ΔGO−C that occurs as voltage sensors become active (ΔΔGO−C VS), term 3 the influence of voltage on the central conformational change, and term 4 the intrinsic energy difference between open and closed when no Ca2+ ions are bound and no voltage sensors are active (Cui and Aldrich, 2000).
In Fig. 10 A, the sum of terms 3 and 4 is plotted as a function of voltage, and, as is evident, the direct influence of the membrane's electric field on the central conformational change contributes linearly to ΔGO−C. Because β1 does not change L appreciably, or z L, the same curve describes this influence for both channels, and only one curve has been drawn.
Figure 10.
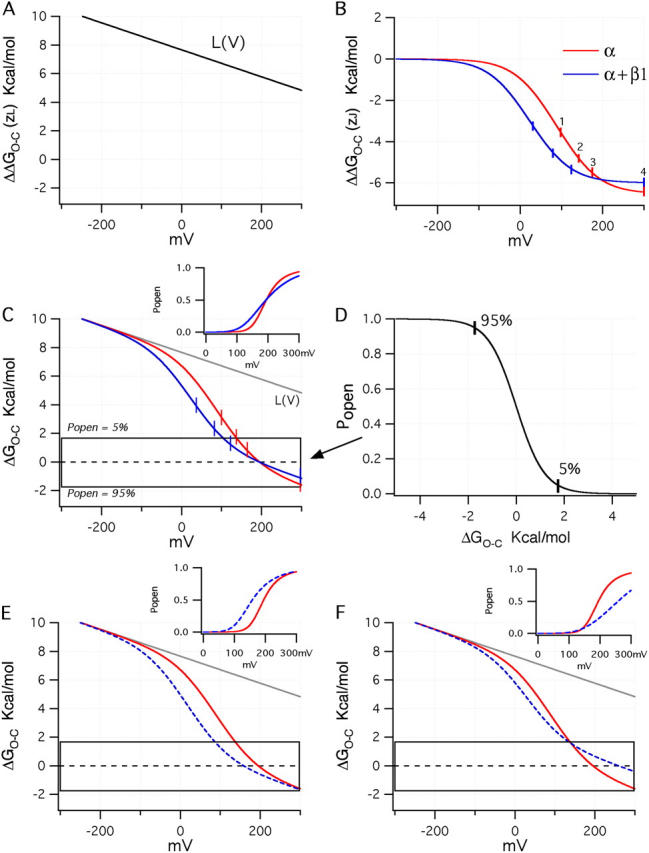
Examining the effects of β1 in energetic terms. (A) Plot of the sum of terms 3 and 4 from Eq. 15. (B) Plots of term 2 from Eq. 15 using either the BKα (red) or BKα+β1 (blue) voltage-sensing parameters (Table II). (C) Plots for both channels of terms 2, 3, and 4 of Eq. 15 combined. In the inset are drawn simulated Popen–V curves for the BKα and BKα+β1 channels based on the parameters in Table II and assuming 0 Ca2+. The boxed region indicates the energy range over which Popen moves from 0.05 (top of box) to 0.95 (bottom of box). A full Popen vs. ΔGO−C is shown in D. In E, a plot is shown like that in C except that V ho for the BKα+β1 channel has been set to −44 mV such that V hc and V ho shift equally upon β1 coexpression. (F) Here V ho for the BKα+β1 channel has been set to −20 mV to mimic a larger change in the coupling factor D upon β1 coexpression.
In Fig. 10 B term 2 is plotted using the gating parameters (V hc, V ho, z J) we have determined for each channel type (BKα and BKα+β1). Marked on the figure (numbered ticks) are the voltages at which there are an average of 1, 2, 3, or 4 active voltage sensors (although individual channels may have more or less). Here we see that voltage sensor movement influences opening at lower voltages, when β1 is present, but the maximum influence that voltage sensor movement can have on ΔGO−C, and therefore opening, is ∼7.2% less. This is due to the smaller difference between V hc and V ho in the BKα+β1 channel, which leads to a reduction in D. Indeed, in the high voltage limit, term 2 becomes simply
 |
(16) |
Also worth noting, at the bottoms of these curves, where nearly all four voltage sensors are active, the relationship between a change in membrane voltage and a change in ΔGO−C becomes quite shallow, while in the middle of these curves, it is much steeper.
Combining now terms 2, 3, and 4 yields the plot in Fig. 10 C, which describes the energetics of gating in the absence of Ca2+. Superimposed on the plot is a box that indicates the range of ΔGO−C over which the channel's open probability is between 5% (upper edge) and 95% (lower edge, for the complete relation; Fig. 10 D). Outside the box, changes in ΔGO−C have little effect on Popen, while the progress of each curve through the box describes channel activation with voltage. At the dashed centerline ΔGO−C = 0 and thus Popen = 0.5, so the voltage at which each curve intersects this line indicates each channel's V1/2.
β1 and the G–V at 0 Ca2+?
With these plots in mind, then, we may consider such questions as why is the BKα+β1 G–V relation at 0 Ca2+ less steep than that of the BKα channel? And what determines the size of the β1-induced G–V shift? And why does it increase as Ca2+ is raised?
Beginning with the first question, we see in Fig. 10 C that in the absence of Ca2+, the BKα+β1 curve (blue) traverses the gating box at a shallower angle than does the BKα curve (red). This makes the BKα+β1 channel's Popen–V relation shallower than that of the BKα channel, and it creates a crossover between the two channels' ΔGO−C–V and Popen–V curves (see inset). Thus, the models recapitulate the data. This type of plot, however, makes it readily apparent why. The BKα+β1 channel's G–V relation is shallower primarily because β1 reduces D, and this brings the shallow part of the BKα+β1 channel's ΔΔGO−C–V relation (Fig. 10 B), now combined with L(V) to yield its ΔGO−C–V relation (Fig. 10 C), into the gating box, while in the BKα channel the larger influence of voltage sensor movement on channel opening places less of this shallow region in the box. Or to put it another way, when β1 is present, the effect of voltage sensor movement on ΔGO−C is reduced, and this causes the channel's Popen–V relation in the absence of Ca2+ to reflect in larger part the shallow voltage dependence of the central conformational change. Thus, in the absence of Ca2+, β1 reduces the BKCa channel's Popen–V slope (or equivalently its G–V slope) because it shifts V hc further leftward than it shifts V ho. Indeed as shown in Fig. 10 E, if this were not the case, if β1 shifted both V hc and V ho equally such that D was unchanged, no crossover would occur, and the two Popen–V relations would have similar slopes with the BKα+β1 curve now standing to the left of the BKα curve (see inset).
Differences between Mouse and Bovine β1 at 0 Ca2+
The converse case it also of interest. Suppose β1 shifted V ho less than we have found it does, say −47 mV rather than −61 mV, while still shifting V hc −71 mV. In this instance (Fig. 10 F) D would be lowered further by β1, and the crossover point would now occur outside the gating box, such that the progress of the hypothetical BKα+β1 channel's ΔGO−C–V curve through the box would be determined almost solely by L(V). That is, in such an instance voltage sensor movement would no longer lower ΔGO−C enough to be observed as a change in Popen, and the channel's ΔGO−C–V relation and its Popen–V relation would reflect predominately z L. This would cause a large rightward G–V shift upon β1 coexpression (Fig. 10 F, inset), which is interesting, because this is what we think occurs with mouse β1.
Here we have studied the effects of the bovine β1 subunit, which under most conditions are very similar to those of the mouse β1. In the absence of Ca2+, however, the G–V curve of the BKα+β1mouse channel is much further right shifted than that of the BKα+β1bovine channel, and it has a much shallower slope (unpublished data). We suggest therefore that perhaps mouse β1 reduces D more than does bovine β1, and this gives rise to their different effects at 0 Ca2+. Indeed, the BKCa β4 subunit also produces a large rightward G–V shift in 0 Ca2+, perhaps for the same reason (Ha et al., 2004).
More generally, however, our data suggest that in the absence of Ca2+, the energy imparted to BKCa channel opening by its voltage sensors (when combined with the effect of voltage on the central conformational change) is just enough to influence opening, but small changes in either the amount of energy required to open the channel (changes in L, or the addition of Ca2+), or how much energy each voltage sensor's movement contributes to channel opening (changes in D), are expected to have a profound effect on the shape and position of the BKCa channel's Popen–V relation.
β1's Effect on the BKCa G–V curve as a Function of Ca2+
Looking again at Fig. 10 C, what is also evident is that if the two ΔGO−C–V curves were shifted downward, steeper parts of each curve would traverse the gating box, and the BKα+β1 curve would lie significantly to the left of the BKα curve. Indeed, this is what occurs with Ca2+ binding. Term 1 of Eq. 15 is plotted in Fig. 11 A as a function of Ca2+. Here we see that as the Ca2+ concentration increases, Ca2+ binding lowers ΔGO−C for the BKα channel ∼6.7 kcal/mol, similar to what voltage sensor movement does (Fig. 10 B), while, owing to its larger K C value, it lowers ΔGO−C for the BKα+β1 ∼8.2 kcal/mol, 22% more. On a plot of ΔGO−C vs. voltage, Ca2+ binding is seen as a downward shift along the energy axis, with a larger shift for higher Ca2+. 1 μM Ca2+, for example, shifts both channel's ΔGO−C–V curves downward 2.4 to 2.8 kcal/mol, such that they each now pass through the gating box at a steeper angle (Fig. 11 C). Thus, for both channels, the increase in G–V steepness observed between 0 and 1 μM Ca2+ (Fig. 2, C and D) is seen here to be due to Ca2+ lowering the energy that the voltage sensors must supply to open the channel that brings a steeper region of the ΔΔGO−C–V relation (Fig. 10 B) into the gating box. The BKα+β1 ΔGO−C–V curve, however, now lies to the left of the BKα curve, because the BKα+β1 channel's voltage sensors are activated at lower voltages.
Notice also in Fig. 11 C that the BKα+β1 curve is shifted downward by Ca2+ slightly more than is the BKα curve, but at 1 μM Ca2+ this effect is not of importance, and if this were not the case (dashed line) the observed G–V shift due to β1 coexpression would be very close to the same. At higher Ca2+ concentrations, however, (Fig. 11, D and E), two things become evident. The downward shifting effect of Ca2+ on both curves means that there will be a leftward G–V shift in response to increases in Ca2+ for both channels, but now, as Ca2+ is increased, the shift will become progressively larger for the BKα+β1 channel. This is due to the β1-induced increase in K C. In fact, indicated with a dashed line in Fig. 11 (D and E) is the ΔGO−C–V curve that would be observed for the BKα+β1 channel if β1 affected only voltage sensing. Thus, at 10 μM Ca2+, there would still be a leftward G–V shift in response to β1 coexpression, but it would not be nearly as far. To highlight this point further, in Fig. 11 F we have plotted the β1-induced V1/2 shift predicted by the BKα and BKα+β1 model channels at 0, 1, 10, and 100 μM Ca2+, and indicated are the percentages of each shift that is due to β1's effects on voltage sensing (green) and Ca2+ binding (yellow). Thus, according to our analysis, the leftward G–V shifts observed in Fig. 2 (D–G) are due to β1's effects on both voltage sensing and Ca2+ binding. At low Ca2+ concentrations, effects on voltage sensing are of primary importance, but at higher Ca2+ concentrations, the percentage of each G–V shift that is due to β1's effects on Ca2+ binding increases until, at 100 μM Ca2+, it is just >50%.
β1's Effects on BKCa Ca2+ Dose–Response Curves
By picking a single voltage on these plots, we can also see why at negative voltages Ca2+ more effectively opens the channel when β1 is present (as shown in Fig. 2, A–C). Examining −40 mV for example, the membrane potential of typical smooth muscle myocyte, 100 μM Ca2+ shifts the BKα ΔGO−C–V curve downward such that ΔGO−C (−40 mV) = 0.96 kcal/mol, which corresponds to a Popen of 0.164 (Fig. 11 E, gray line). With β1 present, the downward shift with 100 μM Ca2+ makes ΔGO−C (−40 mV) = −1.34 kcal/mol, which corresponds to a Popen of 0.907. Thus, Ca2+ more effectively opens the channel at low voltages because it shifts the BKα+β1 channel's ΔGO−C–V curve deeper into the gating box when β1 is present. Part of this is due to β1's effects on voltage sensing, in this case 41%, as if β1 only affecting voltage sensing, Popen at −40 mV and 100 μM Ca2+ would be 0.467, and part is due to its effects on Ca2+ binding, here 59%. At higher voltages, however, +100 mV for example, 100 μM Ca2+ is able to lower both ΔGO−C–V curves enough to fully activate both channels, and thus no difference in maximum Popen is expected. But because at all voltages on average fewer bound Ca2+ are required to maximally activate the channel when β1 is present, at this voltage, as well as almost all others (between ∼−200 and +200 mV), the β1 subunit is expected to increase the apparent affinity of the channel for Ca2+.
Our Results Relative to Previous Work
Studies by Nimigean and Magleby (1999)(2000) at the single channel level have indicated that the β1 subunit shifts the BKCa channel's Ca2+ dose–response curve leftward at +30 mV from an apparent affinity of 9.2 to 2.6 μM (Nimigean and Magleby, 1999 [Fig. 2 A], 2000 [Fig. 2 B]). The models of the BKα and BKα+β1 channels we have produced predict almost an identical shift (9.3 to 2.3 μM). Furthermore, Nimigean and Magleby estimated that 80% of the shift was due to β1's effects on aspects of gating separate from Ca2+ binding, while 20% were due to a Ca2+-dependent effect. Our models suggest a similar ratio (87% voltage sensing, 13% Ca2+ binding). Also they found that at +30 mV, in the absence of Ca2+, β1 increases Popen approximately sevenfold (Nimigean and Magleby, 2000). Our models predict a 12-fold increase. Thus, on the whole, our results are remarkably consistent with those of Nimigean and Magleby. Furthermore, they found that β1 increases Popen by increasing the occupancy of bursting states, which, when interpreted in terms of our results, suggests that voltage sensor activation gives rise to longer bursts of openings.
In a previous study (Cox and Aldrich, 2000) we concluded, based on macroscopic ionic current recordings, that β1 shifted V hc and V ho leftward, qualitatively, as we have observed, but as well probably increased L from 3.4 × 10⁻⁶ to 17.9 × 10⁻⁶ and decreased z J from 0.51 to 0.4. Having now directly measured the movement of the channel's gating charge, however, we no longer think that z J changes upon β1 coexpression, and if there are changes in L they are smaller than we first supposed. We also concluded in this study that β1 reduces the affinity of the channel for Ca2+ when it is closed, but has little or no effect on the affinity of the channel when it is open. As we have discussed, we still think this is correct.
Recently, Orio and Latorre (2005) concluded that the effects of β1 on Ca2+ sensing can be explained entirely by a reduction in z J from ∼0.5e to ∼0.3e, with no effect on Ca2+ binding and no change in V hc. Clearly, this idea is not consistent with our results, as with gating currents, we have directly determined the value of z J to be 0.57e to 0.58e and unchanged by β1 coexpression, and we have found V hc to be shifted 71 mV leftward by β1. Why their conclusions differ from ours is not clear, and it could be due in part to species differences between β1 subunits, as we have used bovine and they used human β1. Perhaps more important, however, in the absence of gating currents they relied in their analysis on the notion that the peak of the BKCa channel's τrelaxation–V relation could not remain at or near the same voltage, if V hc were changing appreciably. But, as can be seen by our fits in Fig. 7 C, this statement is not correct. While it is true that changes in V hc will tend to alter the position of the peak of this curve, it is also true that changes in V ho can, and apparently do, counteract this effect. Also, as evidence that z J is changing with β1 coexpression, Orio and Latorre (2005) sited a change in the maximum slope of the channel's ln(Popen) vs. voltage relation upon β1 coexpression; however, as can be seen in Fig. 8 B (compare solid line to dashed line), we do not observe a clear change in the maximum slope of this relation upon β1 coexpression. Where our two studies agree, however, is in the finding, based in both studies on limiting-Popen measurements, that the voltage dependence of the central conformational changed (z L) is unaltered by β1.
A Structural Hypothesis
While our data do not bear directly on the issue of what physical interactions between α and β1 are required for β1 to stabilize the activated voltage sensor, considerable evidence indicates that the extracellular loop common to all BKCa βs can extend over the α subunit as far as the channel's pore. The extracellular loop of β3 enters and blocks the pore in a voltage-dependent manner (Zeng et al., 2003), and the extracellular loop of β4 prevents charybdotoxin, a pore-blocking peptide, from interacting with the channel (Meera et al., 2000). Thus, it seems reasonable to suppose that the extracellular loop of β1 may interact with the external face of the α subunit as well. Indeed, perhaps it interacts with the voltage sensor at or near the top of S4. If this interaction were specific for the activated voltage sensor, than it would stabilize this position of the voltage sensor and create leftward Q–V shifts as we have observed. How much energy would it take to create such an effect? As it turns out, not very much. The 71-mV leftward V hc shift we have observed with β1 coexpression corresponds to a stabilization of the active voltage sensor by only 0.9 kcal/mol, the energy of a very weak hydrogen bond or a hydrophobic interaction. Thus from an energetic point of view this idea is plausible.
Of course this hypothesis doesn't explain the effects of β1 on Ca2+ binding, and at this point we have none but the most general hypothesis to offer. As the physical nature of the BKα channel's Ca2+ binding sites becomes more clear, however, perhaps how β1 influences one or more of the channel's Ca2+-binding sites will become more clear as well.
Acknowledgments
This work was supported by grant R01HL64831 from the National Institutes of Health.
Olaf S. Andersen served as editor.
Abbreviation used in this paper: BKCa, large-conductance Ca2+-activated K+ channel.
References
- Adelman, J.P., K.Z. Shen, M.P. Kavanaugh, R.A. Warren, Y.N. Wu, A. Lagrutta, C.T. Bond, and R.A. North. 1992. Calcium-activated potassium channels expressed from cloned complementary DNAs. Neuron. 9:209–216. [DOI] [PubMed] [Google Scholar]
- Atkinson, N.S., G.A. Robertson, and B. Ganetzky. 1991. A component of calcium-activated potassium channels encoded by the Drosophila slo locus. Science. 253:551–555. [DOI] [PubMed] [Google Scholar]
- Bao, L., A.M. Rapin, E.C. Holmstrand, and D.H. Cox. 2002. Elimination of the BK(Ca) channel's high-affinity Ca2+ sensitivity. J. Gen. Physiol. 120:173–189. [DOI] [PMC free article] [PubMed] [Google Scholar]
- Bao, L., C. Kaldany, E.C. Holmstrand, and D.H. Cox. 2004. Mapping the BKCa channel's “Ca2+ bowl”: side-chains essential for Ca2+ sensing. J. Gen. Physiol. 123:475–489. [DOI] [PMC free article] [PubMed] [Google Scholar]
- Barrett, J.N., K.L. Magleby, and B.S. Pallotta. 1982. Properties of single calcium-activated potassium channels in cultured rat muscle. J. Physiol. 331:211–230. [DOI] [PMC free article] [PubMed] [Google Scholar]
- Bayguinov, O., B. Hagen, J.L. Kenyon, and K.M. Sanders. 2001. Coupling strength between localized Ca2+ transients and K+ channels is regulated by protein kinase C. Am. J. Physiol. Cell Physiol. 281:C1512–C1523. [DOI] [PubMed] [Google Scholar]
- Behrens, R., A. Nolting, F. Reimann, M. Schwarz, R. Waldschutz, and O. Pongs. 2000. hKCNMB3 and hKCNMB4, cloning and characterization of two members of the large-conductance calcium-activated potassium channel β subunit family. FEBS Lett. 474:99–106. [DOI] [PubMed] [Google Scholar]
- Brenner, R., T.J. Jegla, A. Wickenden, Y. Liu, and R.W. Aldrich. 2000. a. Cloning and functional characterization of novel potassium channel β subunits, hKCNMB3 and hKCNMB4. J. Biol. Chem. 275:6453–6461. [DOI] [PubMed] [Google Scholar]
- Brenner, R., G.J. Perez, A.D. Bonev, D.M. Eckman, J.C. Kosek, S.W. Wiler, A.J. Patterson, M.T. Nelson, and R.W. Aldrich. 2000. b. Vasoregulation by the β1 subunit of the calcium-activated potassium channel. Nature. 407:870–876. [DOI] [PubMed] [Google Scholar]
- Butler, A., S. Tsunoda, D.P. McCobb, A. Wei, and L. Salkoff. 1993. mSlo, a complex mouse gene encoding “maxi” calcium-activated potassium channels. Science. 261:221–224. [DOI] [PubMed] [Google Scholar]
- Cox, D.H., and R.W. Aldrich. 2000. Role of the β1 subunit in large-conductance Ca2+-activated K+ channel gating energetics. Mechanisms of enhanced Ca2+ sensitivity. J. Gen. Physiol. 116:411–432. [DOI] [PMC free article] [PubMed] [Google Scholar]
- Cox, D.H., J. Cui, and R.W. Aldrich. 1997. a. Allosteric gating of a large conductance Ca-activated K+ channel. J. Gen. Physiol. 110:257–281. [DOI] [PMC free article] [PubMed] [Google Scholar]
- Cox, D.H., J. Cui, and R.W. Aldrich. 1997. b. Separation of gating properties from permeation and block in mslo large conductance Ca-activated K+ channels. J. Gen. Physiol. 109:633–646. [DOI] [PMC free article] [PubMed] [Google Scholar]
- Cui, J., and R.W. Aldrich. 2000. Allosteric linkage between voltage and Ca2+-dependent activation of BK-type mslo1 K+ channels. Biochemistry. 39:15612–15619. [DOI] [PubMed] [Google Scholar]
- Cui, J., D.H. Cox, and R.W. Aldrich. 1997. Intrinsic voltage dependence and Ca2+ regulation of mslo large conductance Ca-activated K+ channels. J. Gen. Physiol. 109:647–673. [DOI] [PMC free article] [PubMed] [Google Scholar]
- Diaz, L., P. Meera, J. Amigo, E. Stefani, O. Alvarez, L. Toro, and R. Latorre. 1998. Role of the S4 segment in a voltage-dependent calcium-sensitive potassium (hSlo) channel. J. Biol. Chem. 273:32430–32436. [DOI] [PubMed] [Google Scholar]
- DiChiara, T.J., and P.H. Reinhart. 1995. Distinct effects of Ca2+ and voltage on the activation and deactivation of cloned Ca2+-activated K+ channels. J. Physiol. 489:403–418. [DOI] [PMC free article] [PubMed] [Google Scholar]
- Gurnett, C.A., and K.P. Campbell. 1996. Transmembrane auxiliary subunits of voltage-dependent ion channels. J. Biol. Chem. 271:27975–27978. [DOI] [PubMed] [Google Scholar]
- Ha, T.S., M.S. Heo, and C.S. Park. 2004. Functional effects of auxiliary β4-subunit on rat large-conductance Ca2+-activated K+ channel. Biophys. J. 86:2871–2882. [DOI] [PMC free article] [PubMed] [Google Scholar]
- Hamill, O.P., A. Marty, E. Neher, B. Sakmann, and F.J. Sigworth. 1981. Improved patch-clamp techniques for high-resolution current recording from cells and cell-free membrane patches. Pflugers Arch. 391:85–100. [DOI] [PubMed] [Google Scholar]
- Horrigan, F.T., and R.W. Aldrich. 1999. Allosteric voltage gating of potassium channels II. Mslo channel gating charge movement in the absence of Ca2+. J. Gen. Physiol. 114:305–336. [DOI] [PMC free article] [PubMed] [Google Scholar]
- Horrigan, F.T., and R.W. Aldrich. 2002. Coupling between voltage sensor activation, Ca2+ binding and channel opening in large conductance (BK) potassium channels. J. Gen. Physiol. 120:267–305. [DOI] [PMC free article] [PubMed] [Google Scholar]
- Horrigan, F.T., J. Cui, and R.W. Aldrich. 1999. Allosteric voltage gating of potassium channels I. Mslo ionic currents in the absence of Ca2+. J. Gen. Physiol. 114:277–304. [DOI] [PMC free article] [PubMed] [Google Scholar]
- Hu, L., J. Shi, Z. Ma, G. Krishnamoorthy, F. Sieling, G. Zhang, F.T. Horrigan, and J. Cui. 2003. Participation of the S4 voltage sensor in the Mg2+-dependent activation of large conductance (BK) K+ channels. Proc. Natl. Acad. Sci. USA. 100:10488–10493. [DOI] [PMC free article] [PubMed] [Google Scholar]
- Isom, L.L., K.S. De Jongh, and W.A. Catterall. 1994. Auxiliary subunits of voltage-gated ion channels. Neuron. 12:1183–1194. [DOI] [PubMed] [Google Scholar]
- Knaus, H.G., K. Folander, M. Garcia-Calvo, M.L. Garcia, G.J. Kaczorowski, M. Smith, and R. Swanson. 1994. a. Primary sequence and immunological characterization of β-subunit of high conductance Ca2+-activated K+ channel from smooth muscle. J. Biol. Chem. 269:17274–17278. [PubMed] [Google Scholar]
- Knaus, H.G., M. Garcia-Calvo, G.J. Kaczorowski, and M.L. Garcia. 1994. b. Subunit composition of the high conductance calcium-activated potassium channel from smooth muscle, a representative of the mSlo and slowpoke family of potassium channels. J. Biol. Chem. 269:3921–3924. [PubMed] [Google Scholar]
- McManus, O.B., L.M. Helms, L. Pallanck, B. Ganetzky, R. Swanson, and R.J. Leonard. 1995. Functional role of the β subunit of high conductance calcium-activated potassium channels. Neuron. 14:645–650. [DOI] [PubMed] [Google Scholar]
- Meera, P., M. Wallner, Z. Jiang, and L. Toro. 1996. A calcium switch for the functional coupling between α (hslo) and β subunits (KV,Ca β) of maxi K channels. FEBS Lett. 382:84–88. [DOI] [PubMed] [Google Scholar]
- Meera, P., M. Wallner, and L. Toro. 2000. A neuronal β subunit (KCNMB4) makes the large conductance, voltage- and Ca2+-activated K+ channel resistant to charybdotoxin and iberiotoxin. Proc. Natl. Acad. Sci. USA. 97:5562–5567. [DOI] [PMC free article] [PubMed] [Google Scholar]
- Meredith, A.L., K.S. Thorneloe, M.E. Werner, M.T. Nelson, and R.W. Aldrich. 2004. Overactive bladder and incontinence in the absence of the BK large conductance Ca2+-activated K+ channel. J. Biol. Chem. 279:36746–36752. [DOI] [PubMed] [Google Scholar]
- Morales, S., P.J. Camello, G.M. Mawe, and M.J. Pozo. 2004. Cyclic AMP-mediated inhibition of gallbladder contractility: role of K+ channel activation and Ca2+ signaling. Br. J. Pharmacol. 143:994–1005. [DOI] [PMC free article] [PubMed] [Google Scholar]
- Nelson, M.T., and J.M. Quayle. 1995. Physiological roles and properties of potassium channels in arterial smooth muscle. Am. J. Physiol. 268:C799–C822. [DOI] [PubMed] [Google Scholar]
- Nimigean, C.M., and K.L. Magleby. 1999. β Subunits increase the calcium sensitivity of mSlo by stabilizing bursting kinetics. Biophys. J. 76:A328. [Google Scholar]
- Nimigean, C.M., and K.L. Magleby. 2000. Functional coupling of the β1 subunit to the large conductance Ca2+-activated K+ channel in the absence of Ca2+. Increased Ca2+ sensitivity from a Ca2+-independent mechanism. J. Gen. Physiol. 115:719–736. [DOI] [PMC free article] [PubMed] [Google Scholar]
- Niu, X., and K.L. Magleby. 2002. Stepwise contribution of each subunit to the cooperative activation of BK channels by Ca2+. Proc. Natl. Acad. Sci. USA. 99:11441–11446. [DOI] [PMC free article] [PubMed] [Google Scholar]
- Orio, P., and R. Latorre. 2005. Differential effects of β1 and β2 subunits on BK channel activity. J. Gen. Physiol. 125:395–411. [DOI] [PMC free article] [PubMed] [Google Scholar]
- Qian, X., C.M. Nimigean, X. Niu, B.L. Moss, and K.L. Magleby. 2002. Slo1 tail domains, but not the Ca2+ bowl, are required for the β1 subunit to increase the apparent Ca2+ sensitivity of BK channels. J. Gen. Physiol. 120:829–843. [DOI] [PMC free article] [PubMed] [Google Scholar]
- Rothberg, B.S., and K.L. Magleby. 2000. Voltage and Ca2+ activation of single large-conductance Ca2+-activated K+ channels described by a two-tiered allosteric gating mechanism. J. Gen. Physiol. 116:75–99. [DOI] [PMC free article] [PubMed] [Google Scholar]
- Schreiber, M., and L. Salkoff. 1997. A novel calcium-sensing domain in the BK channel. Biophys. J. 73:1355–1363. [DOI] [PMC free article] [PubMed] [Google Scholar]
- Shen, K.Z., A. Lagrutta, N.W. Davies, N.B. Standen, J.P. Adelman, and R.A. North. 1994. Tetraethylammonium block of Slowpoke calcium-activated potassium channels expressed in Xenopus oocytes: evidence for tetrameric channel formation. Pflugers Arch. 426:440–445. [DOI] [PubMed] [Google Scholar]
- Snetkov, V.A., and J.P. Ward. 1999. Ion currents in smooth muscle cells from human small bronchioles: presence of an inward rectifier K+ current and three types of large conductance K+ channel. Exp. Physiol. 84:835–846. [PubMed] [Google Scholar]
- Stefani, E., M. Ottolia, F. Noceti, R. Olcese, M. Wallner, R. Latorre, and L. Toro. 1997. Voltage-controlled gating in a large conductance Ca2+-sensitive K+ channel (hslo). Proc. Natl. Acad. Sci. USA. 94:5427–5431. [DOI] [PMC free article] [PubMed] [Google Scholar]
- Tanaka, Y., P. Meera, M. Song, H.G. Knaus, and L. Toro. 1997. Molecular constituents of maxi KCa channels in human coronary smooth muscle: predominant α + β subunit complexes. J. Physiol. 502:545–557. [DOI] [PMC free article] [PubMed] [Google Scholar]
- Uebele, V.N., A. Lagrutta, T. Wade, D.J. Figueroa, Y. Liu, E. McKenna, C.P. Austin, P.B. Bennett, and R. Swanson. 2000. Cloning and functional expression of two families of β-subunits of the large conductance calcium-activated K+ channel. J. Biol. Chem. 275:23211–23218. [DOI] [PubMed] [Google Scholar]
- Wallner, M., P. Meera, M. Ottolia, G.J. Kaczorowski, R. Latorre, M.L. Garcia, E. Stefani, and L. Toro. 1995. Characterization of and modulation by a β-subunit of a human maxi KCa channel cloned from myometrium. Receptors Channels. 3:185–199. [PubMed] [Google Scholar]
- Wallner, M., P. Meera, and L. Toro. 1999. Molecular basis of fast inactivation in voltage and Ca2+-activated K+ channels: a transmembrane beta-subunit homolog. Proc. Natl. Acad. Sci. USA. 96:4137–4142. [DOI] [PMC free article] [PubMed] [Google Scholar]
- Wang, Y.W., J.P. Ding, X.M. Xia, and C.J. Lingle. 2002. Consequences of the stoichiometry of Slo1 α and auxiliary β subunits on functional properties of large-conductance Ca2+-activated K+ channels. J. Neurosci. 22:1550–1561. [DOI] [PMC free article] [PubMed] [Google Scholar]
- Weiger, T.M., M.H. Holmqvist, I.B. Levitan, F.T. Clark, S. Sprague, W.J. Huang, P. Ge, C. Wang, D. Lawson, M.E. Jurman, et al. 2000. A novel nervous system β subunit that downregulates human large conductance calcium-dependent potassium channels. J. Neurosci. 20:3563–3570. [DOI] [PMC free article] [PubMed] [Google Scholar]
- Xia, X.M., J.P. Ding, and C.J. Lingle. 1999. Molecular basis for the inactivation of Ca2+- and voltage-dependent BK channels in adrenal chromaffin cells and rat insulinoma tumor cells. J. Neurosci. 19:5255–5264. [DOI] [PMC free article] [PubMed] [Google Scholar]
- Xia, X.M., J.P. Ding, X.H. Zeng, K.L. Duan, and C.J. Lingle. 2000. Rectification and rapid activation at low Ca2+ of Ca2+-activated, voltage-dependent BK currents: consequences of rapid inactivation by a novel β subunit. J. Neurosci. 20:4890–4903. [DOI] [PMC free article] [PubMed] [Google Scholar]
- Xia, X.M., X. Zeng, and C.J. Lingle. 2002. Multiple regulatory sites in large-conductance calcium-activated potassium channels. Nature. 418:880–884. [DOI] [PubMed] [Google Scholar]
- Xu, J., W. Yu, J.M. Wright, R.W. Raab, and M. Li. 1998. Distinct functional stoichiometry of potassium channel β subunits. Proc. Natl. Acad. Sci. USA. 95:1846–1851. [DOI] [PMC free article] [PubMed] [Google Scholar]
- Zeng, X.H., X.M. Xia, and C.J. Lingle. 2003. Redox-sensitive extracellular gates formed by auxiliary β subunits of calcium-activated potassium channels. Nat. Struct. Biol. 10:448–454. [DOI] [PubMed] [Google Scholar]
- Zhang, X., C.R. Solaro, and C.J. Lingle. 2001. Allosteric regulation of BK channel gating by Ca2+ and Mg2+ through a nonselective, low affinity divalent cation site. J. Gen. Physiol. 118:607–636. [DOI] [PMC free article] [PubMed] [Google Scholar]