Abstract
We theoretically investigate the unzipping of DNA electrically driven through a nanometer-size pore. Taking the DNA base sequence explicitly into account, the unpairing and translocation process is described by a biased random walk in a one-dimensional energy landscape determined by the sequential basepair opening. Distributions of translocation times are numerically calculated as a function of applied voltage and temperature. We show that varying these two parameters changes the dynamics from a predominantly diffusive behavior to a dynamics governed by jumps over local energy barriers. The work suggests experimentally studying sequence effects, by comparing the average value and standard deviation of the statistical distribution of translocation times.
INTRODUCTION
Nucleic acids can be driven through the nanopore formed by a heptamer of α-hemolysin reconstituted in a lipid bilayer. Applying a voltage U across the membrane leads to an ion current flowing through the pore. Open-pore currents between 50 and 400 pA are typically measured at 1 M KCl for transmembrane voltages ranging from 30 to 300 mV. The α-hemolysin forms a steady open pore, 1.5 nm in diameter. Therefore, only single-stranded (ss-) DNA or RNA can be threaded through. The ion current through the pore transiently drops during the passage of a nucleic acid; the blocked-pore currents are typically <15% of the open-pore value (1). The blocked-pore current observed for poly-d(A) strands differs from the one observed for poly-d(C) by ∼6% and even stronger differences have been observed between the blocking currents of poly-A and poly-C RNA sequences (2–4). The translocation times of these passages have been measured for different sequences, length, and applied voltages, and were found to be sequence-dependent.
Molecular constructs featuring a duplex part (9–50 basepairs) preceded by a single-stranded overhang of ∼50 bases can be threaded into the pore, transiently held in the pore at a low voltage U, which does not induce unzipping (typically U  20 mV) and subsequently unzipped at higher bias (typically U > 50 mV). The compulsory coupling of DNA translocation to basepair opening leads to an increase by several orders of magnitude in the translocation time compared to the ss-DNA case. These unzipping times have been measured for stationary U and for linear voltage ramps (5–7). Translocation of short DNA hairpins (4–8 basepairs) without single-stranded overhang has also been achieved and interpreted in terms of sequence-dependent melting of the hairpin structure followed by passage of the resulting ss-DNA through the pore. (8).
Most previous theoretical investigations in this field have focused on the translocation of single-stranded nucleic acids. Molecular dynamics simulations with classical force fields (9), coarse-grained molecular dynamics (10), and Brownian dynamics (11) have been performed to understand the effect of base size and DNA orientation on the blocked-pore current and the translocation dynamics. The translocation of polymers across a pore, assuming a sequence heterogeneity described by a random energy landscape, and the translocation of structured RNA/DNA molecules, have been considered theoretically (12,13). All together, these theoretical descriptions account for the major features experimentally observed in ss-DNA translocation.
The translocation of double-stranded DNA, where basepair opening is coupled with ss-DNA translocation, has been tackled in the case of short duplexes where the unzipping process is analytically described as a thermal passage of a single energy barrier, the height and width of which are taken as fitting parameters (7). To fit experimental results on nanopore unzipping of short DNA duplexes (6,7), a two-dimensional multibarrier stochastic model (14) and a microscopic approach based on an extended Kramer's theory with one supplementary free energy parameter (15) have been used. The interplay between the dynamics of translocation and basepairing has been investigated theoretically, using Monte Carlo simulations and analytical methods (16). Effective charge of free energy of DNA inside an ion channel and its relationship with nanopore unzipping (17) and the translocation dynamics of polymers consisting of double-stranded and single-stranded blocks without sequence variation (18) have been studied analytically.
Here we present a theoretical description of nanopore unzipping, which explicitly takes the base sequence of the DNA duplex into account. The work focuses on the effect of the sequence-induced variation in local basepairing energies on the unzipping dynamics of long DNA molecules. Using a Monte Carlo method, we numerically compute the distributions of translocation times for fragments of the λ-phage DNA. We study the influence of the applied voltage and temperature on the shape of the distributions. A rich dynamics is revealed for the coupled unzipping and translocation process, bridging two different asymptotic regimes. One is a predominantly diffusive behavior with a sequence-specific effective diffusion. The other one is a dynamics dominated by pinning of the unzipping by rare events in the basepair sequence, i.e., the appearance of strong energy barriers to be thermally jumped over. The crossover between these regimes is determined by the energy balance between the voltage bias and local basepairing. Although the details of the dynamics depend on the chosen base sequence, the existence of two mixed regimes and the transition between them hold for any complex base sequence. Most results of this article represent testable predictions for future experiments, as explained in the Discussion.
THEORETICAL DESCRIPTION
In this section, we first explain how the unzipping and translocation process is theoretically described by biased random walks in one-dimensional energy landscapes and show how the landscapes are determined from the DNA base sequence and the energy bias across the nanopore. Afterwards the Monte Carlo method used to investigate the dynamics of the unzipping process is presented. The theoretical description is based on classical statistical physics and involves the following free energies.
The first energy, called  measures the work needed to separate the two strands of the DNA duplex from basepair 1 to basepair j. This energy is derived from a theoretical description of the enthalpy and entropy differences (ΔHi, ΔSi) corresponding to the formation of the different DNA basepairs (bps). This description includes nearest-neighbor contributions and is based on thermodynamic parameters obtained from experimental melting profiles of DNA sequences of various base sequences (19,20):
 |
(1) |
The second energy, called W, is the difference in electrostatic potential energy between two bases paired on the cis side of the membrane and two bases, unpaired, one on each side of the membrane. In a simplifying picture, W can be taken proportional to the bias voltage U applied across the membrane, W = QeffU. However, this picture assumes a constant effective charge of the DNA nucleotide in the paired and unpaired situation as well as during the translocation process. In reality, the changes in the local molecular and electrostatic environments are expected to change the counterion distribution on the DNA molecule, thus inducing a spatial dependence of the effective charge. Furthermore, the effective charge of two paired bases differs from twice the effective charge of an unpaired base (21). These effects have to be considered when relating W to the experimental voltage U. There is no direct experimental determination of the effective charge Qeff. In this article, we consider W as our control parameter. Since the experimental parameter is the bias voltage U, we propose an estimation of the proportionality constant Qeff in the Discussion.
The third energy is the thermal energy kBT. This energy influences the time evolution of the system in contact with a reservoir of temperature T (canonical ensemble), as it controls the ratio of the transition rates between two system states n and m,
 |
(2) |
where Gnm is the free energy difference between the two states. The temperature also influences the DNA energies  which describes the effect of the base sequence via Eq. 1.
We consider the following one-dimensional, sequence-dependent energy landscape:
 |
(3) |
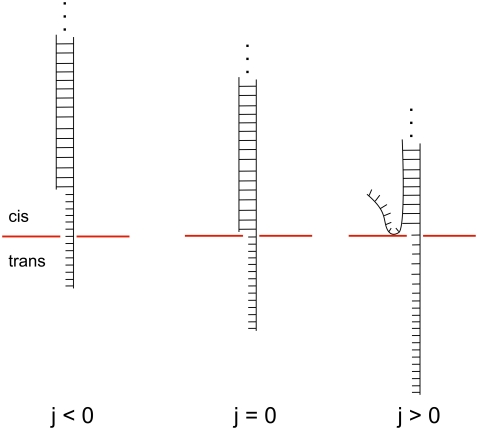
The corresponding situations are illustrated in Fig. 1. The value j = 0 corresponds to a situation where all basepairs of the duplex are closed and where the single-strand overhang is threaded as far as possible into the pore. Negative j corresponds to a duplex that diffused backward in the pore by j bases. For these negative values, ΔHi = ΔSi = 0 and the strand only drifts and diffuses. For positive j, drift and diffusion occurs in combination with unzipping. The term −Wj of Eq. 3 is appropriate if the pore over which the voltage drop occurs is fully occupied by the DNA molecule. In the experimental unzipping configuration this is always the case, except when the last (∼10) nucleotides are leaving the pore at the end of the translocation. Experiments are typically performed at high salt (1 M), where the Debye length is small (∼3 Å) and the conductance of the buffer is large compared to those of the membrane and the pore. The voltage drop across the membrane is then localized within the pore and the electrostatic potential energy of the DNA crossing the pore is proportional to the number of translocated bases j, with negligible corrections due to spatial extension of the strands on each side of the membrane.
FIGURE 1.
Schematic representations of a DNA duplex with a single-stranded overhang inserted into the nanopore.
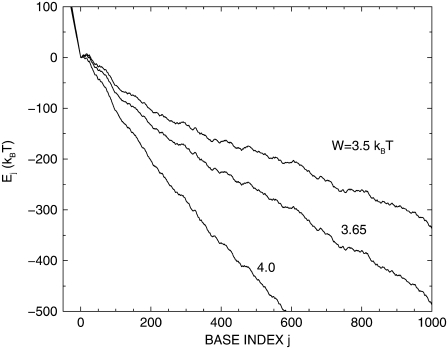
The energy landscapes Ej defined by Eq. 3 are smooth for j < 0, rough for j > 0 and are globally tilted proportionally to the energy gain W, as shown in Fig. 2. In this figure, the total number of basepairs jmax is given by jmax = 1000 and the base sequence of the duplex corresponds to basepairs 1–1000 of the λ-phage DNA. (GenBank accession code is NC 001416. Basepairs 1–12 correspond to the cos sequence GGGCGGCGACCT.) A single-strand overhang of 50 bases is used in all calculations presented in this article and corresponds to the typical length of the poly-A tail used in the experiments.
FIGURE 2.
Energy landscape Ej of a 1000-bp DNA fragment taken from the λ-bacteriophage sequence for three values of the bias parameter W. At j = 0 the duplex is fully closed and the single-stranded overhang is advanced as far as possible into the pore. Negative j corresponds to an entirely closed duplex diffused backward by j nucleotides relative to the j = 0 configuration. Positive j-values describe duplexes with j unzipped basepairs diffused forward by j nucleotides. T = 20°C.
The sliding of the molecule in the pore is theoretically described by a one-dimensional random walk of the j-coordinate. The unzipping happens base after base. We write the transition rates νn,m from a state m to a neighboring state n = m ± 1,
 |
(4) |
This choice fulfills the condition of the detailed balance equation (Eq. 2). We find that other possible choices, for instance, the one used by Cocco et al. (23), do not significantly change the results presented in this article. Since the rezipping time of a partially open duplex (<10−7 s per basepair, (24)) is expected to be short compared to the translocation times of an ss-DNA base in the pore (10−6–10−5 s per base, (25)), our theoretical description does not include backward diffusion of a partially opened duplex. For the sake of simplicity, we use the same attempt frequency for pure diffusion and for coupled diffusion and unzipping.
To study the dynamics of the nanopore unzipping and translocation process, we suppose that at t = 0 the system is prepared in state j = 0. Random real numbers x ∈ (0, 1) are numerically generated and used to obtain a random walk as follows. Two random numbers are used for each step. The first random number x is used to calculate the time interval Δt the system spends in a given state before doing an upward or downward move:
 |
(5) |
The time t is incremented by Δt. The second random number x determines the direction of the step. The base index j is decremented by one if  and incremented by one otherwise. The process is iterated until j reaches the total number jmax of basepairs of the duplex, meaning that the molecule is entirely threaded through. The random walk is then terminated and the corresponding time is called tu.
RESULTS
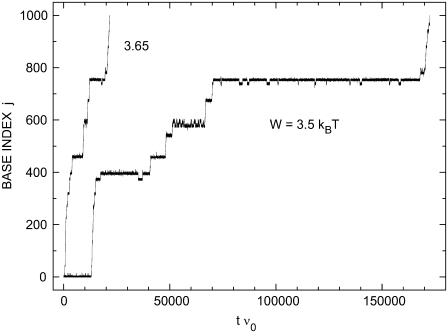
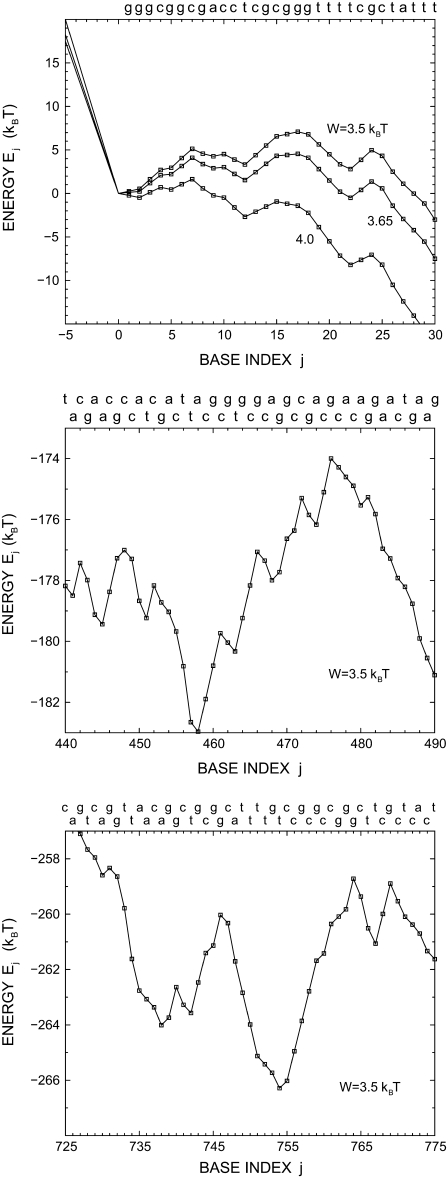
In Fig. 3, two time traces are presented for nanopore unzipping of a 1000-bp DNA duplex. Preferential regions in j, where the opening fork spends considerably more time than elsewhere in j-space, appear in the time evolution. These regions are particularly well pronounced at low bias W. Comparing the corresponding j-values with Fig. 2, we see that they coincide with local minima of the sequence-dependent energy landscape. Closer views of the energy landscapes associated with the plateaus at j  10, at j
  460, and at j
  755 are provided in Fig. 4.
FIGURE 3.
Two examples of individual time evolutions of the position of a DNA duplex in a nanopore. The corresponding energy landscapes Ej are shown in Fig. 2, and zoom images into different regions of these landscapes are provided in Fig. 4. For j = jmax, the duplex is fully unzipped and the resulting single-stranded molecule can go through the pore. T = 20°C, jmax = 1000.
FIGURE 4.
Detailed views on the energy landscapes Ej of a λ-phage DNA duplex in the ranges −5 ≤ j ≤ 30, 440 ≤ j ≤ 490, and 725 ≤ j ≤ 775. For j < 0, the landscapes are simply given by Ej = −Wj. They are smooth and show different slopes according to the three values of W. The corresponding base sequence is given at the top of each figure. T = 20°C.
The two time traces suggest that changing W by 0.15 kBT leads to a remarkable change in the unzipping dynamics. This can be understood as follows. According to Eq. 3, there is a competition between the energy  needed to unzip a basepair and the energy W gained by the associated transfer of one nucleotide across the pore. This competition determines the shape of the energy landscape Ej. The heights of barriers opposing unzipping decrease with increasing W. Such changes in the landscape can dramatically influence the unzipping dynamics due to the exponential energy dependence of the transition rates (Eq. 4).
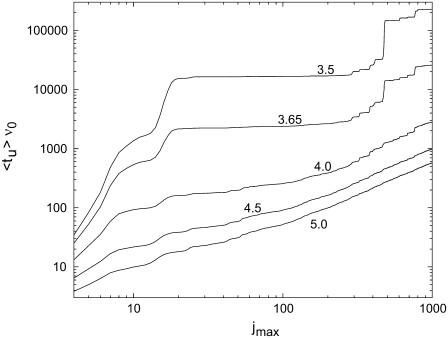
In Fig. 5, we present the first-passage time at base j for the λ-phage DNA sequence, numerically averaged over 10,000 runs. Due to our definition of tu, the first-passage time at base j is equal to the average 〈tu〉 of a fragment of the λ-phage genome from basepair 1 to j. For all values of W, this time 〈tu〉 increases continuously with duplex length.
FIGURE 5.
Average value of the unzipping time as a function of the number jmax of basepairs of the DNA duplex, for different values of W. The sequence of a duplex of length jmax corresponds to the first jmax basepairs of the λ-phage DNA (GenBank accession code is NC 001416. Basepairs 1–12 correspond to the cos sequence GGGCGGCGACCT). T = 20°C.
For the higher values of W, the unzipping time approaches a linear dependence on the number of basepairs. This is expected, since in this regime the bias dominates over the sequence-induced energy variation, leading to a drift with approximately constant velocity.
With decreasing W, the sequence-dependent variations in the energy landscape increase in importance and the system spends an increasing time in the local minima of the landscape. The unzipping time becomes dominated by rare events, i.e., the appearance of important local barriers in the sequence. Pronounced steps and plateaus are then observed in the 〈tu〉 versus jmax dependence. The steps correspond to sequence regions where barriers of several kBT appear in the sense of increasing j. When a high barrier is overcome, the unzipping time reaches a new plateau value, until the next high barrier appears. Particularly marked steps appear at j  15, j
15, j  475, and j
  760. The corresponding high barriers are depicted in Fig. 4. The sequence-dependent localization gives rise to a very strong increase of 〈tu〉 with decreasing W, by 2–3 orders of magnitude for the example presented in Fig. 5.
Due to this pronounced sequence effect, the unzipping time of long duplexes exhibiting complex base sequences is not expected to display a universal dependence on length at weak bias W. In this case, we expect no generic scaling between unzipping time and duplex length, since the unzipping time will be governed by sequence-dependent local pinning of the unzipping. This is because, at small W, the opening fork might be pinned in local minima of the energy landscape, diffuses back and forth, and once the corresponding barrier is overcome, can continue to progress along the sequence.
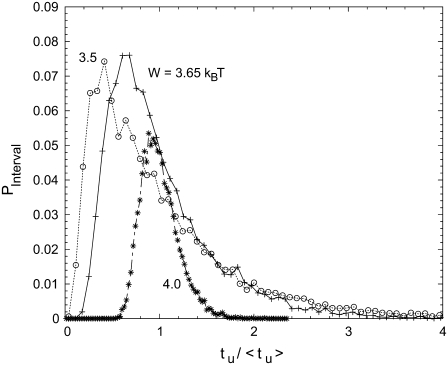
We now suggest a convenient manner to experimentally determine, at fixed W and fixed duplex length, whether the unzipping dynamics is better characterized by stepwise openings or by continuous diffusion. Experimentally, the position of the DNA in the pore can hardly be monitored during the translocation. However, since in the nanopore experiments single molecule events can be recorded rapidly, statistical distributions of unzipping times can be measured efficiently. In Fig. 6, we present the calculated distribution of unzipping times tu. The theoretical description predicts that both the width and the shape of the distribution change with applied bias W. The distribution becomes increasingly asymmetric with decreasing W. An important tail develops at long tu and the maximum of the distribution increasingly deviates from the average value 〈tu〉. This illustrates that relevant information is not only contained in 〈tu〉 but also in the standard deviation.
FIGURE 6.
Histograms of unzipping times obtained for the three energy landscapes of Fig. 2. Each histogram is based on 10,000 individual unzipping traces. T = 20°C, jmax = 500.
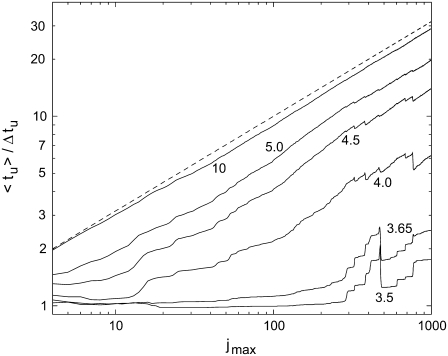
In Fig. 7, the ratio of the average 〈tu〉 and the mean-square deviation  of the unzipping time are presented as a function of duplex length. We propose this ratio as a good parameter to characterize the dynamics of the opening fork in the sequence-dependent landscape. When the opening fork approaches a local barrier of ∼5 kBT or above, marked drops appear in the average/deviation ratio. This is consistent with the analytical limit of 〈tu〉/Δtu = 1 obtained for the case where the unzipping time is governed by the thermal passage across one energy barrier. In the opposite limit, i.e., an energy landscape without sequence dependence, Ej = −Wj, we have (see Appendix)
 |
(6) |
With increasing W, the calculated curves indeed approach a square-root dependence on jmax, while for small W the ratio 〈tu〉/Δtu is confined to values close to unity. It is a notable theoretical prediction that strong bias W represents a favorable condition for measuring 〈tu〉 with small relative error.
FIGURE 7.
Ratio of average value 〈tu〉 and mean-square deviation Δtu of the unzipping time as a function of the number jmax of basepairs, for different values of W. We have  for a sequence-independent energy landscape at W → ∞. This dependence is shown as a dashed line. T = 20°C. The ratio 〈tu〉/Δtu is evaluated over 10,000 individual runs.
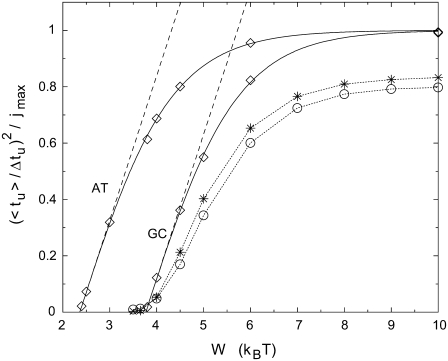
In Fig. 8, the analytical result equation (Eq. 6) is plotted in the form of a normalized square ratio as a function of W for duplexes with AT and GC homosequences (solid lines). The energy landscape is smooth for the homosequences and agreement is achieved between Eq. 6 and corresponding Monte Carlo simulations (diamonds). Close to threshold, the normalized square ratio increases linearly with W, a behavior expected from the Einstein relation. The corresponding slope, being the same for the AT and GC homosequences in the frame of this model, can be used to experimentally determine the effective charge Qeff. The appearance of significant negative curvature with increasing W and the asymptotic saturation  illustrate the breakdown of linear response at strong bias. Sequence-induced variations in Ej lead to a nonlinear increase at low W (stars and circles). Interestingly, the major part of the two curves for complex bases sequence do not lie between the poly(A) and poly(G) results, although the average
  of the complex sequences are between the
  values of AT and GC. This illustrates that, the local energy barriers lead to nonnegligible corrections for all W.
FIGURE 8.
Normalized square of the average/deviation ratio of the unzipping time as a function of bias W. Analytical results for duplexes with homogeneous sequences, a sequence of AT basepairs and a sequence of GC basepairs, are shown as solid lines. Corresponding Monte Carlo results (jmax = 500) are presented as diamonds. The linear regime close to threshold is the validity range of the Einstein relation (linear response regime, where tanh(x)  x). Monte Carlo results for the sequence of the first 500 bp (100 bp) of the λ-phage DNA are represented by stars (circles). Monte Carlo results are computed over 10,000 runs. T = 20°C.
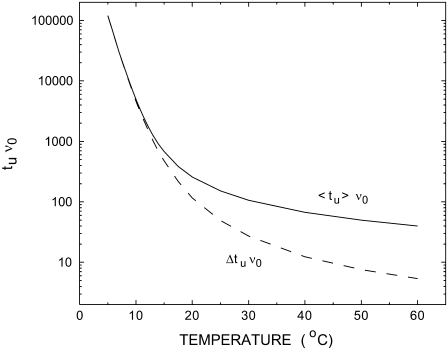
Localization in the sequence-dependent energy landscape is predicted not only for decreasing W, but also when the temperature is reduced at constant W. In the case illustrated in Fig. 9, the average 〈tu〉 for nanopore unzipping of a 100-bp duplex increases by more than three orders of magnitude for a temperature reduction from 60°C to 5°C. This strong effect mainly arises from the temperature dependence of  (the entropic term in Eq. 1), which modifies the energy landscape Ej. Increasing temperature reduces
  and thus shifts the balance between
  and W toward unzipping. The transition rates νnm also exhibit a 1/T temperature dependence (Eq. 4). This direct dependence is, however, of minor importance in our case, because the relative changes in kBT are rather small in the experimentally accessible temperature range.
FIGURE 9.
Temperature dependence of the average 〈tu〉 and mean-square deviation Δtu of the unzipping time. The average and the mean-square deviation are computed over 10,000 runs. W = 4 kBT, jmax = 100.
DISCUSSION
The physics studied in this article is related to force-induced, mechanical unzipping of DNA. There our parameter W corresponds to the mechanical work Fl: the force F pulls in a configuration to separate the two complementary strands of an individual DNA molecule and l stands for the corresponding increase in length. Mechanical DNA unzipping has been studied theoretically (23,26–28) and sequence-dependent force signals have been obtained in mechanical unzipping experiments (29,30). Sequence-dependent plateaus have been observed in the time-evolution of the unzipping force after sudden displacement steps (31) and measurements at constant force showed that the unzipped length as a function of time is characterized by sequence-dependent jumps and pauses (32).
There are important differences between force-induced and nanopore unzipping. Application of a force to two extremities of a DNA construct induces a molecular stick-slip motion due to significant couplings between the elastic elements in series with the complex unzipping landscape (33). In nanopore unzipping, the energy gain develops gradually along the pore and depends on the detailed molecular configuration of the pore and on the electrostatic screening in the aqueous environment. Thermal fluctuations of the pore may also play a role. In force-induced unzipping, force and displacement can be imposed or measured, while in nanopore unzipping W and the extension of the DNA inside the pore are not measured directly. On the other hand, it is much easier by nanopore unzipping than by force measurements to record many single molecule events and thus to measure the corresponding statistical distributions. Until now, unzipping time distributions have been published only for short duplexes (∼10 basepairs), where the unzipping process could be described as a thermal passage across a single energy barrier. We expect that for longer duplexes the effects discussed in this article would be experimentally observable. This would offer a frame to experimentally investigate one-dimensional biased diffusion in complex landscapes, a field that received tremendous theoretical interest (34) with the advantage of a tunable landscape, by adjusting the basepair sequence.
Our theoretical description of nanopore unzipping contains two parameters, the attempt frequency ν0 and the energy gain W. For comparison with future experiments, it is useful to know the order of magnitude of these parameters. We estimate them by comparison with two different sets of measurements on the translocation of ss-DNA, as follows.
To compare the calculated dimensionless quantity tuν0 with measured translocation times, one needs an estimate of the attempt frequency ν0. Different approaches can be used. Mathé et al. (35) determined experimentally the diffusion constant D  1.8 × 10⁻¹⁰ cm2/s of an ss-DNA molecule in the α-hemolysin nanopore at zero bias voltage. The authors threaded a DNA strand exhibiting a terminal hairpin structure into a pore and measured the time until the molecule diffused backward out of the pore at zero applied bias voltage. The relation D = a2ν0, with a literature value of a = 0.43 nm for the DNA length per nucleotide (36,37), leads us to ν0
  1.0 × 10⁵ Hz. Attempt frequencies in the range of 104 Hz have been obtained from single molecule force measurements on the dynamics of the DNA duplex formation (31) and fluorescence-quenching measurements of thermal fluctuations of DNA hairpins (24). The molecular configurations of these experiments, however, differ from the case of nanopore unzipping.
To estimate the energy gain W, we use the measured diffusion constant D in combination with a measurement of the translocation time at nonzero bias voltage. For a poly-d(A)90 segment at U = 120 mV, a translocation time of 0.5 ms was obtained (6). This allows us to estimate an average translocation velocity 〈v〉  7.7 × 10⁻⁵ m/s. This velocity is related to the energy gain W through the friction coefficient γ of the ss-DNA molecule in the α-hemolysin pore. Using the Einstein relation, we thus write
 |
and finally obtain  for the translocation of a DNA single strand at U = 120 mV. At large external forces, the Einstein relation is not sufficient. A standard theoretical description of biased diffusion then gives
 |
which, in our case, results in a slightly reduced value of  With the definition W = QeffU, this leads to
  —an effective charge per nucleotide comparable in order of magnitude to the value of 0.19, estimated by Mathé et al. (7) from the temperature dependence of the unzipping voltage of short DNA oligonucleotide duplexes measured with linear voltage ramps.
For a derivation of the previous relation, see the Appendix of this article. Equation 9 gives 〈v〉 = 〈j〉 a/t = aν02 sinh(βW/2). With D = a2ν0, this directly implies the expression sought after: βW = 2 sinh−1(〈v〉 a/(2D)). The low force (linear response) limit of this relation corresponds to the approximate expression βW = 〈v〉 a/D, which we derived using the Einstein relation.
Having discussed the two parameters ν0 and W, we now consider the relation between our theoretical results and future experiments. Actually all results presented in Figs. 5–9 are testable predictions for future measurements. Distributions of unzipping times can be measured with individual α-hemolysin nanopores and the calculated quantities 〈tu〉 and Δtu can be determined from the distributions. The bias parameter W can be varied easily by varying the voltage applied across the pore; the two quantities are directly related as discussed in the preceding paragraph. It has been shown that unzipping of DNA by translocation through α-hemolysin nanopores can be measured for temperatures ranging from 5°C to 40°C. In Fig. 9, we predict the crossover between the two different unzipping regimes to occur in this temperature interval, concomitant with significant variations in 〈tu〉 and Δtu.
Most important for the main topics of this article is the fact that the length and base sequence of the DNA to be unzipped can be chosen at will, thanks to well-known techniques of molecular biology and oligonucleotide synthesis. Very short duplexes (up to ∼30 bp) can be obtained simply by synthesis of oligonucleotides exhibiting sequences that spontaneously form hairpin structures. Somewhat longer constructs (up to ∼80 bp) can be obtained by hybridization of oligonucleotide sequences. Even longer duplexes (up to several thousands of bp) can be prepared using PCR or cloning techniques. For example, for length-dependent measurements corresponding to Figs. 5 and 7, a series of duplexes of increasing length could be amplified by PCR from a λ-phage DNA substrate, using a common forward primer and a series of different reverse primers.
CONCLUSIONS
In summary, a dynamical model, based on Monte Carlo calculations, has been used to theoretically study the sequence dependence of nanopore unzipping of DNA. The unzipping time tu, its average value and statistical distribution and the corresponding motion of the DNA construct in the pore, have been studied as a function of applied bias, length, and sequence of the duplex and temperature. The theoretical study indicates that the process of nanopore unzipping involves a rich sequence-dependent dynamics. It predicts an increase of 〈tu〉 by several orders of magnitude with decreasing W and with decreasing temperature T. It suggests experimental studies of sequence effects, by measuring the statistical distribution of unzipping times and comparing average values and mean-square deviations.
Acknowledgments
We thank A. Ajdari and R. Monasson for helpful discussions.
The Nanobiophysics lab of Ecole Supérieure de Physique et Chimie Industrielles de la Ville de Paris (member of PARISTECH) is associated with the Centre National de la Recherche Scientifique (UMR Gulliver, 7083).
APPENDIX
This Appendix contains a derivation of Eq. 6. In the absence of sequence effects, Eq. 3 simplifies to Ej = −Wj. With Eq. 4 this suggests the definition of two transition rates, one (P+) for a downhill and one (P–) for an uphill move,
 |
(7) |
where β = (kBT)−1. After a time t, the system has made an average number of steps
 |
(8) |
and the average number of unzipped basepairs amounts to
 |
(9) |
To calculate the corresponding standard deviation Δj, we first evaluate
 |
(10) |
The quantity δjn here gives the direction of the nth step and equals 1 for a forward and −1 for a backward move. Equations 8 and 9 then directly lead to
 |
(11) |
Neglecting higher-order corrections (this corresponds to neglecting the difference between mean time and mean first-passage time), we have for the first-passage time tu of a duplex of jmax basepairs
 |
(12) |
and
 |
(13) |
This finally leads to the expression sought after,
 |
(14) |
In the limit of strong bias, W ≫ kBT, the ratio approaches the asymptotic relation  plotted as a dashed line in Fig. 7.
Editor: Klaus Schulten.
References
- 1.Kasianowicz, J., E. Brandin, D. Branton, and D. Deamer. 1996. Characterization of individual polynucleotide molecules using a membrane channel. Proc. Natl. Acad. Sci. USA. 98:13770–13773. [DOI] [PMC free article] [PubMed] [Google Scholar]
- 2.Meller, A., L. Nivon, E. Brandin, J. Golovchenko, and D. Branton. 2000. Rapid nanopore discrimination between single polynucleotide molecules. Proc. Natl. Acad. Sci. USA. 97:1079–1084. [DOI] [PMC free article] [PubMed] [Google Scholar]
- 3.Akeson, M., D. Branton, J. J. Kasianowicz, E. Brandin, and D. Deamer. 1999. Microsecond time-scale discrimination among polycytidylic acid, polyadenylic acid, and polyuridylic acid as homopolymers or as segments within single RNA molecules. Biophys. J. 77:3227–3233. [DOI] [PMC free article] [PubMed] [Google Scholar]
- 4.Ashkenasy, N., J. Sánchez-Quesada, H. Bayley, and M. R. Ghadiri. 2005. Recognizing a single base in an individual DNA strand: a step toward DNA sequencing in nanopores. Angew. Chem. Int. Ed. 44:1401–1404. [DOI] [PMC free article] [PubMed] [Google Scholar]
- 5.Sauer-Budge, A. F., J. A. Nyamwanda, D. K. Lubensky, and D. Branton. 2003. Unzipping kinetics of double-stranded DNA in a nanopore. Phys. Rev. Lett. 90:238101. [DOI] [PubMed] [Google Scholar]
- 6.Mathé, J., H. Visram, V. Viasnoff, Y. Rabin, and A. Meller. 2004. Nanopore unzipping of individual DNA hairpin molecules. Biophys. J. 87:3205–3212. [DOI] [PMC free article] [PubMed] [Google Scholar]
- 7.Mathé, J., A. Arinstein, Y. Rabin, and A. Meller. 2006. Equilibrium and irreversible unzipping of DNA in a nanopore. Europhys. Lett. 73:128–134. [Google Scholar]
- 8.Vercoutere, W., S. Winter-Hilt, H. Olsen, D. Deamer, D. Haussler, and M. Akeson. 2001. Rapid discrimination among individual DNA hairpin molecules at single-nucleotide resolution using an ion channel. Nat. Biotechnol. 19:248–252. [DOI] [PubMed] [Google Scholar]
- 9.Aksimentiev, A., and K. Schulten. 2005. Imaging α-hemolysin with molecular dynamics: ionic conductance, osmotic permeability, and the electrostatic potential map. Biophys. J. 88:3745–3761. [DOI] [PMC free article] [PubMed] [Google Scholar]
- 10.Matysiak, S., A. Montensi, M. Pasquali, A. B. Kolomeisky, and C. Clementi. 2006. Dynamics of Polymer Translocation through nanopores: theory meets experiment. Phys. Rev. Lett. 96:118103. [DOI] [PubMed] [Google Scholar]
- 11.Muthukumar, M. 2007. Mechanism of DNA transport through pores. Annu. Rev. Biophys. Biomol. Struct. 36:435–450. [DOI] [PubMed] [Google Scholar]
- 12.Kafri, Y., D. K. Lubensky, and D. R. Nelson. 2004. Dynamics of Molecular Motors and Polymer Translocation with Sequence Heterogeneity. Biophys. J. 86:3373–3391. [DOI] [PMC free article] [PubMed] [Google Scholar]
- 13.Gerland, U., R. Bundschuh, and T. Hwa. 2004. Translocation of structured polynucleotides through nanopores. Phys. Biol. 1:19–26. [DOI] [PubMed] [Google Scholar]
- 14.Lakatos, G., T. Chou, B. Bergersen, and G. N. Patey. 2005. First passage times of driven DNA hairpin unzipping. Phys. Biol. 2:166–174. [DOI] [PubMed] [Google Scholar]
- 15.Dudko, O. K., J. Mathé, A. Szabo, A. Meller, and G. Hummer. 2007. Extracting kinetics from single-molecule force spectroscopy: nanopore unzipping of DNA hairpins. Biophys. J. 92:4188–4195. [DOI] [PMC free article] [PubMed] [Google Scholar]
- 16.Bundschuh, R., and U. Gerland. 2005. Coupled dynamics of RNA folding and nanopore translocation. Phys. Rev. Lett. 95:208104. [DOI] [PubMed] [Google Scholar]
- 17.Zhang, J., and B. I. Shklovskii. 2007. Effective charge and free energy of DNA inside on ion channel. Phys. Rev. E Stat. Nonlin. Soft Matter Phys. 75:021906. [DOI] [PubMed] [Google Scholar]
- 18.Kotsev, S., and A. B. Kolomeisky. 2006. Effect of orientation in translocation of polymers through nanopores. J. Chem. Phys. 125:084906. [DOI] [PubMed] [Google Scholar]
- 19.SantaLucia, J. 1998. A unified view of polymer, dumbbell, and oligonucleotide DNA nearest-neighbor thermodynamics. Proc. Natl. Acad. Sci. USA. 95:1460–1465. [DOI] [PMC free article] [PubMed] [Google Scholar]
- 20.SantaLucia, J., and D. Hicks. 2004. The thermodynamics of DNA structural motifs. Annu. Rev. Biophys. Biomol. Struct. 33:415–440. [DOI] [PubMed] [Google Scholar]
- 21.Manning, J. S. 1978. The molecular theory of polyelectrolyte solutions with applications to the electrostatic properties of polynucleotides. Q. Rev. Biophys. 11:179–246. [DOI] [PubMed] [Google Scholar]
- 22.Reference deleted in proof.
- 23.Cocco, S., J. F. Marko, and R. Monasson. 2003. Slow nucleic acid unzipping kinetics from sequence-defined barriers. Eur. Phys. J. E. 10:153–161. [DOI] [PubMed] [Google Scholar]
- 24.Goddard, N. L., G. Bonnet, O. Krichevsky, and A. Libchaber. 2000. Sequence-dependent rigidity of single-stranded DNA. Phys. Rev. Lett. 85:2400–2403. [DOI] [PubMed] [Google Scholar]
- 25.Meller, A., L. Nivon, and D. Branton. 2001. Voltage-driven DNA translocation through a nanopore. Phys. Rev. Lett. 86:3435–3438. [DOI] [PubMed] [Google Scholar]
- 26.Viovy, J.-L., Ch. Heller, F. Caron, Ph. Cluzel, and D. Chatenay. 1994. Sequencing of DNA by mechanical opening of the double helix: a theoretical evaluation. C. R. Acad. Sci. Paris. 317:795–800. [PubMed] [Google Scholar]
- 27.Thompson, R. E., and E. D. Siggia. 1995. Physical limits on the mechanical measurement of the secondary structure of biomolecules. Europhys. Lett. 31:335–340. [Google Scholar]
- 28.Lubensky, D. K., and D. R. Nelson. 2000. Pulling pinned polymers and unzipping DNA. Phys. Rev. Lett. 85:1572–1575. [DOI] [PubMed] [Google Scholar]
- 29.Essevaz-Roulet, B., U. Bockelmann, and F. Heslot. 1997. Mechanical separation of the complementary strands of DNA. Proc. Natl. Acad. Sci. USA. 94:11935–11940. [DOI] [PMC free article] [PubMed] [Google Scholar]
- 30.Bockelmann, U., Ph. Thomen, B. Essevaz-Roulet, and F. Heslot. 2002. Unzipping DNA with optical tweezers: high sequence sensitivity and force flips. Biophys. J. 82:1537–1553. [DOI] [PMC free article] [PubMed] [Google Scholar]
- 31.Bockelmann, U., Ph. Thomen, and F. Heslot. 2004. Dynamics of the DNA duplex formation studied by single molecule force measurements. Biophys. J. 87:3388–3396. [DOI] [PMC free article] [PubMed] [Google Scholar]
- 32.Danilowicz C., V. W. Coljee, C. Bouzigues, D. K. Lubensky, D. R. Nelson, and M. Prentiss. 2003. DNA unzipped under a constant force exhibits multiple metastable intermediates. Proc. Natl. Acad. Sci. USA. 100:1694–1699. [DOI] [PMC free article] [PubMed] [Google Scholar]
- 33.Bockelmann, U., B. Essevaz-Roulet, and F. Heslot. 1997. Molecular stick-slip motion revealed by opening DNA with picoNewton forces. Phys. Rev. Lett. 79:4489–4492. [Google Scholar]
- 34.Bouchaud, J. P., and A. Georges. 1990. Anomalous diffusion in disordered media: statistical mechanisms, models and physical applications. Phys. Rep. 4:127. [Google Scholar]
- 35.Mathé, J., A. Aksimentiev, D. R. Nelson, K. Schulten, and A. Meller. 2005. Orientation discrimination of single-stranded DNA inside the α-hemolysin membrane channel. Proc. Natl. Acad. Sci. USA. 102:12377–12382. [DOI] [PMC free article] [PubMed] [Google Scholar]
- 36.Tinland, B., A. Pluen, J. Sturm, and G. Weill. 1997. Persistence length of single-stranded DNA. Macromolecules. 30:5763–5765. [Google Scholar]
- 37.Record, M. T., Jr., C. F. Anderson, and T. M. Lohmann. 1978. Thermodynamics analysis of ion effects on the binding and conformational equilibria of proteins and nucleic acids: the role of ion association or release, screening, and ion effects on water activity. Q. Rev. Biophys. 11:103–178. [DOI] [PubMed] [Google Scholar]


