Abstract
A serum free medium was developed for the production of recombinant antibody against Botulinum A (BoNTA) using dihydrofolate reductase deficient Chinese Hamster Ovary Cells (CHO-DG44) in suspension culture. An initial control basal medium was prepared, which was similar in composition to HAM’s F12: IMDM (1:1) supplemented with insulin, transeferrin, selenium and a lipid mixture. The vitamin concentration of the basal medium was twice that of HAM’s F12: IMDM (1:1). CHO-DG44 cells expressing S25 antibody grew from 2 × 10⁵ cells to maximum cell density of 1.04 × 10⁶ cells/ml after 5 days in this control medium. A central composite design was used to identify optimal levels and interaction among five groups of medium components. These five groups were glutamine, Essential Amino Acids (EAA), Non Essential Amino Acids (NEAA), Insulin, Transferrin, Selenium (ITS), and lipids. Fifty experiments were carried out in four batches, with two controls in each batch. There was little effect of ITS and Lipid concentrations over the range studied, and glutamine concentration showed a strong interaction with EAA. The optimal concentrations of the variables studied were 2.5 mM Glutamine, 7.4 mM (2×) EAA, 1.4 mM (0.5×) NEAA, 1× ITS supplement, 0.7× Lipids supplement. The maximum viable cell density attained in the optimized medium was 1.4 × 10⁶ cells/ml, a 35% improvement over the control culture, while the final antibody titer attained was 22 ± 3.4 μg/mL, a 50% improvement.
Keywords: Response surface method, Media optimization
Introduction
Botulinum neurotoxin, produced by the anaerobic Clostridium botulinum, is one of the most potent toxins known to humans (Franz et al. 1997; Gill 1982). Clostridium botulinum produces seven antigenically distinct neurotoxins (A–G) differentiated serologically by specific neutralization (Hatheway 1990). The active neurotoxin is synthesized as two polypeptide chains, a heavy chain (100 KDa) and a light chain (50 KDa), connected via disulfide linkage (DasGupta and Sathyamoorthy 1984; Syuto and Kubo 1981). Recombinant monoclonal antibodies (mAb) can neutralize the effects of BoNT A without requiring human donors for plasmapheresis (Lang et al. 1993). Potent neutralizing monoclonal antibodies were identified recently, characterized, cloned and expressed in Chinese Hamster Ovary (CHO) cells to yield humanized mAbs (Nowakowski et al. 2002).
The large-scale, commercial production of therapeutically important proteins from rCHO cells typically involves a suspension culture-based manufacturing process (Sinacore et al. 1996). It is desirable to use serum-free medium in suspension culture because serum can cause problems in subsequent processes (Glassy et al. 1988; Keen and Rapson 1995). However, there is no universal serum-free medium applicable to all cell lines. There is need to develop specific medium suitable for each cell line (Hayter et al. 1991; Zang et al. 1995).
The medium used for animal cell culture is very complex. Further, as the impact of medium components on cell growth or product synthesis is rather difficult to fully elucidate, statistical methods are adopted to develop a medium for cell culture that offers optimal viable cell density and product formation. The traditional one-factor-at-a-time approach to optimization is time-consuming and incapable of reaching the true optimum especially because of interactions among the factors that influence the growth process. Moreover, this approach assumes that the various growth parameters do not interact and the process response is a direct function of a single varied parameter (Castro et al. 1992; Freshney 1994). In reality, the observed behavior of growth results from the interactive influences of the various variables (Chen et al. 2002). To be effective, optimization requires statistical methods that take these interactions into account.
Response surface methodology (RSM), an experimental strategy for seeking the optimum conditions for a multivariable system, is a much more efficient technique for optimization (Box et al. 1978). RSM comprises of mathematical and statistical procedures that can be used to study relationships between one or more responses and a number of independent variables. In addition to analyzing the effects of independent variables, this experimental methodology generates a mathematical model that accurately describes the overall process (Myers and Montgomery 1995; Senanayake and Shahidi 2002). RSM has been employed to solve multivariate problems and optimize responses in many types of experiments (Maddox and Richert 1977; Giovanni 1983; Houng et al. 1989). In this approach, concentrations of medium components are the variables; each variable refers to some base value and varies in a certain pattern. This pattern is designed by using statistical methods to yield the most information by a minimum number of experiments.
In this study, we have adopted a RSM approach to locate the optimum levels of Glutamine, Essential Amino Acids (EAA), Non-Essential Amino Acids (NEAA), Insulin, Transferrin, Selenium (ITS), and Lipids. Our objective is to gain insight into the interactions among these factors that significantly impact the response and viable cell density. Glutamine acts as the primary source of nitrogen as well as an additional carbon and energy source. It contributes precursors to the formation of the major intracellular binding blocks: amino acids, proteins. Approximately 30–65% of the cell energy requirement is derived from glutamine metabolism (Zielke et al. 1984; Reitzer et al. 1979). Amino acids are primary sources of nitrogen that protect cells from nutrient deprivation (Franek and Sramkova 1996), elevated osmolarity (Øyaas et al. 1994) and elevated pCO2 (de Zengotitia et al. 2002). Insulin serves as a growth and maintenance factor and is considered to be important for serum-free cultures (Schubert 1979). Insulin stimulates uridine and glucose uptake and synthesis of RNA, proteins and lipids; it also increases fatty acid and glycogen synthesis (Mather and Sato 1979). Transferrin is one of the most essential growth-promoting supplements in serum-free medium, and its omission causes severe inhibition of cell growth (Kovar and Franek 1984). Transferrin is an iron binding glycoprotein that interacts with surface receptors. It is closely related to the transport of iron across the plasma membrane (Bretscher 1985). Transferrin has additional in-vitro functions, e.g., chelation of deleterious trace materials, that are unlikely replaced by other components. Selenium is a trace element essential for mammalian cell cultures (Nielsen et al. 1981); its mechanism is poorly understood. There is evidence that selenium enhances growth rate in serum free-cultures (Darfler and Insel 1983). Lipids are required for proliferation, differentiation, and antibody secretion. They play a major role in the cell membrane which is composed of a phospholipid bilayer, and help in the transmission of nutrients into the cell and excretion of proteins out the cell (Farrant et al. 1984). The major functions exhibited by the variables motivated us to choose the response surface methodology in order to observe the higher order interactions that would maximize the response. Results were analyzed statistically by SAS and optimum conditions were selected graphically. Interactions among these factors were also examined.
Materials and methods
Cell line and medium
CHO-DG44 cells, which are dhfr negative, were obtained as a gift from Dr. Larry Chasin (Columbia University). The parental cell line was obtained by weaning CHO-DG44 from the serum according to standard cell culture techniques. The base medium used during the weaning process was a commercial serum-free medium, CHO-S-SFMII, known to contain animal-derived proteins and hydrolysates. The process of weaning CHO-DG44 of its serum dependence lasted approximately 4–5 months. The resulting cell line was used as the starting point for all subsequent development efforts including recombinant cell line generation, medium development studies. The recombinant cell line was constructed by inserting the chimeric light and heavy chain IgG genes against BoNT serotype A, along with the gene for dhfr into the plasmid pcDNA3.1(+) (Invitrogen, Carlsbad/CA) and the procedures are detailed elsewhere (Mowry et al. 2004). Recombinant cell lines were derived from our parent cell line using standard molecular biology techniques.
Medium
The basal medium was prepared similar to the HAM’s F12: IMDM (1:1) medium excluding Hypoxanthine and Thymidine, by adding components separately. The concentration of the inorganic salts and other components such as linoleic acid, lipoic acid, phenol red, putrescine 2HCl, sodium pyruvate, and HEPES is the same as with HAM’s F12:IMDM (1:1). The concentrations of the glucose and glutamine in the starting basal medium were 4 g/L and 4 mM, respectively. For amino acids the medium was supplemented with 1.75× of EAA and 1.75× of NEAA, which come from Gibco as 50× and 100× solutions respectively. The concentrations of individual amino acids in EAA (50×) and NEAA (100×) solutions are given in Table 1. The additional components added to the basal medium are vitamins, the concentrations of which were double those in HAM’s F12:IMDM (1:1), 1× (ITS), and 0.7× Lipids Supplement, which come as 100× solutions from Gibco. The concentration of the individual components in ITS and Lipids Supplements are given in the Table 1. The composition of the complete basal medium is given in Table 2.
Table 1.
Composition of the individual components in mg/L in the solutions EAA, NEAA, ITS, Lipids, concentrated solutions from Gibco
| (50×) EAA [mg/L] | (100×) NEAA [mg/L] | (100×) ITS [mg/L] | (100×) Lipids [mg/L] |
|---|---|---|---|
| l-Arginine [6320] | l-Alanine [890] | Insulin [1000] | Arachidonic acid [2] |
| l-Cystine[1200] | l-Asparagine[1320] | Transferrin [0.67] | Cholestrol [220] |
| l-Histidine × HCl × H2O [2100] | l-Aspartic acid [1330] | Selenium [0.55] | DL-alpha-tocopherol-acetate [70] |
| l-Isoleucine [2620] | l-Glutamic acid [1470] | Linoleic acid [10] | |
| l-Leucine [2620] | Glycine [750] | Linolenic acid [10] | |
| l-Lysine HCl [3625] | l-Proline [1150] | Myristic acid [10] | |
| l-Methionine [755] | l-serine [1050] | Oleic acid [10] | |
| l-Phenylalanine [1650] | Palitoelic acid [10] | ||
| l-Threonine [2380] | Palmitic acid [10] | ||
| l-Tryptophan [510] | Pluronic [0.1%] | ||
| l-Tyrosine [1800] | Stearic acid [10] | ||
| l-Valine [2340] | Tween 80 [2200] |
Table 2.
Concentrations of the components in the control medium
| Components | Composition [mg/mL] | Components (contd.) | Composition [mg/mL] |
|---|---|---|---|
| CaCl2 (anhyd.) | 99.1 | l-Phenylalanine | 57.7 |
| CuSO4 × 5H2O | 0.00125 | l-Proline | 20.12 |
| FeSO4 × 7H2O | 0.415 | l-Serine | 18.37 |
| KCl | 276.8 | l-Threonine | 83.3 |
| MgCl2 (anhyd.) | 28.61 | l-Tryptophan | 17.8 |
| NaCl | 5500 | l-Tyrosine × 2Na × 2H2O | 63 |
| NaHCO3 | 2100 | l-Valine | 81.9 |
| Na2HPO4 (anhyd.) | 71 | Biotin | 0.02 |
| Na2HPO4 × H2O | 62.5 | D-Ca Pantothenate | 4 |
| ZnSO4 × 7H2O | 0.43 | Choline chloride | 18 |
| KNO3 | 0.038 | Folic acid | 4 |
| MgSO4 (anhyd.) | 50.8 | i-Inositol | 25.2 |
| Na2SeO3 | 0.0085 | Niacinamide | 4 |
| d-glucose | 4000 | Pyridoxine HCl | 4 |
| Linoleic acid | 0.04 | Riboflavin | 0.4 |
| Lipoic acid | 0.105 | Thiamine HCl | 4 |
| Phenol Red | 8.1 | Vitamin B12 | 1.413 |
| Putrescine 2HCl | 0.0805 | Insulin | 10 |
| Sodium pyruvate | 110 | Transferrin | 5.5 |
| HEPES | 2979 | Sodium selenite | 0.0134 |
| l-Alanine | 15.57 | Arachidonic acid | 0.014 |
| l-Arginine × HCl | 221.2 | Cholesterol | 1.54 |
| l-Asparagine × H2O | 23.1 | DL-alpha-tocopherol-acetate | 0.49 |
| l-Aspartic acid | 23.27 | Linoleic acid | 0.07 |
| l-Cystine × 2HCl | 42 | Linolenic acid | 0.07 |
| l-Glutamic acid | 25.72 | Myristic acid | 0.07 |
| l-Glutamine | 584 | Oleic acid | 0.07 |
| Glycine | 13.12 | Palitoelic acid | 0.07 |
| l-Histidine × HCl × H2O | 73.5 | Palmitic acid | 0.07 |
| l-Isoleucine | 91.7 | Stearic acid | 0.07 |
| l-Leucine | 91.7 | Tween 80 | 15.4 |
| l-Lysine × HCl | 126.88 | Pluronic | 0.10% |
Cell culture
The cell cultivation was performed in 37°C humidified incubators supplemented with 5% carbon dioxide. The seeding density was 2 × 10⁵ cells/mL, and cell counts were performed every 4 days. The number of cells were determined using a hemocytometer. Spheroids would be enzymatically dissociated when spherical aggregates were observed. Approximately, 1.7 mL of sample were harvested from spinners and placed in a 2.0 mL microtube and centrifuged at 1,200 rpm for 6 min; 1.5 mL supernatant was saved for antibody assays. Hundred microliters (μL) of trypsin solution (2.5% (w/v) Trypsin in PBS) was added to resuspend the cells of 400 μl. The cells were incubated at room temperature for 15 min and the cell density and viability were then determined by the trypan blue exclusion method.
Antibody assay
The concentration of the whole antibody, as well as the concentration of the light and heavy chain portions, was determined by an enzyme-linked immunosorbent assay. Affinity purified rabbit anti-human IgG antibodies were diluted to 5 μg/mL in a coating buffer consisting of 100 mM NaHCO3 and 100 mM NaCl (pH = 9.3). About 100 μL diluted antibody was added to 96 well plates (Nunc) and incubated overnight at 4°C. The plates were washed twice in a Tris buffer (20 mM Tris–HCl, 50 mM NaCl, pH = 7.2) containing 0.1% Tween 20, and washed twice in the Tris buffer alone. Blocking buffer (Tris buffer with 0.5% BSA) was added to the 96 well plates and incubated at 37°C for 1 h. Supernatant samples were diluted in the blocking buffer and samples were loaded into the 96 well plates in triplicate. Plates were incubated for 1 h at 37°C and the washing procedure was repeated. Hundred microliters (μL) of a goat anti-human IgG-HRP conjugate antibody diluted to 0.5–2 mg/mL in the dilution buffer was added to the plates. The plates were incubated for 1 h at 37°C and the washing procedure was repeated. Finally, 100 mL of 50 μg/mL ABTS in ABTS buffer (Roche) was added to the plates. The absorbance was determined at 405 nm using an ELx800 plate reader (Bio-Tek). This procedure was used for the whole antibody, the heavy chain (Fc specific), and the light chain (κ specific). In sandwich ELISA assays, rabbit anti-human IgG antibodies raised against the whole molecule, Fab-specific and kappa-chain specific, respectively, were used to coat the ELISA plates. HRP-conjugated rabbit anti-human IgG antibodies raised against the whole molecule, Fab-specific and kappa-chain specific, respectively, were used in the detection step of the ELISA assays.
Experimental design
Response surface methodology (RSM) was used to determine the influence of some medium components on the response of viable cell density. Our assumption is that since our product is growth-associated, increase in viable cell density will ultimately increase the antibody production. Theoretical and fundamental aspects of RSM have been extensively discussed elsewhere (Myers and Montgomery 1995). The experimental design adopted Box’s central composite design for five variables at five levels each. The five independent variables were X1 = Glutamine, X2 = EAA, X3 = NEAA, X4 = ITS, X5 = Lipids. The independent variable coded regions were −α (−2, Lowest Level), −1, 0 (middle level), 1, and +α (2, highest level). The actual values, which were chosen from preliminary studies, and the corresponding coded and uncoded values of the five independent variables are given in Table 3. The complete design has 42 experimental points, which including eight replications of the center point. The treatment combinations and observed responses are presented in Table 4. The 50 experimental medium runs were prepared in random order and the experiments were performed in four batches. The dependent variable (Y) was viable cell density and was assumed to be affected by the five independent variables. Based on data from this design, we fit a second order or higher order polynomial regression model described as follows:
Table 3.
Actual factor levels corresponding to coded factor levels
| Level | Symbol | Actual factor level at coded factor level of | ||||
|---|---|---|---|---|---|---|
| −2 | −1 | 0 | 1 | 2 | ||
| Glutamine | X1 | 1 mM | 2.5 mM | 4 mM | 5.5 mM | 7 mM |
| EAA | X2 | 0× | 0.5× | 1× | 1.5× | 2× |
| NEAA | X3 | 0.25× | 1× | 1.75× | 2.5× | 3.25× |
| ITS | X4 | 0.25× | 1× | 1.75× | 2.5× | 3.25× |
| LIPIDS | X5 | 0.1× | 0.4× | 0.7× | 1× | 1.3× |
Table 4.
Treatment combinations with variables in coded values and the values of response
| Run | X1 | X2 | X3 | X4 | X5 | Y |
|---|---|---|---|---|---|---|
| 1 | 1 | 1 | −1 | −1 | 1 | 8.1E + 05 |
| 2 | 1 | 1 | −1 | 1 | −1 | 7.2E + 05 |
| 3 | −1 | −1 | −1 | −1 | −1 | 6.5E + 05 |
| 4 | 0 | 0 | 0 | 2 | 0 | 8.3E + 05 |
| 5 | −1 | 1 | 1 | −1 | −1 | 1.0E + 06 |
| 6 | 1 | −1 | 1 | −1 | 1 | 8.0E + 05 |
| 7 | 2 | 0 | 0 | 0 | 0 | 7.3E + 05 |
| 8 | 0 | 0 | 0 | 0 | 2 | 7.1E + 05 |
| 9 | 1 | 1 | −1 | 1 | 1 | 5.4E + 05 |
| 10 | 0 | 0 | 0 | 0 | 0 | 9.5E + 05 |
| 11 | 1 | −1 | −1 | 1 | 1 | 6.6E + 05 |
| 12 | 0 | 0 | 0 | 0 | 0 | 9.3E + 05 |
| 13 | −1 | −1 | 1 | 1 | 1 | 8.40E + 05 |
| 14 | 1 | −1 | 1 | 1 | −1 | 8.80E + 05 |
| 15 | 1 | −1 | 1 | 1 | 1 | 6.25E + 05 |
| 16 | −1 | −1 | 1 | −1 | −1 | 7.00E + 05 |
| 17 | 0 | 0 | 0 | 0 | 0 | 1.18E + 06 |
| 18 | −1 | −1 | −1 | 1 | 1 | 8.15E + 05 |
| 19 | 0 | 0 | 0 | 0 | −2 | 1.15E + 06 |
| 20 | 1 | −1 | −1 | 1 | −1 | 6.55E + 05 |
| 21 | 0 | 0 | 0 | 0 | 0 | 1.16E + 06 |
| 22 | −1 | −1 | −1 | −1 | 1 | 2.00E + 05 |
| 23 | −2 | 0 | 0 | 0 | 0 | 1.52E + 06 |
| 24 | 0 | 0 | 0 | −2 | 0 | 5.15E + 05 |
| 25 | 0 | −2 | 0 | 0 | 0 | 3.10E + 05 |
| 26 | −1 | −1 | 1 | 1 | −1 | 8.20E + 05 |
| 27 | 1 | −1 | −1 | −1 | 1 | 5.10E + 05 |
| 28 | 1 | 1 | 1 | −1 | −1 | 8.10E + 05 |
| 29 | −1 | 1 | −1 | −1 | −1 | 7.85E + 05 |
| 30 | 0 | 0 | 0 | 0 | 0 | 1.18E + 06 |
| 31 | −1 | −1 | −1 | 1 | −1 | 8.30E + 05 |
| 32 | 0 | 0 | 2 | 0 | 0 | 9.55E + 05 |
| 33 | −1 | 1 | 1 | −1 | 1 | 1.29E + 06 |
| 34 | 0 | 0 | −2 | 0 | 0 | 1.80E + 05 |
| 35 | 1 | 1 | −1 | −1 | −1 | 2.00E + 05 |
| 36 | 1 | 1 | 1 | −1 | 1 | 2.20E + 05 |
| 37 | 0 | 0 | 0 | 0 | 0 | 1.21E + 06 |
| 38 | −1 | 1 | 1 | 1 | 1 | 1.03E + 06 |
| 39 | −1 | 1 | −1 | 1 | −1 | 9.00E + 05 |
| 40 | 1 | −1 | 1 | −1 | −1 | 9.85E + 05 |
| 41 | −1 | 1 | 1 | 1 | −1 | 8.65E + 05 |
| 42 | 1 | −1 | −1 | −1 | −1 | 8.75E + 05 |
| 43 | 1 | 1 | 1 | 1 | −1 | 7.70E + 05 |
| 44 | 1 | 1 | 1 | 1 | 1 | 1.08E + 06 |
| 45 | 0 | 0 | 0 | 0 | 0 | 9.90E + 05 |
| 46 | −1 | 1 | −1 | −1 | 1 | 9.35E + 05 |
| 47 | −1 | 1 | −1 | 1 | 1 | 8.55E + 05 |
| 48 | −1 | −1 | 1 | −1 | 1 | 1.00E + 06 |
| 49 | 0 | 2 | 0 | 0 | 0 | 8.90E + 05 |
| 50 | 0 | 0 | 0 | 0 | 0 | 9.85E + 05 |
Where α = ‘2’, Response (Y) = Viable cell density in cells/mL, ‘−1’, ‘0’, ‘+1’ are coded factorial levels
 |
where
Y = Viable cell density
bl = Intercept for block l
X = Factors (X1 = Glutamine, X2 = EAA, X3 = NEAA, X4 = ITS, X5 = Lipids)
bz = Regression coefficient (z = i, ii or ij, where i < j)
ε = Residual error
k = 1,2,3…
Statistical analysis
Using ordinary least squares the regression model was fit to evaluate, the explanatory variables regarding linear, interaction, and quadratic effects of coded levels of Glutamine, EAA, NEAA, ITS, Lipids on cell density. The R2 value was used to evaluate model sufficiency and the α-level was set as 5%, at which point every term in the selected model should be significant. The reduced model was evaluated using the R2. Lack of fit was used to attempt to find optimal conditions for all the variables maximizing the cell density. Canonical analysis was then used to evaluate the nature of the stationary point (maximum, minimum or saddle) and to find the ridge of steepest ascent. Further experiments were carried out in the direction of the maximum response along with alternate experiments where Glutamine was set to different coded levels from ‘0’ to ‘−3’, keeping EAA constant at coded level ‘2’ and ‘4’. All statistical computations were done using SAS/STAT procedures, and optimum conditions were found through SAS data-step programming. Response surface plots were generated by SAS/GRAPH.
Results and discussion
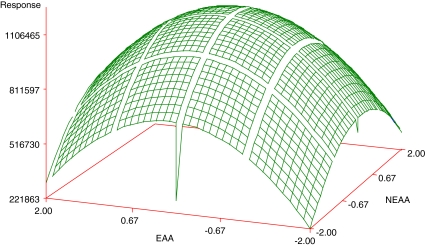
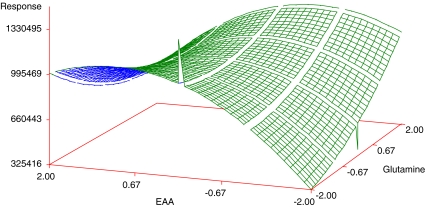
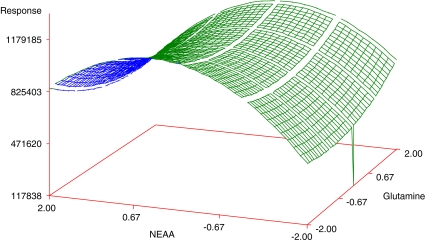
Regression analysis revealed that linear (Xi) and quadratic effects (Xi × Xi) were more significant than cross product interactions (Xi × Xj), as based on the p-values obtained (Table 5). Among all independent variables, Glutamine (negative effect, X1: −2.79) and NEAA (positive effect, X3: 3.07) had the greatest effects on the cell density, while EAA showed an effect when combined with Glutamine (X2 × X1). Among the pairwise interactions, EAA and Glutamine exhibited the greatest effect. Although NEAA squared (X3 × X3) and NEAA (X3) by itself were significant, they did not have a great effect when compared with the other variables, as judged by the p-value. The response surface plots were then plotted to see the effect of EAA and NEAA (Fig. 1), EAA and Glutamine (Fig. 2), NEAA and Glutamine (Fig. 3) on the response which is the viable cell density (Y). ITS and Lipids were found to have no effect. The R2 value for the total model is 0.6339. To simplify the model, the variables of ITS and Lipids were removed from the model and the data were re-analyzed using the reduced model. The polynomial regression model used for three variables was
 |
When the variables ITS and Lipids were kept constant, the lack of fit is found to be insignificant, suggesting that the model was adequate to explain the effect of these three variables on the response. The R2 value of the reduced model decreases to 0.502, as denoted in Table 6. As Table 6 shows, the Glutamine (X1) had significant linear effects and interacted with EAA (X2). EAA and NEAA had significant quadratic effects (X2 × X2 and X3 × X3) while NEAA (X3) also had a linear effect on the cell density.
Table 5.
The t- and p- values of full model with X1, X2, X3, X4, X5 as independent variables
| Parameter | t-value | p-value |
|---|---|---|
| Intercept | 13.75 | <0.001 |
| X1 | −2.79 | 0.0092 |
| X2 | 1.53 | 0.1376 |
| X3 | 3.07 | 0.0046 |
| X4 | 1.2 | 0.2404 |
| X5 | −0.81 | 0.425 |
| X1 × X1 | 0.66 | 0.5167 |
| X2 × X1 | −2.1 | 0.1446 |
| X2 × X2 | −2.67 | 0.0124 |
| X3 × X1 | −0.27 | 0.7855 |
| X3 × X2 | −0.1 | 0.9206 |
| X3 × X3 | −2.86 | 0.0078 |
| X4 × X1 | 0.31 | 0.758 |
| X4 × X2 | 0.22 | 0.8304 |
| X4 × X3 | −0.74 | 0.4662 |
| X4 × X4 | −2.21 | 0.0352 |
| X5 × X1 | −0.8 | 0.4292 |
| X5 × X2 | 1.3 | 0.2026 |
| X5 × X3 | 0.25 | 0.8061 |
| X5 × X4 | 0.2 | 0.8427 |
| X5 × X5 | −0.58 | 0.5675 |
| Linear | 0.0046 | |
| Quadratic | 0.0055 | |
| Cross Product | 0.6621 |
R2 = 0.6339 for the total model
Fig. 1.
Response surface plot showing the effect of EAA, NEAA, and their mutual effect on the response (viable cell density). Other variables were held at zero level
Fig. 2.
Response surface plot showing the effect of EAA, glutamine and their mutual effect on the response (viable cell density). Other variables were held at zero level
Fig. 3.
Response surface plot showing the effect of NEAA, glutamine and their mutual effect on the response (viable cell density). Other variables were held at zero level
Table 6.
The t- and p- values of the reduced model with X1, X2, X3 as independent variables
| Parameter | t-value | p-value |
|---|---|---|
| Intercept | 15.56 | <0.0001 |
| X1 | −2.81 | 0.0076 |
| X2 | 1.54 | 0.132 |
| X3 | 3.1 | 0.0036 |
| X1 × X1 | 0.66 | 0.5123 |
| X2 × X1 | −2.11 | 0.0407 |
| X2 × X2 | −2.69 | 0.0105 |
| X3 × X1 | −0.28 | 0.7835 |
| X3 × X2 | −0.1 | 0.9199 |
| X3 × X3 | −2.88 | 0.0064 |
| Linear | 0.001 | |
| Quadratic | 0.0035 | |
| Cross product | 0.2242 |
R2 = 0.5022 for the reduced model
Canonical analysis
Canonical analysis is a mathematical approach used to examine the overall shape of the response surface and to determine if the estimated response point is a maximum, minimum or a saddle point. If the stationary point is maximum or minimum, a corresponding increase or decrease will result in the response. In the case of a saddle point, the response may increase or decrease when we move away from the stationary point, depending on which direction is taken. Maximizing the viable cell density is of interest; however the stationary point was a saddle point, so we move on the ridge in the direction to get the maximum response.
The points on the ridge that increased the response were found using the RIDGEMAX option of the SAS/RSREG procedure, and are shown in Table 7. From Tables 6 and 7, glutamine showed a negative effect on cell density while EAA, NEAA showed a positive effect. Therefore the glutamine values for the ridge moved in the negative direction and the values for EAA and NEAA moved in the positive direction. Following the ridge in Table 7, the highest cell density was 1.37E + 06 cells/mL, but this prediction was not very reliable due to a large standard error obtained (144554). Based on the ridge analysis, the glutamine concentrations at high cell densities were found to decreasing, to a level of 1 mM or lower. Glutamine values smaller than 1 mM were thought to be unreasonable and therefore additional experiments were conducted on the ridge below glutamine values of 1 mM.
Table 7.
Ridge of steepest ascent for X1, X2, X3 independent variables, and estimated response and standard error
| X1 | X2 | X3 | Estimated cell density (105) | SE |
|---|---|---|---|---|
| −0.15 | 0.07 | 0.11 | 10.1 | 62346 |
| −0.33 | 0.13 | 0.18 | 10.4 | 61381 |
| −0.52 | 0.20 | 0.23 | 10.7 | 60421 |
| −0.71 | 0.26 | 0.26 | 11.0 | 60558 |
| −0.91 | 0.32 | 0.28 | 11.4 | 63278 |
| −1.10 | 0.38 | 0.30 | 11.8 | 70025 |
| −1.29 | 0.43 | 0.31 | 12.2 | 81626 |
| −1.49 | 0.49 | 0.33 | 12.7 | 98153 |
| −1.68 | 0.55 | 0.34 | 13.2 | 119266 |
| −1.87 | 0.60 | 0.35 | 13.7 | 144554 |
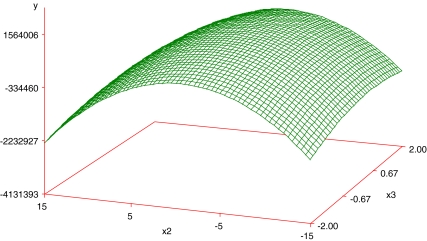
To further explore the surface, we used the reduced model from Table 7, and obtained predicted cell densities at constant glutamine concentrations at different coded levels from ‘0’ to ‘−3’, NEAA at ‘0.5’ and various values of EAA. The results are shown in Table 8. The results suggest that cell density increases as EAA (X2) increases when glutamine values are low. Figure 4 shows the effect of EAA and NEAA on VCD when glutamine is controlled at coded level ‘−1’.
Table 8.
Effect on EAA, NEAA and VCD when glutamine is controlled at different coded levels
| X1(level) | X2(Level) | X3(Level) | VCD |
|---|---|---|---|
| −0.5 | 4.5 | 0.5 | 1.27E + 06 |
| −1 | 6.5 | 0.5 | 1.56E + 06 |
| −1.5 | 8.5 | 0.5 | 1.95E + 06 |
| −2 | 10.5 | 0.5 | 2.43E + 06 |
| −2.5 | 12.5 | 0.5 | 3.01E + 06 |
| −3 | 14.5 | 0.5 | 3.69E + 06 |
Fig. 4.
Response surface plot showing the effect of EAA (X2), NEAA (X3) and their mutual effect on the Y (viable cell density), when glutamine (X1) is controlled at −1 coded level
EAA values up to a coded level of 14.5 (uncoded value = 12.625 X) are unfeasible because of osmotic effects or inhibition of metabolic pathways due to overfeeding the nutrients. According to the above results, however, it appears that with reduced Glutamine levels and concentrations of EAA and NEAA at a 0.5 coded level, large cell densities could possibly be obtained.
Alternate experiments
To further evaluate the surface we ran some alternate experiments at different levels of glutamine (from coded level ‘0’ to’ −3’), keeping EAA constant at coded levels 2 and 4. We expected low cell growth at a glutamine value less than ‘−1.5 coded level’ and no cell growth at zero (‘−2’ coded level) glutamine concentration. We also expected the EAA coded level of ‘2’ to result in higher cell densities compared to EAA coded level ‘4,’ due to osmotic effects and the inhibition of metabolic pathways from overfeeding. Therefore 14 additional experiments were conducted, four on the ridge, four at different levels of Glutamine keeping EAA at coded level ‘2,’ four at EAA coded level ‘4,’ and two controls (basal medium) as shown in Table 9.
Table 9.
Alternate experiments carried out on ridge and glutamine controlled at different coded levels, keeping EAA constant at coded levels 2 and 4
| Medium | X1 | X2 | X3 | VCD (105) | SD |
|---|---|---|---|---|---|
| 1 | −0.52 | 0.196 | 0.225 | 8.13 | 203490 |
| 2 | −1.1 | 0.375 | 0.299 | 8.81 | 179368 |
| 3 | −1.487 | 0.491 | 0.329 | 8.61 | 60052 |
| 4 | −1.874 | 0.604 | 0.352 | 8.01 | 152664 |
| 5 | 0 | 2 | 0.5 | 9.35 | 42230 |
| 6 | −1 | 2 | 0.5 | 1.23 | 215928 |
| 7 | −2 | 2 | 0.5 | 7.23 | 277564 |
| 8 | −3 | 2 | 0.5 | 1.79 | 45162 |
| 9 | 0 | 4 | 0.5 | 7.93 | 102429 |
| 10 | −1 | 4 | 0.5 | 4.49 | 152555 |
| 11 | −2 | 4 | 0.5 | 5.7 | 144684 |
| 12 | −3 | 4 | 0.5 | 2 | 52915 |
| 13 | 0 | 0 | 0 | 9.15 | 134722 |
| 14 | 0 | 0 | 0 | 9.48 | 121484 |
These experiments were conducted under the same conditions as the initial experiments. The starting density of the cultures was 2 × 10⁵ cells/mL, and the cells were allowed to adapt to the medium in four passages. The final viable cell densities were derived as an average of the third and the fourth passage, as shown in Table 9.
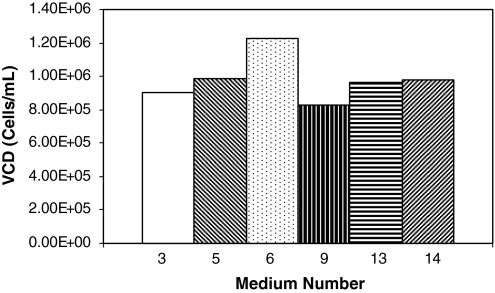
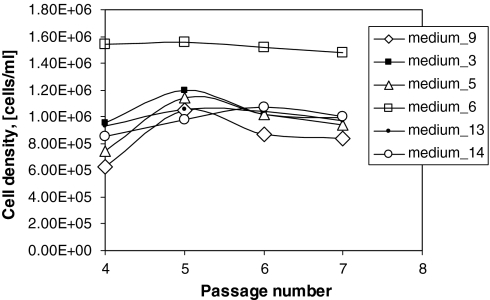
Medium-6 had a higher cell density compared to the controls (13 and 14), but the last passage of medium 3, 9, and 5 were nearly equal to the control medium, as shown in Fig. 5. Media which had results equivalent to, or better than medium-0, were carried out for one more passage (up to 8 days), to validate the data. The results are shown in Fig. 6. From passage 5, the viable cell density attained in medium 6 after 5 days of culture was about 1.6 times higher than the control.
Fig. 5.
Viable cell density versus medium number tested. The plot shows the viable density obtained in the last passage (passage 4) of alternate experiments undertaken. Details on media are listed in Table 9
Fig. 6.
Results of the alternate experiments conducted to further explore the surface
Replicate experiments
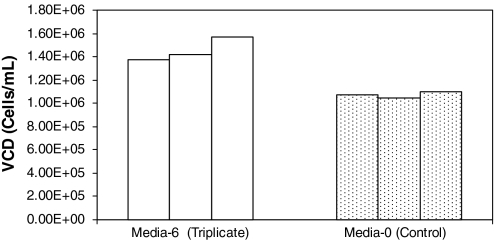
To validate the above results, the cells in the control medium were taken out of a frozen state, and the experiment was repeated three times with control medium and medium-6. Cells were allowed to go for four passages and the final viable cell densities were taken as an average of passage 3 and passage 4. The results are presented in Fig. 7.
Fig. 7.
Results of the triplicate experiments of Medium-6 and the Control Medium
In medium-6, a viable cell density of 1.45 × 10⁶ cells/mL was attained, which was found to be 1.4 times higher than for the control medium and within two standard errors of 1.23E + 06 from the original run of medium 6 (standard error = 215,928 cells/mL for medium 6). After four passages, if the cells were allowed to grow to passages of 5–7 the viable cell density obtained in medium-6 increased to 1.6 × 10⁶ cells/ml. The viable cell density in the control experiment in these passages (passages 5–7) was between 9.2 × 10⁵ cells/mL and 1.1 × 10⁶ cells/mL, with in the standard deviation of 128,103 cells/mL (data not shown).
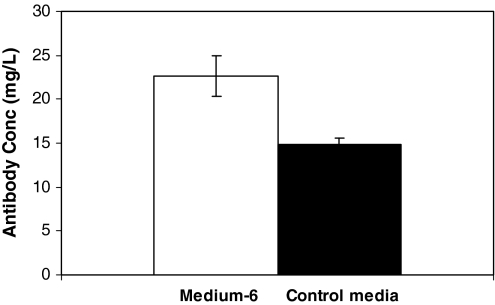
Assuming the specific antibody production (mg protein per cell per day) depends on the cell density, we expect to see an increase in the specific antibody production with an increase in the cell density. As detailed in the methods section, transformed cells were cultured in control and the optimized medium, medium-6, and the antibody titer was estimated in the supernatant, the specific antibody production was determined. Standard deviation was calculated in these media from triplicate experiments. The results are shown in Fig. 8. The antibody titer was determined for all the initial medium (∼50) experiments, and the results were analyzed using SAS/STAT procedures. We observed the same trend for antibody production as well, where the stationary point is a saddle point, and the ridge values for the glutamine were moving in the negative direction and in positive direction for EAA and NEAA, shown in Table 10. The R2 value for the model was 0.75 which shows adequacy of the model in explaining the effect of the variables on the response which is antibody production. Thus the antibody titer in medium-6 was estimated to be 1.6 times higher than the control medium and the composition of the variables in medium-6, that was found to be optimal in our present study, is listed is Table 11.
Fig. 8.
Antibody production in Medium-6 and the Control Medium
Table 10.
Ridge of steepest ascent of the reduced model for getting maximum antibody production with independent variables X1, X2, X3. X4 and X5 are kept constant at their zero−level
| X1 | X2 | X3 | Estimated response (mg/L) |
|---|---|---|---|
| 0 | 0 | 0 | 12.73 |
| −0.172 | −0.01 | 0.101 | 13.46 |
| −0.34 | −0.001 | 0.2 | 14.21 |
| −0.522 | 0.03 | 0.293 | 15 |
| −0.698 | 0.08 | 0.38 | 15.82 |
| −0.874 | 0.149 | 0.461 | 16.69 |
| −1.049 | 0.226 | 0.536 | 17.61 |
| −1.22 | 0.31 | 0.607 | 18.58 |
| −1.39 | 0.4 | 0.673 | 19.6 |
| −1.56 | 0.496 | 0.736 | 20.6 |
| −1.73 | 0.595 | 0.796 | 21.8 |
Table 11.
Concentrations of the five variables of the optimal medium
| Variables | Concentration |
|---|---|
| Glutamine | 2.5 mM |
| EAA | 3.25 × (1.67 g/L) |
| NEAA | 2.125 × (0.168 g/L) |
| ITS | 1 × (0.22 g/L) |
| Lipids | 0.7 × (0.71 g/L) |
Total concentration of all amino acids in EAA and NEAA are given in g/L. Concentrations of all other components are as given in Table 2
Conclusions
The increase in the Viable cell density (Cells/mL), and the production of the antibody against BoNT-A was accomplished by using Box-Wilson’s Central Composite Design.
In the optimal media, a 1.4 times higher in the viable cell density and a 1.6 times higher found antibody titer was obtained. Lower levels of glutamine and higher levels of EAA are preferred. From the results presented here, we expect that one of the amino acids is replacing the role of amino acid-glutamine, and may be acting as limiting nutrient. Thus in our future and ongoing efforts, we will undertake amino acid analysis, to identify the limiting amino acid. We speculate that the addition of the limiting amino acid, albeit separately, separately, a decrease in the concentration of the total amino acid can be engineered, thus make the medium more economical. We also anticipate increased cell densities and higher antibody titers.
References
- Box GEP, Hunter WG, Hunter JS (1978) Statistics for experimenters. Wiley, New York
- Bretscher MS (1985) The molecules of the cell membrane. Sci Am 253:100–108 [DOI] [PubMed]
- Castro PM, Hayter PM, Ison AP, Bull AT (1992) Application of a statistical design to the optimization of culture medium for recombinant interferon-gamma production by Chinese hamster ovary cells. Appl Microb Biotechnol 38:84–90 [DOI] [PubMed]
- Chen QH, He GQ, Ali MAM (2002) Optimization of medium composition for the production of elastase by Bacillus sp. EL31410 with response surface methodology. Enzyme Microb Technol 30:667–672 [DOI]
- Darfler FJ, Insel PA (1983) Clonal growth of lymphoid cells in serum-free media requires elimination of H2O2 toxicity. J Cell Physiol 115:31–36 [DOI] [PubMed]
- DasGupta BR, Sathyamoorthy VS (1984) Purification and amino acid composition of type A botulinum neurotoxin. Toxicon 22:415–424 [DOI] [PubMed]
- Farrant J, Newton CA, North ME, Weyman C, Brenner MK (1984) Production of antibody by human B cells under serum-free conditions. J Immunol Methods 68:25–34 [DOI] [PubMed]
- Franek F, Sramkova K (1996) Protection of B lymphocyte hybridoma against starvation-induced apoptosis: survival-signal role of some amino acids. Immunol Lett 52:139–144 [DOI] [PubMed]
- Franz DR, Jahrling PB, Friedlander AM, McClain DJ, Hoover DL, Bryne WR, Pavlin JA, Christopher GW, Eitzen EM Jr (1997) Clinical recognition and management of patients exposed to biological warfare agents. JAMA: J Am Med Assoc 278:399–411 [DOI] [PubMed]
- Freshney RI (1994) Culture of animal cells: a manual of basic technique, 3rd edn. Wiley J. Liss, New York, pp 85–98
- Gill DM (1982) Bacterial toxins: a table of lethal amounts. Microbiol Rev 46:86–94 [DOI] [PMC free article] [PubMed]
- Giovanni M (1983) Response surface methodology and product optimization. Food Technol 12:41–45
- Glassy MC, Tharakan JP, Chau PC (1988) Serum-free media in hybridoma culture and monoclonal antibody production. Biotechnol Bioeng 32:1015–1028 [DOI] [PubMed]
- Hayter PM, Curling EM, Baines AJ, Jenkins N, Salmon I, Strange PG, Bull AT (1991) Chinese hamster ovary cell growth and interferon production kinetics in stirred batch culture. App Microbiol Biotechnol 34:559–564 [DOI] [PubMed]
- Houng JY, Chen KC, Hsu WH (1989) Optimization of cultivation medium composition for isoamylase production. Appl Microbiol Biotechnol 31:61–64 [DOI]
- Keen MJ, Rapson NT (1995) Development of a serum-free culture medium for the large scale production of recombinant protein from a Chinese hamster ovary cell line. Cytotechnology 17:153–163 [DOI] [PubMed]
- Kovar J, Franek F (1984) Serum-free medium for hybridoma and parental myeloma cell cultivation: a novel composition of growth-supporting substances. Immunol Lett 7:339–345 [DOI] [PubMed]
- Lang AB, Cryz SJ Jr, Schurch U, Ganss MT, Bruderer U (1993) Immunotherapy with human monoclonal antibodies. Fragment A specificity of polyclonal and monoclonal antibodies is crucial for full protection against tetanus toxin. J Immunol (Baltimore, Md.: 1950) 151:466–472 [PubMed]
- Maddox IS, Richert SH (1977) Use of response surface methodology for the rapid optimization of microbiological media. Jo Appl bacteriol 43:197–204 [DOI] [PubMed]
- Mather JP, Sato GH (1979) The growth of mouse melanoma cells in hormone-supplemented, serum-free medium. Exper Cell Res 120:191–200 [DOI] [PubMed]
- Mowry MC, Meagher MM, Smith L, Marks J, Subramanian A (2004) Production and purification of a chimeric monoclonal antibody against botulinum neurotoxin serotype A. Protein Expr Purif 37:399–408 [DOI] [PubMed]
- Myers RH, Montgomery DC (1995) Response surface methodology: process and product optimization using designed experiments. Wiley, New York
- Nielsen FH, Uthus EO, Hunt CD (1981) Interactions between the “newer” trace elements and other essential nutrients. Proc NZ Workshop Trace Elem N Z, 165–173
- Nowakowski A, Wang C, Powers DB, Amersdorfer P, Smith TJ, Montgomery VA, Sheridan R, Blake R, Smith LA, Marks JD (2002) Potent neutralization of botulinum neurotoxin by recombinant oligoclonal antibody. Proc Nat Aca Sci USA 99:11346–11350 [DOI] [PMC free article] [PubMed]
- Oeyaas K, Ellingsen TE, Dyrset N, Levine DW (1994) Utilization of osmoprotective compounds by hybridoma cells exposed to hyperosmotic stress. Biotechnol Bioeng 43:77–89 [DOI] [PubMed]
- Reitzer LJ, Wice BM, Kennell D (1979) Evidence that glutamine, not sugar, is the major energy source for cultured HeLa cells. J Biol Chem 254:2669–2679 [PubMed]
- Schubert D (1979) Insulin-induced cell-substratum adhesion. Exper Cell Res 124:446–451 [DOI] [PubMed]
- Senanayake SPJN, Shahidi F (2002) Lipase-catalyzed incorporation of docosahexaenoic acid (DHA) into borage oil: optimization using response surface methodology. Food Chem 77:115–123 [DOI]
- Sinacore MS, Charlebois TS, Harrison S, Brennan S, Richards T, Hamilton M, Scott S, Brodeur S, Oakes P et al (1996) CHO DUKX cell lineages preadapted to growth in serum-free suspension culture enable rapid development of cell culture processes for the manufacture of recombinant proteins. Biotechnol Bioeng 52:518–528 [DOI] [PubMed]
- Syuto B, Kubo S (1981) Separation and characterization of heavy and light chains from Clostridium botulinum type C toxin and their reconstitution. J Biol Chem 256:3712–3717 [PubMed]
- Zang M, Trautmann H, Gandor C, Messi F, Asselbergs F, Leist C, Fiechter A, Reiser J (1995) Production of recombinant proteins in Chinese hamster ovary cells using a protein-free cell culture medium. Bio/technology (Nature Publishing Company) 13:389–392 [DOI] [PubMed]
- Zielke HR, Zielke CL, Ozand PT (1984) Glutamine: a major energy source for cultured mammalian cells. Federation proceed 43:121–125 [PubMed]
- de Zengotitia VM, Abston LR, Schmelzer AE, Shinie S, Miller WM (2002) Selected amino acids protect hybridoma and CHO cells from elevated carbondioxide and osmolality. Biotechnol Bioeng 78:741–752 [DOI] [PubMed]


