Abstract
Glycosaminogycans (GAGs) are involved in numerous vital functions in the human body. Mapping the GAG concentration in vivo is desirable for the diagnosis and monitoring of a number of diseases such as osteoarthritis, which affects millions of individuals. GAG loss in cartilage is typically an initiating event in osteoarthritis. Another widespread pathology related to GAG is intervertebral disk degeneration. Currently existing techniques for GAG monitoring, such as delayed gadolinium-enhanced MRI contrast (dGEMRIC), T1ρ, and 23Na MRI, have some practical limitations. We show that by exploiting the exchangeable protons of GAG one may directly measure the localized GAG concentration in vivo with high sensitivity and therefore obtain a powerful diagnostic MRI method.
Keywords: cartilage, MRI, osteoarthritis, NOE, proteoglycan
Glycosaminoglycans (GAGs) are long unbranched carbohydrates with repeating disaccharide units, which can be classified into six categories: chondroitin sulfate (CS), dermatan sulfate (DS), keratan sulfate (KS), heparin, heparan sulfate, and hyaluronan (HA) (1). They are essential for the human musculoskeletal function, cell regulation, and spinal function. Some GAGs function independently. Heparin, for example, is well known for its role as an anticoagulant in blood clotting, which is used in anticoagulation therapies. Others form functional conglomerates with proteins/RNAs. Mucopolysaccharidosis, a genetically inherited disease, results from defects in the lysosomal enzymes responsible for the metabolism of membrane protein-bound GAGs (2). Proteoglycans (PGs), which consist of a core protein and one or more covalently attached GAG chains, play vital functions in diarthrodial joints (3) and intervertebral disks (IVDs) (4). Osteoarthritis (OA) affects 21 million people in the United States alone and is characterized by the loss of PGs in cartilage (5). Thus, quantification of GAG concentration in vivo is important for the understanding of the pathophysiology of many common diseases.
Currently, there is no generally applicable direct GAG mapping method available. Delayed gadolinium-enhanced MRI contrast (dGEMRIC) allows one to measure the GAG concentration indirectly in cartilage. In this protocol, after Gd(DTPA)2− (DTPA, diethylenetriaminepentaacetate) is allowed to diffuse into cartilage, the GAG concentration is roughly inversely proportional to the concentration of Gd(DTPA)2− because of charge repulsion. The negative charge density of cartilage tissue (and hence GAG concentration) can therefore be inferred through monitoring the differences of the T1 values with and without the agent (5, 6). This method fails in IVDs and heart valves because of the slow diffusion of Gd(DTPA)2− into the tissue (7). T1ρ MRI can map the GAG concentration in both diarthrodial joints and IVDs (4, 8). The long imaging time needed by the technique limits its clinical applicability. The preparation of T1ρ magnetization by a long spin-lock pulse further hampers its wide application because of the high specific absorption rate (9). Furthermore, T1ρ generally targets all of the chemical exchange sites within the system unspecifically (10). With the advent of high-field MRI scanners, 23Na MRI gains much attention because it becomes possible to use the concentration of positively charged 23Na in cartilage to map the negatively charged GAGs (11, 12). The quadrupolar coupling of 23Na in cartilage has also been reported to correlate with degeneration (13, 14). This effect could be used in combination with quadrupolar contrast techniques to elucidate degradation processes (15–18). The low signal-to-noise ratio and the requirement of special hardware, however, currently limit the clinical applicability of 23Na MRI.
In this article, we demonstrate a form of GAG assessment that is based on the labile protons residing on the GAGs. In our spectroscopic study (19) of cartilage, both amide proton (–NH, δ = +3.2 ppm downfield of the water signal) and hydroxyl protons (–OH δ = +0.9 to +1.9 ppm downfield of the water signal) from GAG can be considered to be suitable as chemical exchange dependent saturation transfer (CEST) agents (20, 21). Unlike the methods mentioned above, this approach allows one to directly measure GAG in vivo.
In the CEST method, the exchangeable proton spins are saturated, and the saturation is transferred upon chemical exchange to the bulk water pool (20, 21). As a result, a large contrast enhancement in bulk water can be achieved. Enhancement factors of up to 102 to 106 relative to the concentration of the molecules of interest have been reported for certain systems (22). The CEST approach has been used to image tissue pH (23), to map brain proteins through their – NH residues (24), to monitor glycogen concentration in the liver (25), and to map a specific gene expression in vivo (26).
Every GAG unit has one – NH, and three – OH. In this work we validate these as endogenous CEST agents, which will allow us to assess GAG concentration in vivo noninvasively and specifically by MRI through the CEST contrast mechanism (gagCEST).
OA is typically characterized by GAG loss and is of societal significance because of its prevalence. Hence, cartilage is chosen to demonstrate that gagCEST is sensitive to GAG concentration variations. The experiments are shown to work ex vivo and in vivo, and could be used for the diagnosis of the early stages of OA.
Results and Discussion
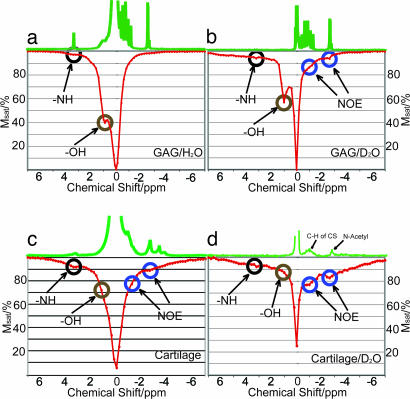
The exchangeable protons of the PG molecules have been identified in a previous article (19). Typical exchange rates of – NH groups have been reported as 10–30 s−1 (22). Although the chemical exchange rates of – OH in polysaccharides are in the fast exchange regime (on the order of 103 s−1) (27), – OH has already been demonstrated as suitable for CEST applications (21, 25). Fig. 1a shows a z spectrum (28) of the 125 mM GAG phantom, in which the – OH and – NH concentrations are 375 mM and 125 mM, respectively. Fig. 1c shows the z spectrum from a piece of bovine cartilage, where additional magnetization transfer mechanisms stemming from the macromolecular nature of the assembly partly mask the CEST sites. Apart from the two labile sites downfield of water, two sites at δ = −2.6 ppm and −1.0 ppm from water are identified. These two sites correspond to the CH and N-acetyl residues in GAG, respectively (19, 29). Because the protons in these residues are not exchangeable, their appearance in the z spectrum must be related to a magnetization transfer mechanism other than chemical exchange. Such a mechanism could be the nuclear Overhauser effect (NOE). The NOE enhancement factor of the water signal can be expressed as (30)
where T1w is the longitudinal relaxation time of water and σ is the cross-relaxation constant between water and GAG. σ is negative when ω0τc ≥ 1 (where ω0 is the Larmor frequency and τc is the rotational correlation time). A negative cross-relaxation between water and the macromolecule signal has previously been reported for glycogen (31). In that case, however, a negative NOE was recorded for the glycogen protons upon irradiation of the water protons.
Fig. 1.
z spectra of GAG in H2O (a), GAG in D2O (b), cartilage (c), and cartilage equilibrated in D2O (d). Msat is the water signal intensity after irradiation at the respective offsets. The corresponding 1H spectra are shown at the top of the z spectra. The durations and powers of the presaturation pulses were 4 s at 100 Hz (a and c), 50 s at 50 Hz (b), and 10 s at 50 Hz (d).
Further evidence for the existence of NOEs is provided by studying the behavior when performing the experiment with samples in bulk D2O. Fig. 1b shows the z spectrum of GAG in 95% D2O, and Fig. 1d shows the z spectrum of cartilage equilibrated in D2O. The presence of bulk D2O significantly enhances the appearance of the dips at the two NOE sites (δ = −1.0 ppm and −2.6 ppm), whereas it diminishes the appearance of the – OH and – NH CEST sites. The recorded water T1w values were 4.3 s in GAG/H2O and 9.7 s in GAG/95% D2O and were 2.1 s in native cartilage and 4.0 s in D2O-equilibrated cartilage. Both chemically exchangeable sites and NOE sites are enhanced by the increased T1w (22, 30). The magnetization transfer rate constant due to NOE is independent of the D2O/H2O ratio, whereas the magnetization transfer rate of chemical exchange decreases as D2O increases (32). Another reason for the relative enhancement of the NOE is that the same amount of magnetization transfers to a much smaller amount of water protons in a given amount of time. The labile sites, on the other hand, experience a relative decrease due to the additional replacement of 1H in the exchangeable sites. We therefore conclude that the NOE from the CH and N-acetyl groups of GAG gives rise to the magnetization transfer mechanism at δ = −1.0 ppm and −2.6 ppm with respect to water.
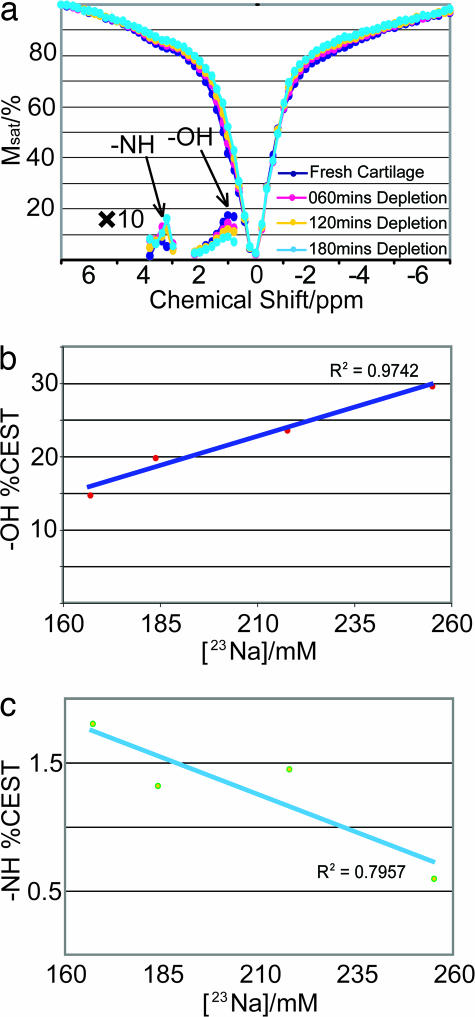
To validate the applicability of CEST for clinical diagnosis of OA, z spectra of a cartilage trypsinization series were acquired. Trypsin primarily acts on PG and reduces the GAG concentration (33). The corresponding 23Na concentrations ([23Na]) are recorded with 23Na NMR. [23Na] decreases as a result of PG depletion and can be seen as a reliable reporter of GAG concentration (11, 12). Fig. 2 shows the z spectra acquired from a piece of fresh cartilage and from the same piece after sequential trypsinization. Along with the z spectra, the asymmetry plots are shown, which represent the difference between the upfield side S(−δ) and the downfield side of the plot S(+δ), normalized to the water signal (S0) after irradiation at a large offset (23),
where δ is the offset of the irradiation relative to the water signal. For quantifying the CEST effect at a given offset, it is more useful to use the representation (21)
in which case the effect of the partial direct water saturation is taken into account. Fig. 2b shows CEST(δ = +1.0 ppm) vs. [23Na], plotted according to Eq. 3. The linear relationship demonstrates that the – OH groups can be used as reliable gagCEST agents. In Fig. 2c, however, – NH CEST(δ = +3.2 ppm) shows a much weaker effect, on the order of 1–2%. Furthermore, the correlation with [23Na] is negative. Several reasons contribute to this difference in behavior: (i) The chemical exchange rate of the amide protons is typically much smaller than the one of the hydroxyl protons (up to two orders of magnitude). (ii) The – NH concentration is ≈100 mM, whereas the – OH concentration is up to 200–300 mM (3). The presence of the NOE sites at −2.6 ppm overcompensates for the CEST effect and leads to the negative slope in Fig. 2c. By contrast, the high concentration and high chemical exchange rate of – OH easily overrides the NOE contributions at δ = −1.0 ppm and results in an overall substantial CEST effect (15–30%). As shown in Fig. 2b, there is a linear dependence of this effect on the GAG concentration, which makes – OH a very favorable gagCEST agent.
Fig. 2.
z spectra of a cartilage trypsinization series with asymmetry plots shown in both the amide and the hydroxyl regions (a), along with the extracted – OH CEST vs. [23Na] (b), and – NH CEST vs. [23Na] (c). Presaturation was performed for 4 s at an rf-power of 250 Hz.
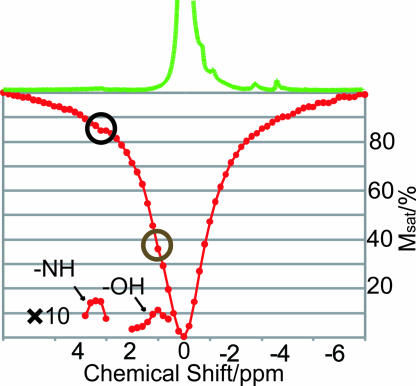
To evaluate the gagCEST applicability at clinically relevant magnetic fields, a z spectrum of cartilage was constructed at 4.7 T (Fig. 3). Both the chemical exchange sites and the NOE sites are visible in Fig. 3a. The reduced sensitivity is partly due to the decrease of the resonance frequency (ω0). Under optimized conditions, a substantial – OH CEST effect can be achieved (≈24%), whereas the – NH CEST effect remains low (≈1.7%) as quantified according to Eq. 3.
Fig. 3.
z spectrum of cartilage optimized for the CEST effect at 4.7 T. The corresponding 1H spectra are shown at the top of the z spectra. Presaturation was performed for 8 s at an rf-power of 16 Hz.
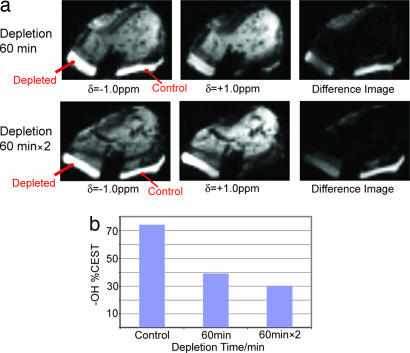
Fig. 4a shows the ex vivo CEST imaging application on a bovine patellar cartilage sample at δ = +1.0 ppm. The cartilage on the surface of the patella was divided into a control and a PG-depleted region: the control region was intact, whereas the depleted side was trypsinized twice for 60 min, each time followed by an imaging scan. The decrease of the signal in the trypsinized region is clearly visible. The extracted plot of the gagCEST effect vs. the depletion time is shown in Fig. 4b and demonstrates its applicability for GAG assessment in MRI.
Fig. 4.
CEST images taken from a trypsinization series on one bovine patella (a) along with the CEST contrast extracted according to Eq. 3 (b). One side (marked depleted) was trypsinized for 60 min (Upper) and twice for 60 min (Lower), while the control side stayed immersed in PBS. The difference image represents the subtraction of the image at δ = +1.0 ppm from the image at δ = −1.0 ppm. The total duration of the presaturation pulse sequence was 320 ms at an average rf power of 42 Hz.
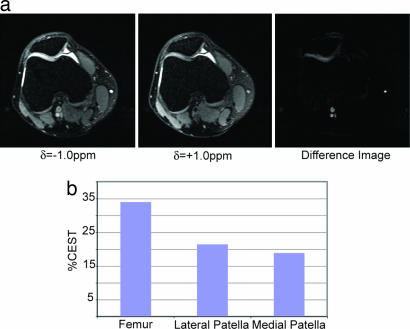
Fig. 5a shows in vivo results of – OH CEST on a patellofemoral human knee joint, displaying a clear demarcation of a cartilage lesion on the medial facet. The accumulation of joint effusion (fluid) in the knee (the brightness in the diarthrodial joint) is almost entirely removed in the difference image. A loss of GAG concentration is clearly shown on the medial side of the patellofemoral knee joint. In addition, the difference image shows bright spots at the location of blood vessels, which is likely a consequence of the CEST effect arising from oligosaccharides and proteins in blood. The regional variation of the GAG concentration is clearly demonstrated in the knee joint between the cartilage (≈33%), the lateral side of the patella (≈22%), and the medial side of the patella (≈18%) as shown in Fig. 5b. This variation of GAG concentration is in line with previously published data extracted from 23Na MRI (12). Thus, the CEST difference image demonstrates the ability to detect localized GAG concentration distributions and hence a pathological state of cartilage in vivo. Further clinical studies will be necessary to assess the diagnostic power of this method in vivo.
Fig. 5.
Images of a human patella in vivo with irradiation at δ = −1.0 ppm, δ = +1.0 ppm, and the difference image (a) along with the extracted CEST contrast from the femur and the lateral and medial sides of the patella (b). The total duration of the presaturation pulse sequence was 320 ms at an average rf power of 42 Hz.
As with all CEST methods, B0 and B1 field inhomogeneities can be of concern. The B0 and B1 variations in cartilage and across the knee joint were measured on the 3-T system by using a recently developed mapping method (34). B1 varied by ≈5% within cartilage and 10% across the knee joint, and B0 varied by up to 50 Hz. In general, B1 effects will be less of a problem, and, based on our measurements at 3 T we deem the B0 effects unproblematic in the examples shown. Several opportunities lie ahead to alleviate the effects of inhomogeneities if they arise to a larger extent, including (i) tailoring saturation pulse sequences to compensate for these effects, and (ii) coregistering B0/B1 maps and correcting for the variations in the image.
The significance of OA makes cartilage a natural choice for demonstration purposes. The applicability of the method, however, extends to any tissue containing GAG. The degeneration of IVD, associated with disk degeneration disease, leads to low back pain. In IVD, the nucleus pulposus, which contains PG as 50% of dry weight, imparts compressive stiffness on IVD, and hence on the human trunk (4). The dGEMRIC method is inapplicable to IVDs (7), and the uptake of Gd(DTPA)2− may cause unpredictable side effects on spinal neurons nearby. The feasibility of T1ρ MRI for the study of IVD has just been reported (4). The favorable nature of gagCEST with respect to lower power requirements and faster acquisition can make it a natural choice for MR imaging of IVD. Other tissues or cell clusters with considerable GAG concentration, such as heart valves and cornea, can also be evaluated by gagCEST through a proper adaptation of the imaging sequence.
As discussed above, the negative NOE observed in this work results from the interaction of water and nonexchangeable GAG protons with low mobility such that ω0τc ≥ 1. τc of GAG in cartilage was reported to be ≈50 ns as measured by 13C spectroscopy (35), which makes ω0τc ≫ 1. Although τc of the dipolar interaction between the GAG protons and the water protons is shorter than that of 13C, ω0τc ≥ 1 is likely to hold at lower magnetic fields, which implies that NOE from GAG should contribute substantially to CEST/magnetization transfer on a 1.5-T clinical scanner.¶ In addition, in cartilage, the ratio between the NOE peak and the water peak is larger than in the GAG phantom (Fig. 1 b and d). This difference indicates a more restricted motion of GAG in cartilage because it is anchored on the collagen fibrils, which is consistent with reports from 13C NMR spectroscopy (35). Moreover, as with the case of – NH of GAG, NOE is likely to contribute to the low efficiency of some of the other – NH CEST-based applications in vivo (22, ¶).
In conclusion, we have demonstrated that – OH at δ = +1.0 ppm, among other labile protons, can be used to monitor GAG concentration in cartilage in vivo. The high concentration and the fast exchange rate of – OH make – OH gagCEST favorable in many clinical applications and basic research. Further exploration of CEST on the unique – NH site, as well as the NOE sites of GAG, will likely lead to additional information about GAG assessment. The advantages of high saturation efficiency, specificity, low specific absorption rate, and noninvasiveness render gagCEST particularly useful for assessing cartilage, IVDs, heart valves, and corneas.
Materials and Methods
NMR Sample Preparation.
CS A (Sigma–Aldrich) and standard PBS (pH 7.4, cell culture, Sigma–Aldrich) were used to prepare 125 mM GAG/PBS and 125 mM GAG PBS/95%D2O (D2O, Sigma–Aldrich) samples. The concentration is given with respect to the number of the disaccharide units in GAG. All of the bovine cartilage samples (including the MRI sample) were obtained from a U.S. Department of Agriculture-approved slaughterhouse (Bierig Bros, Vineland, NJ) within 5 h of animal slaughter (4- to 6-month-old calves) and frozen at −20°C until used. After deicing, the soft tissue was removed first. The samples were cut so as to include every anatomical region of cartilage, and without bone segment, and placed into a 5-mm NMR tube (samples were 4 mm in diameter and 5 mm in length). Fluorinated oil (Fluorinert, FC-77, Sigma–Aldrich) was filled into the void spaces for protection and reduction of susceptibility artifacts. The trypsinization was performed as follows: a cartilage sample was immersed in a trypsin/PBS bath (0.2 mg/ml trypsin, Sigma–Aldrich) for 60 min, after which it was placed in PBS for another 30 min. This procedure was performed for a total of three times on the same sample. In cartilage D2O equilibration experiments, the fresh cartilage was immersed in PBS/D2O for 24 h before it was sealed with fluorinated oil. A sample of PBS (Sigma–Aldrich) and agarose gel (Sigma–Aldrich) were mixed to yield a concentration of Na+ of 137 mM to calibrate [23Na] in fresh cartilage. In this sample, 23Na has similar relaxation properties as in fresh cartilage.
MRI Sample Preparation.
The extraneous tissue (ligaments, fat, etc.) of a fresh bovine patella was removed, and a groove was made in the middle of the patella on the articular surface. The patellae were then placed in a chamber containing a nonpermeable divider such that the groove was wedged on the divider. The control side of the patella was equilibrated in 137 mM PBS and the depleted side was immersed in a fresh trypsin bath (0.2 mg/ml, Sigma–Aldrich) for two periods of 60 min. After each depletion, the whole patella was equilibrated in PBS buffer for another 30 min. A wedge-shaped gap was made as a marker on the control side for the convenience of identification in MRI scanning.
MRI Human Subject.
After approval from the Institutional Review Board of the New York University Medical Center and signed informed consent, the right knee joint of one subject (male, age 30 years) with occasional knee pain was investigated by CEST MRI. A comprehensive medical review of this subject is underway. The subject was asked to rest at least 30 min before the imaging session.
NMR Hardware.
Data were acquired at 11.7 T (500-MHz 1H frequency) by using a Bruker Avance spectrometer equipped with a broadband observe (BBO) probe. One z spectrum of cartilage was constructed at 4.7 T (200-MHz 1H frequency) by using a Bruker Avance spectrometer equipped with a quadruple nucleus (QNP) probe. The temperature of the samples was stabilized at 310 K with a variation of ±0.2 K.
MRI Hardware.
The MRI experiments were performed on a 3.0-T clinical MR scanner (Magnetom Tim Trio, Siemens Medical Solutions). An 18-cm diameter, eight-channel transmit–receive phased-array (PA) knee coil was used for all of the imaging measurements.
NMR Experiments.
1H spectroscopy was performed with a hard pulse power of with ω1/2π = 23 kHz and a 5° pulse. A spectral width of 10 kHz was used and 8,192 data points were recorded. Eight transients were acquired for each spectrum by using a repetition delay of 1 s. Water T1 measurements were performed by the saturation recovery method (to avoid radiation-damping problems) (36). Three 90°-crusher gradient pairs were used before the readout 90° pulse to remove transverse bulk magnetization. The three crusher gradients of 1-ms duration were performed with 0.05 T/m, 0.1 T/m, and 0.15 T/m. The total time for each saturation recovery measurement was ≈30 min, and the following eight delays were used in all of the spin-lattice measurements: 20 s, 10 s, 5 s, 2 s, 1 s, 500 ms, 100 ms, and 1 ms. Four transients were acquired for each delay by using a repetition delay of 30 s. The 23Na single-pulse experiments were performed with a 90° pulse with ω1/2π = 22 kHz and 64 transients. A 250-ms recycle delay and 10-kHz window width were used.
For the CEST experiments, continuous-wave (CW) irradiation was used with irradiation power and duration varying according to the system of interest, followed by a 5° pulse. Eight accumulations were used, a window width of 10 kHz was used, 8,000 data points were collected, and the recycle delay was set to 8 s. For the z spectra, a total of 71 spectra were collected with 0.2 ppm shift in offset frequency per step. The water intensity was then plotted as a function of the irradiation frequency with respect to the center of the main water resonance. The MTRasym plots according to Eq. 2 were created with S0 being the water signal intensity after irradiation at a +40-ppm offset.
The saturation duration and power levels of the presaturation were as follows: for Fig. 1 a and c, 4 s and 100 Hz; for Fig. 1b, 50 s and 50 Hz; for Fig. 1d, 10 s and 50 Hz; for Fig. 2, 4 s and 250 Hz; and for Fig. 3, 8 s and 16 Hz.
MRI Experiments.
The CEST imaging sequence was modified on the basis of the spoiled gradient echo (GRE) sequence with a train of ten 180° Gaussian pulses with pulse length 31 ms, interval 1 ms, offset 1.0 ppm, and average saturation power 42 Hz. The acquisition parameters of the CEST image on the patella were as follows: number of sections = 5, repetition time/echo time (TR/TE) = 2,070 ms/4 ms; section thickness = 3 mm; acquisition matrix = 256 × 128; field of view = 150 mm × 150 mm. To meet the image load requirements, a 1-liter phantom of 4% agarose was installed at the bottom of the patella sample. The same saturation parameters were used on the human subject, and the acquisition parameters were as follows: number of sections = 5, TR/TE = 2,070 ms/4 ms; section thickness = 3 mm; acquisition matrix = 256 × 256; field of view = 150 mm × 150 mm. Conventional selective fat suppression was used (37).
Data Processing.
[23Na] was calibrated with the 23Na signal intensity from the 137 mM 23Na/4% agarose system. By counting the volume factor of cartilage and 23Na/agarose in the NMR coil, [23Na] was determined as 255 mM in fresh cartilage. Imaging processing was performed with ImageJ (http://rsb.info.nih.gov/ij). In Figs. 3b and 4b, the CEST contrast was extracted by segmentation of the region of interest, the measurement of the mean signal intensities, and calculation according to Eq. 3.
ACKNOWLEDGMENTS.
We thank Mr. Jian Xu (Siemens Medical Solutions USA, New York, NY) for MR pulse programming and Dr. Ligong Wang (Center for Biomedical Imaging, New York University Medical Center) for help on image processing of the human knee. The spectroscopy work was supported by National Science Foundation Grant CHE-0554400, and the imaging and cartilage depletion work was supported by National Institutes of Health Grant 1R21AR054002-01A1. R.R.R. acknowledges support from National Institutes of Health Grant R01-AR053133-01A2. A.J. is a member of the New York Structural Biology Center, which is supported by the New York State Office of Science, Technology, and Academic Research and National Institutes of Health Grant P41 FM66354. This article is part of W.L.'s Ph.D. dissertation.
Footnotes
Conflict of interest statement: The authors have filed a provisional patent application.
This article is a PNAS Direct Submission.
Hubbard PL, Närväinen J, Kauppinen RA, Morris GA, Proceedings of the 15th Scientific Meeting of the International Society for Magnetic Resonance in Medicine, May 19–25, 2007, Berlin, Germany, p 3464.
References
- 1.Dudhia J. Cell Mol Life Sci. 2005;62:2241–2256. doi: 10.1007/s00018-005-5217-x. [DOI] [PMC free article] [PubMed] [Google Scholar]
- 2.Knudson AG, Ferrante ND, Curtis JE. Proc Natl Acad Sci USA. 1971;68:1738–1741. doi: 10.1073/pnas.68.8.1738. [DOI] [PMC free article] [PubMed] [Google Scholar]
- 3.Roughley PJ. Eur Cell Mater. 2006;12:92–101. doi: 10.22203/ecm.v012a11. [DOI] [PubMed] [Google Scholar]
- 4.Blumenkrantz G, Li X, Han ET, Newitt DC, Crane JC, Link TM, Majumdar S. Magn Reson Imaging. 2006;24:1001–1007. doi: 10.1016/j.mri.2006.04.013. [DOI] [PubMed] [Google Scholar]
- 5.Moskowitz RW, Altman RD, Hochberg MC, Buckwalter JA, Goldberg VM. Osteoarthritis: Diagnosis and Medical/Surgical Management. Philadelphia: Lippincott Williams & Wilkins; 2007. [Google Scholar]
- 6.Burstein D, Bashir A, Gray M. Invest Radiol. 2000;35:622–638. doi: 10.1097/00004424-200010000-00008. [DOI] [PubMed] [Google Scholar]
- 7.Niinimäki JL, Parviainen O, Ruohonen J, Ojala RO, Kurunlahti M, Karppinen J, Tervonen O, Nieminen MT. J Magn Reson Imaging. 2006;24:796–800. doi: 10.1002/jmri.20693. [DOI] [PubMed] [Google Scholar]
- 8.Regatte RR, Akella SVS, Borthakur A, Kneeland JB, Reddy R. Radiology. 2003;229:269–274. doi: 10.1148/radiol.2291021041. [DOI] [PubMed] [Google Scholar]
- 9.Wheaton AJ, Borthakur A, Corbo M, Charagundla SR, Reddy R. Magn Reson Med. 2004;51:1096–1102. doi: 10.1002/mrm.20141. [DOI] [PubMed] [Google Scholar]
- 10.Duvvuri U, Goldberg AD, Kranz JK, Hoang L, Reddy R, Wehrli FW, Wand AJ, Englander SW, Leigh JS. Proc Natl Acad Sci USA. 2001;98:12479–12484. doi: 10.1073/pnas.221471898. [DOI] [PMC free article] [PubMed] [Google Scholar]
- 11.Lesperance LM, Gray ML, Burstein D. J Orthop Res. 1992;10:1–13. doi: 10.1002/jor.1100100102. [DOI] [PubMed] [Google Scholar]
- 12.Shapiro EM, Borthakur A, Gougoutas A, Reddy R. Magn Reson Med. 2002;47:284–291. doi: 10.1002/mrm.10054. [DOI] [PMC free article] [PubMed] [Google Scholar]
- 13.Ling W, Regatte RR, Schweitzer ME, Jerschow A. Magn Reson Med. 2006;56:1151–1155. doi: 10.1002/mrm.21062. [DOI] [PubMed] [Google Scholar]
- 14.Shinar H, Navon G. NMR Biomed. 2006;19:877–893. doi: 10.1002/nbm.1068. [DOI] [PubMed] [Google Scholar]
- 15.Ling W, Jerschow A. J Magn Reson. 2005;176:234–238. doi: 10.1016/j.jmr.2005.06.006. [DOI] [PubMed] [Google Scholar]
- 16.Choy J, Ling W, Jerschow A. J Magn Reson. 2006;180:105–109. doi: 10.1016/j.jmr.2006.01.011. [DOI] [PubMed] [Google Scholar]
- 17.Ling W, Jerschow A. Solid State NMR. 2006;29:227–231. doi: 10.1016/j.ssnmr.2005.09.012. [DOI] [PubMed] [Google Scholar]
- 18.Eliav U, Keinan-Adamsky K, Navon G. J Magn Reson. 2003;165:276–281. doi: 10.1016/j.jmr.2003.09.002. [DOI] [PubMed] [Google Scholar]
- 19.Ling W, Regatte RR, Schweitzer ME, Jerschow A. NMR Biomed. 2008 doi: 10.1002/nbm.1193. [DOI] [PubMed] [Google Scholar]
- 20.Guivel-Scharen V, Sinnwell T, Wolff SD, Balaban RS. J Magn Reson. 1998;133:36–45. doi: 10.1006/jmre.1998.1440. [DOI] [PubMed] [Google Scholar]
- 21.Ward KM, Aletras AH, Balaban RS. J Magn Reson. 2000;143:79–87. doi: 10.1006/jmre.1999.1956. [DOI] [PubMed] [Google Scholar]
- 22.Zhou J, van Zijl PCM. Prog NMR Spectrosc. 2006;48:109–136. [Google Scholar]
- 23.Zhou J, Payen J-F, Wilson DA, Traystman RJ, van Zijl PCM. Nature Med. 2003;9:1085–1090. doi: 10.1038/nm907. [DOI] [PubMed] [Google Scholar]
- 24.Zhou J, Lal B, Wilson DA, Laterra J, van Zijl PCM. Magn Reson Med. 2003;50:1120–1126. doi: 10.1002/mrm.10651. [DOI] [PubMed] [Google Scholar]
- 25.van Zijl PCM, Jones CK, Ren J, Malloy CR, Sherry AD. Proc Natl Acad Sci USA. 2007;104:4359–4364. doi: 10.1073/pnas.0700281104. [DOI] [PMC free article] [PubMed] [Google Scholar]
- 26.Gilad AA, McMahon MT, Walczak P, Winnard PT, Jr, Raman V, van Laarhoven HWM, Skoglund CM, Bulte JWM, van Zijl PCM. Nat Biotechnol. 2007;25:217–219. doi: 10.1038/nbt1277. [DOI] [PubMed] [Google Scholar]
- 27.Hills BP, Cano C, Belton PS. Macromolecules. 1991;24:2944–2950. [Google Scholar]
- 28.Hinton DP, Bryant RG. Magn Reson Med. 1996;35:497–505. doi: 10.1002/mrm.1910350408. [DOI] [PubMed] [Google Scholar]
- 29.Schiller J, Naji L, Huster D, Kaufmann J, Arnold K. MAGMA. 2001;13:19–27. doi: 10.1007/BF02668647. [DOI] [PubMed] [Google Scholar]
- 30.Noggle JH, Schirmer RE. The Nuclear Overhauser Effect, Chemical Application. New York: Academic; 1971. [DOI] [PubMed] [Google Scholar]
- 31.Chen W, Avison MJ, Zhu XH, Shulman RG. Biochemistry. 1993;32:11483–11487. doi: 10.1021/bi00094a003. [DOI] [PubMed] [Google Scholar]
- 32.Eliav U, Navon G. J Am Chem Soc. 2002;124:3125–3132. doi: 10.1021/ja011791n. [DOI] [PubMed] [Google Scholar]
- 33.Bartholomew JS, Handley CJ, Lowther DA. Biochem J. 1985;227:429–437. doi: 10.1042/bj2270429. [DOI] [PMC free article] [PubMed] [Google Scholar]
- 34.Wang L, Schweitzer ME, Padua A, Regatte RR. J Magn Reson Imaging. 2008;27:154–161. doi: 10.1002/jmri.21109. [DOI] [PubMed] [Google Scholar]
- 35.Torchia DA, Hasson MA, Hascall VC. J Biol Chem. 1977;252:3617–3625. [PubMed] [Google Scholar]
- 36.Mao XA, Ye CH. Concepts Magn Reson A. 1997;9:173–187. [Google Scholar]
- 37.Rosen BR, Widen VJ, Brady TJ. J Comput Assist Tomogr. 1984;8:813–818. doi: 10.1097/00004728-198410000-00001. [DOI] [PubMed] [Google Scholar]


