

Abstract
Regulators of G-protein signaling (RGS) are involved in a wide variety of functions, including olfaction, vision, and cell migration. RGS5 has a perivascular expression pattern and was recently identified as a marker for brain pericytes. This suggests a role for RGS5 in vascular development and pericyte biology. We have created a mouse line which lacks the rgs5 gene and replaced it with a green fluorescent protein (GFP) reporter (rgs5GFP/GFP). The mice are viable and fertile and display no obvious developmental defects, and the vasculature appears to develop normally with proper pericyte coverage. Also, no differences were observed in the vasculature under pathological conditions, such as tumor growth and oxygen-induced retinopathy. The GFP expression in pericytes of rgs5GFP mice allows detection and sorting of these cells, thereby providing a valuable novel tool for pericyte research.
The regulator of G-protein signaling (RGS) family consists of more than 30 members (30), which are classified into several different subfamilies. Their function is to act as GTPase-activating proteins for heterotrimeric G-protein α-subunits (Gα) (12), and thus, RGS proteins negatively regulate G-protein signaling. The conserved 120-amino-acid residue RGS domain is responsible for interacting with Gα subunits. RGS proteins participate in a wide variety of functions, including olfaction, vision, cell migration, or hypertrophic responses in the heart (10, 22, 23, 25). G-protein-coupled receptors, such as EDG-1 or angiotensin II type 1, have been shown to play important biological roles in the developing vascular system (16, 24). Therefore, it is likely that RGS proteins are involved in the modulation of vascular components (i.e., pericytes and endothelial cells) in developmental angiogenesis or pathological vessel remodeling.
RGS4, -5, and -16 are members of the subfamily of small RGS proteins, which are approximately 200 amino acid residues long and have short amino- and carboxyl-terminal regions, in addition to the RGS domain (15, 29). These three proteins have been shown to be highly homologous (12), and all have specific N-terminal sequences which make them substrates for the N-end rule degradation pathway (4, 17, 18). The expression patterns of RGS4, -5, and -16, however, do not appear to overlap significantly, suggesting different roles for these RGS proteins (3, 21). Indeed, RGS5 was recently identified as a marker for brain pericytes (6) and shown to have a pattern of expression reminiscent of that of platelet-derived growth factor receptor β (PDGFR-β) (11). rgs5 mRNA is present in all major organs except the liver and the lungs, and high levels are found in the central nervous system and in kidney blood vessels and glomerular mesangial cells (11). rgs5 is strongly expressed in all major arteries, including the aorta. Levels of rgs5 mRNA peak at embryonic day 14.5 (E14.5) and decline thereafter, but significant expression persists in adult animals (11).
Apart from the described perivascular expression pattern, the role of RGS5 in vivo is largely unknown. It has been shown that the protein is induced in pericytes during the “angiogenic switch” in tumor angiogenesis, wound healing, and ovulation, coinciding with active vessel remodeling during neovascularization (2). Thus, RGS5 can be thought of as a pericyte marker at sites of physiological and pathological angiogenesis, which would argue for RGS5 playing a role in developmental angiogenesis and vascular remodeling.
With the purpose of analyzing the role of RGS5 in vivo, we have generated a mouse line where the rgs5 coding sequence was deleted and substituted in frame with green fluorescent protein (GFP) (rgs5GFP/GFP mice). In this study, we report that mice homozygous for the inactivated rgs5 allele are viable and fertile, do not display any obvious developmental or behavioral defects, and seem to establish a normal vasculature with appropriate pericyte coverage. In pathological conditions, such as tumor growth and oxygen-induced retinopathy, vascular remodeling was similar in the wild-type and mutant mice. Using tail cuff plethysmography, we observed a mean arterial pressure (MAP) decrease of 16% and an increase of 8% in heart rate. We also document perivascular GFP expression, which colocalized with the known pericyte marker PDGFR-β. Thus, we propose the rgs5GFP mouse as a novel tool for pericyte identification and isolation.
MATERIALS AND METHODS
Targeting strategy and generation of mutant mice.
VelociGene technology (28) was used to generate a specific deletion of the genomic sequence encoding the entire RGS domain of RGS5, extending from exon 2 to the TAG termination codon. This sequence, which corresponds to a 15.5-kb region encompassing all RGS-domain coding exons and intervening introns, was replaced in frame by the coding sequence of GFP followed by a loxP-flanked neomycin selection cassette (see Fig. 1a). Briefly, a bacterial artificial chromosome containing the 15.5-kb rgs5 coding region and flanking sequences was modified to generate a bacterial artificial chromosome-based targeting vector, which was then linearized and used to replace the rgs5 gene sequence in F1H4 (C57BL/6-129 hybrid) mouse embryonic stem (ES) cells. Correctly targeted ES cells were identified by using the loss-of-native-allele assay as previously described (28). Two independent correctly targeted ES lines were used to generate chimeric male mice which were then bred to C57BL/6 and/or ICR females to generate F1 mice. Heterozygous F1 mice (backcrossed to C57BL/6) were bred to homozygosity, and correct targeting was reconfirmed by reverse transcription and quantitative real-time PCR. The animals were backcrossed further against C57BL/6 mice. Animals backcrossed seven generations (F7) were used for experiments, and littermate wild-type animals served as controls. Animals were housed under standard conditions in the Scheele Animal Facility at the Department of Medical Biochemistry and Biophysics, Karolinska Institute. All procedures were carried out in accordance with institutional policies following approval from the animal ethical board of northern Stockholm.
FIG. 1.

Generation, verification, and genotyping strategy of rgs5GFP mice. (a) Schematic representation of rgs5 gene targeting strategy achieved by the use of VelociGene technology. Top, wild-type rgs5 allele with exons 1 to 5 (boxes; coding sequences have dark shading; 5′ and 3′ untranslated regions have light shading). Bottom, targeting vector and recombined locus. The genomic sequence of rgs5 from part of exons 2 to 5 has been replaced in frame by the coding sequence of GFP and a loxP-flanked neomycin gene. Primers used for genotyping (see the text for details) are represented by arrowheads. (b) PCR genotyping with primers for wild-type and recombinant alleles. A 262-bp fragment was amplified from the wild-type allele, and a 363-bp fragment was amplified from the mutant allele. (c) RT-PCR on cDNA generated from brain RNA from 5-week-old animals. No band was observed for the mutant mice. (d) Quantitative real-time PCR results on rgs5 transcript in P6 brain RNA from wild-type (n = 3), heterozygous (n = 2), or knockout animals (n = 4). Wild-type samples were used as calibrators for comparative expression results. (e and f) Immunohistochemical staining of wild-type and mutant P20 retinas with antibodies against CD31 (red) and GFP (green). (g and h) Immunohistochemical staining of brain tissue from rgs5GFP/GFP mice with antibody against CD31 (red) or GFP (green) (g) or against PDGFR-β (red) or GFP (green) (h). GFP expression colocalizes with PDGFR-β and appears predominantly in the cell bodies of pericytes (arrowheads). (i and j) In situ hybridization on E18.5 embryo sections from wild-type animals using rgs5 antisense probe as detailed in the text. (i) Strong expression is seen in mesangial cells (arrow) of the kidney. Arrowheads indicate Bowman's space surrounding the kidney glomerulus. (j) Pericytes of brain vessels express rgs5 (arrowheads). (k to p) Immunohistochemical stainings of rgs5GFP/GFP mouse organs. Kidney glomeruli (k), kidney cortex (l), brain (m), heart (n), intestine (o), and pancreas (p) are shown, with antibody against CD31 (red) or GFP (green). Scale bar, 20 μm (e to h and k to p) or 25 μm (i and j). For inserts (l to p), original magnification, ×2.
Genotyping of mutant mice.
PCR amplification of genomic DNA extracted from ear biopsies was used to genotype the rgs5GFP/GFP mice. Briefly, ear samples were incubated in DirectPCR lysis reagent (Viagen Biotech Inc., Los Angeles, CA) containing 0.3 mg/ml proteinase K overnight at 56°C. PCR was performed using three specific oligonucleotide primers amplifying the wild-type and knock-in alleles (forward 1, 5′-TTGGAACCCACGTGTCCTGTT-3′ in intron 1; reverse 1, 5′-AGATGAACTTCAGGGTCAGCTT-3′ in the GFP cassette; and reverse 2, 5′-TGGAGGAGAATTCCCAACTTGA-3′ in exon 2. The forward 1 and reverse 1 primers produced a 363-bp band corresponding to the mutant allele, while forward 1 and reverse 2 amplified a 262-bp wild-type allele) (see Fig. 1a and b). The PCRs contained 2.5 μl 10× PCR buffer with MgCl2, 2.5 μl deoxynucleoside triphosphate (2 mM), 2 μl primers (5 μM), 0.2 μl HotStarTaq DNA polymerase (5 U/μl), 1 μl DNA template, and distilled H2O in a final volume of 25 μl. Amplification was performed using a Perkin-Elmer 9700 PCR machine with the following program: 95°C for 15 min and then 95°C for 1 min, 55°C for 1 min, and 72°C for 1 min for 30 cycles, and finally 72°C for 10 min.
RT-PCR.
The presence of rgs5 transcript was analyzed by reverse transcription-PCR (RT-PCR) according to guidelines supplied by the manufacturer (SuperScript III First-Strand synthesis system for RT-PCR; Invitrogen, Carlsbad, CA). RNA samples were prepared from brains of 5-week-old animals (two wild-type animals and two mutants) using the RNeasy Lipid Mini kit (Qiagen, Hilden, Germany). The entire coding sequence of the rgs5 gene was amplified with the use of the forward (5′-ATGTGTAAGGGACTGGCAGC-3′) and reverse (5′-ATACTTGATTAGCTCCTTAT-3′) primers, and this yielded a wild-type product of 546 bp (see Fig. 1c).
Quantitative real-time PCR.
Total RNA was extracted from freshly dissected retinas from 5- and 20-day-old mice. The cornea, lens, and retinal pigment epithelium of the eyes were removed immediately after the animal was sacrificed, and the retinas were immersed in RNAlater (Ambion, Austin, TX). Retinas were homogenized and applied to QIAshredder columns (Qiagen), and the RNA was extracted using an RNeasy Micro kit (Qiagen). Also, RNA was extracted from 6-day-old mouse brains using the RNeasy Lipid Mini kit (Qiagen). Information about total RNA quality and concentration was obtained using a 2100 Bioanalyzer machine (Agilent Technologies, Santa Clara, CA). Reverse transcription was performed using the SuperScript III First-Strand synthesis system for RT-PCR (Invitrogen). TaqMan gene expression assays from Applied Biosystems (Foster City, CA) were used, and the product identification numbers for our candidate genes are as follows: RGS5, Mm00501393_m1; RGS16, Mm00803317_m1; RGS4, Mm00501389_m1; PDGFR-β, Mm00435546_m1; Kir6.1, Mm00434620_m1. Murine glyceraldehyde-3-phosphate dehydrogenase (Mm99999915_g1) was used as an endogenous control, and all samples were triplicated in the PCR. Real-time quantitative PCR performed according to guidelines provided by Applied Biosystems and the comparative cycle threshold (CT) method (ΔΔCT quantitation) was used to calculate the difference between the samples.
Tumor experiments.
T241 fibrosarcoma cells (syngeneic of C57BL/6) were cultured in Dulbecco's modified Eagle medium (Gibco/Invitrogen) supplemented with 10% fetal bovine serum, 50 U/ml penicillin, and 0.05 μg/ml streptomycin. On the day of tumor induction, cells were suspended in Dulbecco's modified Eagle medium (1 × 10⁶ cells/100 μl) and injected subcutaneously in the dorsal skinfold of 11-week-old mice under isoflurane gas anesthesia (n = 5 for both rgs5 knockout mice and littermate controls). A week later, tumor lengths and widths were measured daily using a caliper, and the tumor volume (cm3) was calculated as (width2 × length)/2. On day 14 after tumor cell inoculation, the animals were sacrificed with CO2 asphyxiation, followed by cervical dislocation, and the tumors were surgically removed and fixed in 4% paraformaldehyde (PFA) in phosphate-buffered saline (PBS), pH 7.4, overnight.
Oxygen-induced retinopathy.
Neovascular retinopathy was induced as previously described (26). In brief, 7-day-old pups (P7) were placed in an airtight chamber with their mothers and exposed to 75% oxygen for 5 days in room temperature. At P12, the mice were removed from the chamber and left in normal room air. Five days later, the pups were sacrificed by cervical dislocation, and the eyes were excised and fixed in 4% PFA in PBS, pH 7.4. NG2-stained retinas (see “Histological methods” below) were used for quantification of neovascularization (two eyes each from three rgs5GFP/GFP mice and three littermate controls). Three different ×10 images were randomly selected from each flat-mounted retina (with a Nikon E800 microscope), and the amount of pixels per field corresponding to the area covered by NG2-immunoreactive pericytes was determined using the “Color range” and “Histogram” tools in Adobe Photoshop.
Histological methods.
All fixed samples were cryoprotected in 30% sucrose in PBS, embedded in OCT compound (Sakura, Zoeterwoude, The Netherlands), frozen, and stored at −70°C until sectioning. The frozen tissue was sectioned (12 to 14 μm) and permeabilized with 1% bovine serum albumin (BSA) and 0.5% Triton X-100 in PBS and then stained with primary antibodies against CD31 (PECAM-1) (1:250; BD Pharmingen, Franklin Lakes, NJ), GFP (1:200; Molecular Probes/Invitrogen), NG2 (1:200; Chemicon, Temecula, CA), and FITC-conjugated α-smooth muscle actin (αSMA) (1:100; Abcam, Cambridge, United Kingdom). Immunoreactive products were visualized by incubation with appropriate Alexa Fluor dye-conjugated antibodies (1:200; Molecular Probes/Invitrogen). All steps were performed in 0.125 to 0.5% Triton X-100 in PBS. The sections were mounted with Mowiol 4-88 (Hoechst, Frankfurt, Germany) supplemented with 2.5% antibleaching agent (DABCO/Sigma, St. Louis, MO). Z-stack images were obtained by confocal microscopy using a Zeiss 510 Meta microscope (Zeiss, Germany).
For studies of whole-mount retinas, eyes fixed in 4% PFA were dissected by removing the cornea, lens, retinal pigment epithelium, choroidea, sclera, and hyaloid vessels. Retinas were washed in PBS and then permeabilized overnight in 1% BSA and 0.5% Triton X-100 in PBS. Primary antibodies against CD31 (BD Pharmingen), GFP (Molecular Probes/Invitrogen), and NG2 (Chemicon) were added to 0.5% Triton X-100 in PBS, and the retinas were incubated on an orbital shaker overnight at 4°C. Retinas were washed extensively and incubated with appropriate secondary antibodies conjugated to Alexa-Fluor dyes (Molecular Probes/Invitrogen) diluted in 0.25% Triton X-100 in PBS overnight at 4°C. The retinas were then washed again several times in PBS, post-fixed in 4% PFA, flat mounted with Mowiol 4-88 (Hoechst), and analyzed as described above by confocal microscopy (Zeiss 510 Meta).
For pericyte counting, the XlacZ4 reporter mouse was used (27). This transgenic mouse expresses the LacZ reporter in the nuclei of pericyte/vascular smooth muscle cells in a specific fashion and allows for detection and quantification of pericytes. These mice were crossed with the rgs5GPP/GFP mice to generate double mutants. Double mutant and littermate XlacZ4 control mice were sacrificed at P19, the eyes were collected, and retinas were dissected as previously described. The retinas were stained with β-galactosidase as previously reported (13) and postfixed in 4% PFA in PBS. Retinas were incubated in 1% BSA-0.5% Tween 20 in PBS overnight, washed twice in PBlec (1% Tween 20, 0.1 mM CaCl2, 0.1 mM MgCl2, 0.1 mM MnCl2 in PBS [pH 6.8]), and incubated in biotinylated isolectin from Bandeiraea simplicifolia (1:10; Sigma) in PBlec at 4°C overnight. After washing in PBS, isolectin was detected using 10 μg/ml of a fluorescent streptavidin conjugate (1:200 Alexa Fluor 568; Molecular Probes). Pericyte densities were quantified by counting XLacZ4-positive nuclei per field under the microscope (Nikon E800). Only perivascular XlacZ4-positive nuclei, delineated by isolectin-expressing blood vessels, were counted. Each retina was image dissected in three layers of vasculature, and eight different ×40 micrographies were taken per layer (14).
In situ hybridization.
Nonradioactive in situ hybridization was performed as previously described (7) with modifications detailed by Lindahl et al. (19). rgs5 sense and antisense probes were generated by the use of an rgs5 expressed sequence tag from Incyte Genomics (St. Louis, MO), which was subcloned in a pBluescript vector. Probes were labeled by incorporating digoxigenin-labeled UTP (NTP labeling mix; Roche, Basel, Switzerland). No hybridization signal was obtained with the sense probe, and this was used as a negative control.
Urine analysis.
Urine was collected from three wild-type and three mutant P20 animals. The presence of albuminuria was analyzed by running 2 μl of urine on a sodium dodecyl sulfate-polyacrylamide gel and staining with Coomassie blue. Urine from a proteinuric mouse model, the Fat2 mutant mouse (Y. Sun and K. Tryggvason, personal communication), was used as a positive control.
BP determination by tail cuff plethysmography.
Blood pressure (BP) was determined in conscious male and female rgs5+/+ and rgs5GFP/GFP mice by tail cuff plethysmography; data were acquired with the Kent Scientific CODA 6 noninvasive BP acquisition system following the manufacturer's specifications. Briefly, mice (n = 8; 3 to 5 months old) were conditioned by undergoing plethysmography daily for 4 days, with data recorded on the 4th day. Mice were placed in a warmed restraining chamber, an inflatable occlusion cuff was placed around the mouse tail, and a volume pressure recording cuff was used according to the manufacturer's specifications to measure arterial systolic pressure, arterial diastolic pressure, and heart rate. After the initial 5 readings were discarded, the following 20 to 25 readings were recorded for each animal. Measurements for an animal were repeated in the event of animal movement or weak pressure/flow recordings. The remaining data points for each animal were averaged to determine systolic pressure, diastolic pressure, MAP, and heart rate.
Statistical analyses.
Statistical analyses were carried out using GraphPad (GraphPad Prism, San Diego, CA) to calculate unpaired Student's t test (two-sided, equal variance). Data are presented as means ± standard errors.
RESULTS AND DISCUSSION
rgs5 mutant mice were generated by the use of VelociGene technology (28). Bacterial artificial chromosome-based targeting vectors were used to specifically replace the RGS-domain coding region of RGS5 with GFP and a loxP-flanked neomycin selection cassette (Fig. 1a). Chimeric mice derived from two independent ES clones were bred to C57BL/6 males to produce F1 offspring, and rgs5GFP/+ mice were intercrossed to produce homozygous mutant offspring (Fig. 1b).
The absence of rgs5 mRNA in the mutant mice was confirmed by RT-PCR with cDNA generated from brain RNA from 5-week-old animals. No product was amplified from the rgs5GFP/GFP mice, while littermate controls produced the expected band (Fig. 1c). We also performed quantitative real-time PCR on cDNA generated from brain RNA from 6-day-old animals. The results indicate that the rgs5 transcript is absent in the knockout mice, while the rgs5GFP/+ animals have ∼50% less rgs5 mRNA than wild-type littermate controls (Fig. 1d).
In the rgs5 mutant mice, the entire RGS domain of RGS5 was replaced in frame by the coding sequence of GFP. The fluorescent signal from GFP was detectable in brain tissue under a fluorescent dissection microscope and in dissected retinas using confocal microscopy (data not shown). However, the signal was rather weak, and therefore we used anti-GFP antibodies to amplify the signal. Immunostaining for GFP revealed a strong signal in pericytes of the rgs5GFP/GFP retinas and brains (Fig. 1e to g), and the GFP signal colocalized with PDGFR-β (Fig. 1h). This confirms that the knock-in strategy was successful and that RGS5 is indeed expressed by pericytes.
rgs5 mRNA has been shown to be highly expressed in developing pericytes and vascular smooth muscle cells (6). Cho et al. (11) found that rgs5 mRNA levels peak on E14.5 and decline thereafter. However, considerable expression persists in the aorta, major vessels, and renal and cerebral microvasculature of adult mice (11). We have confirmed the expression of rgs5 mRNA in kidneys and brains of E18.5 embryos by in situ hybridization. The mRNA expression clearly localizes to the mesangial cells of kidney glomeruli and to the pericytes of vessels in the brain (Fig. 1i and j). To our surprise, we could not detect any GFP expression in mesangial cells of the rgs5GFP/GFP mice, as analyzed by immunohistochemistry (IHC) (Fig. 1k). However, GFP expression was detected in perivascular cells of the renal cortex (outside glomeruli) (Fig. 1l). This may be explained by the fact that our knockout strategy may have deleted intronic regulatory elements necessary to drive expression of the rgs5 gene in mesangial cells. We have also detected perivascular GFP expression in brain, heart, intestine, and pancreas (Fig. 1m to p). Therefore, rgs5GFP/GFP mice could be a valuable tool in the future since they allow for easy detection of pericytes in different organs and might facilitate fluorescence-activated cell sorting of these cells from tissue samples.
Intercrosses between rgs5GFP/+ animals produced viable offspring at the expected Mendelian frequency. rgs5GFP/GFP animals develop normally into adulthood, and both males and females are fertile. rgs5 mutant mice gain weight at the same rate as their littermate controls (data not shown) and display an overall good general health (well-groomed fur, normal body posture, and behavior).
As previously mentioned, rgs5 mRNA expression persists in kidney and brain microvasculature of adult mice (11), and so we wanted to analyze the histology of kidneys and brains of mutant and control P30 animals. Hematoxylin-eosin staining of kidney and brain tissue sections from rgs5GFP/GFP and control animals failed to reveal any obvious differences in tissue architecture (Fig. 2a to d). Specifically, we found no abnormalities in glomerular histology (Fig. 2c and d; also data not shown). Moreover, we analyzed urine samples from rgs5GFP/GFP mice to determine whether the lack of RGS5 would disturb normal glomerular barrier function. Urine collected from rgs5 knockout animals showed no signs of albuminuria (Fig. 2e) or macroscopic hematuria (data not shown), indicating that RGS5 is not required for normal renal filtration.
FIG. 2.

rgs5 mRNA expression and analysis of tissue architecture and kidney function. (a to d) Hematoxylin-eosin staining of P30 brains (a and b) or kidneys (c and d) of wild-type and rgs5 mutant animals. Tissue architecture appears to be normal for the rgs5GFP/GFP mice. Scale bar, 50 μm. (e) Sodium dodecyl sulfate-polyacrylamide gel on urine samples from rgs5+/+ (lanes 1 to 3) or rgs5GFP/GFP (lanes 4 to 6) mice. Lane 7, urine from proteinuric Fat2 mutant mouse (positive control). The arrow indicates the molecular mass of albumin (∼67 kDa). No albuminuria was detected in tissue from rgs5GFP/GFP mice.
Since pericytes are a major expression site for RGS5 (6, 11), we hypothesized that the lack of RGS5 could compromise the recruitment or distribution of pericytes. GFP staining of rgs5GFP/GFP retinas demonstrated the presence of pericytes in rgs5 knockout mice, but comparison with controls required the use of other markers. We therefore crossed rgs5GFP/GFP mutants with XlacZ4 mice (27). XlacZ4 mice express the LacZ reporter gene in nuclei of pericytes, thus facilitating quantification of pericyte numbers. We image dissected whole-mounted retinas, which allowed for pericyte quantification in each of the three layers of retinal vasculature. No difference was observed in the amount of pericytes present in retinas of P19 rgs5GFP/GFP-XlacZ4 mice compared to results for rgs5+/+-XlacZ4 mice (Table 1; Fig. 3a and b). To further study the possible involvement of rgs5 in the recruitment of pericytes in the retina, we analyzed the mRNA expression of known pericyte markers, such as PDGFR-β and Kir6.1 (5), by quantitative real-time PCR on P19 retinas. No differences were found in the relative mRNA levels of these genes in rgs5GFP/GFP mice compared to results for littermate controls (Fig. 3c, right). The same results were obtained on developing retinas of P6 mice (data not shown). This indicates that the lack of RGS5 does not appear to have a major impact on the abundance of pericytes in the retinal vasculature. We also used NG2 immunostaining in order to study pericyte distribution and blood vessel coverage. NG2 antibodies stain the pericyte cell surface, thereby depicting cellular shape and adherence to the capillary wall. Partial pericyte detachment and abnormal pericyte shape have been observed in mice lacking the PDGF-B retention motif, which leads to PDGF-B dissociation from the capillary wall and reduced PDGFR-β activation in pericytes (1, 20). RGS5 has been suggested to affect PDGFR-β signaling through ERK-2 (11). We therefore studied whether pericyte distribution was altered in the rgs5GFP/GFP mice. However, NG2 staining of retinal vessels did not reveal any obvious deviations in pericyte distribution and blood vessel coverage in rgs5 mutant mice compared to results for littermate controls (Fig. 3d and e).
TABLE 1.
Retinal pericyte count per fielda
| Retinal section | No. of pericytes/field for genotype
|
|
|---|---|---|
| rgs5GFP/GFP | rgs5+/+ | |
| Layer 1 | 21.53 ± 0.80 | 19.08 ± 0.91 |
| Layer 2 | 20.17 ± 1.80 | 21.38 ± 1.75 |
| Layer 3 | 22.5 ± 2.22 | 23.0 ± 0.13 |
| Total count | 64.20 ± 0.68 | 63.46 ± 1.14 |
Pericyte count for P19 mutant and littermate control animals on retinas, using XlacZ4 as a pericyte marker. Data are expressed as means ± standard errors (n = 3 for each genotype).
FIG. 3.

Pericyte quantification, pericyte distribution, and quantitative PCR analyses. (a and b) Representative images of layer 1 used for pericyte quantification from rgs5+/+-XlacZ and rgs5GFP/GFP-XlacZ retinas stained with isolectin (red) and β-galactosidase (black). Arrowheads indicate β-galactosidase-positive pericyte nuclei. Scale bar, 50 μm. (c) Quantitative real-time PCR results on rgs4 and rgs16 (left) and the pericyte markers PDGFR-β and Kir6.1 (right). Wild-type samples were used as calibrators for comparative expression results. Neither rgs4 nor rgs16 mRNA seems to be upregulated in order to compensate for the loss of rgs5. Note the 50% decrease in rgs4 mRNA expression for mutant mice compared to results for littermate controls. No differences were observed in the expression of pericyte markers (PDGFR-β and Kir6.1) between the control and mutant mice (n = 3 for all samples). (d and e) Immunohistochemical staining of wild-type and mutant P30 retinas with an antibody against NG2 (green). Scale bar, 100 μm.
More than 30 proteins are members of the RGS family, and some of them are similar in structure and/or function. It has been shown that RGS5 shares a high degree of homology with RGS4 and -16 (12) and belongs to the same subfamily of small RGS proteins. The first 33 amino acids, which constitute a unique membrane association domain, are highly conserved between these three proteins (9). Also, RGS5, -4, and -16 share an N-terminal cysteine residue, which makes them targets for the N-end rule pathway for ubiquitin degradation (4, 17, 18). With this in mind, we wanted to investigate whether changes in the expression of any of these highly homologous genes could be compensating for the loss of RGS5. We analyzed mRNA expression from P19 retinas of rgs5GFP/GFP and littermate control mice by real-time quantitative PCR. No significant up- or downregulation of rgs16 mRNA was observed (Fig. 3c, left), indicating that the lack of RGS5 does not trigger changes in the mRNA expression of rgs16. The levels of rgs4 mRNA, however, were decreased by 25% in the rgs5GFP/+ mice (data not shown) and by 50% in the rgs5GFP/GFP mice (Fig. 3c, left). These results were confirmed using brain mRNA samples from P6 animals (data not shown). Both the rgs4 and rgs5 genes are located on chromosome 1q23, separated by only 5 × 10⁴ bp. We speculate that any of the introduced changes (deletion of intronic sequence or added GFP and neomycin resistance sequence) in the rgs5GFP allele may negatively influence expression of the neighboring rgs4 allele. However, at least we conclude that the RGS5 deficiency is not compensated for by upregulated rgs4 gene expression.
Since rgs5 mutant animals do not display any obvious defects in developmental angiogenesis, we studied whether the lack of this gene could play a role in pathological neovascularization. It has previously been stated that RGS5 is upregulated during the “angiogenic switch” in tumors and also in wound healing (2). In order to clarify the possible involvement of RGS5 in these processes, we studied neovascularization in tumors and a mouse model of oxygen-induced retinopathy (OIR).
To test the hypothesis that RGS5 plays a role in recruitment of pericytes in tumor vasculature, we injected T241 cells subcutaneously in rgs5 knockout and littermate control mice (n = 5 for each group). Tumor growth followed the same pattern in both rgs5GFP/GFP and control animals (Fig. 4a), and the tumors displayed no significant differences in size at the time of resection. The tumor endothelial cells were decorated with NG2- and αSMA-positive cells, as analyzed by IHC, showing no difference in pericyte coverage between the rgs5GFP/GFP and littermate control animals (Fig. 4b and c). Also, there was no significant difference in tumor vessel count per field (rgs5GFP/GFP = 84.4 ± 19.4; rgs5+/+ = 78.5 ± 10.3). These data indicate that the lack of RGS5 does not appear to have a substantial effect on tumor growth, tumor angiogenesis, or pericyte recruitment to tumor vessels. We did confirm, however, the expression of RGS5 in tumor pericytes visualizing GFP expression in the tumors. The GFP signal is perivascular (Fig. 4d), indicating that the RGS5-expressing cells are indeed tumor pericytes. The visualization of GFP-positive pericytes in the tumor further strengthens the usefulness of this transgenic mouse as a unique tool for pericyte identification and sorting.
FIG. 4.

Tumor growth and analyses of tumor vessels. (a) Tumor growth curve of T241 cells inoculated on control and rgs5GFP/GFP mice (n = 5 for each genotype and time point). (b to d) Immunohistochemical stainings of T241 tumors from control and mutant animals. Tumors from wild-type (b) or mutant (c) mice stained with antibody against CD31 (red), αSMA (green), or NG2 (blue). Both tumors appear to have similar pericyte coverage and expression of the analyzed markers. (d) Tumor from mutant mouse stained with antibody against CD31 (red) or GFP (green). Arrowheads indicate GFP-positive pericytes. Scale bar, 20 μm (b to d).
Exposure of mice to 75% oxygen from P7 to P12 disrupts normal development of the retinal vasculature. Vessels that have already formed regress, and development of new ones is delayed. When mice are returned to normoxia at P12, the low vascular density triggers a state of relative hypoxia in the retina, which results in exaggerated and abnormal vascular growth (OIR) (26), typically leading to the formation of epiretinal vascular tufts composed of proliferating endothelial cells and pericytes. Since RGS5 is upregulated in several neoangiogenic processes, we wanted to analyze whether pericyte recruitment or distribution was altered in the OIR response. We visualized NG2-positive pericytes on blood vessels in whole-mount retinal preparations. These experiments showed that pathological neovascularization in the rgs5GFP/GFP mice followed the same pattern as in littermate controls (Fig. 5a to d), and there was no significant difference in distribution by NG2-immunoreactive pericytes or the area covered by these cells (pixels per field: rgs5+/+ = 28,072 ± 3,067; rgs5GFP/GFP = 28,454 ± 1,740). Our results indicate that although rgs5 has been shown to be upregulated in neoangiogenic processes, the lack of this gene does not appear to have a major effect on pathological vessel formation in the retina, nor does it affect pericyte recruitment or coverage of the abnormal neovessels.
FIG. 5.
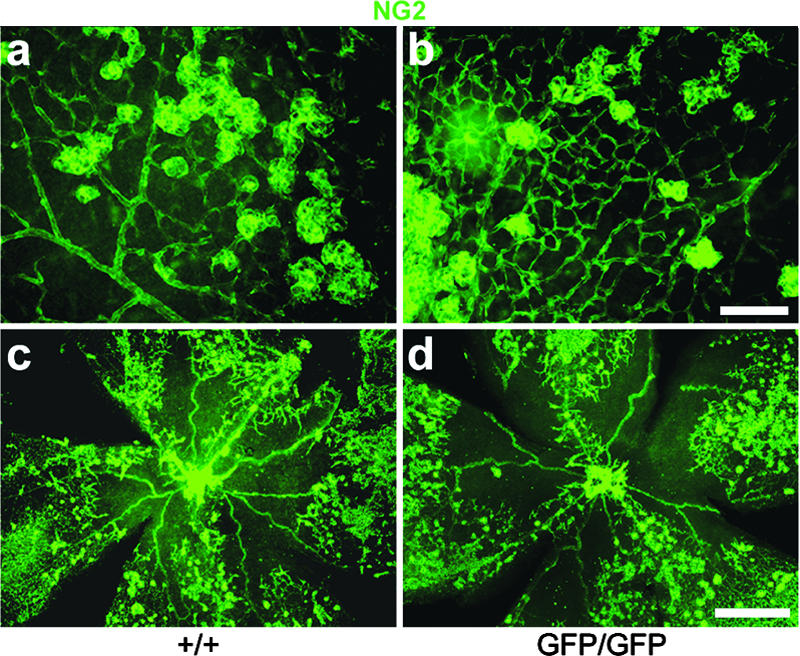
Pericyte distribution in normal retina and in oxygen-induced retinopathy. IHC on flat-mounted retinas from control or rgs5GFP/GFP mice. (a to d) Retinas from mice subjected to oxygen-induced retinopathy. NG2-immunoreactive pericytes are in green. No differences were observed in neovascularization or in the amount and distribution of NG2-positive pericytes between the control and mutant mice. Scale bar, 100 μm (a and b) or 500 μm (c and d).
A recent genomewide linkage and candidate-gene-based study reported association between RGS5 and hypertension in humans (8). We analyzed the physiological effect of loss of RGS5 expression upon BP regulation. Using tail cuff plethysmography, we obtained BP measurements in conscious, unanesthetized animals. As shown in Table 2, both systolic BP and diastolic BP were decreased in rgs5GFP/GFP animals compared to rgs5+/+ animals. Specifically, systolic BP decreased by 15% in rgs5GFP/GFP mice. Diastolic BP decreased by 17% in rgs5GFP/GFP mice compared to rgs5+/+ mice. Consequently, the MAP also decreased by 16% in rgs5GFP/GFP compared to rgs5+/+ animals (Fig. 6). A decrease in BP was also observed in male rgs5GFP/GFP mice, equivalent to the effect observed in the female mice (data not shown). As BP decreased, heart rate in rgs5GFP/GFP mice increased by 8%, suggestive of cardiac failure (i.e., low BP and high cardiac output). Future studies are aimed at determining the physiological consequence of decreased BP and increased heart rate in the rgs5 transgenic mice. The rgs5 null mice will constitute a valuable future tool for further investigating the possible role of pericytes and rgs5 in the regulation of vascular tone and other physiological and pathological processes.
TABLE 2.
BP measurements by tail cuff plethysmography
| Genotype | n | BP (mm Hg ± SEM)
|
Heart rate (beats/min ± SEM) | Body wt (g ± SEM) | |
|---|---|---|---|---|---|
| Systolic | Diastolic | ||||
| +/+ | 8 | 160 ± 5 | 128 ± 4 | 676 ± 32 | 22 ± 0 |
| GFP/GFP | 8 | 136a ± 9 | 106a ± 9 | 725 ± 32 | 22 ± 1 |
P < 0.05 by unpaired Student's t test (two tail, equal variance).
FIG. 6.

MAP in rgs5 transgenic mice. MAP was determined by tail cuff plethysmography in unanesthetized control and rgs5 null mice. rgs5GFP/GFP mice are hypotensive relative to littermate wild-type (rgs5+/+) mice (n = 8 animals; *, P < 0.05 by unpaired Student's t test [two tail, equal variance]).
Acknowledgments
This work was supported by grants from The Swedish Cancer Foundation, Association of International Cancer Research (AICR), The Novo Nordisk, Strategic Research, Swedish Diabetes, IngaBritt and Arne Lundberg, Knut and Alice Wallenberg, and Torsten and Ragnar Söderberg Foundations, and the EU 6th Framework Integrated Project Lymphangiogenomics, LSHG-CT-2004-503573.
We thank Jaakko Patrakka and Mirjana Poljakovic for critical review of the manuscript. We also thank Britt Gabrielsson, Anna Wickman, and Jing Jia (Center for Mouse Physiology and Bio-Imaging, Göteborg University) for assistance on blood pressure measurements.
Footnotes
Published ahead of print on 22 January 2008.
REFERENCES
- 1.Abramsson, A., S. Kurup, M. Busse, S. Yamada, P. Lindblom, E. Schallmeiner, D. Stenzel, D. Sauvaget, J. Ledin, M. Ringvall, U. Landegren, L. Kjellen, G. Bondjers, J. P. Li, U. Lindahl, D. Spillmann, C. Betsholtz, and H. Gerhardt. 2007. Defective N-sulfation of heparan sulfate proteoglycans limits PDGF-BB binding and pericyte recruitment in vascular development. Genes Dev. 21316-331. [DOI] [PMC free article] [PubMed] [Google Scholar]
- 2.Berger, M., G. Bergers, B. Arnold, G. J. Hammerling, and R. Ganss. 2005. Regulator of G-protein signaling-5 induction in pericytes coincides with active vessel remodeling during neovascularization. Blood 1051094-1101. [DOI] [PubMed] [Google Scholar]
- 3.Berthebaud, M., C. Riviere, P. Jarrier, A. Foudi, Y. Zhang, D. Compagno, A. Galy, W. Vainchenker, and F. Louache. 2005. RGS16 is a negative regulator of SDF-1-CXCR4 signaling in megakaryocytes. Blood 1062962-2968. [DOI] [PubMed] [Google Scholar]
- 4.Bodenstein, J., R. K. Sunahara, and R. R. Neubig. 2007. N-terminal residues control proteasomal degradation of RGS2, RGS4, and RGS5 in human embryonic kidney 293 cells. Mol. Pharmacol. 711040-1050. [DOI] [PubMed] [Google Scholar]
- 5.Bondjers, C., L. He, M. Takemoto, J. Norlin, N. Asker, M. Hellstrom, P. Lindahl, and C. Betsholtz. 2006. Microarray analysis of blood microvessels from PDGF-B and PDGF-Rbeta mutant mice identifies novel markers for brain pericytes. FASEB J. 201703-1705. [DOI] [PubMed] [Google Scholar]
- 6.Bondjers, C., M. Kalen, M. Hellstrom, S. J. Scheidl, A. Abramsson, O. Renner, P. Lindahl, H. Cho, J. Kehrl, and C. Betsholtz. 2003. Transcription profiling of platelet-derived growth factor-B-deficient mouse embryos identifies RGS5 as a novel marker for pericytes and vascular smooth muscle cells. Am. J. Pathol. 162721-729. [DOI] [PMC free article] [PubMed] [Google Scholar]
- 7.Bostrom, H., K. Willetts, M. Pekny, P. Leveen, P. Lindahl, H. Hedstrand, M. Pekna, M. Hellstrom, S. Gebre-Medhin, M. Schalling, M. Nilsson, S. Kurland, J. Tornell, J. K. Heath, and C. Betsholtz. 1996. PDGF-A signaling is a critical event in lung alveolar myofibroblast development and alveogenesis. Cell 85863-873. [DOI] [PubMed] [Google Scholar]
- 8.Chang, Y. P., X. Liu, J. D. Kim, M. A. Ikeda, M. R. Layton, A. B. Weder, R. S. Cooper, S. L. Kardia, D. C. Rao, S. C. Hunt, A. Luke, E. Boerwinkle, and A. Chakravarti. 2007. Multiple genes for essential-hypertension susceptibility on chromosome 1q. Am. J. Hum. Genet. 80253-264. [DOI] [PMC free article] [PubMed] [Google Scholar]
- 9.Chen, C., K. T. Seow, K. Guo, L. P. Yaw, and S. C. Lin. 1999. The membrane association domain of RGS16 contains unique amphipathic features that are conserved in RGS4 and RGS5. J. Biol. Chem. 27419799-19806. [DOI] [PubMed] [Google Scholar]
- 10.Chen, C. K., M. E. Burns, W. He, T. G. Wensel, D. A. Baylor, and M. I. Simon. 2000. Slowed recovery of rod photoresponse in mice lacking the GTPase accelerating protein RGS9-1. Nature 403557-560. [DOI] [PubMed] [Google Scholar]
- 11.Cho, H., T. Kozasa, C. Bondjers, C. Betsholtz, and J. H. Kehrl. 2003. Pericyte-specific expression of Rgs5: implications for PDGF and EDG receptor signaling during vascular maturation. FASEB J. 17440-442. [DOI] [PubMed] [Google Scholar]
- 12.De Vries, L., B. Zheng, T. Fischer, E. Elenko, and M. G. Farquhar. 2000. The regulator of G protein signaling family. Annu. Rev. Pharmacol. Toxicol. 40235-271. [DOI] [PubMed] [Google Scholar]
- 13.Enge, M., M. Bjarnegard, H. Gerhardt, E. Gustafsson, M. Kalen, N. Asker, H. P. Hammes, M. Shani, R. Fassler, and C. Betsholtz. 2002. Endothelium-specific platelet-derived growth factor-B ablation mimics diabetic retinopathy. EMBO J. 214307-4316. [DOI] [PMC free article] [PubMed] [Google Scholar]
- 14.Gerhardt, H., M. Golding, M. Fruttiger, C. Ruhrberg, A. Lundkvist, A. Abramsson, M. Jeltsch, C. Mitchell, K. Alitalo, D. Shima, and C. Betsholtz. 2003. VEGF guides angiogenic sprouting utilizing endothelial tip cell filopodia. J. Cell Biol. 1611163-1177. [DOI] [PMC free article] [PubMed] [Google Scholar]
- 15.Hepler, J. R. 1999. Emerging roles for RGS proteins in cell signalling. Trends Pharmacol. Sci. 20376-382. [DOI] [PubMed] [Google Scholar]
- 16.Hobson, J. P., H. M. Rosenfeldt, L. S. Barak, A. Olivera, S. Poulton, M. G. Caron, S. Milstien, and S. Spiegel. 2001. Role of the sphingosine-1-phosphate receptor EDG-1 in PDGF-induced cell motility. Science 2911800-1803. [DOI] [PubMed] [Google Scholar]
- 17.Hu, R. G., J. Sheng, X. Qi, Z. Xu, T. T. Takahashi, and A. Varshavsky. 2005. The N-end rule pathway as a nitric oxide sensor controlling the levels of multiple regulators. Nature 437981-986. [DOI] [PubMed] [Google Scholar]
- 18.Lee, M. J., T. Tasaki, K. Moroi, J. Y. An, S. Kimura, I. V. Davydov, and Y. T. Kwon. 2005. RGS4 and RGS5 are in vivo substrates of the N-end rule pathway. Proc. Natl. Acad. Sci. USA 10215030-15035. [DOI] [PMC free article] [PubMed] [Google Scholar]
- 19.Lindahl, P., B. R. Johansson, P. Leveen, and C. Betsholtz. 1997. Pericyte loss and microaneurysm formation in PDGF-B-deficient mice. Science 277242-245. [DOI] [PubMed] [Google Scholar]
- 20.Lindblom, P., H. Gerhardt, S. Liebner, A. Abramsson, M. Enge, M. Hellstrom, G. Backstrom, S. Fredriksson, U. Landegren, H. C. Nystrom, G. Bergstrom, E. Dejana, A. Ostman, P. Lindahl, and C. Betsholtz. 2003. Endothelial PDGF-B retention is required for proper investment of pericytes in the microvessel wall. Genes Dev. 171835-1840. [DOI] [PMC free article] [PubMed] [Google Scholar]
- 21.Lippert, E., D. L. Yowe, J. A. Gonzalo, J. P. Justice, J. M. Webster, E. R. Fedyk, M. Hodge, C. Miller, J. C. Gutierrez-Ramos, F. Borrego, A. Keane-Myers, and K. M. Druey. 2003. Role of regulator of G protein signaling 16 in inflammation-induced T lymphocyte migration and activation. J. Immunol. 1711542-1555. [DOI] [PubMed] [Google Scholar]
- 22.Moratz, C., V. H. Kang, K. M. Druey, C. S. Shi, A. Scheschonka, P. M. Murphy, T. Kozasa, and J. H. Kehrl. 2000. Regulator of G protein signaling 1 (RGS1) markedly impairs Gi alpha signaling responses of B lymphocytes. J. Immunol. 1641829-1838. [DOI] [PubMed] [Google Scholar]
- 23.Oliveira-Dos-Santos, A. J., G. Matsumoto, B. E. Snow, D. Bai, F. P. Houston, I. Q. Whishaw, S. Mariathasan, T. Sasaki, A. Wakeham, P. S. Ohashi, J. C. Roder, C. A. Barnes, D. P. Siderovski, and J. M. Penninger. 2000. Regulation of T cell activation, anxiety, and male aggression by RGS2. Proc. Natl. Acad. Sci. USA. 9712272-12277. [DOI] [PMC free article] [PubMed] [Google Scholar]
- 24.Rosenfeldt, H. M., J. P. Hobson, M. Maceyka, A. Olivera, V. E. Nava, S. Milstien, and S. Spiegel. 2001. EDG-1 links the PDGF receptor to Src and focal adhesion kinase activation leading to lamellipodia formation and cell migration. FASEB J. 152649-2659. [DOI] [PubMed] [Google Scholar]
- 25.Sinnarajah, S., C. W. Dessauer, D. Srikumar, J. Chen, J. Yuen, S. Yilma, J. C. Dennis, E. E. Morrison, V. Vodyanoy, and J. H. Kehrl. 2001. RGS2 regulates signal transduction in olfactory neurons by attenuating activation of adenylyl cyclase III. Nature 4091051-1055. [DOI] [PubMed] [Google Scholar]
- 26.Smith, L. E., E. Wesolowski, A. McLellan, S. K. Kostyk, R. D'Amato, R. Sullivan, and P. A. D'Amore. 1994. Oxygen-induced retinopathy in the mouse. Investig. Ophthalmol. Vis. Sci. 35101-111. [PubMed] [Google Scholar]
- 27.Tidhar, A., M. Reichenstein, D. Cohen, A. Faerman, N. G. Copeland, D. J. Gilbert, N. A. Jenkins, and M. Shani. 2001. A novel transgenic marker for migrating limb muscle precursors and for vascular smooth muscle cells. Dev. Dyn. 22060-73. [DOI] [PubMed] [Google Scholar]
- 28.Valenzuela, D. M., A. J. Murphy, D. Frendewey, N. W. Gale, A. N. Economides, W. Auerbach, W. T. Poueymirou, N. C. Adams, J. Rojas, J. Yasenchak, R. Chernomorsky, M. Boucher, A. L. Elsasser, L. Esau, J. Zheng, J. A. Griffiths, X. Wang, H. Su, Y. Xue, M. G. Dominguez, I. Noguera, R. Torres, L. E. Macdonald, A. F. Stewart, T. M. DeChiara, and G. D. Yancopoulos. 2003. High-throughput engineering of the mouse genome coupled with high-resolution expression analysis. Nat. Biotechnol. 21652-659. [DOI] [PubMed] [Google Scholar]
- 29.Zheng, B., L. De Vries, and M. Gist Farquhar. 1999. Divergence of RGS proteins: evidence for the existence of six mammalian RGS subfamilies. Trends Biochem. Sci. 24411-414. [DOI] [PubMed] [Google Scholar]
- 30.Zhou, J., K. Moroi, M. Nishiyama, H. Usui, N. Seki, J. Ishida, A. Fukamizu, and S. Kimura. 2001. Characterization of RGS5 in regulation of G protein-coupled receptor signaling. Life Sci. 681457-1469. [DOI] [PubMed] [Google Scholar]