

Abstract
Arterial spin labeling (ASL) perfusion fMRI data differ in important respects from the more familiar blood oxygen level dependent (BOLD) fMRI data, and require specific processing strategies. In this paper, we examined several factors that may influence ASL data analysis, including data storage bit resolution, motion correction, preprocessing for cerebral blood flow (CBF) calculations, and nuisance covariate modeling. Continuous ASL data were collected at 3 Tesla from 10 subjects while they performed a simple sensorimotor task with an epoch length of 48 seconds. These data were then analyzed using systematic variations of the factors listed above to identify the approach that yielded optimal signal detection for task activation. Improvements in statistical power were found for use of at least 10 bits for data storage at 3T. No significant difference was found in motor cortex regarding using simple subtraction or sinc-subtraction; but the former presented minor but significantly (P<0.024) larger peak-t value in visual cortex. While artifactual head motion patterns were observed in synthetic data and background suppressed ASL data when label/control images were realigned to a common target, independent realignment of label and control images did not yield significant improvements in activation in the sensorimotor data. It was also found that CBF calculations should be performed prior to spatial normalization and that modeling of global fluctuations yielded significantly increased peak t-value in motor cortex. The implementation of all ASL data processing approaches is easily accomplished within an open source toolbox, ASLtbx, and is advocated for most perfusion fMRI data sets.
Keywords: ASL perfusion MRI, fMRI, ASL data processing
Introduction
Arterial spin labeling (ASL) perfusion MRI is a noninvasive method for measuring cerebral blood flow (CBF) by magnetically labeling arterial blood water as an endogenous tracer [1,2]. By labeling inflowing blood water proximal to the imaging location, the perfusion signal is subsequently obtained by subtracting the label image from the control image, which is acquired using a control pulse without labeling the blood flow to remove the static background signal and control for magnetization transfer effects [2]. Due to this pairwise subtraction of temporally adjacent images, the ASL data demonstrate a reduction of the low frequency signal drifts that degrade functional MRI based on BOLD contrast over time [3]. This reduction renders ASL perfusion fMRI a useful tool for the investigation of slow changes in neural activity, such as may be evoked by mood, mental set, and learning [4,5]. ASL fMRI also reduces inter-subject variability in activation amplitude [3,6], improves signal to noise ratio (SNR) in regions with high static susceptibility gradients [7,8], and provides superior functional localization as compared to BOLD fMRI [9–10]. These properties of ASL has lead to its increasing use in clinical studies of cerebral perfusion during resting states [11–14] and cognitive function studies [3–5,15–23].
Despite the advantages described above, ASL perfusion fMRI suffers from relatively low intrinsic SNR [24]. Consequently, pre-processing and analysis approaches that maximize ASL sensitivity are critical. While most ASL data processing methods can be adapted from BOLD fMRI in a straightforward manner, several specific issues need to be considered. First, bit resolution becomes a practical issue for performing ASL perfusion fMRI in commercial MR scanners. Limited by the T1 decay of cerebral blood and the transit time from the labeling plane to the imaging plane, the total labeled blood flow is only a few percent of the static tissue water in the imaging location. Consequently, the ASL perfusion signal only accounts for 1–5% of the mean MR signal intensity [24] unless background suppression is used [25]. In functional MRI studies, the task-induced perfusion change accounts no more than half of the baseline perfusion signal, so that the ASL perfusion fMRI signal may be on the order of tenths of a percent of the mean MR signal intensity. As MRI images are generally archived in integer format in commercial MR scanners, adequate bit resolution is required to preserve the precision of ASL signal and the sensitivity required in fMRI studies.
Second, different approaches may be taken to head motion correction in ASL data preprocessing. Head motion is a source of noise that is not entirely removed by rigid body registration [26]. In the best case, head motion is not correlated with task activity, and may be treated as a source of nuisance variance. More troublesome are those cases in which motion confounds the experimental treatment [27]. A further artifact may arise in the specific circumstance of ASL perfusion fMRI: head motion could produce signal outliers with large positive or negative CBF values due to the relative spatial offset between the successive label and control images. In BOLD fMRI, a fast and widely used motion correction approach is to map all images to the reference volume using a six parameter based rigid body transformation to minimize the distance between each corrected volume and the reference volume [28–31]. Because this approach is based upon minimization of intensity differences within the image series, it may not be appropriate for ASL data. Label and control images are interleaved in raw ASL time-series, and the differences in image intensity induced by the label may be mistaken for head motion by the algorithm and inappropriately minimized. This is particularly an issue for background suppressed ASL imaging [25]. An alternative is to perform motion correction for the label and control image series separately. As head movement can not be completely post-corrected, appropriate procedures should be also taken to remove the markedly positive or negative outliers caused by large head movements during the scan.
Third, the order of spatial smoothing and normalization needs to be considered, as both can introduce minor signal intensity changes which are amplified during the CBF calibration process [2,32,33]. This may result in systematic underestimation or overestimation of CBF.
Finally, we consider the inclusion of a measure of global signal as a covariate during statistical analysis. This issue is complicated in the presence of spatially extended, experimentally induced variance [35–37]. Including global signal as a nuisance covariate in the general linear model (GLM) was suggested to reduce the residual temporal fluctuation of ASL perfusion fMRI data series. While this was demonstrated to be beneficial for null-hypothesis data [4], it has not been validated with functional ASL data.
The main purpose of this paper is then to examine these factors which may influence ASL data analysis. Specific issues during preprocessing are discussed for data storage bit resolution, motion correction, smoothing, normalization, and outlier cleaning. Several statistical analysis methods are employed to compare the effects of 1) different CBF calculation approaches; 2) handling global fluctuations represented by global CBF time course; 3) and handling of global spikes. All the involved data processing is performed with an open source ASL data processing toolbox, ASLtbx. Based on previous knowledge about the temporal and spatial noise properties of ASL data [3,4,38], ASLtbx provides an easy and useful ASL data processing tool for the field by implementing ease ASL data processing step in a separate batch script.
Materials and methods
Continuous ASL perfusion fMRI scan with a sensorimotor task
Imaging experiments were performed on a 3T Siemens Trio whole body MR scanner with a standard transmit/receive (Tx/Rx) head coil (Bruker BioSpin, USA). All subjects gave written informed consent before scanning following an Institutional Review Board approved protocol for each experiment. The head coil and foam pads were positioned carefully to reduce movement. Visual stimuli were delivered by LCD projector and observed via mirrors, attached to the head coil so subjects could focus attention on a screen placed at the head of the MRI bed. Ten healthy volunteers (6 male, 4 female) were scanned for 7.2 min using an amplitude modulated continuous ASL (CASL) perfusion imaging sequence optimized for 3.0T [39]. A block design with two interleaved conditions was used. During the "on" condition, visual stimuli with an 8 Hz reversing black and white checkerboard were presented periodically with duration of 48 sec. Subject were also instructed to perform a self-paced right-hand only fingertapping task during visual stimuli. The "off" condition consisted only of a blank screen. Acquisition parameters were: field-of-view (FOV)=22cm, 64×64×12 matrix, bandwidth=3kHz/pixel, flip angle=90°, TR=3 sec, TE=17 msec, slice thickness 6 mm, inter-slice space 1.5 mm, labeling time = 1.6 sec, post label delay time=800 ms. 72 label/control image pairs were acquired for each subject. High resolution structural images were acquired using a 3D MPRAGE sequence with scan parameters as: FOV = 250 mm, TR/TE = 1620/3ms, 192×256 matrix, 160 slices with thickness of 1 mm.
CBF calibration was conducted using:
| (1) |
where fis CBF, ΔM is the difference signal between the control and label acquisitions, R1a is the longitudinal relaxation rate of blood, τ is the labeling time, ω is the post labeling delay time, α is the labeling efficiency, λ is blood/tissue water partition coefficient, and M0 is approximated by the control image intensity [5,33]. The parameters used in this study were R1a = 0.67 sec-1, α=0.68, λ=0.9 g/ml, τ = 1.6 sec, ω = 800 msec (Wang et al., 2005c).
Bit resolution of ASL MRI images
To examine the effect of varying bit resolution on the sensitivity of statistical analysis, k-space raw data were saved for 4 subjects and the raw images were reconstructed in a Linux workstation using customized software written in Matlab (Mathworks, Natick, MA, USA). Given a bit resolution n, all raw control/label images were linearly mapped into the intensity range of 0–2n to simulate the integer format based data archiving. Nine different bit resolution with 6, 7, 8, 9, 10, 11, 12 were simulated. Since some commercial MR scanners use 12-bit Dicom standard (http://medical.nema.org/), the maximum simulated bit length was 12. Overflow will occur above this limit, which could produce artifactual results due to signal intensity truncation. All images were analyzed using the same preprocessing routines that will be described in the following sections. A general linear model (GLM) based fMRI data analysis method [40–43] was used to analyze all data sets.
Pseudo-CASL scan with background suppression
To assess the effect of modality upon motion correction, a pseudo-CASL background-suppressed single shot 3D GRASE sequence [44] was used to obtain a resting ASL image series. Imaging parameters were: resolution = 4 mm isotropic, FOV = 250×204×48 mm3, 12 nominal partitions with 33% oversampling, 5/8 partial Fourier, measured partitions = 10, matrix size = 64×52, BW = 3004 Hz/pixel, gradient-echo spacing = 0.4 msec (with ramp sampling), spin-echo spacing = 26 msec, total readout time = 270 msec, effective TE = 52 msec, refocusing flip angle = 162 and TR = 3.75 sec, labeling time = 1.2 sec, post-labeling delay = 400 msec. Two hyperbolic secant inversion pulses (15.35 msec duration and 220 mG RF amplitude) were added with inversion times of 1590 msec and 380 msec, respectively, for background suppression. 94 label/control image pairs were acquired for one volunteer.
Motion correction
To assess the effect of control-label intensity difference on the motion correction using the six parameter rigid body transformation based method [28–31], we simulated an ASL acquisition by inserting a percentage of signal change to the mean control image of the CASL scan from one subject. Spatial normally distributed variations of the signal change were introduced to simulate the variations of perfusion exchanges in different brain regions. The variation was also randomly generated for different time point to simulate the temporal variation of ASL imaging. The control image at each timepoint was set to the same as the first control image. Ten control/label images were generated with 1, 2, 5, 10, 20, and 40 percent of signal change as compared to the control images. The 6 synthetic datasets were then realigned to the first control image to obtain the estimated “head motion” time courses.
For the pseudo-CASL background-suppressed data, all images were realigned to the first control image volume to assess the effect of modality upon motion correction. For the sensorimotor ASL perfusion fMRI data, the effect of two motion correction strategies upon statistical results was examined: 1) realigning all images to the first control image; 2) separate realignment of the control and label image series to the first control and label images, with additional coregistration using the mutual information based approach [45] to minimize the possible head motion caused spatial offset between the reference control image and the reference label image. In the second approach, a rough head movement estimation was also obtained through the first approach to identify global spikes. The motion parameters of adjacent control and label images were averaged and subtracted to generate an averaged head motion time series and a relative head motion time series to be used in the spike image cleaning step.
Spatial smoothing, normalization and CBF calculation
CBF calibration is determined from the ratio of the perfusion difference and an M0 image [2, 5] and is sensitive to minor signal fluctuations in regions with low SNR. Spatial smoothing [46] was therefore applied before CBF calculation to reduce CBF signal outliers by improving the spatial SNR of both control and label images. Previous studies have shown that ASL perfusion data possess an evenly distributed noise power and spatial coherence across the frequency spectrum [3,4,38], implying that spatial smoothing of ASL data will yield improvements in detection of spatially extended processes without the deleterious amplification of low temporal frequency noise seen in BOLD [34,38].
Spatial normalization could introduce minor signal changes through data interpolation, and those minor changes could be further amplified during the CBF calibration process, resulting in an overestimated or underestimated CBF value. Although this global CBF fluctuation may not affect the time series analysis due to its consistency for all CBF images, it may impair the absolute CBF value based inferences. To avoid this problem and also reduce the computational burden, spatial normalization was applied after CBF calculation and after statistical analysis for each individual’s functional data. To assess the effect of spatial normalization on CBF calibration, two different methods were used to generate CBF maps. In method A, we calculated CBF maps from the spatially smoothed control/label images in the original space; in method B, the CBF maps calculated in method A were further spatially normalized into a standard space using the MNI 152 averaged brain template (Montreal Neurological Institute). Global CBF values were subsequently calculated from the CBF maps generated in these two processes. For each subject, a mask was generated from the mean control image to exclude extracranial voxels for mean CBF calculation. The mask was also normalized into the standard MNI space for mean CBF calculation for the CBF maps generated in method B.
Image masking was applied to remove the background and regions with very low signal intensity to prevent data overflowing during CBF calibration.
Global spike elimination
During calculation of perfusion signal by pairwise subtraction, signal outliers can result from a mismatch of control and label images, as might result from inconsistent background suppression or spatial location offset due to head motion. These global spikes were eliminated from statistical analysis at several empirical thresholds as defined below. An image was identified as a “spike image” by any of the following criteria: a) the translation of the averaged head motion is greater than 3 mm; b) the rotation of the averaged head motion is greater than 3°; c) the translation of the control-label relative head motion is greater than 0.8 mm; d) the rotation of the control-label relative head motion is greater than 0.8°; e) the global CBF value exceeds the mean of the CBF series by ±3 standard deviations.
Statistical analysis with or without global signal
To evaluate the effect of global CBF signal on the detection of activation, analyses with and without a global signal covariate were performed on the sensorimotor ASL perfusion fMRI data. The correlation of the global signal covariate with task covariates was also assessed.
ASL perfusion fMRI data processing toolbox
Both preprocessing and statistical analysis were performed using a Matlab and SPM5 (Wellcome Department of Cognitive Neurology, London, UK, http://www.fil.ion.ucl.ac.uk) based ASL perfusion fMRI data processing toolbox, ASLtbx (http://www.cfn.upenn.edu, this toolbox has been tested in both SPM2 and SPM5). The current version includes raw image quality checking, integer to float format conversion, independent label and control motion correction, coregistration, spatial smoothing, CBF calculation (for PASL or CASL sequences), outlier cleaning, statistical analysis, contrast definition, and second level analysis (random effect analysis and simple regression). Each procedure is implemented by a separate batch script in Matlab. A user interface is also provided for the CBF calculation procedure (asl_perf_subtract.m).
Using this toolbox, the raw EPI images were first converted into floating point format. Motion correction was performed as described above. Spatial smoothing was then applied with a 3D isotropic Gaussian kernel with FWHM=8 mm followed by image coregisteration between the raw EPI and structural images. Perfusion difference images were calculated by pair-wise subtraction or sinc-subtraction of the label/control image pairs [3]. Different quantification methods were provided for CASL and PASL using published quantification models [33, 39]. The structural images were then normalized to a standard brain template contained in SPM software; the same parameters were also applied to the contrast files of individual level functional data statistical analyses. Group analysis was finally performed with a random effect model through the one-sample t-test [47].
We examined the statistical sensitivity of variations in analysis procedure for the visual/motor activation data from 10 subjects. The factors evaluated included 1) “sinc” vs. “simple” subtraction, and 2) use of a global signal covariate. The peak t-value, and the size of the largest cluster of activity above an arbitrary threshold (p < 0.001, uncorrected) within the visual cortex (VC) and motor cortex (MC) was obtained. The effect of the variations in analysis upon outcome measures (peak t-value and cluster sizes) across subjects was evaluated with a 2-way ANOVA.
Results
Bit resolution
Fig. 1 shows the result of data archiving simulations with bit resolutions ranging from 6 bits to 11 bits. Fig. 1A shows the averaged peak t-value and suprathresholded cluster size obtained from the analysis of perfusion data from four subjects, saved with different bit resolutions. An arbitrary threshold (P < 0.001, uncorrected) for obtaining areas of activation was used. The "reference" value was obtained from the floating point images reconstructed from the k-space data. From the performance curves of peak t-value and cluster size within the visual cortex and the motor cortex, we found that statistical sensitivity is well preserved when bit resolution is 10 bits or greater. Marked sensitivity degradations appeared when bit resolution was less than this. Fig. 1B shows the averaged global CBF values at different bit lengths. Compared to the reference data, the figure shows a clear global CBF increase when the bit resolution becomes lower. A minor CBF increase can be found when the bit length is greater than 9, and after that, the CBF value curve became much sharper. For all tested 4 subjects, minor global CBF increment was demonstrated when the simulated bit length decreased.
Figure 1.
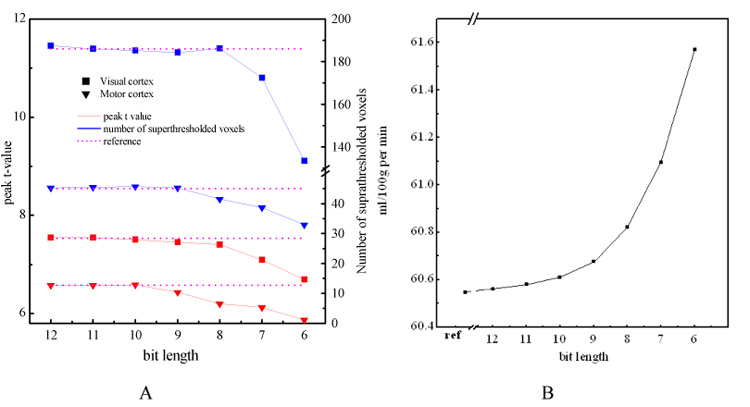
Bit resolution simulation results. A) the peak t values (red lines) and the suprathresholded (P < 0.001) cluster size (blue lines) within the visual cortex (solid squares) and the motor cortex (solid triangles) averaged on 4 subjects for each bit resolution, B) averaged global CBF value calculated at each bit resolution. In A) the left vertical axis is for peak t-value, the right vertical axis is for cluster size, the purple lines are the reference lines indicating corresponding values calculated from the floating point data which are reconstructed from the k-space data. In B) "ref" means reference CBF value calculated from the floating point data
Effects of control-label signal difference on motion correction
Perfusion fMRI data are usually acquired as interleaved label and control images. We examined if the systematic difference in intensity between the two image types has an effect upon motion correction routines. Using the six parameter, rigid-body realignment routine [28–31] for motion correction, the synthesized perfusion effect within each of the 6 synthetic data set was interpreted by the motion correction routine as a systematic displacement of head position between the label and control images. Figure 2A presents the estimated motion correction parameter time course in the Z direction from two representative simulations; essentially identical results were obtained for the other translations as well as rotations (data not shown). As would be expected, the magnitude of this displacement is increased when the simulated perfusion effect is larger.
Figure 2.
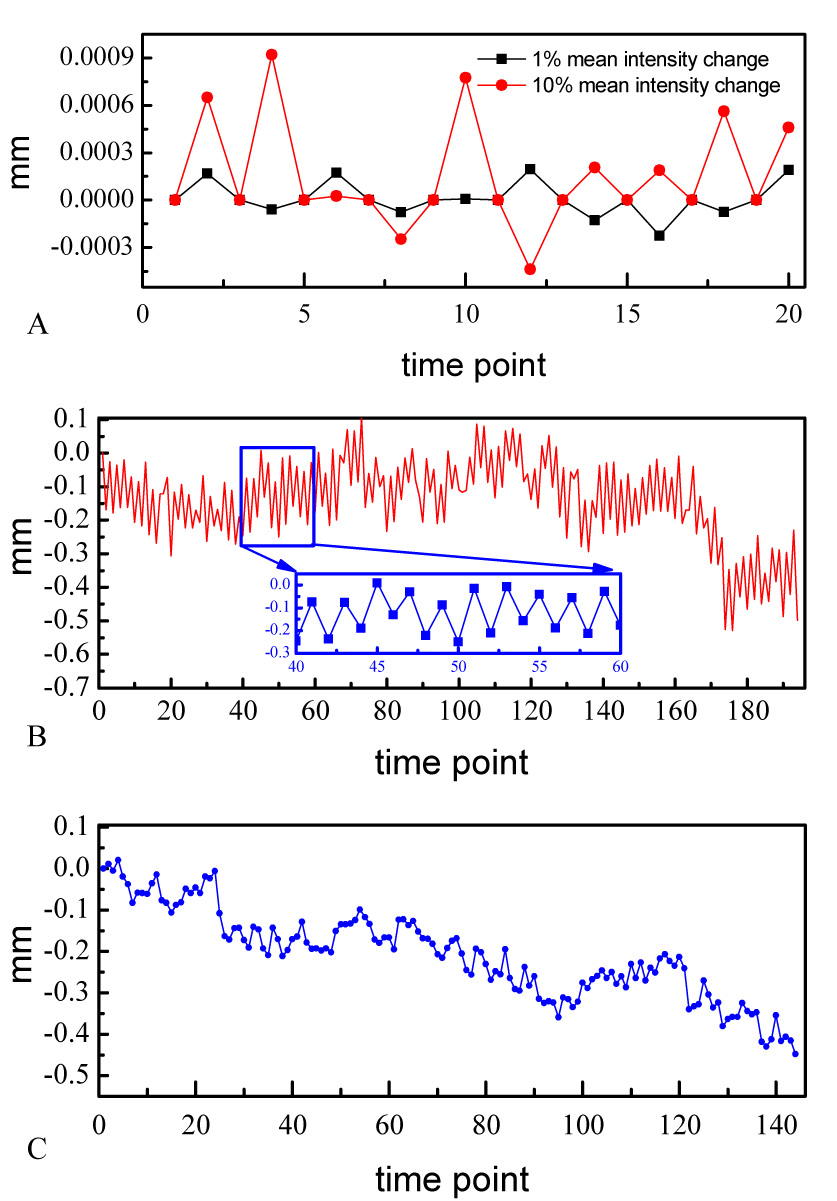
Estimated head motions along z direction for A) the synthetic data with 1% and 10% mean intensity changes, B) pCASL with background suppression data, and C) one representative subject’s sensorimotor CASL fMRI data. The inset of B is a zoom version of the motion time course from 40 to 60 TRs.
In actual data sets, this spurious motion estimation should be particularly prominent in imaging sequences in which the effect of image label is large with respect to the overall image intensity. This circumstance can arise in pCASL with background suppression. Figure 2B presents the estimated head motion from the resting pCASL background suppressed data. As can be seen especially from the zoomed plot in Figure 2B, the spurious motion artifact demonstrated in our simulations is also observed in collected data. Again, motion in the Z dimension is presented, but this artifact is seen prominently in all translations and rotations. The estimated head motion along Z direction for a representative subject’s sensorimotor CASL fMRI data was also shown in Figure 2C. Compared to Figure 2B, the systematic spurious motion was less prominent but can be still observed in the whole time course.
Effects of split and nonsplit motion corrections on the statistical analysis
Given that standard realignment routines interpret the label images as displaced from the control images, conjoint motion correction of the label and control images might act to reduce the differences between the label and control images that are the target of study. Both peak t-values and suprathresholded cluster sizes using the same significance level were exactly the same for each subject regardless of whether label and control images were motion corrected separately or all together. Minor difference presented in the group level statistical analysis. As listed in Table. 1, split motion correction yielded lower peak t values but more suprathresholded voxels in both functional foci than nonsplitting motion correction.
Table 1.
Peak t values and cluster extensions of group analyses on the simple-subtracted CBF images with different motion corrections. "Separate" means separate motion corrections for control/label images. The threshold for getting the activation clusters is 0 001 P < 0.001 (uncorrected).
| Motion correction | VC | MC | ||
|---|---|---|---|---|
| Peak t | Cluster size | Peak t | Cluster size | |
| Non-separate | 14.54 | 4345 | 36.93 | 1181 |
| separate | 13.81 | 4391 | 31.61 | 1205 |
CBF variations of different CBF calculation processes
Fig. 3 shows the mean and standard deviation of the global CBF values of the CBF images generated by different methods. A 9 percent significant (P < 0.0015, paired t-test) global perfusion underestimation were found for both simple subtraction and sinc-subtraction approach, when global CBF was calculated from the normalized CBF images (Method B), which indicates that spatial normalization on the CBF maps reduces the global CBF value. No significant global CBF difference was found between the simple-subtraction based perfusion quantification processes and the sinc-subtraction based CBF calculation approaches.
Figure 3.
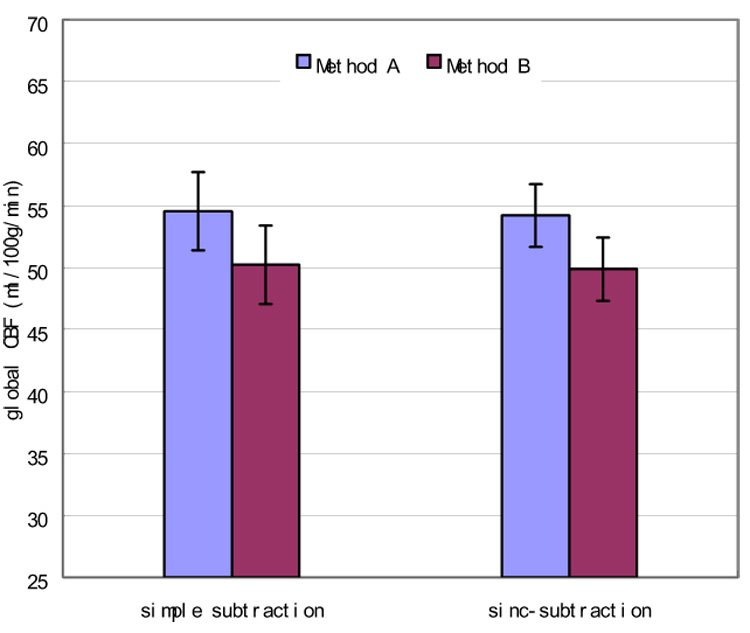
Mean CBF values of CBF images calculated with 2 different approaches. Compared to method A, method B yielded a significant (P < 0.0015 for both the simple subtraction and the sinc-subtraction based CBF calculation approaches, paired t-test) underestimation of global CBF. No significant global perfusion differences were found between the simple subtraction and sinc-subtraction based CBF calculation processes.
ANOVA analysis results
Table 2 lists the 2-way ANOVA results of assessing the 2 factors in ASL data analysis. All subjects’ data were analyzed 4 times using 4 (22 = 4) different methods, resulting in totally 40 analyses. For each factor, the 40 analyses were subdivided into two subgroups according to the subtype of the factors to be examined. The P values listed in Table 2 were calculated by contrasting the two subtypes of each factor and taking other factors out within the ANOVA model. Simple subtraction and sinc-subtraction yielded quite similar results in both VC and MC, but the former produced a significant peak-t value increase in VC; including global signal as nuisance covariate demonstrated significantly increased peak-t value in VC and MC and significantly larger cluster in MC while no significant correlation was found between the global signal and the design functions.
Table 2.
Results of 2-way ANOVA for assessing the effects of 2 factors on ASL data analysis. “W/T” means using global signal as nuisance covariate, and “W/O” means without the global signal as a nuisance covariate.
| factors assessed: | Subtraction type | Global effect | |
|---|---|---|---|
| Visual cortex | Peak t | SIMP>SINC | W/T>W/O, |
| P<0.024 | P<0.026 | ||
| Cluster size | |||
| Motor cortex | Peak t | W/T>W/O | |
| P<0.005 | |||
| Cluster size | W/T>W/O | ||
| P<0.045 | |||
Conclusions and discussions
Several practical issues of ASL perfusion fMRI were addressed in this report. The minimal bit length for archiving ASL raw images was demonstrated to be 10 bits from the data archiving and statistical analysis simulations. While only CASL imaging was validated in this paper, this minimal bit resolution requirement should also apply to PASL imaging with appropriate bit resolution increment, recall that PASL has lower SNR than CASL [48]. Although higher resolution is preferred to preserve more signal precision, commercial MRI scanners are limited in this regard. For example, Siemens MR scanners are currently limited to 12 bit resolution. If the scaling factor for converting the floating point format MRI images into integer format is too big to cause the maximal image intensity over the maximum of the upper boundary bit length, data overflow will occur. The simulation results showed that the statistical sensitivity was well preserved with any bit resolution between the minimum and the upper boundary compared to the data analysis with the original floating point MRI images. Since rounding floating point data into integer format may truncate both signal and noise, if the ratio of the truncated signal to the suppressed noise is close to 1, no detection sensitivity degradation will be incurred by shortening the representing bit length. Empirically, this could be the case when the bit resolution is over 10 bits in the simulations. Actually, this practical issue of bit resolution bestows a high priority to ASL imaging with background suppression for two reasons: one is that the mean intensity of raw ASL MRI images will decrease dramatically compared to the perfusion signal so that a large scaling factor can be used during MRI image archiving without worry about data overflowing; the other is that we may not need to worry about the signal truncation too much because the perfusion signal can be markedly increased [25]. Since the information loss due to bit resolution shrinkage is not exactly the same in the label and control image, global perfusion misestimation may also occur as shown in Figure 2B.
Both synthetic data and background suppressed pCASL data demonstrated spurious head motion patterns when all control/label images were realigned to the reference volume using the six parameter affine transformation based motion correction approach, supporting the strategy of using separate motion correction for control and label image series [34]. Since the intensity difference in background unsuppressed CASL imaging is small compared to the baseline mean MR image intensity, spurious motion patterns were much less prominent than in the pCASL background suppressed data, and also much less prominent than the actual head motion. As a result, separate realignment did not show markedly increased statistical sensitivity for the sensorimotor functional CASL data, compared to the nonseparate image realignment. As ASL signal intensity difference tends to be larger due to the use of high magnetic field and more advanced ASL techniques like pseudo-CASL and background suppression, the separate motion correction is recommended for ASL data processing. Otherwise, the apparent head “motion” attributable to the intensity difference between the control and label images (as shown in the Fig. 2A and 2B) may reduce the underlying CBF effects during functional experiments. The separate control/label image realignment used in this paper contained an additional control/label reference image coregistration step to minimize the possible head motion between them. It is worth to note that the mutual information based image registration method is much less sensitive to the regional signal intensity variations than the six parameter rigid body transformation based method [28–31], so that the spurious head motion issue of the nonseparate motion correction should be minimized in the separate realignment procedure. Although ASL data motion correction could be done instead using a series of registrations between each control or label image and the reference image using the mutual information based coregistration [45], the huge computational burden due to the series of registrations makes it much less impracticable than the separate motion correction approach used in this paper..
Spatial normalization of the CBF images demonstrated a minor but systematic global CBF value underestimation. This could be due to the relative shape transformation of grey matter and white matter during the spatially normalization. Although spatial normalization could be also applied before statistical analysis for each subject’s functional data, it is not recommended to be performed before CBF calculations. First, interpolation errors could be amplified during the calibration process as in Eq. 1. Second, it is not trivial to estimate the acquisition time lag (ω in Eq. 1) for each new interpolated slice during spatial normalization. This will subsequently cause a spurious global CBF value after taking the exponential transform of ω (see the component exp(ωR1a) in Eq. 1).
Simple-subtraction and sinc-subtraction based CBF calculation yielded quite similar performance for normal young subjects’ sensorimotor ASL fMRI data. The former produced a little bit higher peak-t value in VC (P<0.024). As the CASL sequence used in this paper is still based on EPI imaging, ASL data are still contaminated by the task-induced BOLD effect. While sinc-subtraction is designed to minimize this contamination, it could also loss part of sensitivity contributed by the BOLD effect related to task. However, in a previously reported cue-induced nicotine craving ASL perfusion fMRI study with very low frequency task design [49,50], sinc-subtraction demonstrated increased statistical sensitivity. As ASL perfusion fMRI is widely applied for low frequency function or state imaging [34], sinc-subtraction would be a better choice also for the reason that the BOLD contamination could serve to reduce the CBF difference effect [51,52].
With the sensorimotor ASL perfusion fMRI data, covarying global signal as a nuisance variable demonstrated increased detection sensitivity in both VC and MC, supporting the practice of covarying global signal to suppress the global fluctuations for ASL perfusion fMRI data analysis [5].
A Matlab and SPM based ASL data processing toolbox, ASLtbx, was introduced and used for all data analyses in this paper. Freely available to the public, this toolbox provides an easy access to perfusion quantification and ASL data processing using the methods mentioned in this paper and previous articles [3,5].
Summarizing the factors discussed in this paper and combining previous work on ASL perfusion fMRI data analysis, an empirical optimal ASL data processing approach can be proposed as: 1) converting integer format raw MRI images into floating format; 2) motion correction for control and label images separately and coregistering the reference label image to the reference control image; 3) rough head motion time course estimation for all control and label images; 4) spatially smoothing; 5) extracranial voxels masking; 6) CBF quantification; 7) statistical analysis without spike images (choose simple subtracted CBF images for high frequency design and sinc-subtracted CBF images for low frequency design, covarying global signal if there is no significant correlation between it and the task); 8) spatially normalization for the individual subject’s statistical analysis results; 9) group level analysis.
For functional activation detection only, future work may incorporate more sophisticated modeling of the control/labeling image time course as in [53] to maximally use the acquired temporal information.
Acknowledgements
This research was supported by NIH grants DA015149 and RR02305.
Footnotes
Publisher's Disclaimer: This is a PDF file of an unedited manuscript that has been accepted for publication. As a service to our customers we are providing this early version of the manuscript. The manuscript will undergo copyediting, typesetting, and review of the resulting proof before it is published in its final citable form. Please note that during the production process errors may be discovered which could affect the content, and all legal disclaimers that apply to the journal pertain.
References
- 1.Detre JA, Leigh J, Williams D, Koretsky A. Perfusion imaging. Magn Reson Med. 1992;23:37–45. doi: 10.1002/mrm.1910230106. [DOI] [PubMed] [Google Scholar]
- 2.Williams DS, Detre JA, Leigh J, Koretsky A. Magnetic resonance imaging of perfusion using spin inversion of arterial water. Proceedings of the National Academy of Sciences. 1992;89(1):212–216. doi: 10.1073/pnas.89.1.212. [DOI] [PMC free article] [PubMed] [Google Scholar]
- 3.Aguirre GK, Detre JA, Zarahn E, Alsop DC. Experimental design and the relative sensitivity of BOLD and perfusion fMRI. Neuroimage. 2002;15:488–500. doi: 10.1006/nimg.2001.0990. [DOI] [PubMed] [Google Scholar]
- 4.Wang JJ, Aguirre GK, Kimberg DY, Detre JA. Empirical analyses of null-hypothesis perfusion fmri data at 1.5 and 4 t. Neuroimage. 2003a;19(4):1449–1462. doi: 10.1016/s1053-8119(03)00255-6. [DOI] [PubMed] [Google Scholar]
- 5.Wang JJ, Aguirre GK, Kimberg DY, Roc AC, Li L, Detre JA. Arterial spin labeling perfusion fMRI with very low task frequency. Magn Reson Med. 2003b;49:796–802. doi: 10.1002/mrm.10437. [DOI] [PubMed] [Google Scholar]
- 6.Kemeny S, Ye FQ, Birn R, Braun AR. Comparison of continuous overtspeech fMRI using BOLD and arterial spin labeling. Human Brain Mapping. 2005;24(3):173–183. doi: 10.1002/hbm.20078. [DOI] [PMC free article] [PubMed] [Google Scholar]
- 7.Wang JJ, Li L, Roc AC, Alsop DC, Tang K, Butlera NS, Schnalla MD, Detre JA. Reduced susceptibility effects in perfusion fmri with single-shot spin-echo EPI acquisitions at 1.5 tesla. Magn Reson Imaging. 2004;22(1):1–7. doi: 10.1016/S0730-725X(03)00210-8. [DOI] [PubMed] [Google Scholar]
- 8.Tjandra T, Brooks JCW, Figueiredo P, Wise R, Mattews PM, Tracey I. Quantitative assessment of the reproducibility of functional activation measured with BOLD and MR perfusion imaging: Implications for clinical trial design. NeuroImage. 2005;27(2):393–401. doi: 10.1016/j.neuroimage.2005.04.021. [DOI] [PubMed] [Google Scholar]
- 9.Luh W-M, Wong EC, Bandettini PA, Ward BD, Hyde JS. Comparison of simultaneously measured perfusion and BOLD signal increases during brain activation with T1-based tissue identification. Magn Reson Med. 2000;44(1):137–143. doi: 10.1002/1522-2594(200007)44:1<137::aid-mrm20>3.0.co;2-r. [DOI] [PubMed] [Google Scholar]
- 10.Duong TQ, Kim DK, Ugurbil K, Kim SG. Localized cerebral blood flow response at submillimeter columnar resolution. Proc Natl Acad Sci. 2001;98(19):10904–10909. doi: 10.1073/pnas.191101098. [DOI] [PMC free article] [PubMed] [Google Scholar]
- 11.Oguz KK, Golay X, Pizzini FB, Freer CA, Winrow N, Ichord R, Casella JF, van Zijl PCM, Melhem ER. Sickle cell disease: Continuous arterial spin-labeling perfusion mr imaging in children. Radiology. 2003;227(2):567–574. doi: 10.1148/radiol.2272020903. [DOI] [PubMed] [Google Scholar]
- 12.Ances BM, McGarvey ML, Abrahams JM, Maldjian JA, Alsop DC, Zager EL, Detre JA. Continuous arterial spin labeled perfusion magnetic resonance imaging in patients before and after carotid endarterectomy. Journal of Neuroimaging. 2004;14(2):133–138. [PubMed] [Google Scholar]
- 13.Rashid W, Parkes LM, Ingle GT, Chard DT, Toosy AT, Altmann DR, Symms MR, Tofts PS, Thompson AJ, Miller DH. Abnormalities of cerebral perfusion in multiple sclerosis. Journal of Neurology Neurosurgery and Psychiatry. 2004;75:1288–1293. doi: 10.1136/jnnp.2003.026021. [DOI] [PMC free article] [PubMed] [Google Scholar]
- 14.Johnson NA, Jahng G-H, Weiner MW, Miller BL, Chui HC, Jagust WJ, Gorno-Tempini ML, Schuff N. Pattern of cerebral hypoperfusion in alzheimer disease and mild cognitive impairment measured with arterial spin-labeling MR imaging: Initial experience. Radiology. 2005;234(3):851–859. doi: 10.1148/radiol.2343040197. [DOI] [PMC free article] [PubMed] [Google Scholar]
- 15.Ye FQ, Smith AM, Yang Y, Duyn J, Venkat, Mattay S, Ruttimann UE, Frank JA, Weinberger DR, McLaughlin AC. Quantitation of regional cerebral blood flow increases during motor activation: A steady-state arterial spin tagging study. NeuroImage. 1997;6(2):104–112. doi: 10.1006/nimg.1997.0282. [DOI] [PubMed] [Google Scholar]
- 16.Ye FQ, Smith AM, Mattay VS, Ruttimann UE, Frank JA, Weinberger DR, McLaughlin AC. Quantitation of regional cerebral blood flow increases in prefrontal cortex during a working memory task: A steady-state arterial spin-tagging study. NeuroImage. 1998;8(1):44–49. doi: 10.1006/nimg.1998.0342. [DOI] [PubMed] [Google Scholar]
- 17.Ye FQ, Yang Y, Duyn J, Mattay VS, Frank JA, Weinberger DR, McLaughlin AC. Quantitation of regional cerebral blood flow increases during motor activation: A multislice, steady-state, arterial spin tagging study. Magn Reson Med. 1999;42(2):404–407. doi: 10.1002/(sici)1522-2594(199908)42:2<404::aid-mrm23>3.0.co;2-0. [DOI] [PubMed] [Google Scholar]
- 18.Yee S, Liu HL, Hou J, Pu Y, Fox PT, Gao JH. Detection of the brain response during a cognitive task using perfusion-based event-related functional MRI. NeuroReport. 2000;11(11):2533–2536. doi: 10.1097/00001756-200008030-00037. [DOI] [PubMed] [Google Scholar]
- 19.Garraux G, Hallett M, Talagal SL. CASL fMRI of subcortico-cortical perfusion changes during memory-guided finger sequences. NeuroImage. 2005;25(1):122–132. doi: 10.1016/j.neuroimage.2004.11.004. [DOI] [PubMed] [Google Scholar]
- 20.Mildner T, Trampel R, Moller HE, Schafer A, Wiggins CJ, Norris DG. Functional perfusion imaging using continuous arterial spin labeling with separate labeling and imaging coils at 3 T. Magn Reson Med. 2003;49(5):791–795. doi: 10.1002/mrm.10438. [DOI] [PubMed] [Google Scholar]
- 21.Wang J, Rao H, Wetmore GS, Furlan PM, Korczykowski M, Dinges DF, Detre JA. Perfusion functional mri reveals cerebral blood flow pattern under psychological stress. Proceedings of the National Academy of Sciences. 2005a;102(49):17804–17809. doi: 10.1073/pnas.0503082102. [DOI] [PMC free article] [PubMed] [Google Scholar]
- 22.Kim J, Whytea J, Wang J, Rao H, Tang KZ, Detre JA. Continuous ASL perfusion fMRI investigation of higher cognition: Quantification of tonic CBF changes during sustained attention and working memory tasks. NeuroImage. 2006 doi: 10.1016/j.neuroimage.2005.11.035. [DOI] [PMC free article] [PubMed] [Google Scholar]
- 23.Olson IR, Rao H, Moore KS, Wang J, Aguirre GK, Detre JA. Using perfusion fmri to measure continuous changes in neural activity with learning. Brain and cognition. 2006 doi: 10.1016/j.bandc.2005.11.010. [DOI] [PubMed] [Google Scholar]
- 24.Wong E. Potential and pitfalls of arterial spin labeling based perfusion imaging techniques for MRI. In: Moonen CW, Bandettini P, editors. Functional MRI, Medical Radiology: Diagnostic Imaging and Radiation Oncology. New York: Springer-Verlag; 1999. pp. 63–69. [Google Scholar]
- 25.Ye FQ, Frank JA, Weinberger DR, McLaughlin AC. Noise reduction in 3D perfusion imaging by attenuating the static signal in arterial spin tagging (ASSIST) Magn Reson Med. 2000;44:92–100. doi: 10.1002/1522-2594(200007)44:1<92::aid-mrm14>3.0.co;2-m. [DOI] [PubMed] [Google Scholar]
- 26.Ashburner J, Friston K. Rigid body registration. In: Frackowiak R, Friston K, Frith C, Dolan R, Friston K, Price C, Zeki S, Ashburner J, Penny W, editors. Human Brain Function. 2nd edition. Academic Press; 2003. [Google Scholar]
- 27.Brammer MJ. Functional MRI: an introduction to methods. New York: Oxford; 2003. chapter 13. [Google Scholar]
- 28.Friston K, Ashburner J, Frith C, Poline J, Heather JD, Frackowiak R. Spatial registration and normalization of images. Human Brain Mapping. 1995a;2:165–189. [Google Scholar]
- 29.Friston K, Williams S, Howard R, Frackowiak R, Turner R. Movement-related effects in fMRI time-series. Magnetic Resonance in Medicine. 1996;35:346–355. doi: 10.1002/mrm.1910350312. [DOI] [PubMed] [Google Scholar]
- 30.Woods RP, Cherry SR, Mazziotta JC. Rapid automated algorithm for aligning and reslicing PET images. Journal of Computer Assisted Tomography. 1992;16(4):620–633. doi: 10.1097/00004728-199207000-00024. [DOI] [PubMed] [Google Scholar]
- 31.Woods RP, Grafton ST, Holmes CJ, Cherry SR, Mazziotta JC. Automatic image registration: I. general methods and intrasubject, intramodality validation. Journal of Computer Assisted Tomography. 1998;22:139–152. doi: 10.1097/00004728-199801000-00027. [DOI] [PubMed] [Google Scholar]
- 32.Alsop DC, Detre JA. Multisection cerebral blood flow MR imaging with continuous arterial spin labeling. Radiology. 1998;208:410–416. doi: 10.1148/radiology.208.2.9680569. [DOI] [PubMed] [Google Scholar]
- 33.Warmuth C, Gunther M, Zimmer C. Quantification of blood flow in brain tumors: comparison of arterial spin labeling and dynamic susceptibility-weighted contrast-enhanced MR imaging. Radiology. 2003;228(2):523–532. doi: 10.1148/radiol.2282020409. [DOI] [PubMed] [Google Scholar]
- 34.Aguirre GK, Detre JA, Wang J. Perfusion fMRI for functional neuroimaging. International Review of Neurobiology. 2005;66:213–236. doi: 10.1016/S0074-7742(05)66007-2. [DOI] [PubMed] [Google Scholar]
- 35.Aguirre GK, Zarahn E, D'Esposito M. Empirical analyses of BOLD fMRI statistics, II. spatially smoothed data collected under null-hypothesis and experimental conditions. Neuroimage. 1997;5:199–212. doi: 10.1006/nimg.1997.0264. [DOI] [PubMed] [Google Scholar]
- 36.Aguirre GK, Zarahn E, D'Esposito M. The inferential impact of global signal covariates in functional neuroimaging analyses. Neuroimage. 1998;8:302–306. doi: 10.1006/nimg.1998.0367. [DOI] [PubMed] [Google Scholar]
- 37.Desjardins AE, Kiehl KA, Liddle PF. Removal of confounding effects of global signal in functional MRI analyses. Neuroimage. 2001;13:751–758. doi: 10.1006/nimg.2000.0719. [DOI] [PubMed] [Google Scholar]
- 38.Wang JJ, Wang Z, Aguirre GK, Detre JA. To smooth or not to smooth? ROC analysis of perfusion fMRI data. Magnetic Resonance Imaging. 2005b;23:75–81. doi: 10.1016/j.mri.2004.11.009. [DOI] [PubMed] [Google Scholar]
- 39.Wang JJ, Zhang Y, Wolf RL, Roc AC, Alsop DC, Detre JA. Amplitude modulated continuous arterial spin labeling perfusion MR with single coil at 3T: feasibility study. Radiology. 2005c;235(1):218–228. doi: 10.1148/radiol.2351031663. [DOI] [PubMed] [Google Scholar]
- 40.Bandettini PA, Jesmanowicz A, Wong EC, Hyde JS. Processing strategies for time-course data sets in functional mri of the human brain. Magn Reson Med. 1993;30:161–173. doi: 10.1002/mrm.1910300204. [DOI] [PubMed] [Google Scholar]
- 41.Friston K, Holmes A, Poline J, Grasby PJ, Williams SCR, Frackowiak R, Turner R. Analysis of fmri time series revisited. NeuroImage. 1995b;2:45–53. doi: 10.1006/nimg.1995.1007. [DOI] [PubMed] [Google Scholar]
- 42.Friston K, Holmes A, Worsley K, Poline J, Frith C, Frackowiak R. Statistical parametric maps in functional imaging: A general linear approach. Human Brain Mapping. 1995c;2:189–210. [Google Scholar]
- 43.Worsley K, Friston K. Analysis of fMRI time-series revisited - again. NeuroImage. 1995;2:173–181. doi: 10.1006/nimg.1995.1023. [DOI] [PubMed] [Google Scholar]
- 44.Fernández-Seara MA, Wang Z, Wang J, Rao H, Guenther M, Feinberg DA, Detre J. Continuous arterial spin labelling perfusion measurements using single shot 3D GRASE at 3T. Magn Reson Med. 2005;54(5):1241–1247. doi: 10.1002/mrm.20674. [DOI] [PubMed] [Google Scholar]
- 45.Studholme C, Hill DLG, Hawkes DJ. A normalized entropy measure of 3-D medical image alignment. In: Hanson KM, editor. Proceedings SPIE: the International Society for Optical Engineering. Medical Imaging 1998: Image Processing 1998. Vol. 3338. 1998. pp. 132–143. [Google Scholar]
- 46.Friston K, Josephs O, Zarahn E, Holmes A, Rouquette S, Poline J. To smooth or not to smooth? Bias and effciency in fmri time-series analysis. NeuroImage. 2000;12:196–208. doi: 10.1006/nimg.2000.0609. [DOI] [PubMed] [Google Scholar]
- 47.Holmes A, Friston K. Generalisability, random effects and population inference. NeuroImage. 1998;volume 7:S754. [Google Scholar]
- 48.Wang JJ, Alsop D, Li L, Listerud J, Gonzalez-At J, Schnall M, Detre J. Comparison of quantitative perfusion imaging using arterial spin labeling at 1.5 and 4 Telsa. Magn Reson Med. 2002;48:242–254. doi: 10.1002/mrm.10211. [DOI] [PubMed] [Google Scholar]
- 49.Wang Z, Franklin T, Li Y, O'Brien C, Detre J, Childress AR. Optimizing analyses of arterial spin labeling perfusion fmri for drug abuse studies; Proc. 68th Annual Meeting of the College on Problems of Drug Dependence (online); 2006. [Google Scholar]
- 50.Franklin TR, Wang Z, Wang J, Sciortino N, Harper D, Li Y, Kampman K, O'Brien CP, Detre JA, Childress AR. Limbic activation to cigarette smoking cues independent of nicotine withdrawal: A perfusion fMRI study. Neuropsychopharmacology. 2007 doi: 10.1038/sj.npp.1301371. in press. [DOI] [PubMed] [Google Scholar]
- 51.Liu TT, Wong EC. A signal processing model for arterial spin labeling functional MRI. NeuroImage. 2005;24:207–215. doi: 10.1016/j.neuroimage.2004.09.047. [DOI] [PubMed] [Google Scholar]
- 52.Lu H, Donahue MJ, van Zijl PCM. Detrimental Effects of BOLD Signal in Arterial Spin Labeling fMRI at High Field Strength. Magnetic Resonance in Medicine. 2006;56:546–552. doi: 10.1002/mrm.20976. [DOI] [PubMed] [Google Scholar]
- 53.Mumford JA, Hernandez-Garcia L, Lee GR, Nichols TE. Estimation efficiency and statistical power in arterial spin labeling fMRI. NeuroImage. 2006;33:103–114. doi: 10.1016/j.neuroimage.2006.05.040. [DOI] [PMC free article] [PubMed] [Google Scholar]