

Abstract
Regulation of the amiloride-sensitive epithelial sodium channel (ENaC) is essential for the control of body sodium homeostasis. The downregulation of the activity of this Na+ channel that occurs when the intracellular Na+ concentration ([Na+]i) is increased is known as feedback inhibition. Although intracellular Na+ is the trigger for this phenomenon, its cellular and molecular mediators are unknown.
We used the ‘cut-open oocyte’ technique to control the composition of the intracellular milieu of Xenopus oocytes expressing rat ENaCs to enable us to test several factors potentially involved in feedback inhibition.
The effects of perfusion of the intracellular space were demonstrated by an electromicrographic study and the time course of the intracellular solution exchange was established by observing the effect of intracellular pH: a decrease from pH 7.4 to 6.5 reduced the amiloride-sensitive current by about 40 % within 2 min.
Feedback inhibition was observed in non-perfused oocytes when Na+ entry induced a large increase in [Na+]i. Intracellular perfusion prevented feedback regulation even though the [Na+]i was allowed to increase to values above 50 mM.
No effects on the amiloride-sensitive current were observed after changes in the concentration of Na+ (from 1 to 50 mM), Ca2+ (from 10 to 1000 nM) or ATP (from nominally free to 1 or 5 mM) in the intracellular perfusate.
We conclude that feedback inhibition requires intracellular factors that can be removed by intracellular perfusion. Although a rise in [Na+]i may be the trigger for the feedback inhibition of the ENaC, this effect is not mediated by a direct effect of Na+, Ca2+ or ATP on the ENaC protein.
Whole body sodium homeostasis, and consequently extracellular fluid volume and blood pressure regulation, requires tight control of the reabsorption of Na+ by epithelial cells. The amiloride-sensitive epithelial sodium channel (ENaC) located at the apical membrane of epithelial cells plays a central role in Na+ reabsorption by the cells of the distal nephron, the distal colon and the ducts of exocrine glands (Garty & Palmer, 1997; Rossier, 1997; Horisberger, 1998). The physiological importance of the ENaC has been demonstrated in human hereditary diseases associated either with gain-of-function mutations causing Liddle's syndrome, a form of salt-sensitive arterial hypertension (Shimkets et al. 1994), or loss-of-function mutations causing pseudo-hypoaldosteronism type 1 (Chang et al. 1996).
Despite the rapid expansion of our knowledge of the structure and function of the ENaC, which is most probably an heterotetramer, α2βγ (Firsov et al. 1998), our understanding of the molecular aspects of ENaC regulation is still fragmentary (Horisberger, 1998). In kidney and colon epithelia, aldosterone and vasopressin are the major hormonal regulators of the ENaC (Garty & Palmer, 1997). Two other well-characterized phenomena, both of which are intrinsic to the epithelial cell, are known to help limit the rate of Na+ entry into the cell: these are ‘self-inhibition’ and ‘feedback inhibition’. However, the mechanisms responsible for these phenomena are still poorly understood. Self-inhibition signifies the inhibition of the Na+ channel by extracellular sodium; this form of negative regulation has a fast time course and may be due to a direct interaction between extracellular Na+ and a site within the Na+ channel itself (Palmer et al. 1998). Feedback inhibition describes an inhibition of the ENaC that is secondary to an increase in the intracellular Na+ concentration ([Na+]i) (Turnheim, 1991). Feedback inhibition has been reported in numerous studies of intact epithelia and also at the cellular level (Garty & Palmer, 1997). Several mechanisms have been proposed to explain feedback inhibition: it has been reported to be mediated by a fall in intracellular pH (pHi) (Harvey et al. 1988) or a rise in intracellular calcium (Silver et al. 1993) and to involve G proteins (Gαi2 or Gαo) or intracellular chloride (Komwatana et al. 1998). However, no consensus has yet emerged. For instance, different and sometimes conflicting results concerning the direct effects of Na+ or Ca2+ on the characteristics of ENaC gating and the role of these ions in feedback inhibition have been reported by groups using different experimental approaches (Garty & Palmer, 1997; Benos et al. 1997).
Although the mechanism responsible for signalling an increasing [Na+]i to the Na+ channel is still not yet clear, recent findings have cast some light on the effector mechanisms by which the activity of the channel may be decreased. Firstly, the gain-of-function mutations of ENaCs associated with Liddle's syndrome have been shown to strongly decrease the sensitivity of the ENaC to an [Na+]i increase (Kellenberger et al. 1998). These mutations are located within a short proline-rich segment (PY-motif) of the cytoplasmic COOH-terminus of the β- and γ-subunits (Schild et al. 1996). This region interacts with the newly described cytosolic protein Nedd4 (Staub et al. 1996) which bears WW-domains known to bind to PY-motifs and a ubiquitin-protein ligase domain. However, the proposed mechanism - Nedd4 binding to the PY-motif followed by ubiquitination of the ENaC and its targeting for degradation - has yet to be fully demonstrated. Secondly, Shimkets et al. (1997) showed that overexpression of a dominant-negative mutant of dynamin in Xenopus oocytes resulted in an increase in the half-life of wild-type co-expressed ENaCs, but not of Liddle-mutant channels. These observations suggest that both ubiquitination and internalization of ENaCs via clathrin-mediated endocytosis are regulatory mechanisms that may play an important role in feedback inhibition, but the relationship between these two mechanisms is not yet understood.
In this study, we have examined the role of several factors potentially involved in feedback inhibition using the cloned rat ENaC (rENaC) expressed in a well-characterized expression system, the Xenopus oocyte. In order to obtain a precise and rapid control of the intracellular milieu, we used the so-called ‘cut-open oocyte’ technique, which permits intracellular perfusion (Taglialatela et al. 1992). Although feedback inhibition could be observed in the absence of intracellular perfusion, it did not occur when the intracellular side of the membrane was efficiently rinsed with solutions of high or low Na+ concentration. Under these conditions, the amiloride-sensitive conductance (GAmil) was rapidly and reversibly inhibited by intracellular acidification, but was not influenced by changes in intracellular Na+, ATP or Ca2+. These results suggest that feedback inhibition in the Xenopus oocyte, which is triggered by an increase in [Na+]i (Kellenberger et al. 1998), is not due to a direct interaction of Na+, ATP or Ca2+ with the ENaC and that, under our experimental conditions, one or more critical components of the feedback inhibition mechanism are removed by intracellular perfusion.
METHODS
ENaC expression in Xenopus oocytes
Stage V-VI oocytes were surgically removed from the ovarian tissue of female Xenopus laevis which had been anaesthetized by immersion in MS-222 (2 g l−1; Sandoz, Basel, Switzerland). Following surgery, the frogs were allowed to recover in isolation in a shallow tank and, after full recovery had been verified a few hours later, they were returned to the rearing tank. About two months later, the frogs were operated on a second time for the removal of the ovarian lobe on the other side. They were then killed by decapitation under anaesthesia. All procedures were performed in accordance with local institutional animal welfare guidelines (State of Vaud, Switzerland). The oocytes were defolliculated as described previously (Puoti et al. 1995) and were pressure-injected at the border between the vegetal and animal poles with 50 nl of a solution containing equal amounts of the αβγ cRNAs of the rENaC subunits (total quantity, 10 ng per oocyte). The site of injection was chosen so as not to injure the vegetal pole (see below). The βR564stop mutant (Liddle-mutant) cRNA was generously provided by L. Schild, Lausanne, Switzerland. After injection, the oocytes were kept in modified Barth's solution (MBS) containing 1 mM Na+ to prevent an increase in [Na+]i and thereby allow observation of sodium-dependent downregulation. Electrophysiological measurements were performed at room temperature (20-25°C), 14-40 h after cRNA injection.
Electrophysiological measurements
In this study, we used the cut-open oocyte technique, which was originally developed by Taglialatela et al. (1992). Briefly, a Xenopus oocyte was mounted between two compartments with the studied vegetal pole upwards, as preliminary experiments showed a larger current at this pole. This correlates well with the much higher immunocytochemical staining for rENaCs at this pole than at the animal pole (J. Loffing, personal communication). As shown in Fig. 1, the superior pole of the oocyte was in contact with the upper bath through a hole of ∼500 μm in diameter. The middle (guard) bath served to provide electrical isolation between the upper (extracellular) and lower (intracellular) compartments through independent voltage clamping of the middle bath at the same electrical potential as the upper bath. The upper (extracellular) compartment was superfused by gravity (flow rate, ∼6 ml min−1) with an extracellular sodium-containing solution (see below). The lower pole of the oocyte was impaled with a glass microelectrode which was simultaneously used as an intracellular perfusion pipette and a voltage-recording electrode. This modification of the original set-up was first described by Costa et al. (1994). The resistance of the electrode, when filled with the intracellular solutions described below, was about 0.2-0.7 MΩ. For the purpose of intracellular perfusion, the pipette was advanced into the oocyte until it was just visible from above through the membrane and yolk. We chose the flow rate for perfusion so that we could observe a ‘washing-out’ of the yolk platelets, and with time the membrane became translucent. Only oocytes in which this was observed were considered to be intracellularly well perfused and only these were used for further experiment and analysis. In order to obtain this effect, the flow rate needed to be between 1 and 6 μl min−1. Higher rates almost always caused a rapid and marked loss of membrane resistance or created visible holes in the membrane. The solution was perfused by means of a precision syringe pump (Infors AG, Basel, Switzerland). In order to minimize the dead space when the perfusion solution was changed, we introduced two thin capillaries by which test solutions were introduced into the perfusion pipette close to the tip. The remaining dead space was about 2-5 μl. The voltage clamp was performed using a Dagan cut-open oocyte voltage-clamp apparatus (Dagan Corporation, Minneapolis, MN, USA; Model CA-1 High Performance Oocyte Clamp). Data acquisition and analysis were performed using a TL1 DMA digital converter system and the pCLAMP software package (Axon Instruments, Foster City, CA, USA; version 5.5). The holding potential was -100 mV. Series of 175 ms voltage pulses were applied to vary the membrane potential from the holding potential to levels within the range -140 to +60 mV in increments of 20 mV. The current signal was filtered at 50 Hz using a 4-pole Bessel filter. The amiloride-sensitive Na+ current (IAmil) was defined as the difference between the Na+ currents obtained with and without 5 μM amiloride (Sigma) in the upper bath. The amiloride-sensitive conductance (GAmil) was measured between -80 and -100 mV. The apparent intracellular Na+ concentration, [Na+]i, was calculated from the reversal potential (Erev) of the amiloride-sensitive current using the following formula:
where aNai and aNao are the intracellular and extracellular Na+ activities, respectively, F is the Faraday constant, R is the Boltzmann constant and T is the temperature. As intracellular and extracellular solutions were of similar ionic strength, we assumed that the ratio of intracellular to extracellular Na+concentrations was approximately the same as the ratio of intracellular to extracellular Na+activities. We have therefore reported all the results as apparent Na+ concentrations. Data are shown as means ±s.e.m.
Figure 1. Schematic illustration of oocyte intracellular perfusion by the cut-open oocyte technique.
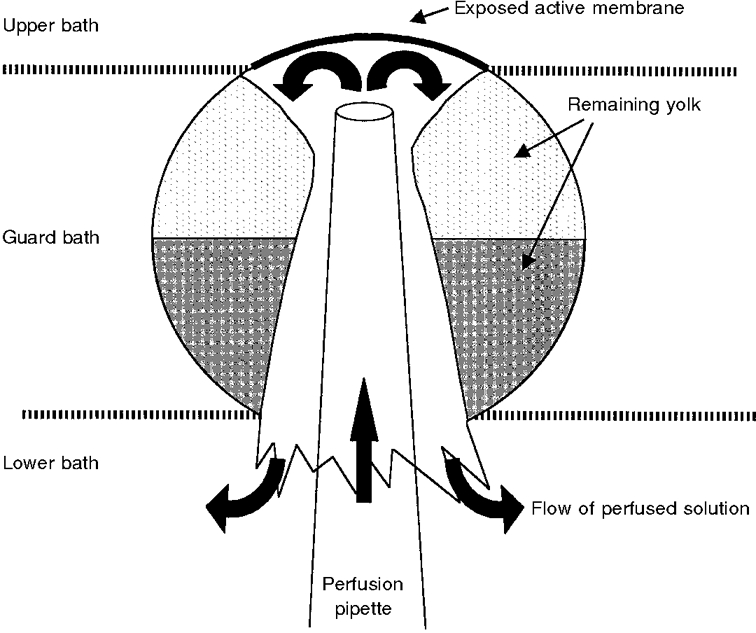
Illustration of an oocyte (≈1 mm in diameter) mounted in the cut-open oocyte chamber (not shown). The chamber consisted of three compartments, of which the upper/extracellular compartment was continually perfused and was in contact with the exposed membrane of the oocyte through a hole of ≈500 μm diameter. The guard compartment allowed for electrical isolation between the upper bath and the lower/intracellular bath. For details of the electrical circuit, see Taglialatela et al. (1992) and Costa et al. (1994). The pipette for perfusion and voltage recording (tip ≈100 μm) was inserted into the animal (dark) pole of the oocyte and advanced to just below (100-300 μm below) the membrane. The flow of solution (filled arrows) removed almost all visible yolk platelets below the studied membrane and formed a yolk-free ‘cone’ in the middle of the cell. The solution flowed back and around the pipette and through the opening made by the impalement.
Solutions and chemicals
After cRNA injection, the oocytes were incubated in a low-Na+ MBS containing (mM): 1 NaCl, 60 N-methyl-D-glutamine-Cl (NMDG), 40 KCl, 0.8 MgSO4, 0.3 Ca(NO3)2, 0.4 CaCl2, 10 Hepes-NMDG (pH 7.2). The extracellular solution for the electrophysiological experiments had the following composition (mM): 0.8 MgSO4, 0.4 CaCl2, 5 BaCl2, 10 tetraethylammonium-Cl (TEA), 10 Hepes-NMDG (pH 7.4), the various Na+ concentrations indicated in the text being obtained by appropriate addition of sodium gluconate and NMDG-gluconate to give a total concentration of 100 mM. The solution used for the intracellular perfusion contained (mM): 0.8 MgCl2, 1 or 5 ATP, 2 EGTA, 10 Hepes-NMDG, and the pH was varied from 6.5 to 7.4. The various Na+ concentrations indicated in the text (i.e. 1, 20 or 50 mM) were obtained by adding appropriate amounts of sodium gluconate and potassium gluconate to give a total concentration of 100 mM. The various concentrations of free Ca2+ in the intracellular solution were obtained by adding appropriate amounts of CaCl2. The free Ca2+ concentrations were calculated using DOS software, taking into account the pH, ATP and EGTA concentrations (Calcium v1.1; Chang et al. 1988).
Electron microscopy
The oocytes used for the electron microscopy experiments were the ones previously used for the electrophysiological measurements. To enable us to follow membrane trafficking, in some experiments ferritine was added to the extracellular solution at 0.7 mg l−1 (Dersch et al. 1991). Immediately after the experiment, the oocytes were fixed, using 1 % glutaraldehyde in the measuring Na+ solution, at room temperature for 2 h. Only the dissected vegetal pole of the oocyte was then used in order to reduce the volume of the sample. The preparations were washed three times in a phosphate-buffered solution (PBS; mM: 137 NaCl, 2.7 KCl, 1.5 KH2PO4, 8.3 Na2HPO4) and were postfixed in 4 % OsO4 for 1 h at room temperature. After three PBS washes, the samples were dehydrated in ethanol and embedded in Epon 812. Thin sections (50-80 nm) were then contrasted with uranyl acetate and lead citrate and observed by electron microscopy.
RESULTS
Ultrastructural morphology of the perfused oocyte
For a better understanding of the results of the electrophysiological measurements performed using the cut-open oocyte technique, we studied the effects of intracellular perfusion at the ultrastructural level. Figure 2A shows an electron micrograph of the cortical region of a representative oocyte expressing ENaCs, which had been clamped for 20 min at -100 mV using the classical two-electrode voltage-clamp technique. Figure 2B shows a fragment (corresponding to the exposed active membrane in Fig. 1) of an oocyte that had been perfused using the cut-open oocyte technique and held at a membrane potential of -100 mV for the same period of time. It is clear that the intracellular perfusion had removed all intracellular structures except for those in a 10-60 μm submembrane zone. In this zone, a few cytosolic structures (such as small yolk platelets, pigment and cortical granules) were still present, probably attached to the membrane-associated cytoskeleton (Fig. 2A). Similar findings were obtained in three other perfused oocytes. However, there were no gross changes in the morphology of the membrane infoldings or in that of the extracellular vitelline membrane.
Figure 2. Electron micrograph of the plasma membrane of control and perfused oocytes.

A, cortical region of one representative oocyte expressing ENaCs, which was voltage clamped at -100 mV for 20 min using the two-electrode voltage-clamp technique. The microvilli of the plasma membrane, just below the vitelline membrane (VM) surrounding the oocyte, can be easily recognized. Yolk platelets (Y) and cortical (C) and pigment (P) granules can be seen below the membrane. Dense ferritine patches are attached to the vitelline membrane. B, electron micrograph of the membrane of an oocyte which had been perfused using the cut-open oocyte set-up. The general architecture of the microvilli was not modified. However, the density of the cytosolic granulations below the membrane and within the microvilli was clearly decreased. Despite the perfusion, a layer of cytosolic structures (yolk platelets, cortical and pigment granules) remained attached to the membrane. This micrograph illustrates the three postulated zones within which the intracellular and extracellular perfusions do not cause convectional flux and where the Na+ concentration is influenced only by diffusion: (i) the space between the vitelline and plasma membranes, (ii) the compartment within the microvilli, and (iii) the layer of remaining cytosolic structures. Scale bars, 10 μm.
Amiloride-sensitive current recorded using the cut-open oocyte technique
After mounting an rENaC-expressing oocyte in the cut-open oocyte chamber, a first measurement of IAmil was made immediately after the impalement of the cell with the perfusion and voltage-recording pipette. The magnitude of IAmil was within the range 0.1-3 μA in each preparation. Taking into account the fact that with the cut-open oocyte method the current flowing across only a small fraction (about 10 %) of the oocyte membrane is measured (see Fig. 1), the current density was in the same range as that observed with the two-electrode voltage-clamp technique in rENaC-expressing oocytes (Kellenberger et al. 1998). Figure 3 shows the current-voltage relationships obtained from a perfused oocyte (extracellular Na+ concentration ([Na+]o) =[Na+]i = 50 mM) before and after application of 5 μM amiloride.
Figure 3. Current-voltage curves obtained using the cut-open oocyte technique.
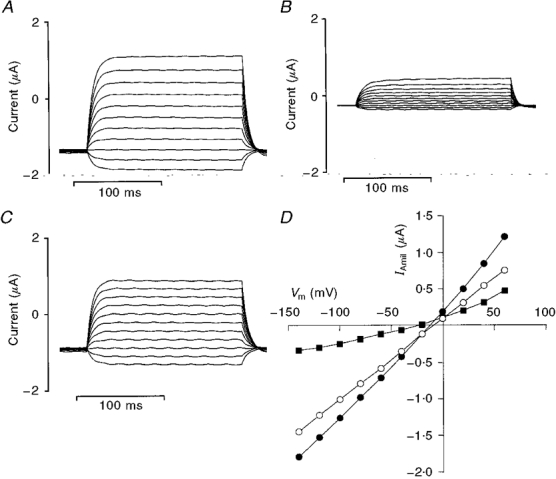
A, current recordings obtained from a cut-open oocyte perfused with intracellular and extracellular solutions containing 50 mM Na+ during a series of 175 ms square voltage pulses ranging from -140 to +60 mV. The exposed membrane (at the vegetal pole of the oocyte) had a diameter of ≈500 μm. B, current recordings as in A obtained after application of 5 μM amiloride. C, amiloride-sensitive currents (i.e. A - B). D, current-voltage relationships for the whole-membrane current (•), residual current after application of amiloride (▪) and amiloride-sensitive current (IAmil, ○). The currents were measured 150 ms after the beginning of the voltage pulse. Vm, membrane potential.
Intracellular unstirred layers
It is apparent in Fig. 3A that, despite the similar nominal Na+ concentrations on the two sides of the membrane, Erev was clearly negative, about -10 mV in the example shown, yielding a calculated apparent [Na+]i larger than 50 mM. This discrepancy between the intracellularly perfused Na+ concentration and the calculated [Na+]i was observed in most cases and it was even more obvious when the oocyte was perfused with a solution containing 1 mM Na+. These observations indicated that we were not able to control precisely the Na+ concentration in the unstirred layers just below the membrane, even though solution exchange was effectively taking place within a few tens of micrometres of the membrane (see Fig. 2A). As the holding potential was maintained at -100 mV, we hypothesized that a large entry of Na+ through the ENaC maintained an increased Na+ concentration in these unstirred layers. This interpretation was supported by the finding that the calculated [Na+]i values were related to the rate of entry of Na+ into the cell, as shown by the linear relationship between apparent [Na+]i and measured GAmil (Fig. 4). Indeed, when the rate of entry of Na+ through the ENaC was small, the apparent [Na+]i corresponded well to the Na+ concentration in the intracellular perfusate.
Figure 4. Relationship between the apparent intracellular sodium concentration, [Na+]i, and the amiloride-sensitive conductance (GAmil) of the exposed membrane.
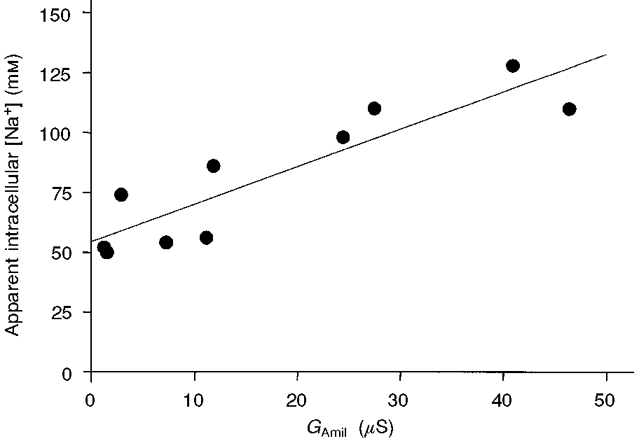
The apparent [Na+]i values were calculated from the reversal potential of the amiloride-sensitive current using a nominal external Na+ concentration of 50 mM. All these values (n = 10) were measured after a 30 min period during which the membrane potential was maintained at -100 mV and the intracellular side was continuously perfused with a 50 mM Na+ solution. During this period, GAmil was stable (i.e. no run-down). The straight line is the linear regression for [Na+]iversusGAmil and demonstrates a statistically significant correlation (r2 = 0.81, P < 0.001). Note that the intercept on the ordinate is close to 50 mM, which is the nominal Na+ concentration of the perfused intracellular solution. This relationship indicates the existence of a compartment just below the membrane, an intracellular unstirred layer, in which [Na+]i is influenced by the inflow of Na+.
Time course of intracellular perfusate exchange and the effect of pH
The highly Na+-selective amiloride-sensitive channels are sensitive to the intracellular pH (Palmer & Frindt, 1987; Harvey & Ehrenfeld, 1988). In order to test the effectiveness and the rate of exchange of the intracellular perfusate, we studied the effect of a change in pHi on IAmil. Reducing the pH of the perfusate from 7.4 to 6.5 caused a rapid decrease in IAmil by 46 ± 3 % (n = 5). As shown in Fig. 5A, with an intracellular perfusion flow rate of 5 μl min−1, IAmil reached a new steady state after about 2 min. This effect was usually reversible (Fig. 5A and B): after a return to the pH 7.4 solution, IAmil recovered to 99 ± 11 % of its initial value.
Figure 5. Effect of intracellular perfusion: acidification.
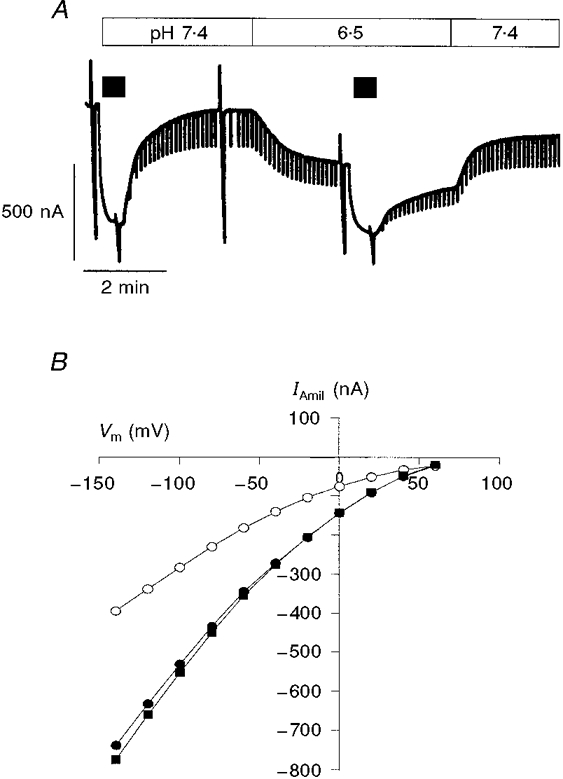
A, effect on IAmil resulting from acidification of the intracellular perfusion solution from pH 7.4 to 6.5 (filled bars above the current trace represent application of 5 μM amiloride). At a flow rate of 5 μl min−1, acidification decreased IAmil by about 40 %; IAmil reached a new steady state after about 2 min. When the pH was returned to control, in this example, IAmil reached about 85 % of the initial control current. The holding potential was -100 mV and the downward current deflections are due to the voltage steps to -60 mV used to monitor the membrane conductance. B, current-voltage relationships for IAmil before (•), during (○) and after (▪) a 3 min exposure to a pH 6.5 intracellular solution. In this example, the pH effect was fully reversible. The extracellular [Na+] was 50 mM and the perfused [Na+] was 1 mM.
Feedback inhibition in perfused and non-perfused oocytes
Kellenberger et al. (1998) observed that when oocytes with an initially low intracellular Na+ concentration were clamped at -100 mV using the two-electrode voltage-clamp technique, their apparent [Na+]i increased rapidly and a large run-down of IAmil was observed. As shown in Fig. 6A, we observed a similar run-down of IAmil in the cut-open oocyte setting when the oocytes were not perfused, the pipette being inserted into the oocyte solely to record the intracellular electrical potential. As IAmil is influenced by the reduction in the driving force that results from an increase in [Na+]i, we quantified the run-down of the ENaC by following the calculated GAmil between -80 and -100 mV, GAmil being almost independent of [Na+]i at highly negative membrane potentials. The mean GAmil decreased to 28 ± 5 % (n = 6) of its initial control value (Fig. 7A) after 30 min in non-perfused oocytes. This effect was concomitant with a marked increase in the apparent [Na+]i, as shown in Fig. 7B. By contrast, in oocytes perfused with a 20 mM intracellular Na+ concentration (n = 9), we observed no decline in IAmil or GAmil over a 30 min period (see example in Fig. 6A) although the apparent [Na+]i reached 55 ± 10 mM after 30 min. Furthermore, we observed no run-down of GAmil when, after an initial 5-10 min perfusion with a 1 mM Na+ intracellular solution, the Na+ concentration was increased to 50 mM (Figs 6C and 7A), even though the intracellular Na+ concentration increased to values largely above 50 mM (Fig. 7A). Thus, in perfused oocytes a run-down of GAmil did not occur despite very high values of apparent [Na+]i (up to 84 ± 16 mM after 40 min perfusion at a holding potential of -100 mV). However, when a 50 mM Na+ intracellular solution was used from the start of the perfusion, we observed a significant initial run-down of GAmil (data not shown).
Figure 6. Inhibition of ENaC downregulation during intracellular perfusion.

Original current recordings under cut-open oocyte conditions showing the decrease in IAmil when the membrane was clamped at -100 mV (downward deflections are due to voltage pulses to -60 mV). Filled bars above the current traces represent application of 5 μM amiloride. In A, the oocyte was impaled by the pipette but not perfused, the pipette being used only to record the intracellular voltage. The extracellular solution contained 50 mM Na+. B, when the intracellular side of the oocyte was perfused with a solution containing 20 mM Na+ (extracellular [Na+], 20 mM), IAmil remained stable over a 30-40 min period. C, a similar abolition of IAmil run-down was also seen when, after an initial 5-10 min perfusion with a 1 mM Na+ intracellular solution (up to the time indicated by the arrow), the oocyte was perfused with a 50 mM Na+ solution (extracellular [Na+], 50 mM). No significant effect on IAmil or GAmil was observed following this increase in the Na+ concentration of the intracellular perfusate.
Figure 7. Run-down of the amiloride-sensitive conductance (with a concomitant increase in [Na+]i) and its inhibition by intracellular perfusion.
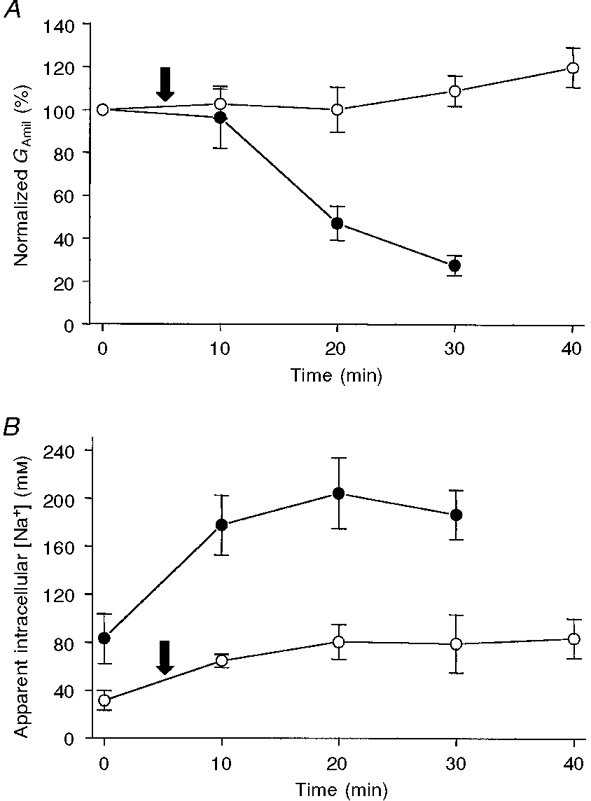
A, when the oocytes were not perfused (•; [Na+]o = 50 mM), GAmil decreased to about 30 % of its control value after 30 min of voltage clamping at -100 mV. By contrast, when the cell was perfused (○) with a 50 mM Na+ intracellular solution, GAmil remained stable for at least 40 min. For non-perfused and perfused oocytes, the initial current values were 1.57 ± 0.31 μA ( n = 6) and 1.78 ± 0.65 μA (n = 6), respectively, and the initial conductances were 18.7 ± 7.4 and 16.8 ± 3.5 μS. For the perfused oocytes, note that the first GAmil value was measured when the cell was perfused with 1 mM Na+; the Na+ concentration was changed to 50 mM at the time indicated by the arrow. This change from a 1 to a 50 mM Na+ intracellular perfusion did not lead to a modification in GAmil. B, in non-perfused oocytes (•), even though the oocytes were incubated in 1 mM Na+, the values of the apparent [Na+]i had already reached 80 mM at the time of the first measurement. The apparent [Na+]i then increased to a mean value of about 200 mM. When the oocyte was intracellularly perfused with 50 mM Na+ (○; first 5 min with 1 mM: arrow; see A), the mean apparent [Na+]i reached a plateau at about 80 mM. The actual values were between 59 and 128 mM after 40 min and were a function of the measured GAmil (see Fig. 4).
Taken together, these results strongly suggest that the intracellular Na+ concentration, despite being the probable trigger for the run-down, is not acting directly on the ENaC. Rather, feedback inhibition may be due to a cascade of intracellular events involving other factors that may have been removed by intracellular perfusion. Possible mediators of the feedback inhibition that could act directly on the ENaC include ATP, calcium and pH, and we took advantage of the cut-open oocyte technique to investigate the effect of these factors on ENaC activity.
Effect of intracellular ATP
Intracellular ATP and the ratio ATP/ADP are known to regulate various ion channels and transporters (Hilgemann, 1997). In addition, an increase in Na+ entry into the cell may lead to a decrease in [ATP], since Na+ stimulates the consumption of ATP by the sodium pump. ATP is therefore a possible mediator of Na+-dependent ENaC inhibition. As described in the Methods section, the intracellular perfusion solutions contained 1 mM ATP (a condition we had chosen initially in case ATP was a necessary co-factor for the actual regulatory mechanism). In another set of experiments, ATP was not included in the intracellular perfusate used at the beginning of the experiment so that we could test the effect of addition of ATP on IAmil. Increasing the concentration of ATP in the solution from nominally zero ATP to 1 or 5 mM did not induce any detectable change in IAmil (Fig. 8A).
Figure 8. Effect of acute change in intracellular ATP and Ca2+ concentrations.
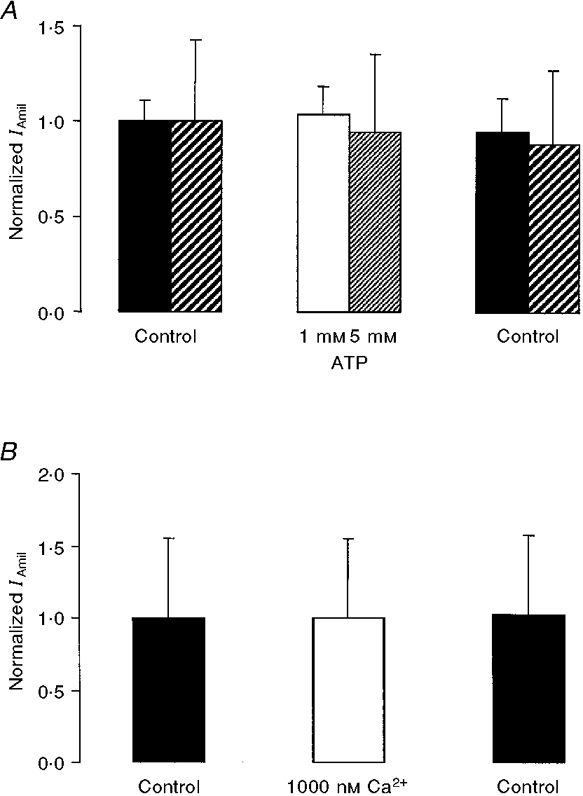
A, ATP at 1 or 5 mM did not influence IAmil (absolute initial values for 1 and 5 mM ATP, respectively: 0.4 ± 0.05 μA, n = 3 and 1.0 ± 0.4 μA, n = 3). B, when the calculated free Ca2+ concentration was increased from less than 10 nM to 1000 nM, no change in IAmil was observed (absolute initial value: 1.2 ± 0.7 μA, n = 3). Note: in both cases, the nominal extracellular Na+ concentration was 90 mM and the intracellular Na+ concentration was 20 mM. IAmil values for Ca2+ or ATP (normalized with respect to Control) were obtained 4-5 min or 3 min, respectively, after the intracellular solution exchange, the flow rate being 5 μl min−1 in each case.
Effect of intracellular calcium
Intracellular Ca2+ has been proposed as a mediator of feedback inhibition in several experimental situations (Silver et al. 1993; Ishikawa et al. 1998). To test the direct effect of Ca2+ on the ENaC, we started the intracellular perfusion with a nominally Ca2+-free solution containing 2 mM EGTA and 1 mM ATP, and then added calcium to increase the calculated free Ca2+ concentration to 1000 nM for a 10 min period. This large increase in the intracellular Ca2+ concentration had no significant effect on IAmil (Fig. 8A).
Role of intracellular pH
We have already described the direct effect of pHi on IAmil (see above and Fig. 5). As a result of the presence of the Na+-H+ exchanger, an increase in [Na+]i could result in intracellular acidification, which in turn could be directly responsible for the inhibition of the ENaC and thus explain feedback inhibition (Palmer & Frindt, 1987; Harvey et al. 1988). In order to test this possibility, we studied the pH sensitivity of a mutant ENaC (the Liddle-mutant, αβR564stopγ), a channel which failed to show downregulation in oocytes under similar experimental conditions (Kellenberger et al. 1998). Acidification of the intracellular perfusate from pH 7.4 to 6.5 decreased IAmil to 70 ± 4 % ( n = 3) of the initial value for this mutant. This observation suggests that pHi is unlikely to be either the single or main mediator of feedback inhibition.
DISCUSSION
In the present study, we looked for intracellular factors that might be involved in the feedback inhibition of ENaCs expressed in Xenopus oocytes. The main finding was that this downregulation did not occur when the cytosol of the cell was largely removed by intracellular perfusion, even when the intracellular concentration of Na+ reached values as high as those at which feedback inhibition was observed in non-perfused oocytes. This observation suggests that at least one essential cytosolic component was removed by the intracellular perfusion. We subsequently found that none of the factors Na+, ATP or Ca2+ had a direct effect on ENaC activity. Further, although pHi did modulate ENaC activity, it did not seem to be the main or sole mediator of the observed downregulation.
Study of ENaCs with the cut-open oocyte technique
The cut-open oocyte technique was originally developed for the study of gating currents in potassium channels, as this technique allows for rapid voltage clamping (Taglialatela et al. 1992). This technique also permits intracellular perfusion of the oocyte and we took advantage of this to study the influence of intracellular factors on rENaCs. In perfused oocytes, we measured IAmil, which was similar in terms of both magnitude and current-voltagerelationship to IAmil measured using the classical two-electrode voltage-clamp method. Depending on the oocyte batch, these currents remained very stable for over 30-40 min (see below). We tested the effectiveness and the rate of exchange of the intracellular perfusate by observing the effect of a pH change on the amiloride-sensitive current. In fact, IAmil rapidly and reversibly decreased by about 40 % when the pHi was changed from 7.4 to 6.5. Two previous studies have quantified the dependence of the ENaC on pHi. In frog skin (Harvey & Ehrenfeld, 1988), GAmil decreased by about 80 % when the pHi was lowered from 7.4 to 6.5. In patch-clamp experiments on the cells of rat cortical collecting ducts (Palmer & Frindt, 1987), the open probability (Po) decreased by 88 % in response to an identical decrease in pHi. One reason for the smaller change in IAmil in our experiments could be that we could not control with any precision the pH just below the membrane because of the unstirred-compartment phenomenon (see below).
The membrane preparation obtained using the cut-open oocyte technique brings many advantages to the study of the action of potential intracellular regulatory factors on membrane transport proteins. The elements of the cytosol that are not attached to either the membrane or the membrane-associated cytoskeleton can be removed, and the concentration of any soluble factor(s) can be controlled by the intracellular perfusion with a time course of a few minutes. The difficulty of precisely controlling the submembrane concentration of ions because of the existence of unstirred layers (see below) can be avoided by working under conditions in which the rate of net transport is low. The preparation allows the observation of stable channel activity for periods of up to 40 min under precisely controlled conditions. The intracellular perfusion can be carried out using a small volume of solution (down to 100 μl) allowing the testing of substances available only in restricted amounts. Furthermore, for the analysis of ENaC regulation, it is an advantage that the size of the active membrane surface is large enough to measure ‘macroscopic’ currents, since the regulation of the activity of this channel is made difficult in studies of single-channel currents by the large spontaneous variability seen in the Po of individual Na+ channels (Garty & Palmer, 1997).
Unstirred layers
When the oocyte was not perfused, the apparent [Na+]i values, calculated using the Erev obtained from the IAmil current-voltage curve, were surprisingly high (up to 200 mM). A similar observation has already been reported and discussed by Kellenberger et al. (1998). It should be pointed out that the values calculated from Erev reflect the [Na+]i in a cytosolic compartment close to the plasma membrane, and not the bulk Na+ concentration inside the cell. When the cell was perfused, we found that the calculated apparent [Na+]i was usually higher than the perfused Na+ concentration and that it was linearly related to GAmil in the same preparation. We interpret these observations as indicating that the entry of Na+ through the ENaC influences [Na+]i in the unstirred compartment close to the membrane. As a matter of fact, when GAmil was small, [Na+]i corresponded well to the Na+ concentration of the perfusate (Fig. 4), which indicates that although this compartment could not be reached through convectional flow, it was nevertheless in diffusion equilibrium with the bulk of the perfused solution. When interpreting these observations, it is important to note that the calculation from the Nernst equation using the measured amiloride-sensitive Erev (see Methods) yields a measure of the [Na+]i/[Na+]o ratio. We have used the nominal [Na+]o in our calculations of [Na+]i but the presence of extracellular unstirred layers (between the vitelline layer and the plasma membrane, see Fig. 2) could also influence the real value of [Na+]o close to the membrane. It follows that we probably somewhat overestimated the real [Na+]o when using the nominal extracellular Na+ concentration for the calculations.
The electron micrographs of the perfused oocytes clearly show a 10-60 μm zone in which organelles are present (Fig. 2A). They presumably remain attached to the membrane by cytoskeletal elements that have not been removed by the intracellular perfusion. This zone constitutes an intracellular unstirred layer. Furthermore, the cytosol within the microvilli may also represent an unstirred compartment that is important if the Na+ channels are expressed on the villi. Thus the Na+ concentrations close to the membrane on both sides may be quite different from the concentrations of the bulk solutions perfused around and inside the oocyte when a large flux of Na+ is moving across the membrane. Our demonstration of the presence of unstirred layers points to a possibly physiologically relevant sodium microdomain within the cell, as also observed for Na+ in cardiac cells (Carmeliet, 1992; Wendt-Gallitelli et al. 1993). The cut-open oocyte technique, which allows perfusion of both sides of the membrane with solutions of known composition and a precise determination of the transmembrane ion gradient from measurement of the reversal potential, enables us to characterize in a quantitative way the effect of the unstirred layers. The sodium concentration in this compartment may reach values very different from the whole-cell sodium concentration. This implies that [Na+]i measurements made using, for example, intracellular ion-specific microelectrodes, Na+-specific dyes or tissue homogenization need to be interpreted with caution when the aim is to establish the ion concentration at the plasma membrane and its effect on membrane proteins such as ion channels, coupled transport systems or pumps (Carmeliet, 1992; Fujioka et al. 1998).
Feedback inhibition in perfused and non-perfused oocytes
Feedback inhibition of ENaCs was first proposed by MacRobbie & Ussing (1961) who observed that cells of the frog skin expressing apical amiloride-sensitive Na+ channels did not swell as expected when Na+ extrusion by Na+,K+-ATPase was blocked. The presence of a feedback regulation serving to inhibit the channel when Na+ enters the cell has since been confirmed at the single-channel level (Silver et al. 1993; Frindt et al. 1993). In oocytes expressing rENaCs studied using the two-electrode voltage-clamp technique, a rapid run-down is consistently observed. This phenomenon was investigated in detail in a recent study (Kellenberger et al. 1998) in which it was convincingly shown that the rate of this run-down was directly dependent on the rate of Na+ entry into the cell (the higher the IAmil, the faster the rate of run-down). This indicated that the increase in [Na+]i is the trigger for the feedback inhibition of the ENaC expressed in the Xenopus oocyte. In our experimental setting, it was also possible to see an increase in the apparent [Na+]i and a concomitant run-down of GAmil when the cell was simply impaled with the voltage-recording pipette (and not perfused). This run-down was of the same magnitude (by about 70-80 % in 30 min) as that seen in two-electrode voltage-clamp experiments (Kellenberger et al. 1998). The higher values of apparent [Na+]i in our study (an average of 187 versus 120 mM) may be explained by the fact that we were able to use oocytes with a larger IAmil (about 15-20 μA when extrapolated to the whole oocyte as compared with 4-8 μA per oocyte in the study of Kellenberger et al. 1998). In the cut-open oocyte setting we are not limited by very large inflows of Na+ since osmotic swelling of the oocyte cannot occur.
Although feedback inhibition was clearly observed in non-perfused oocytes, the Na+-dependent downregulation was abolished when the oocytes were intracellularly perfused with various solutions, even though the [Na+]i reached high values (within the range 50-130 mM). In addition, a change in the perfused intracellular Na+ concentration from 1 to 50 mM did not induce any detectable change in the amiloride-sensitive Na+ conductance. These observations strongly suggest that sodium itself does not regulate the channel by direct interaction with the ENaC protein. Palmer and co-workers (Palmer et al. 1989) reached the same conclusion after studying Na+ channel activity in excised patches from rat cortical collecting ducts. However, this finding is in conflict with the results of a recent study involving excised patch-clamp experiments on rENaCs expressed in MDCK cells (Ishikawa et al. 1998). In that study, the NPo (mean number of open channels) was decreased by about 75 % when [Na+]i was increased from 0 to 100 mM. We have no documented explanation for this difference but it may be that, with the inside-out patch-clamp configuration used in the experiments on MDCK cells, some essential component of the feedback mechanism remains associated with the membrane, while it was removed by intracellular perfusion in the oocytes used here. The other studies of the effect of intracellular Na+ on amiloride-sensitive channels are difficult to compare with ours because of the different experimental conditions used: either the channel was studied in an artificial membrane consisting of a lipid bilayer (Ismailov et al. 1995) or the work was carried out using whole-cell patch clamping, which does not allow efficient removal of intracellular components of large molecular size (Komwatana et al. 1996). We think that, by using intracellular perfusion of the oocyte, we were able to remove most of the cytosol, including even those slowly diffusible cytosolic components that could be associated with ENaCs such as Nedd4, ubiquitin, elements involved in clathrin-mediated endocytosis and/or other factors like G proteins (as recently proposed in a study on salivary duct cells; Komwatana et al. 1998). Thus, our preparation may be devoid of most of the potential regulatory elements that are neither membrane proteins nor proteins strongly linked with the membrane-associated cytoskeleton.
Mediators of feedback inhibition
Several mediators have been implicated in ENaC feedback inhibition (for a review, see Garty & Palmer, 1997). These factors may form part of a molecular cascade starting with a sodium-sensing mechanism and ending with an effector acting directly on the channel itself. As discussed in detail above, we have shown that Na+ is not the effector of this downregulating mechanism.
ATP was the first regulatory factor to be suggested. ATP is a known regulator of a whole class of K+ channels (Tucker & Ashcroft, 1998) and a change in [Na+]i modulates the ATP content of the cell, an increase in [Na+]i increasing the consumption of ATP by the cell's Na+,K+-ATPase (Tsuchiya et al. 1992). However, we failed to observe any effect of ATP on the amiloride-sensitive Na+ current when the perfusate was changed from a nominally ATP-free solution to solution containing 1 or 5 mM ATP. In addition, the run-down of ENaC activity observed in the absence of Na+,K+-ATPase activity (our present study with a K+-free extracellular solution) was similar to that observed when the Na+,K+-ATPase was activated by the presence of extracellular K+ (Kellenberger et al. 1998). Thus our results do not support the hypothesis of a regulation by intracellular ATP and a direct link between ENaC activity and Na+,K+-ATPase activity.
We next addressed the question of the role of intracellular Ca2+, a factor proposed a long time ago as a possible mediator of feedback inhibition (Grinstein & Erlij, 1978; Schultz, 1981). An increase in [Na+]i might decrease the driving force available to the Na+-Ca2+ exchanger and so lead to an increase in [Ca2+]i. A number of studies - on intact epithelia (Ling & Eaton, 1989), MDCK epithelia (whole-cell patch-clamp experiments; Ishikawa et al. 1998) and membrane vesicles from toad urinary bladder (Garty et al. 1987) - have demonstrated an inhibitory effect of intracellular Ca2+ on Na+ conductance. However, under our experimental conditions, a change from less than 10 nM to 1000 nM Ca2+ in the intracellular perfusate had no effect on the ENaC. These negative results with intracellularly perfused oocytes suggest that the above effects may not be due to a direct interaction of Ca2+ with the ENaC protein. Several other studies have indicated that the ENaC expressed in Xenopus oocytes is not sensitive to [Ca2+]i, arguing against a direct effect of Ca2+ on the ENaC. The run-down phenomenon observed by Kellenberger et al. (1998) was not decreased by buffering [Ca2+]i with EGTA or BAPTA. Another piece of indirect evidence suggesting the absence of an inhibitory effect of [Ca2+]i on the ENaC expressed in oocytes is provided by the observation that extracellular trypsin, which produces a large increase in intracellular Ca2+, activates, rather than inhibits, the amiloride-sensitive Na+ current (Chraïbi et al. 1998).
As in the case of intracellular Na+, the results with Ca2+ indicate that some regulatory components normally present in epithelial cells are needed for Ca2+ to exert its effect on ENaC activity. This hypothesis is strongly supported by the results of Palmer & Frindt (1987), who worked on the cells of rat collecting ducts. They showed that the single epithelial Na+ channel currents observed in excised inside-out patches were not influenced by [Ca2+]i, while an increase in [Ca2+]i brought about by the addition of a calcium ionophore decreased channel activity in cell-attached patch-clamp recordings.
Intracellular pH has also been proposed as a mediator of feedback inhibition. Harvey et al. (1988), using the same type of argument as that used in favour of Ca2+, suggested that, because of the presence of the Na+-H+ exchanger, an increase in [Na+]i would result in intracellular acidification which would then inhibit the Na+ channel. Like other workers (Palmer & Frindt, 1987; Harvey & Thomas, 1987; Harvey et al. 1988), we did indeed observe a significant inhibition of ENaC activity by low pH. However, two observations argue against this way of explaining feedback inhibition. First, a decrease in pHi to 6.5 reduced IAmil by about 40 %; this means that a much greater degree of acidification would be necessary to reach the 70-80 % decrease in IAmil seen during Na+ entry. Such a large decrease in pHi would seem very unlikely to occur under physiological conditions. Second, we studied the pH sensitivity of ENaCs carrying Liddle's mutation (αβR564stopγ) which have been shown to be resistant to Na+-dependent downregulation (Kellenberger et al. 1998). Incorporation of this mutation did not abolish the sensitivity of the ENaC to the intracellular pH and we therefore conclude that protons are most probably not the effectors for feedback inhibition.
Having excluded a role for intracellular pH and the direct effects of ATP, Ca2+ and Na+ itself, what are we left with as a possible mechanism for feedback inhibition?
Kellenberger et al. (1998) demonstrated that this Na+-triggered regulatory phenomenon was dependent on the presence of an intact PY-motif (Staub & Rotin, 1997) in the β- and γ-subunits. The cytosolic protein Nedd4 (Staub et al. 1996), which is found in almost all tissues expressing ENaCs (Staub et al. 1997) and also in the Xenopus oocyte (Staub et al. 1996), binds to these PY-motifs via its WW-domains. This interaction probably downregulates the ENaC but the mechanism underlying this effect has not yet been elucidated. In another model (viz. mouse salivary duct cells exhibiting amiloride-sensitive currents), Nedd4 antibodies were shown to disrupt the Na+-dependent negative regulation of these currents (Dinudom et al. 1998). ENaC Na+-dependent downregulation (over a period of hours) has recently been shown to be prevented by the expression of a dominant-negative mutant of dynamin in Xenopus oocytes (Shimkets et al. 1997), pointing to a role for clathrin-mediated endocytosis in this regulation.
Our results show that intracellular Na+, Ca2+ and ATP do not interact directly with the ENaC protein expressed in oocytes. These observations do not mean that these factors are not involved at all in the regulation of ENaC activity, rather that the mechanism underlying this regulation requires the presence of additional factors that can be removed by intracellular perfusion. Use of the cut-open oocyte technique should allow the effects of several more of these factors to be tested.
Acknowledgments
We thank Mrs J. Fakan, Mrs F. Voinesco, Miss N. Ruchonnet and Mr F. Ardizonni from the Centre of Electron Microscopy of the University of Lausanne for their expert and kind technical help. We also wish to thank Dr S. Fakan for his helpful comments and Dr J.-Y. Lapointe for his help in setting up the cut-open oocyte technique. We are grateful to Drs S. Kellenberger, L. Schild and O. Staub for sharing unpublished observations and for their critical reading of the manuscript. This work was supported by the Human Frontier Science Program, grant RG-0464.
References
- Benos DJ, Fuller CM, Shlyonsky VG, Berdiev BK, Ismailov II. Amiloride-sensitive Na+ channels - insights and outlooks. News in Physiological Sciences. 1997;12:55–61. [Google Scholar]
- Carmeliet E. A fuzzy subsarcolemmal space for intracellular Na+ in cardiac cells? Cardiovascular Research. 1992;26:433–442. doi: 10.1093/cvr/26.5.433. [DOI] [PubMed] [Google Scholar]
- Chang D, Hsieh PS, Dawson DC. Calcium: a program in BASIC for calculating the composition of solutions with specified free concentrations of calcium, magnesium and other divalent cations. Computers in Biology & Medicine. 1988;18:351–366. doi: 10.1016/0010-4825(88)90022-4. [DOI] [PubMed] [Google Scholar]
- Chang SS, Grunder S, Hanukoglu A, Rosler A, Mathew PM, Hanukoglu I, Schild L, Lu Y, Shimkets RA, Nelson-Williams C, Rossier BC, Lifton RP. Mutations in subunits of the epithelial sodium channel cause salt wasting with hyperkalaemic acidosis, pseudohypoaldosteronism type 1. Nature Genetics. 1996;12:248–253. doi: 10.1038/ng0396-248. [DOI] [PubMed] [Google Scholar]
- Chraïbi A, Vallet V, Firsov D, Kharoubi-Hess S, Horisberger J-D. Protease modulation of the activity of the epithelial sodium channel expressed in Xenopus oocytes. Journal of General Physiology. 1998;111:127–138. doi: 10.1085/jgp.111.1.127. [DOI] [PMC free article] [PubMed] [Google Scholar]
- Costa ACS, Patrick JW, Dani JA. Improved technique for studying ion channels expressed in Xenopus oocytes, including fast superfusion. Biophysical Journal. 1994;67:395–401. doi: 10.1016/S0006-3495(94)80494-1. [DOI] [PMC free article] [PubMed] [Google Scholar]
- Dersch MA, Bement WM, Larabell CA, Mecca MD, Capco DG. Cortical membrane-trafficking during the meiotic resumption of Xenopus laevis oocytes. Cell and Tissue Research. 1991;263:375–383. doi: 10.1007/BF00318779. [DOI] [PubMed] [Google Scholar]
- Dinudom A, Harvey KF, Komwatana P, Young JA, Kumar S, Cook DI. Nedd4 mediates control of an epithelial Na+ channel in salivary duct cells by cytosolic Na+ Proceedings of the National Academy of Sciences of the USA. 1998;95:7169–7173. doi: 10.1073/pnas.95.12.7169. 10.1073/pnas.95.12.7169. [DOI] [PMC free article] [PubMed] [Google Scholar]
- Firsov D, Gautschi I, Merillat AM, Rossier BC, Schild L. The heterotetrameric architecture of the epithelial sodium channel (ENaC) EMBO Journal. 1998;17:344–352. doi: 10.1093/emboj/17.2.344. 10.1093/emboj/17.2.344. [DOI] [PMC free article] [PubMed] [Google Scholar]
- Frindt G, Silver RB, Windhager EE, Palmer LG. Feedback regulation of Na channels in rat CCT. II. Effects of inhibition of Na entry. American Journal of Physiology. 1993;264:F565–574. doi: 10.1152/ajprenal.1993.264.3.F565. [DOI] [PubMed] [Google Scholar]
- Fujioka Y, Matsuoka S, Ban T, Noma A. Interaction of the Na+-K+ pump and Na+-Ca2+ exchange via [Na+]i in a restricted space of guinea-pig ventricular cells. The Journal of Physiology. 1998;509:457–470. doi: 10.1111/j.1469-7793.1998.457bn.x. [DOI] [PMC free article] [PubMed] [Google Scholar]
- Garty H, Asher C, Yeger O. Direct inhibition of epithelial Na+ channels by a pH-dependent interaction with calcium, and by other divalent ions. Journal of Membrane Biology. 1987;95:151–162. doi: 10.1007/BF01869160. [DOI] [PubMed] [Google Scholar]
- Garty H, Palmer LG. Epithelial sodium channels - function, structure, and regulation. Physiological Reviews. 1997;77:359–396. doi: 10.1152/physrev.1997.77.2.359. [DOI] [PubMed] [Google Scholar]
- Grinstein S, Erlij D. Intracellular calcium and the regulation of sodium transport in the frog skin. Proceedings of the Royal Society. 1978;B 202:353–360. doi: 10.1098/rspb.1978.0072. [DOI] [PubMed] [Google Scholar]
- Harvey BJ, Ehrenfeld J. Role of Na+/H+ exchange in the control of intracellular pH and cell membrane conductances in frog skin epithelium. Journal of General Physiology. 1988;92:793–810. doi: 10.1085/jgp.92.6.793. 10.1085/jgp.92.6.793. [DOI] [PMC free article] [PubMed] [Google Scholar]
- Harvey BJ, Thomas RC. Intracellular pH and calcium effects on sodium conductance and transport in isolated frog skin epithelium. The Journal of Physiology. 1987;394:92P. [Google Scholar]
- Harvey BJ, Thomas SR, Ehrenfeld J. Intracellular pH controls cell membrane Na+ and K+ conductances and transport in frog skin epithelium. Journal of General Physiology. 1988;92:767–791. doi: 10.1085/jgp.92.6.767. 10.1085/jgp.92.6.767. [DOI] [PMC free article] [PubMed] [Google Scholar]
- Hilgemann DW. Cytoplasmic ATP-dependent regulation of ion transporters and channels: mechanisms and messengers. Annual Review of Physiology. 1997;59:193–220. doi: 10.1146/annurev.physiol.59.1.193. 10.1146/annurev.physiol.59.1.193. [DOI] [PubMed] [Google Scholar]
- Horisberger J-D. Amiloride-sensitive Na channels. Current Opinion in Cell Biology. 1998;10:443–449. doi: 10.1016/s0955-0674(98)80056-2. 10.1016/S0955-0674(98)80056-2. [DOI] [PubMed] [Google Scholar]
- Ishikawa T, Marunaka Y, Rotin D. Electrophysiological characterization of the rat epithelial Na+ channel (rENaC) expressed in MDCK cells - effects of Na+ and Ca2+ Journal of General Physiology. 1998;111:825–846. doi: 10.1085/jgp.111.6.825. 10.1085/jgp.111.6.825. [DOI] [PMC free article] [PubMed] [Google Scholar]
- Ismailov II, Berdiev BK, Benos DJ. Regulation by Na+ and Ca2+ of renal epithelial Na+ channels reconstituted into planar lipid bilayers. Journal of General Physiology. 1995;106:445–466. doi: 10.1085/jgp.106.3.445. 10.1085/jgp.106.3.445. [DOI] [PMC free article] [PubMed] [Google Scholar]
- Kellenberger S, Gautschi I, Rossier BC, Schild L. Mutations causing Liddle-syndrome reduce sodium-dependent downregulation of the epithelial sodium channel in the Xenopus oocyte expression system. Journal of Clinical Investigation. 1998;101:2741–2750. doi: 10.1172/JCI2837. [DOI] [PMC free article] [PubMed] [Google Scholar]
- Komwatana P, Dinudom A, Young JA, Cook DI. Cytosolic Na+ controls an epithelial Na+ channel via the G(o) guanine nucleotide-binding regulatory protein. Proceedings of the National Academy of Sciences of the USA. 1996;93:8107–8111. doi: 10.1073/pnas.93.15.8107. 10.1073/pnas.93.15.8107. [DOI] [PMC free article] [PubMed] [Google Scholar]
- Komwatana P, Dinudom A, Young JA, Cook DI. Activators of epithelial Na+ channels inhibit cytosolic feedback control - evidence for the existence of a G protein-coupled receptor for cytosolic Na+ Journal of Membrane Biology. 1998;162:225–232. doi: 10.1007/s002329900360. 10.1007/s002329900360. [DOI] [PubMed] [Google Scholar]
- Ling BN, Eaton DC. Effects of luminal Na+ on single Na+ channels in A6 cells, a regulatory role for protein kinase C. American Journal of Physiology. 1989;256:F1094–1103. doi: 10.1152/ajprenal.1989.256.6.F1094. [DOI] [PubMed] [Google Scholar]
- MacRobbie EAC, Ussing HH. Osmotic behaviour of the epithelial cells of frog skin. Acta Physiologica Scandinavica. 1961;53:348–365. doi: 10.1111/j.1748-1716.1961.tb02293.x. [DOI] [PubMed] [Google Scholar]
- Palmer LG, Frindt G. Effects of cell Ca and pH on Na channels from rat cortical collecting tubule. American Journal of Physiology. 1987;253:F333–339. doi: 10.1152/ajprenal.1987.253.2.F333. [DOI] [PubMed] [Google Scholar]
- Palmer LG, Frindt G, Silver RB, Strieter J. Feed-back regulation of epithelial sodium channels. Current Topics in Membranes and Transport. 1989;34:45–60. [Google Scholar]
- Palmer LG, Sackin H, Frindt G. Regulation of Na+ channels by luminal Na+ in rat cortical collecting tubule. The Journal of Physiology. 1998;509:151–162. doi: 10.1111/j.1469-7793.1998.151bo.x. [DOI] [PMC free article] [PubMed] [Google Scholar]
- Puoti A, May A, Canessa CM, Horisberger J-D, Schild L, Rossier BC. The highly selective low conductance epithelial Na channel of Xenopus laevis A6 kidney cells. American Journal of Physiology. 1995;38:C188–197. doi: 10.1152/ajpcell.1995.269.1.C188. [DOI] [PubMed] [Google Scholar]
- Rossier BC. Cum grano salis - the epithelial sodium channel and the control of blood pressure. Journal of the American Society of Nephrology. 1997;8:980–992. doi: 10.1681/ASN.V86980. [DOI] [PubMed] [Google Scholar]
- Schild L, Lu Y, Gautschi I, Schneeberger E, Lifton RP, Rossier BC. Identification of a PY motif in the epithelial Na channel subunits as a target sequence for mutations causing channel activation found in Liddle syndrome. EMBO Journal. 1996;15:2381–2387. [PMC free article] [PubMed] [Google Scholar]
- Schultz SG. Homocellular regulatory mechanisms in sodium-transporting epithelia: avoidance of extinction by ‘flush-through’. American Journal of Physiology. 1981;241:F579–590. doi: 10.1152/ajprenal.1981.241.6.F579. [DOI] [PubMed] [Google Scholar]
- Shimkets RA, Lifton RP, Canessa CM. The activity of the epithelial sodium channel is regulated by clathrin-mediated endocytosis. Journal of Biological Chemistry. 1997;272:25537–25541. doi: 10.1074/jbc.272.41.25537. 10.1074/jbc.272.41.25537. [DOI] [PubMed] [Google Scholar]
- Shimkets RA, Warnock DG, Bositis CM, Nelson-Williams C, Hansson JH, Schambelan M, Gill JR, Jr Ulick S, Milora RV, Findling JW, Canessa CM, Rossier BC, Lifton RP. Liddle's syndrome: heritable human hypertension caused by mutations in the beta subunit of the epithelial sodium channel. Cell. 1994;79:407–414. doi: 10.1016/0092-8674(94)90250-x. [DOI] [PubMed] [Google Scholar]
- Silver RB, Frindt G, Windhager EE, Palmer LG. Feedback regulation of Na channels in rat CCT. I. Effects of inhibition of Na pump. American Journal of Physiology. 1993;264:F557–564. doi: 10.1152/ajprenal.1993.264.3.F557. [DOI] [PubMed] [Google Scholar]
- Staub O, Dho S, Henry PC, Correa J, Ishikawa T, McGlade J, Rotin D. WW domains of Nedd4 bind to the proline-rich PY motifs in the epithelial Na+ channel deleted in Liddle's syndrome. EMBO Journal. 1996;15:2371–2380. [PMC free article] [PubMed] [Google Scholar]
- Staub O, Rotin D. Regulation of ion transport by protein-protein interaction domains. Current Opinion in Nephrology and Hypertension. 1997;6:447–454. doi: 10.1097/00041552-199709000-00007. [DOI] [PubMed] [Google Scholar]
- Staub O, Yeger H, Plant PJ, Kim H, Ernst SA, Rotin D. Immunolocalization of the ubiquitin-protein ligase Nedd4 in tissues expressing the epithelial Na+ channel (ENaC) American Journal of Physiology. 1997;41:C1871–1880. doi: 10.1152/ajpcell.1997.272.6.C1871. [DOI] [PubMed] [Google Scholar]
- Taglialatela M, Toro L, Stefani E. Novel voltage clamp to record small, fast currents from ion channels expressed in Xenopus oocytes. Biophysical Journal. 1992;61:78–82. doi: 10.1016/S0006-3495(92)81817-9. [DOI] [PMC free article] [PubMed] [Google Scholar]
- Tsuchiya K, Wang W, Giebisch G, Welling PA. ATP is a coupling modulator of parallel Na,K-ATPase-K-channel activity in the renal proximal tubule. Proceedings of the National Academy of Sciences of the USA. 1992;89:6418–6422. doi: 10.1073/pnas.89.14.6418. [DOI] [PMC free article] [PubMed] [Google Scholar]
- Tucker SJ, Ashcroft FM. A touching case of channel regulation - the ATP-sensitive K+ channel. Current Opinion in Neurobiology. 1998;8:316–320. doi: 10.1016/s0959-4388(98)80055-x. 10.1016/S0959-4388(98)80055-X. [DOI] [PubMed] [Google Scholar]
- Turnheim K. Intrinsic regulation of apical sodium entry in epithelia. Physiological Reviews. 1991;71:429–445. doi: 10.1152/physrev.1991.71.2.429. [DOI] [PubMed] [Google Scholar]
- Wendt-Gallitelli MF, Voigt T, Isenberg G. Microheterogeneity of subsarcolemmal sodium gradients. Electron probe microanalysis in guinea-pig ventricular myocytes. The Journal of Physiology. 1993;472:33–44. doi: 10.1113/jphysiol.1993.sp019934. [DOI] [PMC free article] [PubMed] [Google Scholar]