

Abstract
Mechanical fluctuations of the cell membrane (CMFs) in human erythrocytes reflect the bending deformability of the membrane-skeleton complex. These fluctuations were monitored by time-dependent light scattering from a small area (≈0.25 μm2) of the cell surface by a method based on point dark field microscopy.
Exposure of red blood cells (RBCs) to adrenaline (epinephrine) and isoproterenol (isoprenaline) resulted in up to a 45 % increase in the maximal fluctuation amplitude and up to a 35 % increase in the half-width of the amplitude distribution. The power spectra of membrane fluctuations of control and treated cells revealed that adrenaline stimulated only the low frequency component (0.3-3 Hz). Analysis of the dose-response curves of β-adrenergic agonists yielded an EC50 of 5 × 10⁻⁹ and 1 × 10⁻¹¹ M for adrenaline and isoproterenol, respectively. Propranolol had an inhibitory effect on the stimulatory effect of isoproterenol. These findings show a potency order of propranolol > isoproterenol > adrenaline.
The stimulatory effect of adrenaline was a temporal one, reaching its maximal level after 20-30 min but being abolished after 60 min. However, in the presence of 3-isobutyl-1-methylxanthine, a partial stimulatory effect was maintained even after 60 min. Pentoxifylline and 8-bromo-cAMP elevated CMFs. However, exposure of ATP-depleted erythrocytes to adrenaline or 8-bromo-cAMP did not yield any elevation in CMFs. These findings suggest that the β-agonist effect on CMFs is transduced via a cAMP-dependent pathway.
Deoxygenation decreased CMFs and filterability of erythrocytes by ≈30 %. The stimulatory effect of isoproterenol on CMFs was 2.2-fold higher in deoxygenated RBCs than in oxygenated cells.
Exposure of RBCs to adrenaline resulted in a concentration-dependent increase in RBC filterability, demonstrating a linear relationship between CMFs and filterability, under the same exposure conditions to adrenaline. These findings suggest that β-adrenergic agonists may improve passage of erythrocytes through microvasculature, enhancing oxygen delivery to tissues, especially under situations of reduced oxygen tension for periods longer than 20 min.
Cell membrane fluctuations (CMFs) were first noticed as a ‘flickering’ phenomenon observed in human erythrocytes. Flickering is revealed as light shimmering at the rim of the centre of the red blood cell (RBC). This phenomenon was attributed to changes in light absorbance and forward light scattering by haemoglobin due to thickness changes at the central part of the RBC. Quantitative measurements of flickering were performed by Brochard & Lennon (1975). That study was corroborated by later investigations (Fricke & Sackmann, 1984; Fricke et al. 1986; Zeman et al. 1990) using phase-contrast and reflection-interference microscopic methodologies. The contribution of both haemoglobin diffusion and cell membrane displacements to light scattering emerged from quasi-elastically scattered laser measurements from single RBCs (Tishler & Carlson, 1993). Measurements of displacements of the cell membrane, devoid to a large extent of the contribution of haemoglobin, were rendered possible by the development of point dark field microscopy (Krol et al. 1990; Levin & Korenstein, 1991; Tuvia et al. 1998), which measures temporal light scattering from a small area (∼0.25 μm2) along the edge of the cell. CMFs, measured by point dark field microscopy, were observed not only in erythrocytes (Krol et al. 1990; Levin & Korenstein, 1991; Tuvia et al. 1992a,b; Korenstein et al. 1994) but also in different nucleated cells including monocytes, lymphocytes, 3T6 fibroblasts, cardiomyocytes (Krol et al. 1990) and murine lymphoma B and T cell lines (Mittelman et al. 1991, 1994; Korenstein et al. 1994). These fluctuations consist of local, reversible fast displacements of the cell membrane (frequency range, 0.3-30 Hz), which mostly reflect its bending deformability.
CMFs in human erythrocytes were shown to depend on MgATP. MgATP was found to reconstitute CMFs in RBC ghosts and RBC skeletons to the level observed in intact RBCs, whereas non-hydrolysable ATP analogues (5′-adenylyl imidodiphosphate (AMP-PNP), ATPγS) were unable to do so (Levin & Korenstein, 1991; Tuvia et al. 1998). Those studies were not by themselves proof that CMFs are driven by chemical energy, since it may be argued that MgATP leads to changes in the passive mechanical properties of the membrane-skeleton complex (e.g. through phosphorylation of skeleton proteins). These changes would be revealed by modulation of CMF levels, while still being driven by thermal energy, only. Recently, we have shown that CMFs are driven by metabolic energy, in addition to thermal energy (Tuvia et al. 1997). This metabolic driving force was shown to be associated with actin ATPase (Tuvia et al. 1998). These findings suggest that CMFs are determined by both passive and active components, contradicting the view held for the past two decades that CMFs are driven solely by thermal energy (Brochard & Lennon, 1975; Fricke & Sackmann, 1984; Strey et al. 1995).
Human erythrocytes have been shown to contain several types of receptor in their plasma membrane including receptors for insulin (Pelikanova et al. 1989) and β-adrenergic agonists (Tsukamoto & Sonenberg, 1979; Sager & Jacobsen, 1985). The RBC possesses 600-6000 copies of the β-adrenergic receptor (Sager & Jacobsen, 1985). The possibility that membrane receptors are involved in altering the mechanical properties of the RBC membrane have been pursued to a limited extent. Thus, it was reported that erythrocyte filterability, reflecting the overall cell deformability, was decreased upon addition of prostaglandin E2 (10−10-10−12 M) (Rasmussen et al. 1975; Oonishi et al. 1997), adrenaline (epinephrine; 10−9 M) (Allen & Rasmussen, 1971), and parathyroid hormone (Bogin et al. 1986). However, prostaglandin E1 and adrenaline (10−10 M) were shown to improve RBC filterability (Oonishi et al. 1997). These effects and their underlying mechanisms are still unresolved. Recently, we demonstrated an increase in CMFs and cell filterability following the exposure of RBCs to atrial natriuretic peptide which was found to exert its effect via a cGMP-dependent pathway (Zamir et al. 1992). A direct correlation between CMF amplitude and RBC filterability was found to exist both in erythrocytes (Tuvia et al. 1992a; Zamir et al. 1992) and in lymphoid cell lines possessing a different metastatic potential (Mittelman et al. 1994).
The results obtained so far suggest that the deformability of RBCs can be modulated by ligand-receptor interactions of membrane receptors. The present study demonstrates that β-adrenergic agonists elevate CMFs and filterability of RBCs. These effects are shown to be transduced via a cAMP-dependent pathway.
METHODS
Preparation of RBCs for measurement of cell membrane fluctuations
Fresh human RBCs were obtained immediately before each experiment from five healthy donors, who gave informed consent, by finger pricking. Fifty to 100 μl of blood were diluted 50-fold in a PBS solution containing 130 mM NaCl, 20 mM potassium-sodium phosphate buffer, 10 mM glucose and 1 mg ml−1 bovine serum albumin (BSA); pH 7.4. The inclusion of 1 mg ml−1 BSA in the PBS solution was essential for preserving the normal biconcave shape of the RBCs. RBCs were washed twice with PBS by centrifugation (1500 r.p.m., 2 min at 20°C), the buffy coat was removed and the amount of RBCs, in the final suspension, was adjusted to 5 × 10⁶ cells ml−1. For long-term studies, penicillin (50 units ml−1) and streptomycin (50 μg ml−1) were added to the PBS solution. A RBC suspension in PBS was introduced into the experimental chamber so that the volume ratio of cells : solution in the chamber was 1 : 3000. The experimental chamber consisted of two coverglasses separated by a distance of 0.2 mm. Incubation of the RBCs in the chamber for 20-30 min, at 22-24°C, allowed them to adhere firmly to the glass substratum. In some experiments, the glass was coated with 5-20 μg ml−1 poly-L-lysine (molecular mass, 65.5 kDa); in these cases we confirmed, by phase contrast microscopic observation, that the biconcave shape of the RBCs did not change. To examine the effects of the various substances on CMFs, the experimental chamber containing RBCs attached to the coverglass was perfused with the appropriate solutions and further incubated with the solutions for 5-60 min (typically 25 min), at 37°C. In one set of experiments the RBCs were incubated at 24°C.
Deoxygenated RBCs were obtained by bubbling nitrogen gas through a suspension of RBCs for 5-25 min in an airtight closed box. The suspension was then placed in the experimental chamber which was sealed by paraffin while still in the closed box. The state of deoxygenation of the erythrocytes in the closed chamber was monitored by measuring absorption spectral changes in the 450-650 nm range in a control chamber, prepared in the same box in parallel with the experimental chamber. The state of deoxygenation in the sealed chambers was found to be maintained for 1-1.5 h.
Measurement of membrane fluctuations by point dark field microscopy
The measurement of local mechanical fluctuations of the cell membrane was carried out on RBCs by an optical method based on point dark field microscopy (Krol et al. 1990; Tuvia et al. 1998). Using cells attached to a coverglass, a small area (0.25-1 μm2) at the edge of the cell was illuminated and cell membrane displacements were recorded by monitoring the time-dependent changes of light reflection and scattering employing an experimental set-up described elsewhere (Krol et al. 1990; Tuvia et al. 1998). The fluctuation of the light intensity depends on the changes of the membrane area moving in and out of the focused light spot near the edge of the cell. The time-dependent changes of the scattered light intensity in the frequency range 0.3-35 Hz (δI) were normalized via division by the time-independent scattered light intensity (I). The analysis of the time series of scattered light intensity was carried out in terms of normalized maximal amplitude of the scattered light intensity (δImax/I), expressed as a percentage. The noise level of the experimental set-up was ∼1 %. A linear dependence between the maximal CMF amplitude and the displacement of the cell edge was previously shown to exist over distances as great as 300 nm (Krol et al. 1990). The mean value of the normalized maximal amplitude was determined from recordings of CMFs that lasted between 2 and 10 min, at 24-28°C, when steady-state conditions (constant CMF level) were shown to exist under our experimental conditions. In special cases (e.g. determination of the temporal effect of adrenaline, or measurement of CMFs in RBCs that had undergone fast ATP depletion) the time of recording was restricted to 0.5 min. In each blood sample the level of CMFs was measured in 10-15 biconcave RBCs. In each cell the measurements of CMFs were performed at four equidistant points along the periphery of the cell. The mean value of maximal amplitude was calculated for each cell and was then averaged over 10-15 cells. The coefficient of variation (s.d./mean; expressed as a percentage) of the CMF level in a single blood sample was ∼10 %. The coefficient of variation of CMF amplitude in different blood samples was ∼15-20 %.
An additional, quantitative, examination of CMF recordings was performed by amplitude distribution analysis. The scattering from each surface area was typically recorded for 55 or 110 s (sampling rate of 75 points s−1). These tracings were analysed by grouping the amplitudes according to their size and counting the normalized frequency of appearance of each amplitude value in the recording (the relative number of events belonging to a chosen amplitude group divided by the total number of events in the recording). Further, a plot of the relative number of events versus corresponding values of fluctuations yielded Gaussian amplitude distributions, which are presented in Fig. 2. The commonly used characteristic of the amplitude distribution is the half-width of the distribution curve, which is related to the fluctuation energy. Such a relationship states that the half-width increases when the fluctuation energy increases.
Figure 2. Effect of adrenaline on the amplitude distribution of CMFs.
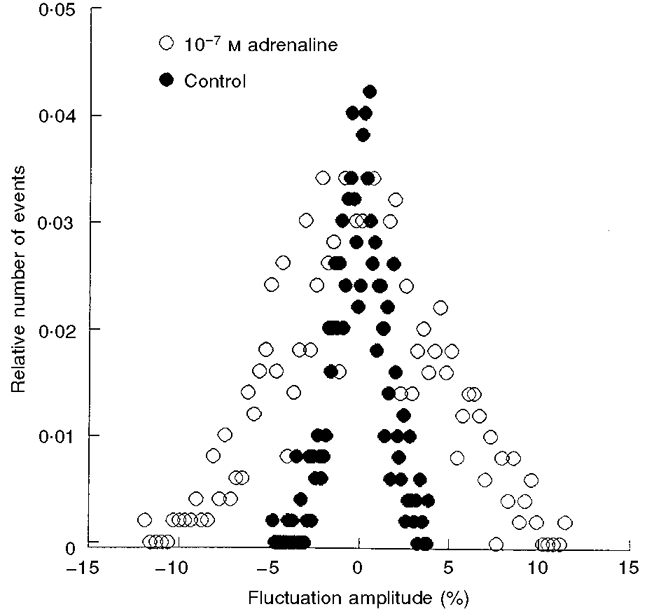
RBCs were incubated in the presence of 10−7 M adrenaline (○) and in its absence (Control; •) for 20 min, at 37 °C. The amplitude distributions of control and exposed RBCs are an average of 16 and 21 time series of CMFs in different RBCs, respectively.
The power spectra of CMFs were calculated by fast Fourier transformation (FFT) from up to 10 repeated recordings of CMFs. The recordings were performed employing high and low frequency bandpass of 0.3 and 35 Hz, respectively. Typical measurements consisted of 4096 or 8192 sampled points at a sampling rate of 75 points s−1.
Depletion of ATP in RBCs
The addition of glycolytic substrates, in the presence of iodoacetamide, speeds up ATP depletion because the substrate consumes ATP, while glycolytic ATP production is blocked (Lew & Ferreira, 1978). Thus, irreversible depletion of ATP in RBCs was carried out by incubating RBCs for 1 h at 37°C in PBS in the presence of 10 mM inosine and 5 mM iodoacetamide, in the absence of glucose. These incubation conditions reduce the intracellular ATP concentration to a level of 1-5 μM in less than 1 h (Lew & Garcia-Sancho, 1989). The low ATP level in inosine- iodoacetamide-treated cells is maintained by rapid turnover (at about 200 μmol ATP per litre of cells per hour) for many hours, probably sustained by the large reserves of 2,3-diphosphoglycerate within the cells (Glynn & Lew, 1970). The procedure for irreversible ATP depletion is known to also lead to a shape change in the RBC population, resulting in the appearance of echinocytes and stomatocytes in addition to normal discocytes. However, the appearance of these shape changes is severalfold slower than the ATP-depletion process (Ferrell & Huestis, 1984; Backman, 1986). Under our conditions of fast irreversible ATP depletion, most of the RBCs kept their biconcave discocyte shape during measurement of CMFs. In order to compare the effect of ATP depletion on CMF amplitudes, without having to take the change in shape of RBCs into consideration, the measurement of CMFs was restricted to RBCs possessing a normal discoid shape and diameter of 8.3 ± 0.4 μm (mean ±s.d.).
Preparation of RBCs for filterability measurements
Blood was obtained 1-2 h before the experiment from two healthy donors. Fifteen millilitres of venous blood were collected in a test-tube containing 1.5 ml 50 mM EDTA. The blood was centrifuged at 3000 r.p.m. for 10 min. The plasma, buffy coat and upper layer of RBCs were removed. The RBCs in the remaining pellet were washed twice with PBS and then suspended in PBS to yield a final haematocrit of 10 % ((1.1 ± 0.05) × 109 ml−3). RBC suspensions in PBS were shaken continuously at 18-20°C. Before filterability measurements the RBCs were incubated for 5, 15 or 20 min at 37°C, with constant shaking.
Deoxygenation of the RBC suspension (10 % haematocrit) was carried out by bubbling pure nitrogen gas through a 1.5 ml RBC suspension enclosed in an airtight closed box. Deoxygenated PBS solution was prepared by the same procedure.
Measurement of RBC filterability
Measurement of RBC filterability was carried out by recording the time taken for a constant volume (0.15 ml) of a 10 % RBC suspension in PBS to pass through the 5 μm pores of a polycarbonate filter (12 μm thick, Nucleopore; Costar Corporation, Cambridge, MA, USA) under a driving pressure of 100 or 250 mmH2O. All solutions were freshly prepared and filtered through 0.2 μm Millipore filters. The Nucleopore filters were positioned on the plastic support of a standard Pop-Top camera (BioLab). The free area of filter (Seffective) contained ∼1.8 × 10⁵ pores. The camera was connected to a partially transparent glass tube with two pairs of light transparent slits (0.1 mm in width) illuminated by a light beam. Each pair was positioned on each side of the light non-transparent tube so that the light beam had to pass through each pair of slits in order to reach the photodetector. The upper pair of slits was 12 mm above the lower pair. PBS or deoxygenated PBS (0.4 ml) was layered on top of a 0.2 ml RBC suspension (10 % haematocrit). The filterability of the RBC suspension was detected by the moving meniscus of the PBS successively decreasing the intensity of transmitted light, first at the upper pair of slits and then at the lower pair. The flow that took place when the meniscus of PBS moved between the upper and lower slits was equivalent to the passage of 0.15 ml through the filter. The light intensity changes were measured by a photocell, AC amplified and recorded (Grass Instrument Co.). Thus, the time lapse between the two peaks of the photocurrent was inversely proportional to the volume flow rate of cell suspension (Vc) and PBS (Vs). The time resolution of the set-up was 5 ms.
The measuring procedure was initiated by washing the Nucleopore filter with PBS until a constant time lapse of PBS passage between the two slit pairs (ts) was obtained. Then the RBC suspension was introduced into the camera and PBS was layered on top of the suspension. For filterability measurements of deoxygenated suspensions of RBCs, the filtration set-up was flushed with nitrogen gas. A RBC suspension of 0.15 ml was filtered and the time lapse of cell suspension filtration (tc) was measured. Filterability was evaluated as Vc/Vs. Since the volumes of the different samples being filtered were identical (0.15 ml), filterability was equal to the ratio of the filtration time of the solution devoid of RBCs (ts) to the filtration time of the RBC suspension (tc). The filtration times of 0.8-0.95 s at driving pressures of 250 mmH2O which we obtained for the RBC suspension (10 % haematocrit) were similar to values previously obtained by Hanss (1983). At a driving pressure of 100 mmH2O the filtration time was 2.5-fold larger than that at 250 mmH2O, suggesting a linear pressure-flow relationship for filtration of the RBC suspension over this pressure range. The averaged transit time of one cell through a single pore in the filter (ttr) was calculated: ttr =[tc - ts(1 - H)]/(N/n), where H is the haematocrit, and N is the number of RBCs filtered through n pores in the filter. The haematocrit was measured by centrifugation (10000 g, 10 min) in an HC 100 Microfuge (Heraeus-Christ). The number of the cells in the filtered volume and the number of the pores in Seffective were counted using a microscope. All the filtration measurements were performed at 24-28°C.
Estimation of RBC diameter and volume
The diameter of biconcave discocytes was measured by phase-contrast microscopy at high magnification (objective, × 100; NA, 1.3). The diameter of 50-100 discocyte RBCs was measured following each type of treatment. The total cell volume in a RBC suspension was estimated by haematocrit determination. The mean cell volume of RBCs was calculated by dividing the total volume of packed cells by the number of RBCs in this volume.
Differences between mean values were evaluated by Student's two-sided t test. A value of P < 0.05 was considered to be significant.
RESULTS
Effect of adrenaline on cell membrane fluctuations
RBCs were preincubated for 20 min with adrenaline, in the concentration range 10−11-10−5 M, at 24 or 37°C. The incubation with adrenaline, at either temperature, raised the level of maximal CMF amplitude by ∼20-45 % (Fig. 1). Preincubation of RBCs with 10−7 M adrenaline at 37°C led to higher levels of CMFs than those at 24°C, yielding maximal amplitudes of 21.2 ± 0.3 % (n = 49; mean ±s.e.m.; n represents the number of studied RBCs) and 16.9 ± 0.5 % (n = 39), respectively. At each temperature five blood samples from two donors were measured. The coefficient of variation for CMFs at 37°C was 10 %, 1.5- to 2.0-fold lower than that at 24°C. Control experiments, carried out in the absence of adrenaline, revealed no significant dependence on temperature, yielding CMF levels of 14.5 ± 0.3 % (n = 27) and 14.6 ± 0.4 % (n = 14) at 37 and 24°C, respectively. The effect of adrenaline was reversible, i.e. washout of adrenaline resulted in a decline of the CMFs to the basic level obtained prior to incubation with adrenaline. The dose-response curve for the effect of adrenaline on CMFs at 37°C yielded an EC50 value (the concentration that produced 50 % of the maximal effect) of ∼5 × 10⁻⁹ M adrenaline.
Figure 1. Dependence of CMF amplitude on adrenaline concentration at 24 and 37 °C.
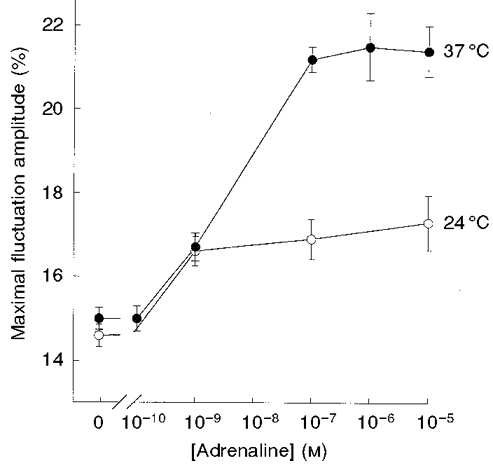
RBCs were incubated with adrenaline for 30 min at 24 °C (○) and 37 °C (•). Data are given in terms of the time-averaged maximal peak-to-peak amplitude of CMFs in the frequency range 0.3-35 Hz. The amplitudes are given by δImax/I (%; means ±s.e.m.); see Methods. Each independent experiment involved measurements of 15-25 RBCs.
The amplitude distributions of CMFs in control and adrenaline-treated RBCs are shown in Fig. 2. The amplitude distribution describes the number of times each amplitude appears in the time-dependent intensity of light scattering, recorded for a certain time. The area under this Gaussian distribution of amplitudes is proportional to the energy content of the CMF. From Fig. 2 it can be seen that the energy level of RBC fluctuations, in the presence of 10−7 M adrenaline, was higher than that in its absence. The mean half-width of the amplitude distribution of CMFs in control RBCs was 6.0 ± 0.2 % (n = 14), increasing to 11.0 ± 0.6 % (n = 16) following exposure to adrenaline.
Examination of the power spectrum of CMFs, following preincubation with adrenaline, revealed a 2.4- to 2.0-fold increase in the squared CMF amplitude over the frequency range 0.3-3 Hz compared with that of control RBCs (Fig. 3). This difference was diminished towards higher frequencies and vanished at frequencies higher than 3 Hz.
Figure 3. Effect of adrenaline on the power spectrum of CMFs.
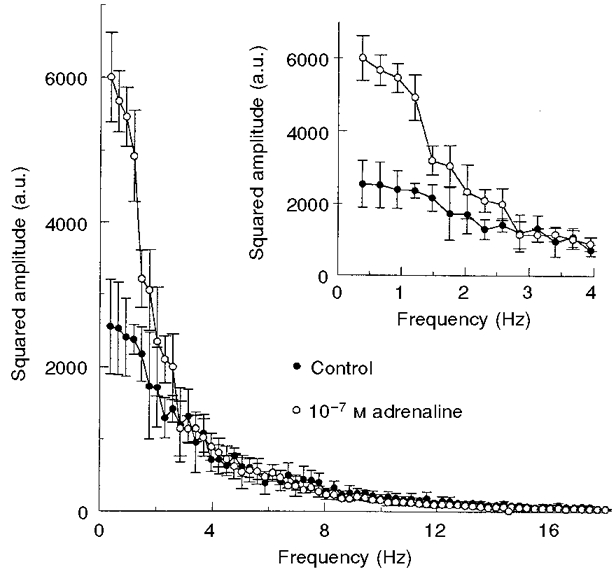
•, control RBCs, mean of 16 spectra; ○, RBCs exposed to 10−7 M adrenaline, mean of 21 spectra. The frequency resolution of the power spectra is 0.3 Hz. Inset: power spectra in the frequency range 0.3-4.0 Hz. Error bars represent the s.d. of each data point. All incubations were carried out for 20 min, at 37 °C. a.u., arbitrary units.
Effects of isoproterenol, propranolol and methoxamine on cell membrane fluctuations
RBCs were preincubated for 15 min at 37°C with isoproterenol (β-agonist) over the concentration range 10−5-10−13 M, with propranolol (β-antagonist) over the concentration range 10−7-10−12 M and with methoxamine (α-agonist) over the concentration range 10−5-10−11 M. Propranolol and methoxamine by themselves had no effect on CMFs. Thus, preincubation with 10−8 and 10−6 M methoxamine yielded CMFs of 15.0 ± 0.4 % (n = 18) and 15.2 ± 0.4 % (n = 20), respectively. However, 10−9 M isoproterenol caused an increase in CMFs from the basic level of 14.7 ± 0.01 % (n = 124) to a value of 18.8 ± 0.3 % (n = 30). The dose-response dependence of isoproterenol yielded an EC50 of 1 × 10⁻¹¹ M (Fig. 4). It should be noted that preincubation of RBCs with high concentrations of isoproterenol (10−7-10−5 M) resulted in a pronounced decline of CMFs.
Figure 4. Dependence of CMF amplitude on isoproterenol concentration in the absence and presence of propranolol.
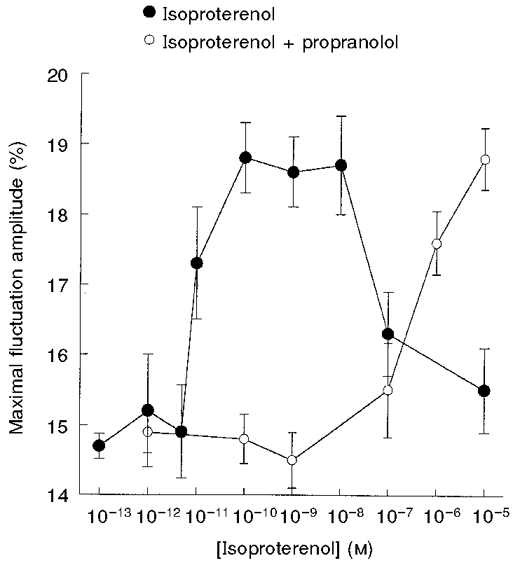
RBCs were incubated with isoproterenol in the absence (•) and presence (○) of 10−9 M propranolol for 20 min, at 37 °C. Data are given in terms of the maximal CMF in the frequency range 0.3-35 Hz. The amplitudes are given by δImax/I (%; means ±s.e.m.) Each independent experiment involved measurements of 15-25 RBCs.
The antagonistic effect of propranolol on the concentration-dependent stimulatory effect of isoproterenol is shown in Fig. 4. Incubation of RBCs with increasing concentrations of isoproterenol, in the presence of 10−9 M propranolol, caused a shift of the EC50 for CMF stimulation by isoproterenol from 10−11 to 10−6 M, without affecting the maximal CMF level.
Deoxygenation of RBCs was found to attenuate CMFs (Fig. 5). In order to examine whether isoproterenol could elevate CMFs in deoxygenated RBCs, RBCs that had undergone deoxygenation were incubated with 10−9 M isoproterenol for 20 min, at 37°C. The level of CMFs in deoxygenated RBCs exposed to isoproterenol increased from 10.3 ± 0.3 % (n = 105) in unexposed control RBCs to 16.0 ± 0.2 % (n = 18) in exposed RBCs (Fig. 5). The value of CMFs in deoxygenated RBCs exposed to isoproterenol was higher (P < 0.005) than that in oxygenated RBCs not exposed to isoproterenol. However, this level was still smaller than the level of 18.8 ± 0.3 % (n = 30) achieved upon exposure of oxygenated RBCs to isoproterenol. The relative isoproterenol-induced elevation of CMFs was 2.2-fold higher in deoxygenated RBCs than that in oxygenated RBCs.
Figure 5. Effect of isoproterenol on CMF amplitudes in oxygenated and deoxygenated RBCs.
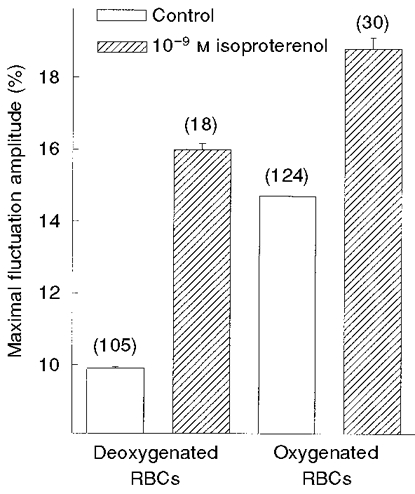
RBCs were incubated in the absence (Control; □) and presence ( ) of 10−9 M isoproterenol for 20 min, at 37 °C. The amplitudes are given by δImax/I (%; means ±s.e.m.), where n (given in parentheses) is the number of RBCs tested.
The influence of cAMP on cell membrane fluctuations
To elucidate whether the effect of adrenaline was transduced via elevation of intracellular cAMP, we examined the effect of 8-bromo-cAMP (10−4 M) on CMFs (Fig. 6). The exposure of RBCs to this membrane-permeant analogue of cAMP led to an increase in membrane fluctuations from 13.5 ± 0.09 % (n = 140) to 19.0 ± 0.4 % (n = 37). This finding supports the view that the effect of adrenaline on CMFs is transduced via a cAMP-dependent pathway.
Figure 6. Effect of 8-bromo-cAMP and adrenaline on CMF amplitudes in normal and ATP-depleted RBCs.
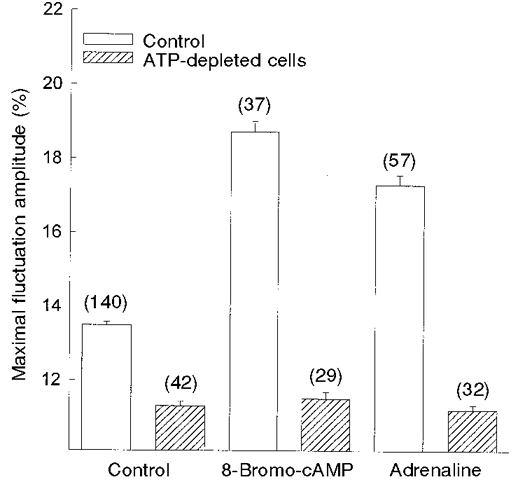
Normal (□) and ATP-depleted ( ) RBCs were incubated for 20 min with 10−4 M 8-bromo-cAMP and 10−7 M adrenaline, at 37 °C. The amplitudes are given by δImax/I (%; means ±s.e.m.), where n (given in parentheses) is the number of RBCs tested.
An alternative approach to examine the effect of the elevation of intracellular cAMP on CMFs involved the application of pentoxifylline. This specific inhibitor of 3′,5′-adenosine monophosphate diesterase competes with adenylate cyclase for 3′,5′-adenosine monophosphate, a precursor of cAMP. Thus, CMFs of RBCs were examined following 15 min preincubation with pentoxifylline, in the concentration range 1 × 10⁻¹²-5 × 10⁻⁵ M, at 37°C (Fig. 7). It can be seen that at pentoxifylline concentrations equal to or higher than 10−8 M, the level of CMFs increased by about 35 %, compared with that in control RBCs.
Figure 7. Dependence of CMF amplitude on the concentration of pentoxifylline.
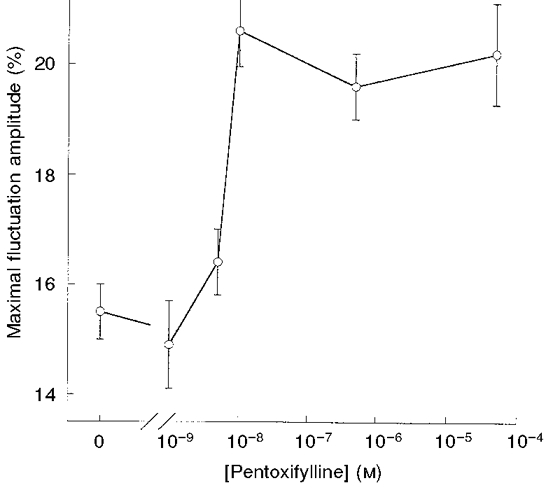
RBCs were incubated with pentoxifylline for 15 min at 37 °C. Data are given in terms of the maximal CMF in the frequency range 0.3-35 Hz. The amplitudes are given by δImax/I (%; means ±s.e.m.) Each independent experiment involved measurements of 15-25 RBCs.
Temporal effect of adrenaline on cell membrane fluctuations
To examine the time-dependent activation of CMFs by adrenaline, RBCs were incubated in the presence of 10−7 M adrenaline, for 5-60 min, at 37°C. The maximal CMF amplitudes increased as a function of the incubation time, reaching a 28 % higher level after 20 min compared with the non-exposed control (Fig. 8). Further lengthening of the incubation period led to a decrease in the CMF level; the basic initial level was reached after 60 min.
Figure 8. Time dependence of CMF amplitude following exposure to adrenaline in the absence and presence of IBMX.
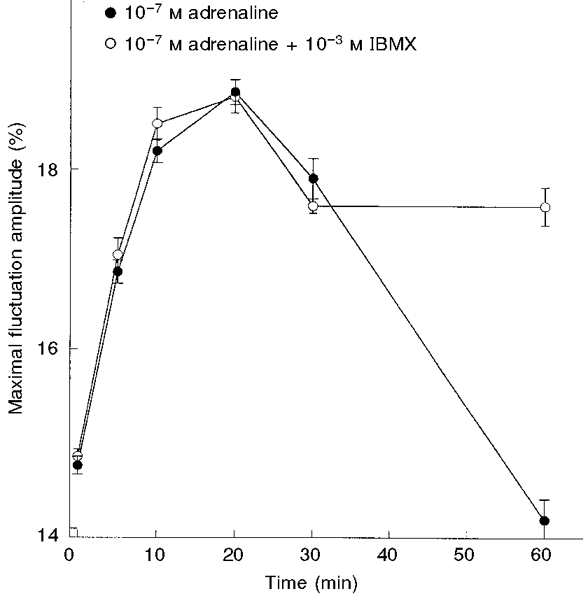
RBCs were incubated with 10−7 M adrenaline in the absence (•) and presence (○) of 10−3 M IBMX (for different time periods) at 37 °C. The amplitudes are given by δImax/I (%; means ±s.e.m.) Each independent experiment involved measurements of 15-25 RBCs.
In order to explore whether this decrease in CMFs was due to the activation of intracellular phosphodiesterase, which converts cAMP into 5′-AMP, we studied the effect of adrenaline on CMFs in the presence of 1 mM 3-isobutyl-1-methylxanthine (IBMX), a known phosphodiesterase inhibitor. The time course of adrenaline activation during the first 30 min was the same both in the presence and absence of IBMX. However, after 60 min preincubation, the level of CMFs remained elevated by 75 % compared with that of RBCs exposed to adrenaline for the same time period, in the absence of IBMX (Fig. 8).
Effect of adrenaline and 8-bromo-cAMP on membrane fluctuations in ATP-depleted RBCs
In order to examine the involvement of ATP in the pathway underlying the adrenaline-induced elevation of CMFs, we investigated the effect of adrenaline on CMFs in ATP-depleted RBCs. Since the shape of RBCs may change following depletion of intracellular ATP, we examined only RBCs possessing a discoid shape. The exposure of ATP-depleted RBCs to adrenaline did not alter the CMF levels from those observed in unexposed ATP-depleted RBCs, yielding maximal CMF amplitudes of 11.3 ± 0.1 % (n = 32) and 11.2 ± 0.1 % (n = 42), respectively. The CMF amplitudes in ATP-depleted RBCs were 15-20 % lower than those observed in normal RBCs, and 35 % lower than those in adrenaline-stimulated normal RBCs (Fig. 6).
Since ATP is a substrate both for cAMP synthesis and phosphorylation by cAMP-dependent kinases, we explored the direct effect of cAMP on CMFs in ATP-depleted RBCs. ATP-depleted RBCs possessed similar CMF levels of 11.3 ± 0.1 % (n = 42) and 11.7 ± 0.2 % (n = 29), in the presence and absence of 10−4 M 8-bromo-cAMP, respectively (Fig. 6). These CMFs were 15 % lower than those observed in normal RBCs. A 65 % decrease in CMF values was observed when normal control RBCs, exposed to 8-bromo-cAMP, were compared with ATP-depleted RBCs exposed to the same cyclic nucleotide. These results were similar to those obtained with adrenaline (Fig. 6).
Effect of HA1004 on adrenaline-induced elevation of cell membrane fluctuations
A maximal CMF level of 19.1 ± 0.2 % (n = 16) was obtained in RBCs following exposure to 10−7 M adrenaline. N-(2-guanidinoethyl)-5-isoquinoline-sulfamide (HA1004) is an inhibitor of protein kinase A (PKA) (Hidaka et al. 1984). To examine the consequences of PKA inhibition on CMFs, RBCs were incubated with 50 μM HA1004 in a Tris-HCl-buffered KCl solution (130 mM KCl, 10 mM glucose, 20 mM Tris-HCl, pH 7.4, 1 mg ml−1 BSA) and the time-dependent level of CMFs was recorded. We observed a time-dependent effect of the inhibitor on the level of CMFs. After 15 min there was a decrease from 16.8 ± 0.7 to 13.5 ± 0.5 %. This low level was maintained for 20 min only and after 35-40 min the level of CMFs was restored to its initial value. The time-dependent modulation of CMFs was very sensitive to the temperature at which the experiment was carried out, in the range 24-31°C. Thus, in the six time-dependent experiments that were performed, the higher the experimental temperature the faster the effect of HA1004 on CMFs. However, in all experiments the same extent of attenuation of CMFs was attained.
Effect of adrenaline on RBC filterability
The filtration times of the control RBC suspension were 2.0 and 0.8 s at driving pressures of 100 and 250 mmH2O, respectively, indicating a linear dependence of flow on the driving pressure. The calculated transit times of a single RBC through a 5 μm pore were 1.0 and 0.4 ms when filtered at driving pressures of 100 and 250 mmH2O, respectively. Following 15 or 20 min preincubation in the presence of adrenaline (10−9, 10−7 and 10−5 M), at 37°C, the filterability (ts/tc) of the RBC suspensions was measured at a driving pressure of 250 mmH2O. For example, exposure to 10−5 M adrenaline increased filterability from a value of 0.490 ± 0.008 to a value of 0.545 ± 0.010 (mean ±s.d.; P < 0.005; Fig. 9). However, shorter preincubation times of 2 and 5 min, at 37°C, did not reveal any effect on RBC filterability. It can be seen from Fig. 9 that exposure of RBCs to adrenaline resulted in a concentration-dependent increase in RBC filterability. In parallel, elevated levels of CMFs were observed upon increase of adrenaline concentration. A linear relationship was obtained between the concentration-dependent stimulation of CMFs by adrenaline and filterability of RBCs (Fig. 9), under the same exposure conditions.
Figure 9. Relationship between CMF amplitude and filterability in adrenaline-treated RBCs.
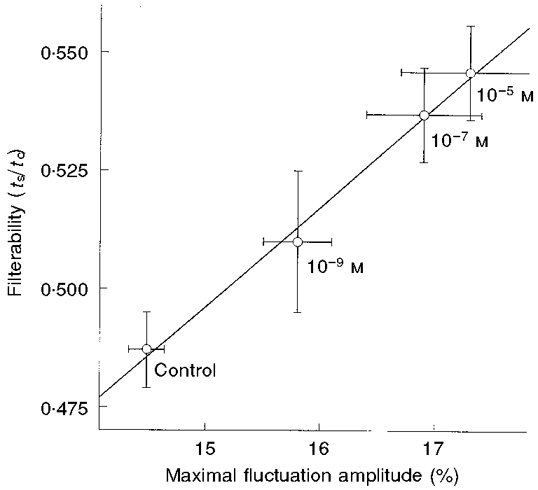
Filterability is given in terms of ts/tc and expressed as means ±s.d.; n is the number of experiments: Control, n = 71; 10−9 M adrenaline, n = 19; 10−7 M adrenaline, n = 31; 10−5 M adrenaline, n = 13. The maximal amplitudes of CMF are given by δImax/I (%; means ±s.d.), where n is the number of RBCs tested: control, n = 51; 10−9 M adrenaline, n = 23; 10−7 M adrenaline, n = 27; 10−5 M adrenaline, n = 24. All incubations were carried out for 20 min, at 37 °C.
The filterability of the deoxygenated RBC suspension (10 % haematocrit), under a driving pressure of 250 mmH2O, was 0.320 ± 0.020 (n = 6 experiments; mean ±s.d.). The filterability of the oxygenated control RBC suspension was 0.480 ± 0.040 (n = 7). Thus, deoxygenation led to a 33 % decrease in RBC filterability (P < 0.005). The biconcave discoid shape and the large diameter of the deoxygenated RBCs were not altered by the deoxygenation procedure.
The effect of β-agonists and cAMP on RBC diameter and volume
The large diameter of discocyte RBCs did not change following exposure to adrenaline; the RBC diameter of 8.2 ± 0.7 μm (mean ±s.d.) (n = 60) obtained following incubation with 10−7 M adrenaline, at 37°C, did not differ from the value of 8.1 ± 0.5 μm (n = 50) observed in control cells. The diameters of biconcave discocytes measured in the presence of isoproterenol (10−5 M), propranolol (10−7 M), pentoxiphylline (5 × 10⁻⁵ M) and 8-bromo-cAMP (1 mM) were not altered compared with those of control cells. In addition, the value of 8.0 ± 0.4 μm obtained for the diameter of ATP-depleted discocytes after fast irreversible ATP depletion (and representing 70-80 % of the RBC population) did not differ from that of control discocytes.
In an attempt to examine possible cell volume alteration we examined changes in the haematocrit following exposure of erythrocytes to adrenaline and 8-bromo-cAMP. As a control a cell suspension in PBS at 30.0 ± 1.2 % haematocrit was used. Based on the RBC count, a mean cell volume of 91 ± 5 μm3 (n = 7) was calculated for control discocytes. Preincubation for 30 min with adrenaline (10−7 and 10−5 M) at 37°C resulted in a haematocrit of 28.9 ± 1.9 % (n = 5) and 29.9 ± 0.5 % (n = 5), respectively. Thus, the corresponding mean cellular volumes of 89 ± 5.9 μm3 (n = 6) and 92 ± 6.6 μm3(n = 5) did not differ from that of control. Similarly, 30 min preincubation with 8-bromo-cAMP (10−4 or 10−3 M), at 37°C, did not alter the RBC haematocrit, yielding values of 30.4 ± 1.1 % (n = 5) and 30.1 ± 1.4 % (n = 5), respectively. Thus, the respective mean cellular volumes of 93 ± 8.1 μm3 (n = 5) and 92 ± 6.9 μm3 (n = 5) did not differ from that of control.
DISCUSSION
β-Adrenergic agonists elevate cell membrane fluctuations and filterability of red blood cells
Adrenaline, at physiological concentrations, is able to elevate CMF amplitude, in the frequency range 0.3-3.0 Hz, by up to 45 % (Figs 1 and 3). This rise in CMFs is also reflected in the 35 % increase in the half-width of the amplitude distribution (Fig. 2). In order to determine whether the effect of adrenaline is transduced through α- or β-adrenergic receptors, we examined the effect of methoxamine, an α-agonist, on CMFs. The ineffectiveness of methoxamine (10−11-10−5 M) to alter the level of CMFs suggests that α-adrenergic receptors are not involved in the regulation of CMFs. Isoproterenol, a β-adrenergic agonist, had stimulatory effects on CMFs, similar to those induced by adrenaline. However, isoproterenol exerted its effects at lower concentrations than adrenaline (Fig. 4). The analysis of the dose-response curves of these two agonists yielded apparent Kd values of 5 × 10⁻⁹ and 1 × 10⁻¹¹ M for adrenaline and isoproterenol, respectively (based on the assumption that EC50=Kd, i.e. there are no spare receptors). Propranolol, a β-antagonist, had no effect on CMFs by itself, but had an inhibitory effect on the action of isoproterenol on CMFs. Analysis of the effect of isoproterenol on CMFs, in the presence of 10−9 M propranolol, revealed a shift of the apparent Kd of isoproterenol to 3 × 10⁻⁷ M (Fig. 4). The calculated (Gille et al. 1985) apparent Kd of propranolol from this shift yields a value of 10−13 M. Thus, the relative affinities of these adrenergic agonists and antagonists are of the order propranolol > isoproterenol > adrenaline. This order of potency is similar to those obtained from binding studies (Sager, 1982) and for the activation of catecholamine-sensitive protein kinase measured in RBC ghosts (Tsukamoto & Sonenberg, 1979). However, the apparent Kd values derived from the EC50 measurements in our study and the concentration of 10−9 M adrenaline employed to induce filterability changes by Allen & Rasmussen (1971) are three orders of magnitude lower than those obtained from binding studies based on cell suspensions (Sager, 1982). It is plausible to assume that the full effects of agonists on fluctuation amplitude could be generated by occupancy of only a small proportion of the β-receptors. Alternatively, it may be speculated that our apparent Kd values (indirectly evaluated from CMF measurements) reflect the existence of ‘super-high’ affinity binding sites for β-agonists, whereas the Kd values reported by the binding study of Sager (1982) reflect a lower affinity site for these ligands.
The elevation of CMFs by β-adrenergic agonists was accompanied by an increase in RBC filterability through narrow thin pores. It should be pointed out that the adrenergic-induced elevation of CMFs was 1.6-fold higher than the corresponding relative elevation of filterability. A similar pattern emerges from measurements of CMFs and filterability of deoxygenated RBCs. The attenuation of CMFs in deoxygenated RBCs was 1.2-fold larger than the respective decrease in RBC filterability. These findings show that CMF measurements are more sensitive to the alteration of RBC deformability than filterability studies.
The increase in RBC filterability can be ascribed to three physical properties (Chien, 1987): (i) surface area to volume ratio; (ii) intracellular viscosity of the mean corpuscular haemoglobin concentration; and (iii) viscoelastic properties of the membrane-skeleton complex. Since the shape and volume of RBCs were found to be unaltered by the adrenergic agonists, changes in the physical parameters ((i) and (ii)) cannot account for the observed increased filterability. Thus, one may attribute the elevated filterability to an adrenaline-induced change in the viscoelastic properties of the membrane-skeleton complex. The driving pressure of 250 or 100 mmH2O applied in the present study is larger by two to three orders of magnitude than the pressure applied in aspiration studies (Evans, 1989). Thus, the respective calculated transit times of 0.4 and 1.0 ms for passage of RBCs through a 5 μm pore are more than two orders of magnitude smaller than the characteristic time constant for the force-free recovery of the deformed RBC (Evans, 1989). We suggest that the major factor that determines filterability of RBCs is the bending and shearing resistance of the membrane-skeleton complex to the externally applied force. These factors can play an important role in entry and passage stages. Upon entrance to the pore, the RBC undergoes pressure-induced strong deformations, yielding a total change of shape from a discocyte to a parachute-like shape (Bagge et al. 1980; Gaehtgens et al. 1980). Once in the pore, the more rigid RBC (possessing larger bending and shearing moduli) will exert a higher normally directed force on the wall of the pore than the less rigid RBC. Thus, the friction forces will be larger for the more rigid RBC. This, in turn, will increase the passage time for cells possessing a larger bending modulus. Hence, the adrenergic-induced change in filterability may originate from the modulation of the viscoelastic parameters of the RBC membrane-skeleton complex.
Elevation of cell membrane fluctuations by β-agonists is mediated via cAMP
The interaction of agonists with β-receptors results in the activation of adenylate cyclase and increased conversion of ATP into cAMP, which is the major second messenger of β-receptor activation. In order to validate the proposal that the elevation of CMFs by β-agonists is transduced via raising intracellular [cAMP], we examined the direct effect of 8-bromo-cAMP, a membrane-permeant cAMP analogue, on CMFs. Indeed, 8-bromo-cAMP was able to elevate the CMF level by ∼40 % (Fig. 6).
It was shown previously that the basal concentration of cAMP was increased by 2.5- to 20-fold following activation of β-receptors in RBCs (Sager, 1982; Sager & Jacobsen, 1985; Cerione et al. 1985; Matsuura et al. 1993). The stimulatory effect of β-agonists seems to follow the intracellular concentration of cAMP. The increase in CMFs within the first 15-20 min of exposure to adrenaline corresponds to the elevation of intracellular cAMP due to activation of adenylate cyclase (Matsuura et al. 1993). However, after a period of 60 min, the level of CMFs declines to the basal level probably due to the decrease in intracellular [cAMP]. This decrease in [cAMP] may be attributed, in part, to cAMP hydrolysis by phosphodiesterase. In order to verify this suggestion we examined the time course of CMF stimulation by adrenaline in the presence of IBMX, a cAMP phosphodiesterase inhibitor (Beavo et al. 1970). Indeed, in the presence of IBMX, which maintains a high intracellular level of cAMP by inhibiting the phosphodiesterases, the stimulatory adrenergic effect on CMFs was maintained for 60 min. The ineffectiveness of IBMX to modulate the initial adrenaline-induced elevation of CMFs may be attributed to the fact that the basal level of 2 × 10⁻⁷ M cAMP in erythrocytes (Sager, 1982) is one order of magnitude lower than the Km of 5 × 10⁻⁶ M for cyclic nucleotide phosphodiesterase (Owens et al. 1997).
Our observation that at high isoproterenol concentrations the CMF amplitude decreases appears to be correlated with the decline of intracellular [cAMP] observed at high β-agonists levels (> 10−5 M) (Sager & Jacobsen, 1985). Thus, it can be concluded that CMF elevation is dependent on the intracellular level of cAMP. An additional support for the dependence of CMFs on intracellular cAMP emerges from examining the effect of pentoxifylline. The exposure of RBCs to pentoxifylline should result in an elevation of cAMP since pentoxifylline is known to inhibit the breakdown of 3′,5′-AMP, the cAMP precursor, by specific phosphodiesterase (Cummings & Ballas, 1990). Indeed, pentoxifylline elevated the CMF level at concentrations equal to or higher than 10−8 M. This increase in CMFs correlates with the previously reported elevation of filterability following exposure of RBCs to higher concentrations of pentoxifylline in the range 1 × 10⁻⁷- 3 × 10⁻⁷ M (Sowemimo-Coker & Turner, 1985; Bayer et al. 1988). The difference in the minimal effective concentrations of pentoxifylline which affect CMFs and filterability may be attributed to the observed higher sensitivity of CMFs versus filterability towards adrenergic stimulation.
The involvement of ATP as an essential substrate in the β-adrenergic pathway emerges from studies of ATP-depleted RBCs (Fig. 6). No adrenaline-induced elevation of CMFs was observed in the ATP-depleted RBCs. Similarly, loss of the stimulatory effect of 8-bromo-cAMP was obtained in ATP-depleted RBCs (Fig. 6). This may result from the lack of ATP as substrate for cAMP-dependent kinase or actin ATPase (Tuvia et al. 1998) activities.
The possible involvement of phosphorylation of skeletal protein(s) in modulating the mechanical properties of intact RBCs has scarcely been studied. It has been reported that membrane mechanical stability is regulated via phosphorylation of β-spectrin by membrane-bound casein kinase I (Manno et al. 1995). The state of phosphorylation of protein 4.1 has been suggested to be involved in the regulation of membrane-skeleton structure and in its anchoring to the integral membrane proteins (Gascard et al. 1992). Our observation of the transient decrease in CMFs when the activity of PKA was decreased in the presence of HA1004 may serve as a basis for speculation that β-adrenergic stimulation of CMFs is transduced via phosphorylation-dependent modulation of the linkage between the cytoskeleton and the plasma membrane.
Concluding remarks
The mechanical properties of circulating RBCs play a central role in microcirculation (Chien, 1987). Since the RBC is the most abundant cell in blood which undergoes mechanical deformations during blood circulation its mechanical behaviour has been studied extensively. Moreover, the RBC, being among the simplest and best characterized cellular system, has served in many studies as the cellular model of choice for investigating the multiple steps involved in the action of hormones on cells. Nevertheless, investigation of the regulation of mechanical characteristics of the RBC by physiological effectors, such as hormones, has been very limited (Minetti & Low, 1997).
The present study shows that β-adrenergic agonists are potent in elevating both CMFs and filterability of RBCs. Such a positive correlation between CMFs and filterability of RBCs has already been reported for human erythrocytes when exposed to hyper- and hyposmotic media (Tuvia et al. 1992a) or following exposure to atrial natriuretic peptide and cGMP (Zamir et al. 1992). Moreover, a similar correlation has been established in metastatic and non-metastatic lines of T lymphocytes (Mittelman et al. 1994). This observed correlation can be perceived when the mechanical deformations contributing to the underlying mechanism of these processes are examined.
CMFs constitute fast out-of-plane mechanical displacements of the cell membrane. Since the lipid membrane contains integral proteins that are associated with the underlying skeleton network, the skeleton proteins participate in this motion. The motion of these proteins constitutes shear (in-plane) displacements. Thus, CMFs reflect both bending and shearing elasticity of the whole membrane-skeleton complex, though bending elasticity is the major component.
The filterability of cells through narrow pores is a multistep process which consists of entry into the pore, passage through the pore and exit from it. During the entry stage, the RBC undergoes a dramatic shape transformation from a biconcave discocyte into a parachute-shaped cell, which is determined mostly by the ability of the membrane-skeleton complex to undergo bending deformations. This stage was suggested to be the rate-limiting step for filterability (Secomb & Hsu, 1996). The bending and shearing resistance can modulate the friction forces between the RBC and the walls of the pore, thus changing passage time in the pore (Brody, 1995). Therefore, the decrease in elastic moduli is expected to increase both the passage rate of RBCs through the pores and the CMF amplitudes. This may suggest an explanation for the observed correlation between CMFs and filterability. The increased filterability of RBCs, induced by the adrenergic agonists, may increase the passage of erythrocytes through microvasculature following long exposure of RBCs to adrenaline under stress conditions. Moreover, the ability of adrenaline to cause the recovery of RBC deformability, following attenuation of CMFs and filterability by deoxygenation, may be a manifestation of the possible existence of a regulatory process for oxygen delivery to tissues, under situations of reduced oxygen tension for periods longer than the time to elicit the adrenaline effect (20 min).
Acknowledgments
This research was supported by the German Israel Foundation (no. G-249-201.02/94 to R.K. and S.L.) and Navy ONR Foundation (no. G-N00014-94-10005 to S.L. and R.K.).
References
- Allen JE, Rasmussen H. Human red blood cells: prostaglandin E2, epinephrine and isoproterenol alter deformability. Science. 1971;174:512–514. doi: 10.1126/science.174.4008.512. [DOI] [PubMed] [Google Scholar]
- Backman L. Shape control in human red cell. Journal of Cell Science. 1986;80:281–298. doi: 10.1242/jcs.80.1.281. [DOI] [PubMed] [Google Scholar]
- Bagge U, Branemark PI, Karlsson R, Skalak R. Three-dimensional observations of red blood cell deformation in capillaries. Blood Cells. 1980;6:213–239. [PubMed] [Google Scholar]
- Bayer R, Plewa S, Borcescu E, Claus W. Filterability of human erythrocytes - drug induced prevention of aging in vitro. Arzneimittel Forschung. 1988;38:1765–1767. [PubMed] [Google Scholar]
- Beavo JA, Rogers NL, Crofford OB, Hardman LG, Sutherland EW, Newman EV. Effects of xanthine derivatives on lipolysis and on adenosine 3′,5′-monophosphate phosphodiesterase activity. Molecular Pharmacology. 1970;6:597–603. [PubMed] [Google Scholar]
- Bogin E, Earon Y, Blum M. Effect of parathyroid hormone and uremia on erythrocyte deformability. Clinica Chimica Acta. 1986;161:293–299. doi: 10.1016/0009-8981(86)90013-6. [DOI] [PubMed] [Google Scholar]
- Brochard F, Lennon JF. Frequency spectrum of the flicker phenomenon in erythrocytes. Journal de Physique. 1975;36:1035–1047. [Google Scholar]
- Brody JP, Han Y, Austin RH, Bitensky M. Deformation and flow of red blood cells in a synthetic lattice: evidence for an active cytoskeleton. Biophysical Journal. 1995;68:2224–2232. doi: 10.1016/S0006-3495(95)80443-1. [DOI] [PMC free article] [PubMed] [Google Scholar]
- Cerione RA, Codina J, Kilpatrick BF, Staniszewski C, Gierschik P, Somers RL, Spiegel AM, Birnbaumer L, Caron MG, Lefkowitz RJ. Transducin and the inhibitory nucleotide regulatory protein inhibit the stimulatory nucleotide regulatory protein mediated stimulation of adenylate cyclase in phospholipid vesicle systems. Biochemistry. 1985;24:4499–4503. doi: 10.1021/bi00338a002. [DOI] [PubMed] [Google Scholar]
- Chien S. Red cell deformability and its relevance to blood flow. Annual Review of Physiology. 1987;49:177–192. doi: 10.1146/annurev.ph.49.030187.001141. [DOI] [PubMed] [Google Scholar]
- Cummings DM, Ballas SK. Effects of pentoxifylline and metabolite on red blood cell deformability as measured by ektacytometry. Angiology. 1990;41:118–123. doi: 10.1177/000331979004100205. [DOI] [PubMed] [Google Scholar]
- Evans E. Structure and deformation properties of red blood cells: concepts and quantitative methods. In: Fleischer S, Fleischer B, editors. Methods in Enzymology. Vol. 173. San Diego, New York, London: Academic Press; 1989. pp. 3–35. [DOI] [PubMed] [Google Scholar]
- Ferrell JE, Jr, Huestis WH. Phosphoinoside metabolism and the morphology of human erythrocytes. Journal of Cell Biology. 1984;98:1992–1998. doi: 10.1083/jcb.98.6.1992. 10.1083/jcb.98.6.1992. [DOI] [PMC free article] [PubMed] [Google Scholar]
- Fricke K, Sackmann E. Variation of frequency spectrum of the erythrocyte flickering caused by aging, osmolarity, temperature and pathological changes. Biochimica et Biophysica Acta. 1984;803:145–152. doi: 10.1016/0167-4889(84)90004-1. 10.1016/0167-4889(84)90004-1. [DOI] [PubMed] [Google Scholar]
- Fricke K, Wirthensohn K, Laxhuber R, Sackmann E. Flicker spectroscopy of erythrocytes. A sensitive method to study subtle changes of membrane bending stiffness. European Biophysics Journal. 1986;14:67–81. doi: 10.1007/BF00263063. [DOI] [PubMed] [Google Scholar]
- Gaehtgens P, Duhrssen C, Albrecht KH. Motion, deformation, and interaction of blood cells and plasma during flow through narrow capillary tubes. Blood Cells. 1980;6:799–817. [PubMed] [Google Scholar]
- Gascard P, Pawelczyk T, Lowenstein JM, Cohen MC. The role of inositol phospholipids in the association of band 4.1 with the human erythrocyte membrane. European Journal of Biochemistry. 1992;211:671–681. doi: 10.1111/j.1432-1033.1993.tb17595.x. [DOI] [PubMed] [Google Scholar]
- Gille E, Lemoine H, Ehle B, Kaumann AJ. The affinity of (-)-propranolol for β1 and β2 adrenoreceptors of human heart. Naunyn-Schmiedeberg's Archives of Pharmacology. 1985;331:60–70. doi: 10.1007/BF00498852. [DOI] [PubMed] [Google Scholar]
- Glynn IM, Lew VL. Synthesis of adenosine triphosphate at the expense of downhill cation movement in intact human red blood cells. The Journal of Physiology. 1970;207:393–399. doi: 10.1113/jphysiol.1970.sp009068. [DOI] [PMC free article] [PubMed] [Google Scholar]
- Hanss M. Erythrocyte filtrability measurement by the initial flow rate method. Biorheology. 1983;20:199–211. doi: 10.3233/bir-1983-20209. [DOI] [PubMed] [Google Scholar]
- Hidaka H, Inagak M, Kawamoto S, Sasaki Y. Isoquinolinesulfonamides, novel and potent inhibitors of cyclic nucleotide dependent protein kinase and protein kinase C. Biochemistry. 1984;23:5036–5041. doi: 10.1021/bi00316a032. [DOI] [PubMed] [Google Scholar]
- Korenstein R, Tuvia S, Mittelman L, Levin S. Local bending fluctuations of the cell membrane. In: Akkas N, editor. Biomechanics of Active Movement and Division of Cells, NATO ASI Series H: Cell Biology. Vol. 84. Springer-Verlag; 1994. pp. 415–423. [Google Scholar]
- Krol A, Yu, Grinfeldt MG, Levin SV, Smilgavichus AD. Local mechanical oscillations of the cell surface within the range 0.2–30 Hz. European Biophysics Journal. 1990;19:93–99. doi: 10.1007/BF00185092. [DOI] [PubMed] [Google Scholar]
- Levin S, Korenstein R. Membrane fluctuations in erythrocytes are linked to MgATP-dependent dynamic assembly of the membrane skeleton. Biophysical Journal. 1991;60:733–737. doi: 10.1016/S0006-3495(91)82104-X. [DOI] [PMC free article] [PubMed] [Google Scholar]
- Lew VL, Ferreira HG. Calcium transport and the properties of a calcium-activated potassium channel in red cell membranes. Current Topics in Membranes and Transport. 1978;10:217–277. [Google Scholar]
- Lew VL, Garcia-Sancho J. Measurement and control of intracellular calcium in intact red cells. In: Fleischer S, Fleischer B, editors. Methods in Enzymology. Vol. 173. San Diego, New York, London: Academic Press; 1989. pp. 100–112. [DOI] [PubMed] [Google Scholar]
- Manno S, Takakuwa Y, Nagao K, Mohandas N. Modulation of erythrocyte membrane mechanical function by β-spectrin phosphorylation and dephosphorylation. Journal of Biological Chemistry. 1995;270:5659–5665. doi: 10.1074/jbc.270.10.5659. 10.1074/jbc.270.10.5659. [DOI] [PubMed] [Google Scholar]
- Matsuura T, Kanayama Y, Inoue T, Takeda T, Morishima I. cAMP-induced changes of intracellular free Mg2+ levels in human erythrocytes. Biochimica et Biophysica Acta. 1993;1220:31–36. doi: 10.1016/0167-4889(93)90093-5. 10.1016/0167-4889(93)90093-5. [DOI] [PubMed] [Google Scholar]
- Minetti G, Low PS. Erythrocyte signal transduction pathways and their possible functions. Current Opinion in Hematology. 1997;4:116–121. doi: 10.1097/00062752-199704020-00007. [DOI] [PubMed] [Google Scholar]
- Mittelman L, Levin S, Korenstein R. Fast cell membrane displacements in B lymphocytes. Modulation by dihydro-cytochalasin B and colchicine. FEBS Letters. 1991;293:207–210. doi: 10.1016/0014-5793(91)81188-e. 10.1016/0014-5793(91)81188-E. [DOI] [PubMed] [Google Scholar]
- Mittelman L, Levin S, Verschueren H, De Baetselier P, Korenstein R. Direct correlation between cell membrane fluctuations, cell filterability and the metastatic potential of lymphoid cell lines. Biochemical and Biophysical Research Communications. 1994;203:899–906. doi: 10.1006/bbrc.1994.2267. 10.1006/bbrc.1994.2267. [DOI] [PubMed] [Google Scholar]
- Oonishi T, Sakashita K, Uyesaka N. Regulation of red blood cell filterability by Ca2+ influx and cAMP-mediated signaling pathways. American Journal of Physiology. 1997;273:C1828–1834. doi: 10.1152/ajpcell.1997.273.6.C1828. [DOI] [PubMed] [Google Scholar]
- Owens RJ, Catterall C, Batty D, Jappy J, Russell A, Smith B, O'Connell J, Perry MJ. Human phosphodiesterase 4A: Characterization of full-length and truncated enzymes expressed in COS cells. Biochemical Journal. 1997;326:53–60. doi: 10.1042/bj3260053. [DOI] [PMC free article] [PubMed] [Google Scholar]
- Pelikanova T, Kohout M, Hilgertova J, Base J, Farska I, Valek J. Erythrocyte insulin receptor characteristics and erythrocyte membrane lipid composition in healthy men. Physiologia Bohemoslovaca. 1989;38:419–425. [PubMed] [Google Scholar]
- Rasmussen H, Lake W, Allen JE. The effect of catecholamines and prostaglandins upon human and rat erythrocytes. Biochimica et Biophysica Acta. 1975;411:63–73. doi: 10.1016/0304-4165(75)90285-8. [DOI] [PubMed] [Google Scholar]
- Sager G. Receptor binding sites for beta-adrenergic receptors. Biochemical Pharmacology. 1982;31:99–104. doi: 10.1016/0006-2952(82)90243-x. 10.1016/0006-2952(82)90243-X. [DOI] [PubMed] [Google Scholar]
- Sager G, Jacobsen S. Effect of plasma on human erythrocyte beta-adrenergic receptors. Biochemical Pharmacology. 1985;34:3767–3771. doi: 10.1016/0006-2952(85)90244-8. 10.1016/0006-2952(85)90244-8. [DOI] [PubMed] [Google Scholar]
- Secomb TW, Hsu R. Analysis of red blood cell motion through cylindrical micropores: Effects of cell properties. Biophysical Journal. 1996;71:1095–1100. doi: 10.1016/S0006-3495(96)79311-6. [DOI] [PMC free article] [PubMed] [Google Scholar]
- Sowemimo-Coker SO, Turner P. The effect of pentoxifylline on filterability of normal red blood cells and their adhesiveness to cultured endothelial cells. European Journal of Clinical Pharmacology. 1985;29:55–59. doi: 10.1007/BF00547369. [DOI] [PubMed] [Google Scholar]
- Strey H, Peterson M, Sackmann E. Measurement of erythrocyte membrane elasticity by flicker eigenmode decomposition. Biophysical Journal. 1995;69:478–488. doi: 10.1016/S0006-3495(95)79921-0. [DOI] [PMC free article] [PubMed] [Google Scholar]
- Tishler RB, Carlson FD. A study of dynamic properties of the human red blood cell membrane using quasi-elastic light scattering spectroscopy. Biophysical Journal. 1993;65:2586–2600. doi: 10.1016/S0006-3495(93)81302-X. [DOI] [PMC free article] [PubMed] [Google Scholar]
- Tsukamoto T, Sonenberg M. Catecholamine regulation of human erythrocyte membrane protein kinase. Journal of Clinical Investigation. 1979;64:534–540. doi: 10.1172/JCI109491. [DOI] [PMC free article] [PubMed] [Google Scholar]
- Tuvia S, Almagor A, Bitler A, Levin S, Korenstein R, Yedgar S. Cell membrane fluctuations are regulated by medium macroviscosity: Evidence for a metabolic driving force. Proceedings of the National Academy of Sciences of the USA. 1997;94:5045–5049. doi: 10.1073/pnas.94.10.5045. 10.1073/pnas.94.10.5045. [DOI] [PMC free article] [PubMed] [Google Scholar]
- Tuvia S, Levin S, Bitler A, Korenstein R. Mechanical fluctuations of the membrane skeleton are dependent on F-actin ATPase in human erythrocytes. Journal of Cell Biology. 1998;141:1551–1561. doi: 10.1083/jcb.141.7.1551. 10.1083/jcb.141.7.1551. [DOI] [PMC free article] [PubMed] [Google Scholar]
- Tuvia S, Levin S, Korenstein R. Correlation between local cell membrane displacements and filterability of human red blood cells. FEBS Letters. 1992a;304:32–36. doi: 10.1016/0014-5793(92)80583-3. 10.1016/0014-5793(92)80583-3. [DOI] [PubMed] [Google Scholar]
- Tuvia S, Levin S, Korenstein R. Oxygenation- deoxygenation cycle of erythrocytes modulates the submicron cell membrane fluctuations. Biophysical Journal. 1992b;63:599–602. doi: 10.1016/S0006-3495(92)81625-9. [DOI] [PMC free article] [PubMed] [Google Scholar]
- Zamir N, Tuvia S, Riven-Kreitman R, Levin S, Korenstein R. Atrial natriuretic peptide: direct effects on human red blood cell dynamics. Biochemical and Biophysical Research Communications. 1992;188:1003–1009. doi: 10.1016/0006-291x(92)91331-j. [DOI] [PubMed] [Google Scholar]
- Zeman K, Engelhard H, Sackmann E. Bending undulations and elasticity of the erythrocyte membrane: effects of cell shape and membrane organization. European Biophysics Journal. 1990;18:203–219. doi: 10.1007/BF00183373. [DOI] [PubMed] [Google Scholar]