

Abstract
In vivo ATP synthesis rates were measured in the human medial gastrocnemius muscle during high intensity exercise using localized 31P-magnetic resonance spectroscopy (31P-MRS). Six-second localized spectra were acquired during and following a 30 s maximal voluntary rate exercise using a magnetic resonance image-guided spectral localization technique.
During 30 s maximal voluntary rate exercise, ATPase fluxes were predominantly met by anaerobic ATP sources. Maximal in vivo glycogenolytic rates of 207 ± 48 mM ATP min−1 were obtained within 15 s, decreasing to 72 ± 34 mM ATP min−1 by the end of 30 s. In contrast, aerobic ATP synthesis rates achieved 85 ± 2 % of their maximal capacity within 9 s and did not change throughout the exercise. The ratio of peak glycolytic ATP synthesis rate to maximal oxidative ATP synthesis was 2.9 ± 0.9.
The non-Pi, non-CO2 buffer capacity was calculated to be 27.0 ± 6.2 slykes (millimoles acid added per unit change in pH). At the cessation of exercise, Pi, phosphomonoesters and CO2 were predicted to account for 17.2 ± 1.5, 5.57 ± 0.97 and 2.24 ± 0.34 slykes of the total buffer capacity.
Over the approximately linear range of intracellular pH recovery following the post-exercise acidification, pHi recovered at a rate of 0.19 ± 0.03 pH units min−1. Proton transport capacity was determined to be 16.4 ± 4.1 mM (pH unit)−1 min−1 and corresponded to a maximal proton efflux rate of 15.3 ± 2.7 mM min−1.
These data support the observation that glycogenolytic and glycolytic rates are elevated in vivo in the presence of elevated Pi levels. The data do not support the hypothesis that glycogenolysis follows Michealis-Menten kinetics with an apparent Km for [Pi]in vivo.
In vivo -measured ATP utilization rates and the initial dependence on PCr and glycolysis were similar to those previously reported in in situ studies involving short duration, high intensity exercise. This experimental approach presents a non-invasive, quantitative measure of peak glycolytic rates in human skeletal muscle.
Skeletal muscle has a high potential to generate ATP anaerobically. The power output achieved during 30 s of maximal sprinting drastically exceeds the power output necessary to elicit a maximal O2 uptake (Qmax). If the only limitation to glycogenolytic ATP synthesis were glycogen levels, rates as high as 282 mM ATP min−1 (∼4 × Qmax) could be sustained for 90 s in Type II fibres, as shown by in situ substrate utilization studies (Greenhaff et al. 1994; Casey et al. 1996). On the other end of the scale, subjects with enzyme deficiencies in glycogenolysis and glycolysis (Duboc et al. 1987) experience extensive PCr depletion without acidosis and are characterized by exercise intolerance (Duboc et al. 1987). Therefore, glycolytic rates must be large enough to provide sufficient oxidizable substrates to support mitochondrial ATPase synthesis, as well as to match the difference between the catalytic capacity of functional ATPases, Qmax and creatine kinase. This latter inter-relationship has been postulated to be fundamental to the muscle's phenotype (Greenhaff et al. 1994; Casey et al. 1996).
Both indirect and direct measurements of ATP provisions have demonstrated large transient increases in anaerobic ATP synthesis rates. Based on pulmonary O2-deficit measurements, Bangsbo et al. (1990) demonstrated that during 30 s of high intensity exercise of an isolated muscle group (130 %Qmax), anaerobic energy provision accounts for 80 % of the total ATP synthesis. In situ measurements, which have the advantage that direct measurements of anaerobic provisions can be made in single muscles, have demonstrated that peak lactate accumulation rates can occur within 10 s of high intensity exercise, and dramatically decrease during the next 30 s (Boobis et al. 1982; Jacobs et al. 1983; Jones et al. 1985). However, due to the damaging nature of the biopsy technique, in situ measurements are limited in temporal resolution and are poor for repeated measurements. MRS, on the other hand, provides a viable alternative for the serial measurement of changes in anaerobic ATP provisions during exercise. MRS has been successfully used to measure muscle glycogen (Chen et al. 1994), lactate (Pan et al. 1991), intracellular pH (pHi) and phosphate kinetics (Walter et al. 1997). In addition, the development of 31P-MRS localization methods now makes it possible to measure high energy phosphate and pHi kinetics in single human muscles of different fibre type composition.
The relationship between lactate formation and changes in pHi is known to depend on the physio-chemical buffering of the myoplasm (Sahlin, 1978; Hultman & Sahlin, 1980; Mainwood & Renaud, 1985). For instance, the extraction of lactate production rates from changes in pHi depends on the correction for changes in proton concentration due to proton and/or lactate efflux (Veff), the creatine kinase reaction, and the amount of protons buffered by muscle proteins (βi) and bicarbonate (βCO2), in combination with the build-up of metabolites possessing pKa values within the physiological range. In situ measurements of pHi changes are often extrapolated based on the relationship between whole muscle homogenate pH and the sum of lactate and pyruvate concentrations (Sahlin, 1978; Hultman & Sahlin, 1980; Spriet, 1989). Unfortunately, this relationship is muscle specific (Spriet, 1989) and depends on the exercise conditions (Sahlin, 1978). Furthermore, this empirical relationship obscures the reported differences in buffer capacity (McKenna et al. 1996) and lactate/proton efflux rates (Kemp & Radda, 1994; Thompson et al. 1996; Juel, 1997).
In this study, in vivo anaerobic and aerobic ATP synthesis rates were measured in human skeletal muscle under exercise conditions known to elicit peak ATP utilization rates. The interplay between high energy phosphates and phosphorylation of sugars by the glycolytic pathway was examined in the context of maximal exercise conditions. In vivo muscle bioenergetics were studied in a single muscle (medial gastrocnemius) using localized 31P-magnetic resonance spectroscopy.
METHODS
Subjects
The medial gastrocnemius muscle of 10 healthy subjects (range 19-37 years; eight males, two females) was studied. Eight of the subjects were moderately active, exercising at low intensity one to three times a week, whereas the remaining two were collegiate sprint runners. Six of the subjects had performed the in-magnet exercise protocol on previous occasions, while four of the subjects had never performed the exercise protocol. All subjects were informed of the purpose of the experiment and gave their written consent. The research protocol was approved by the Institutional Review Board of the University of Pennsylvania.
Experimental set-up
All studies were performed in a 1 m bore, 2.0 T superconducting magnet, interfaced with a home-built spectrometer (Walter et al. 1997). Subjects were placed in a supine position on an exercise bed, with their right leg suspended in a moulded cast to reduce motion artifacts and blood flow limitations. The subject's right foot was positioned on a non-magnetic, variable resistance calf ergometer built for in-magnet exercise. Exercise consisted of repeated maximal rate (2-3 Hz) plantar flexions (∼30 % maximum voluntary contraction (MVC)) over a 40 deg range of motion, with the knee extended (Walter et al. 1997). The high repetition rate was chosen to cause maximal or near-maximal muscle fibre recruitment. The exercise was performed for a total of 9 or 30 s. Straps around the shoulders, waist, knee and ankle were used to secure the body during exercise.
Magnetic resonance spectroscopy
Localized spectra were obtained from the medial gastrocnemius using an oblong surface coil in combination with a one-dimensional localization technique described previously (Walter et al. 1997). The surface coil was a single turn 6 cm × 8 cm oblong coil, double tuned to both 31P and 1H frequencies. The coil was placed over the upper one-third of the medial gastrocnemius. The volume of interest (VOI) was selected from multi-slice, transaxial, surface-coil proton images of the subject's calf acquired at the centre, proximal and distal ends of the coil as previously described (Walter et al. 1997). The typical size of the VOI selected within the medial gastrocnemius was ∼2.7 cm × 5.0 cm × 7 cm (depth × width × length). All spectra were acquired with a sampling rate of 3000 Hz and 1024 complex data points. The pulse repetition time (TR) was set at 3 s, such that localized data were obtained in 6 s bins (two signal averages per time point). The rotating frame frequency was set between the Pi and PCr frequency to minimize chemical shift localization errors of the γ-ATP, Pi and PCr resonances. Spectra were enhanced using the nuclear Overhauser effect (NOE). The homogeneity of the magnetic field was optimized using the free proton signal.
Analysis of spectra
The NMR spectral data were filtered with an exponential filter corresponding to a line broadening of 5 Hz. The spectra were phased manually and the areas of the Pi, PCr and phosphomonoester (PME) peaks were determined by manual integration. PCr and ATP kinetics were determined by the complex principle component method (Elliott et al. 1999). Resting peak areas were corrected for saturation effects using fully relaxed localized spectra collected with a TR of 30 s. Absolute concentrations were calculated, based on a resting ATP concentration of 8.2 mM (Harris et al. 1974). This value has been reported for both human fast- and slow-twitch fibres (Jansson et al. 1987; Söderlund & Hultman, 1991). The inosine monophosphate (IMP) contribution to the PME pool was calculated based on changes in [ATP] (Jansson et al. 1987), such that the remaining PME levels primarily represented glucose 6-phosphate (G6P). Intracellular pH (pHi) was calculated from the chemical shift of Pi based on the equation pHi= 6.75 + log(δ - 3.27)/(5.69 - δ), where δ is the chemical shift of the Pi peak in parts per million (p.p.m.), relative to PCr (Walter et al. 1997). Free ADP and AMP levels were determined using the near-equilibrium of creatine and adenylate kinase adjusted for changes in pH and a free [Mg2+] of 1 mM (Golding et al. 1995).
Calculation of intracellular buffer capacity, proton efflux and ATP synthesis rates
In vivo buffer capacity
The apparent buffer capacity (βtot) in slykes (millimoles acid added per unit change in pH) was measured during a rest-to-work transition based on changes in pHi and PCr. During the initial 6 s of exercise, changes in proton concentration due to anaerobic glycolysis (L), and proton efflux rates (Veff) were assumed to be negligible (Kemp & Radda, 1994) such that:
| (1) |
where the concentration of protons (mM) released by PCr, when coupled to Pi formation by functional ATPases (Wolfe et al. 1988), is represented by Θ, and the factor m provides a minor correction due to the production of protons by aerobic metabolism (Q) (in mM ATP min−1) (Mainwood & Renaud, 1985; Kemp & Radda, 1994). For calculation of Q see below.
| (2a) |
| (2b) |
Due to the high concentration of Pi with a pKa of 6.75 and the presence of glucose 6-phosphate (G6P) with a pKa of 6.20, the contribution of each compound to the apparent buffering capacity throughout exercise can be calculated as a function of its concentration (mM) and the intracellular pH (pHi):
| (3a) |
| (3b) |
During short duration, high intensity exercise, the muscle can be assumed to function as a closed system (Kemp & Radda, 1994), such that changes in bicarbonate due to interactions with arterial blood are small:
| (4) |
where S is the solubility of carbon dioxide (1.3 mM kPa−1) and PCO2 is 5 kPa (Kemp & Radda, 1994). Therefore, the apparent buffering capacity of the muscle (βtot) at any time point is a function of Pi, G6P and HCO3− concentrations and pHi:
| (5) |
The inherent buffer capacity (βi) was calculated by subtracting out the contributions made by inorganic phosphate (βPi), G6P (βG6P) and bicarbonate (βCO2) to βtot:
| (6) |
ATP synthesis rates
The glycolytic rate (L) (in mM ATP min−1) was calculated based on changes in pHi during high intensity exercise after correcting for the buffering of protons by changes in PCr, ATP, the rate of aerobic ATP utilization (Q), the apparent muscle buffer capacity (βtot), and proton efflux (Veff):
| (7) |
The contribution of aerobic metabolism to changes in proton load was calculated as mQ. In the absence of oxygen limitations and changes in intramitochondrial redox, Q has been shown to be related to [ADP], [ADP][Pi]/[ATP] and [PCr] in skeletal muscle (Klingenberg, 1961; Leigh et al. 1986; Balaban, 1990). We chose to describe mitochondrial regulation under control of [ATP]/[ADP][Pi] (Klingenberg, 1961; Leigh et al. 1986). Q (mM ATP min−1) was estimated throughout the exercise protocol as:
| (8) |
where the Qmax (mM ATP min−1) was determined using PCr resynthesis kinetics following 9 s of high intensity exercise (Paganini et al. 1997; Walter et al. 1997). We have previously shown that eqn (8) is well fitted with K0.5= 0.11 mM in the human gastrocnemius muscle (Walter, 1997). The calculated value for Q was also experimentally verified by measuring initial PCr resynthesis rates at 9 and 30 s of exercise (Paganini et al. 1997; Walter, 1997).
Proton efflux rates
Proton efflux rates (Veff; mM H+ min−1) were calculated throughout the recovery period using the observation that in the absence of muscle contraction glycolysis ceases (Quistorff et al. 1992), such that:
| (9) |
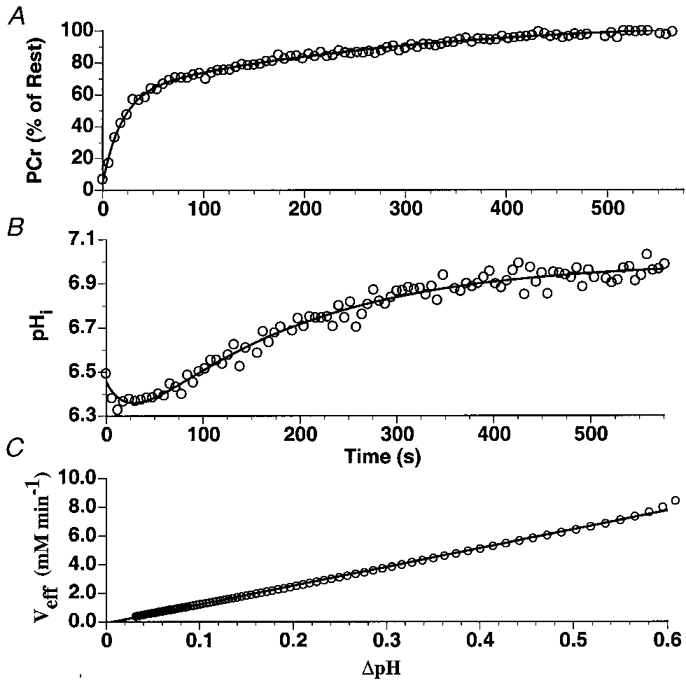
In vivo pHi and PCr recovery kinetics following 30 s of exercise were fitted to biexponential functions (Fig. 3) and used to determine dPCr/dt and dpHi/dt. Veff throughout the exercise was calculated based on the observation that lactate-proton co-efflux (mM min−1) is linearly dependent on pHi (Bangsbo et al. 1993; Kemp et al. 1994; Richardson et al. 1998; Newcomer et al. 1999):
| (10) |
where λ (mM (pH unit)−1 min−1) was determined based on a least-squares fit of Veffvs.ΔpHi (pHrest - pHobserved) during the recovery from the 30 s of exercise, starting after the post-exercise acidification phase (Fig. 3C). pHi recovery rates (pH units min−1) were also measured over the approximately linear region of the recovery.
Figure 3. Typical PCr and intracellular pH (pHi) kinetics as well as the relationship between Veff and ΔpH during the recovery from 30 s of maximal rate exercise.
RESULTS
Pi, PCr and pH kinetics during exercise
Changes in PCr, Pi and pHi were determined with a temporal resolution of 6 s in the medial gastrocnemius. Basal PCr and Pi content and intracellular pH were 37.7 ± 2.8 mM, 4.09 ± 0.53 mM and 7.02 ± 0.01, respectively. At the end of 30 s of high intensity exercise, PCr and ATP levels were 7.68 ± 0.85 % and 62.4 ± 5.3 % of their basal levels. Pi increased to 32.2 ± 2.6 mM and PMEs to 14.7 ± 1.5 mM of which 3.09 ± 0.44 mM was attributed to IMP. Following an initial alkalization, pHi decreased approximately linearly at a rate of 1.65 ± 0.12 pH units min−1 to 6.53 ± 0.04 at the end of 30 s (Fig. 1). ADP increased from 10.5 ± 2.6 μm at rest to 169 ± 40 μm at the end of exercise. AMP increased from 0.02 ± 0.01 μm at rest to 7.4 ± 3.8 μm at the cessation of exercise (Fig. 2).
Figure 1.
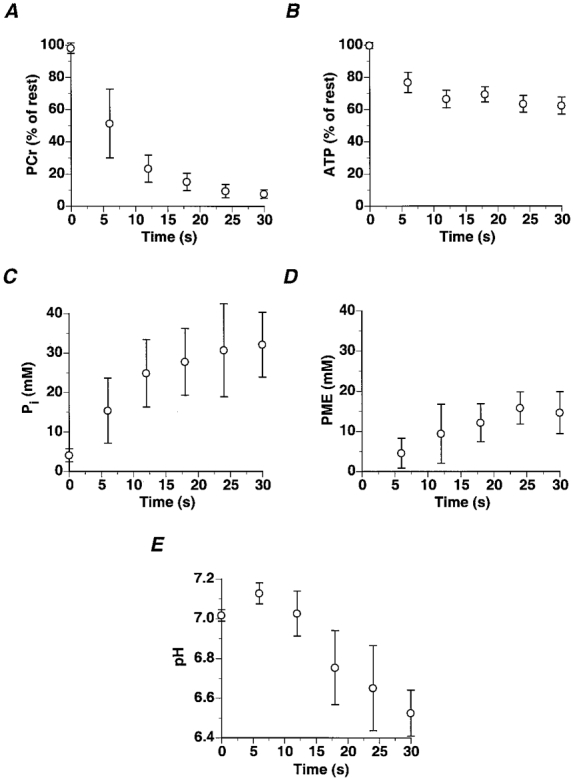
Changes in medial gastrocnemius PCr (A), ATP (B), Pi (C), PME (D) and intracellular pH (E) during 30 s of maximal rate exercise (values are means ±s.d.).
Figure 2.
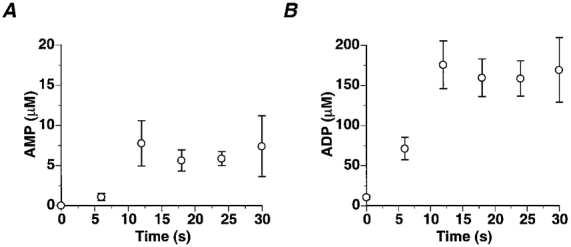
Changes in medial gastrocnemius AMP (A) and ADP (B) during 30 s of maximal rate exercise (data are means ±s.e.m.).
Buffer capacity of human muscle
At the onset of exercise, a rapid drop in PCr levels of the medial gastrocnemius was matched by an increase of pHi to 7.13 ± 0.02 within 6 s. Based on Δ[PCr]/Δ[pHi] (137 ± 19 mM (pH unit)−1) during the initial 6 s of exercise, the total medial gastrocnemius buffer capacity was 41.4 ± 6.6 slykes, where Pi, PMEs and CO2 were predicted to account for 8.5 ± 1.5, 2.5 ± 1.0 and 4.03 ± 0.03 slykes of the βtot, respectively. The non-Pi, non-CO2 buffer capacity (βi) was calculated to be 27.0 ± 6.2 slykes. At the cessation of exercise Pi, PMEs and CO2 were calculated to account for 17.2 ± 1.5, 5.6 ± 1.0 and 2.24 ± 0.34 slykes of the βtot. To determine the reproducibility of this measurement, βi was determined at the onset (22.7 ± 3.7 slykes) and at the cessation (24.4 ± 6.1 slykes) of exercise in the medial gastrocnemius in a single subject during 13 separate trials.
Proton efflux rates in human muscle
Over the approximately linear range of pHi recovery following the initial post-exercise acidification, pHi recovered at a rate of 0.19 ± 0.03 pH units min−1. Based on the result of the biexponential fits to both PCr and pHi recoveries (Fig. 3), λ was determined to be 16.4 ± 4.1 mM (pH unit)−1 min−1 and corresponded to a maximal efflux rate of 15.3 ± 2.7 mM min−1 following the attainment of a minimum pHi of 6.18 ± 0.02 pH units. The reproducibility of the proton efflux measurements was determined in a single subject during eight high intensity exercise tests with an end exercise pHi and minimum pH equal to 6.45 ± 0.07 and 6.23 ± 0.05 pH units, respectively. In this subject, intracellular pH recovered with an approximate linear rate of 0.13 ± 0.01 pH units min−1. The maximal efflux rate and λ were calculated to be 6.33 ± 0.26 mM min−1 and 10.52 ± 1.25 mM (pH unit)−1 min−1.
Glycogenolytic and glycolytic flux
Glycogenolytic and glycolytic rates reached their peak at 15 s (Fig. 4). At 15 s of high intensity exercise, glycogenolysis was 113 ± 26 glucosyl units min−1 while the glycolytic rate was 35 % less at 73.2 ± 16 glucosyl units min−1. Glycogenolytic flux decreased at the end of exercise despite elevated AMP, ADP (Fig. 2), and Pi levels (Fig. 5).
Figure 4.
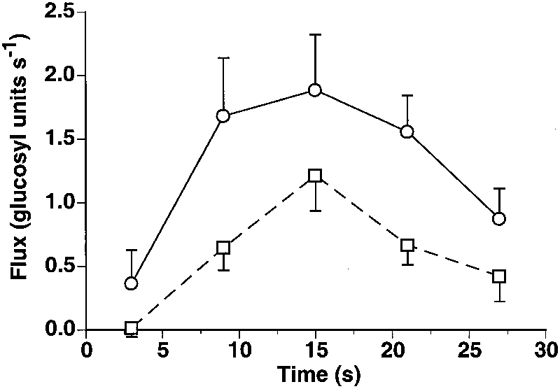
Glycogenolytic (○) and glycolytic (□) rates in the medial gastrocnemius during maximal rate exercise (data are means ±s.e.m.).
Figure 5.
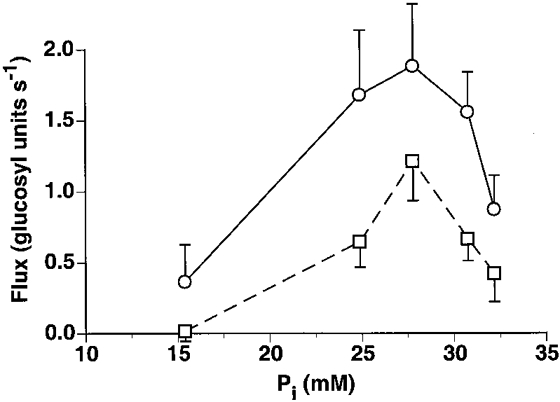
Glycogenolytic (○) and glycolytic (□) rates in the medial gastrocnemius as a function of Pi (data are means ±s.e.m.).
Total ATP synthesis rates
The rate of ATP synthesis due to anaerobic glycolysis (L), aerobic metabolism (Q) and creatine kinase (CK) was calculated during the 30 s of high intensity exercise in the medial gastrocnemius and is displayed in Fig. 6. Note that at the onset of maximal-rate exercise, net ATP synthesis by creatine kinase (mM min−1) accounted for the major part of the total ATPase flux (80 %) and decreased throughout exercise to 5 % of the total ATPase rate at the end of exercise. Due to the rapid fall in PCr and increased Pi levels, aerobic ATP synthesis reached 86 ± 1 % of Qmax within 10 s, but only contributed 10-30 % to the total ATPase flux. Total ATPase flux at the onset of high intensity exercise was 287 mM ATP min−1 and decreased by 46 % at the end of 30 s. A peak glycogenolytic ATP synthesis rate of 219 ± 50 mM ATP min−1 was measured within 15 s (Fig. 6).
Figure 6. ATP provisions in the medial gastrocnemius during maximal rate exercise.
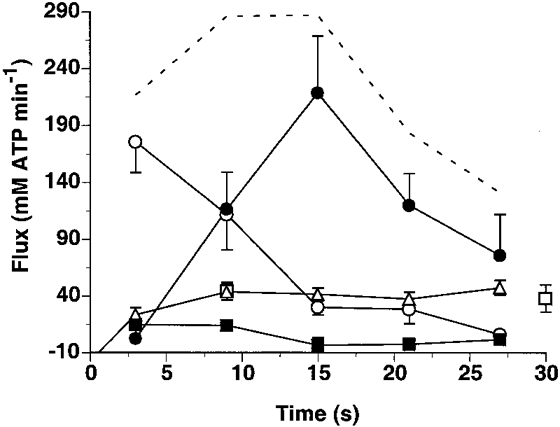
ATP flux as supplied by creatine kinase (○), aerobic metabolism (□, measured; ▵, calculated), glycogenolysis (•) and net ATP breakdown (▪). The dashed line represents total ATP flux. Data are means ±s.e.m.
DISCUSSION
In this study we measured in vivo glycolytic rates, proton efflux rates (Veff), proton consumption/production rates, and the apparent buffer capacity in a single muscle using a one-dimensional MRI-guided localization technique. Previous spatially localized measurements of anaerobic ATP synthesis rates have depended on surface coil localization. Using a 1D-localization procedure we were able to monitor intracellular pH and PCr kinetics in a single muscle during exercise and recovery, with a temporal resolution of 6 s. This permitted the non-invasive measurement of ATPase rates under exercise conditions known to elicit peak anaerobic ATP synthesis rates.
Buffer capacity
The apparent buffer capacity of the medial gastrocnemius was measured during step changes in ATPase flux. The total buffer capacity was calculated based on changes in pHi in response to a change in proton load caused by the rapid hydrolysis of PCr at the onset of high intensity exercise. The non-phosphate, non-bicarbonate buffer capacity (βi) was calculated based on changes in Pi and pHi under the assumption that the cytosol was closed to CO2 (Kemp et al. 1993). We found that at the onset of high intensity exercise the medial gastrocnemius had an apparent buffer capacity (βtot) of 41.4 ± 6.6 slykes and a βi of 27.0 ± 6.2 slykes at a pH of 7.14. This value is in accordance with previous unlocalized 31P measures, which report βi values of 24 ± 5 and 17.4-30.0 slykes in the triceps surae (Newcomer et al. 1999) and wrist flexor muscle groups (Kemp et al. 1993). Based on whole muscle homogenates, estimates of βtot in humans range from 40 to 78 slykes (Hultman & Sahlin, 1980; Spriet et al. 1987). If allowances are made for changes in Pi, PCr and ATP, and glycolytic intermediate accumulation, βi has been predicted to be approximately 31 slykes at a pHi of 6.6 (Hultman & Sahlin, 1980). During exercise the major contributor to changes in βtot is [Pi] (Hultman & Sahlin, 1980; Adams et al. 1990; Kemp et al. 1993). Therefore, βtot cannot be considered to be static and will vary according to activity levels, pHi and primarily the Pi content.
Proton and lactate efflux rates
The observed changes in pHi and cytoplasmic lactate concentration were corrected for their buffering of H+ and transport of lactate by the circulatory system. The dependence of PCr and pHi recovery kinetics on proton efflux was calculated assuming that the lactate-proton transporter is the dominant mechanism for lactate and proton extrusion during exercise and recovery (Pilegaard et al. 1995; Juel, 1997). Proton efflux rates were calculated based on the reported linear dependence of lactate-H+ efflux rates on the myocyte-interstitial fluid pH gradient (Bangsbo et al. 1993; Kemp et al. 1993; Richardson et al. 1998). Based on biexponential fits to both PCr and pHi recoveries, the peak in vivo lactate-proton coefflux rate in the medial gastrocnemius was determined to be 15.3 ± 2.7 mM min−1. This efflux rate is within the range of 5-22 mM lactate min−1 measured in the quadriceps following intense exercise (Bangsbo et al. 1993; Richardson et al. 1998). The pHi recovery rate measured in the medial gastrocnemius (0.30 ± 0.04 pH units min−1) was faster than the rates previously reported in the human forearm (0.15 ± 0.02 pH units min−1) or the quadriceps (0.08 pH units min−1). The experimentally observed linear dependence of the efflux rate on pHi agrees with values previously measured in the triceps surae (Newcomer et al. 1999) and quadriceps muscle groups (Richardson et al. 1998).
The calculated in vivo proton efflux rate is an overestimate of the in vivo lactate efflux rate. Both MRS (Pan et al. 1991) and in situ measurements have reported differences in the recovery time courses of pHi and muscle lactate (Bangsbo et al. 1993; Pilegaard et al. 1995; Juel, 1997). In this study we assumed that the only mechanism for the lactate and proton disposal is the 1:1 cotransport of lactate and protons; however, the removal of each ion also occurs via simple diffusion of undisassociated lactic acid and by internal metabolism (Juel, 1997). The rate of removal of lactate by either internal metabolism or diffusion of undisassociated lactate has been shown to be negligible (Pilegaard et al. 1995; Juel, 1997). It has also been put forth that protons are transported by Na+-H+ and HCO3−-Cl− exchangers (Kemp et al. 1994; Juel, 1997). The ratio of proton-to-lactate efflux ranges between 1 and 1.5 in human muscle during recovery (Bangsbo et al. 1993; Juel, 1997). This ratio agrees with that predicted based on the individual activities of the lactate-proton cotransporter, and the Na+-H+ and HCO3−-Cl− transporters measured in rat skeletal muscle (Juel, 1997). Furthermore, the lactate-proton transport capacity was found to be more than twofold greater than the sum of the other two exchangers (Juel, 1997). This ratio is not expected to remain constant throughout the recovery period due to different transport sensitivities to [lactate], pHi and blood flow (Pilegaard et al. 1995; McKenna et al. 1996). Assuming a worst case scenario, that the in vivo lactate efflux rate is overestimated by 50 %, the peak lactate accumulation rates during a 30 s maximal rate exercise would change by only 1 %. Moreover, glycolytic flux (mM ATP min−1) is calculated based on the buffering of protons generated by glycogenolysis and the amount of lactate retained does not affect these calculations.
The dependence of lactate efflux on the muscle interstitial lactate and proton gradients suggests that blood flow could play a prominent role in determining efflux rates. However, animal studies have shown that there is no hindrance to lactate efflux at blood flows greater than 0.6 ml min−1 g−1 (Pilegaard et al. 1995). In humans, blood flow is typically in the range 2.5-3.8 ml min−1 g−1 at the end of maximal exercise (Richardson et al. 1998). Since it is difficult to directly alter human blood flow rates at high lactate and proton levels, human studies investigating the effect of blood flow on lactate and H+ efflux have relied on measurements during active (zero external resistance) and passive recovery from intense exercise. Bangsbo et al. (1993), using in situ measurements of the quadriceps, found that blood flow had no effect on lactate or proton efflux rates. On the other hand, Yoshida et al. (1996), using 31P-MRS, reported a difference in pHi recovery during active versus passive recovery. They found that the linear pHi recovery increased from 0.014 ± 0.02 to 0.095 ± 0.02 pH units min−1 during active recovery in the quadriceps muscles. In comparison, we measured a pHi recovery rate of 0.19 ± 0.03 pH units min−1 (0.06-0.36 pH units min−1) in the medial gastrocnemius, indicating that pHi recoveries following this exercise protocol are probably not blood flow limited.
Total ATP synthesis rates
At the onset of high intensity exercise, total ATPase rates are immense and are initially supported by high energy phosphate hydrolysis (Jones et al. 1985; Spriet et al. 1989; Greenhaff et al. 1994; Putman et al. 1995; Bogdanis et al. 1996; Casey et al. 1996; Trump et al. 1996). In the medial gastrocnemius, we measured a total ATP flux of 217 mM ATP min−1 at the onset of maximal rate exercise which was primarily supported by creatine kinase (80 % of the total ATP synthesis). Aerobic ATP synthesis achieved 85 ± 2 % of its maximal capacity within 9 s and did not change throughout the exercise. Moreover, aerobic ATP synthesis only represented 10-30 % of the total ATP flux. This initial high dependence of ATP synthesis rates on creatine kinase is consistent with the recent observations of the lack of burst activity in creatine kinase deficient mice (van Deursen et al. 1993).
Within seconds of high intensity exercise, glycolysis was elevated to peak values. In this study glycolytic rates were found to peak at 146 ± 33 mM lactate min−1 within 15 s, decreasing to 51 ± 24 mM lactate min−1 at the end of 30 s. This transient increase in glycolysis during this exercise is similar to that observed in situ (Boobis et al. 1982; Jacobs et al. 1983; Jones et al. 1985; Greenhaff et al. 1994; Putman et al. 1995; Bogdanis et al. 1996; Casey et al. 1996). Several in situ studies have shown that within 10 s of maximal running or cycling, a peak lactate production rate of 110 mM lactate min−1 can be reached in the human quadriceps (Boobis et al. 1982; Jacobs et al. 1983; Jones et al. 1985). Further confirmation that glycolytic rates of this magnitude can be achieved in vivo is based on the lactate accumulation and glycogen degradation rates measured during direct muscle stimulation. Several studies have reported lactate accumulation rates of 80-100 mM lactate min−1 within 5 s of 50 Hz direct muscle stimulation with occluded circulation (Hultman & Sjöholm, 1983; Söderlund et al. 1992). Thus, glycolytic ATP synthesis rates as high as 219 ± 50 mM ATP min−1 can be achieved in the medial gastrocnemius during short duration, high intensity exercise. The ratio of peak glycolytic ATP synthesis rate to maximal oxidative ATP synthesis in this study was 2.94 ± 0.86. This ratio is consistent with the ratio of maximal in vitro activities of phosphofructokinase to oxoglutarate dehydrogenase (Blomstrand et al. 1986) in the vastus lateralis muscles of differently trained individuals. These results clearly demonstrate the immense ‘burst’ potential of human skeletal muscle and its enormous capacity to generate ATP anaerobically.
During high intensity exercise, glycogenolytic flux is greater than glycolytic flux. Based on the build-up of PMEs during exercise, we measured a peak glycogenolytic rate of 1.88 ± 0.43 glucosyl units s−1, which is 35 % greater than the peak glycolytic rate. The excessive build-up of PMEs during exercise is the hallmark of phosphofructokinase-deficient muscles (Duboc et al. 1987). But even in healthy subjects substantial PME accumulation can occur following high intensity exercise (Vandenborne et al. 1991). Based on in situ measurements, the major constituent of the PME peak during high intensity exercise is glucose 6-phosphate (Boobis et al. 1982; Hultman & Sjöholm, 1983; Jacobs et al. 1983; Jones et al. 1985; Greenhaff et al. 1994; Putman et al. 1995; Bogdanis et al. 1996; Casey et al. 1996). The in situ glucose 6-phosphate concentration in healthy muscles increases from 0.4 mM at rest to 9 mM during 30 s of high intensity exercise (Boobis et al. 1982; Jacobs et al. 1983; Jones et al. 1985; Greenhaff et al. 1994; Putman et al. 1995; Bogdanis et al. 1996; Casey et al. 1996). We measured a PME concentration of 11.9 ± 1.8 mM at the end of exercise following the correction for IMP accumulation, and attribute this build-up primarily to glucose 6-phosphate accumulation.
IMP formation when coupled to ATP hydrolysis and Pi release results in an uptake of protons (Hultman & Sahlin, 1980). In this study we measured a 34 % decrease in the ATP level during the exercise, and this is in agreement with 17-34 % ATP depletion rates measured in situ during high intensity exercises (Boobis et al. 1982; Jacobs et al. 1983; Jones et al. 1985; Greenhaff et al. 1994; Putman et al. 1995; Bogdanis et al. 1996; Casey et al. 1996). A 34 % decrease in ATP, at a pHi of 6.5, results in the net uptake of 0.8-1.6 mM protons (Hultman & Sahlin, 1980). Therefore, in vivo peak glycolytic rates in this study may be subject to a small error (±1 %), incurred by the net uptake of protons via IMP formation.
The dependence of the glycolytic rate on inorganic phosphate was examined during high intensity exercise conditions. Glycogenolytic control in muscle is known to be under hormonal, substrate and allosteric regulation permitting a rapid burst in glycolytic rate at the onset of muscle activity. Paradoxically, even in the presence of high concentrations of all the activators, glycolysis cannot occur without muscle contraction (Quistorff et al. 1992). Chasiotis (1996) reported that phosphorylase activity in vivo can be described by Michaelis-Menten kinetics with a Km for Pi of 28 mM in the absence of AMP and 6.8 mM in its presence. Our findings support their observation that glycolytic rate is elevated in the presence of elevated [Pi], but not their conclusion that glycolysis follows Michaelis-Menten kinetics in vivo (Fig. 5). This result, in addition to the observed accumulation of hexosemonophosphates, indicates that phosphorylase is not the rate limiting enzyme during high intensity exercise, when glycogen levels are above 1-2 mM glucosyl units (Chasiotis, 1996). Moreover, this study shows that the glycolytic and glycogenolytic fluxes decrease while [ADP] and [AMP] remain elevated. The latter results support the notion that glycolysis behaves as a ‘feed forward’ system controlled by Ca2+, independent of metabolite level (Conley et al. 1997).
Acknowledgments
We would like to thank Kevin McCully for his support and insight. This work was supported by NIH grants RR02305 and R29-HD33738. The laboratory work was carried out at the Metabolic Magnetic Resonance Research & Computing Center, Department of Radiology, University of Pennsylvania, Philadelphia.
References
- Adams GR, Foley JM, Meyer RA. Muscle buffer capacity estimated from pH changes during rest-to-work transitions. The Journal of Physiology. 1990;69:968–972. doi: 10.1152/jappl.1990.69.3.968. [DOI] [PubMed] [Google Scholar]
- Balaban RS. Regulation of oxidative phosphorylation in the mamamalian cell. American Journal Physiology. 1990;258:C377–389. doi: 10.1152/ajpcell.1990.258.3.C377. [DOI] [PubMed] [Google Scholar]
- Bangsbo J, Gollnick PD, Graham TE, Juel C, Kiens B, Minuzo M, Saltin B. Anaerobic energy production and O2 deficit-debt relationship during exhaustive exercise in humans. The Journal of Physiology. 1990;42:539–559. doi: 10.1113/jphysiol.1990.sp018000. [DOI] [PMC free article] [PubMed] [Google Scholar]
- Bangsbo J, Johansen L, Graham T, Saltin B. Lactate and H+ effluxes from human skeletal muscles during intense, dynamic exercise. The Journal of Physiology. 1993;462:114–133. doi: 10.1113/jphysiol.1993.sp019546. [DOI] [PMC free article] [PubMed] [Google Scholar]
- Blomstrand E, Ekblom B, Newsholme EA. Maximal activites of key glycolytic and oxidative enzymes in human muscles from differently trained individuals. The Journal of Physiology. 1986;381:111–118. doi: 10.1113/jphysiol.1986.sp016316. [DOI] [PMC free article] [PubMed] [Google Scholar]
- Bogdanis GC, Nevill ME, Boobis LH, Lakomy HKA. Contribution of phosphocreatine and aerobic metabolism to energy supply during repeated sprint exercise. The Journal of Physiology. 1996;80:876–884. doi: 10.1152/jappl.1996.80.3.876. [DOI] [PubMed] [Google Scholar]
- Boobis LH, Williams C, Wooton SA. Human muscle metabolsim during brief maximal exercise. The Journal of Physiology. 1982;338:21–22. P. [Google Scholar]
- Casey A, Constantin-Teodosiu D, Howell S, Hultman E, Greenhaff PL. Metabolic response of type I and type II muscle fibers during repeated bouts of maximal exercise in humans. American Journal of Physiology. 1996;271:E38–43. doi: 10.1152/ajpendo.1996.271.1.E38. [DOI] [PubMed] [Google Scholar]
- Chasiotis D. Role of cyclic AMP and inorganic phosphate in the regulation of muscle glycogenolysis during exercise. Medicine and Science in Sports and Exercise. 1996;88:545–550. [PubMed] [Google Scholar]
- Chen W, Avison MJ, Bloch G, Shulman RG. Proton NMR observation of glycogen in vivo. Magnetic Resonance in Medicine. 1994;31:576–579. doi: 10.1002/mrm.1910310518. [DOI] [PubMed] [Google Scholar]
- Conley KE, Blei ML, Richards TL, Kushmerick MJ, Jubrias SA. Activation of glycolysis in human muscle in vivo. American Journal of Physiology. 1997;273:C306–315. doi: 10.1152/ajpcell.1997.273.1.C306. [DOI] [PubMed] [Google Scholar]
- Duboc D, Jehenson P, Dinh ST, Marsac C, Syrota A, Fardeau M. Phosphorus NMR spectroscopy study of muscular enzyme deficiencies involving glycogenolysis and glycolysis. Neurology. 1987;37:663–671. doi: 10.1212/wnl.37.4.663. [DOI] [PubMed] [Google Scholar]
- Elliott MA, Walter GA, Swift A, Vandenborne K, Schotland JC, Leigh JS. Spectral quantitation by principle-component analysis using complex singular value decomposition. Magnetic Resonance in Medicine. 1999;41:450–455. doi: 10.1002/(sici)1522-2594(199903)41:3<450::aid-mrm4>3.0.co;2-9. [DOI] [PubMed] [Google Scholar]
- Golding EM, Teague WE, Dobson GP. Adjustment of K' to varying pH and pMg for the creatine kinase, adenylate kinase and ATP hydrolysis equilibria permiting quantitative bioenergetic assessment. Journal of Experimental Biology. 1995;198:1775–1782. doi: 10.1242/jeb.198.8.1775. [DOI] [PubMed] [Google Scholar]
- Greenhaff PL, Nevill ME, Söderlund K, Bodin K, Boobis LH, Williams C, Hultman E. The metabolic response of human type I and type II muscle fibers during maximal treadmill sprinting. The Journal of Physiology. 1994;478:149–155. doi: 10.1113/jphysiol.1994.sp020238. [DOI] [PMC free article] [PubMed] [Google Scholar]
- Harris RC, Hultman E, Nordesjö LO. Glycogen, glycolytic intermediates and high-energy phosphates determined in biopsy samples of musculus quadriceps fermoris of man at rest. Methods and variance of values. Scandinavian Journal of Clincal Laboratory Investigations. 1974;33:109–120. [PubMed] [Google Scholar]
- Hultman E, Sahlin K. Acid-base balance during exercise. Exercise and Sport Sciences Reviews. 1980;8:41–128. [PubMed] [Google Scholar]
- Hultman E, Sjöholm H. Energy metabolism and contraction force of human skeletal muscle in situ during electrical stimulation. The Journal of Physiology. 1983;345:525–532. doi: 10.1113/jphysiol.1983.sp014994. [DOI] [PMC free article] [PubMed] [Google Scholar]
- Jacobs I, Tesch PA, Bar-Or O, Karlsson J, Dotan R. Lactate in human skeletal muscle after 10 s and 30 s of supramaximal exercise. Journal of Applied Physiology. 1983;55:365–367. doi: 10.1152/jappl.1983.55.2.365. [DOI] [PubMed] [Google Scholar]
- Jansson E, Dudley GA, Norman B, Tesch PA. ATP and IMP in single human muscle fibres after high intensity exercise. Clinical Physiology. 1987;7:337–345. doi: 10.1111/j.1475-097x.1987.tb00177.x. [DOI] [PubMed] [Google Scholar]
- Jones NL, McCartney N, Graham T, Spriet LL, Kowalchuk JM, Heigenhauser GJF, Sutton JR. Muscle performace and metabolism in maximal isokinetic cycling at slow and fast speeds. Journal of Applied Physiology. 1985;59:132–136. doi: 10.1152/jappl.1985.59.1.132. [DOI] [PubMed] [Google Scholar]
- Juel C. Lactate-proton cotransport in skeletal muscle. Physiological Reviews. 1997;77:322–358. doi: 10.1152/physrev.1997.77.2.321. [DOI] [PubMed] [Google Scholar]
- Kemp GJ, Radda GK. Quantitative interpretation of bioenergetic data from 31P and 1H magnetic resonance spectroscopic studies of skeletal muscle: an analytical review. Magnetic Resonance Quarterly. 1994;10:43–63. [PubMed] [Google Scholar]
- Kemp GJ, Taylor DJ, Styles P, Radda GK. The production, buffering and efflux of protons in human skeletal muscle during exercise and recovery. NMR in Biomedicine. 1993;6:73–83. doi: 10.1002/nbm.1940060112. [DOI] [PubMed] [Google Scholar]
- Kemp GJ, Thompson CH, Sanderson AL, Radda GK. pH control in rat skeletal muscle during exercise, recovery from exercise, and acute respiratory acidosis. Magnetic Resonance in Medicine. 1994;31:103–109. doi: 10.1002/mrm.1910310203. [DOI] [PubMed] [Google Scholar]
- Klingenberg M. Zur Reversibilität der oxydativen Phosphorylierung. IV. Die Beziehung zwischen dem redoxzustand des cytochrome c und dem phosphorylierungspotential des Adenosintriphosphates. Biocemische Zeitschrift. 1961;335:263–272. [Google Scholar]
- Leigh JS, Chance B, Nioka S. Control of oxidative metabolism and hydrogen delivery in human skeletal muscle. A steady-state analysis. In: Shu C, Chien H, editors. NMR in Biology and Medicine. New York: Raven Press; 1986. pp. 201–216. [Google Scholar]
- McKenna MJ, Harmer AR, Fraser SF, Li JL. Effects of training on potassium, calcium and hydrogen ion regulation in skeletal muscle and blood during exercise. Acta Physiologica Scandinavica. 1996;156:335–346. doi: 10.1046/j.1365-201X.1996.199000.x. [DOI] [PubMed] [Google Scholar]
- Mainwood GW, Renaud JM. The effect of acid-base balance on fatigue of skeletal muscle. Canadian The Journal of Physiology and Pharmacology. 1985;63:403–416. doi: 10.1139/y85-072. [DOI] [PubMed] [Google Scholar]
- Newcomer BR, Boska MD, Hetherington HP. Non-Pi buffer capacity and initial PCr breakdown and resynthesis kinetics of human gastrocnemius/soleus muscle groups using 0.5 second time resolved 31P MRS at 4.1 T. NMR in Biomedicine. 1999. in the Press. [DOI] [PubMed]
- Paganini AT, Foley JM, Meyer RA. Linear dependence of muscle phosphocreatine kinetics on oxidative capacity. American Journal of Physiolgy. 1997;271:C501–510. doi: 10.1152/ajpcell.1997.272.2.C501. [DOI] [PubMed] [Google Scholar]
- Pan JW, Hamm JR, Hetherington HP, Rothman DL, Shulman RG. Correlation of lactate and pH in human skeletal muscle after exercise by 1H NMR. Magnetic Resonance in Medicine. 1991;20:57–65. doi: 10.1002/mrm.1910200107. [DOI] [PubMed] [Google Scholar]
- Pilegaard H, Bangsbo J, Henningsen P, Juel C, Richter EA. Effect of blood flow on muscle lactate release studied in perfused rat hindlimb. American Journal of Physiology. 1995;269:E1044–1051. doi: 10.1152/ajpendo.1995.269.6.E1044. [DOI] [PubMed] [Google Scholar]
- Putman CT, Jones NL, Lands LC, Bragg TM, Hollidge-Horval MG, Heigenhauser GJF. Skeletal muscle pyruvate dehydrogenase activity during maximal exercise in humans. American Journal of Physiology. 1995;269:E458–468. doi: 10.1152/ajpendo.1995.269.3.E458. [DOI] [PubMed] [Google Scholar]
- Quistorff B, Johansen L, Sahlin K. Absence of phosphocreatine resynthesis in human calf during ischaemic recovery. Biochemistry Journal. 1992;291:681–686. doi: 10.1042/bj2910681. [DOI] [PMC free article] [PubMed] [Google Scholar]
- Richardson R, Noszewski EA, Leigh JS, Wagner PD. Lactate efflux from exercising human muscle: the role of PO2. Journal of Applied Phsyiology. 1998;85:627–634. doi: 10.1152/jappl.1998.85.2.627. [DOI] [PubMed] [Google Scholar]
- Sahlin K. Intracellular pH and energy metabolsm in skeletal muscle of man. Acta Physiologica Scandinavica. 1978;455:1–56. suppl. [PubMed] [Google Scholar]
- Söderlund K, Greenhaff PL, Hultman E. Energy metabolism in type I and type II human muscle fibres during short term electrical stimulation at different frequencies. Acta Physiologica Scandinavica. 1992;144:15–22. doi: 10.1111/j.1748-1716.1992.tb09262.x. [DOI] [PubMed] [Google Scholar]
- Söderlund K, Hultman E. ATP and phosphocreatine changes in single human muscle fibers after intense electrical stimulation. American Journal of Physiology. 1991;261:E737–741. doi: 10.1152/ajpendo.1991.261.6.E737. [DOI] [PubMed] [Google Scholar]
- Spriet LL. ATP utilization and provision in fast-twitch skeletal muscle during tetanic contractions. American Journal of Physiology. 1989;257:E595–605. doi: 10.1152/ajpendo.1989.257.4.E595. [DOI] [PubMed] [Google Scholar]
- Spriet LL, Lindinger MI, McKelvie RS, Heigenhauser GJF, Jones NL. Muscle glycogenolysis and H+ concentration during maximal intermittent cycling. Journal of Applied Physiology. 1989;66:8–13. doi: 10.1152/jappl.1989.66.1.8. [DOI] [PubMed] [Google Scholar]
- Spriet LL, Söderlund K, Bergstrom M, Hultman E. Skeletal muscle glycogenolysis, glycolysis, and pH during electrical stimulation in men. Journal of Applied Physiology. 1987;62:616–621. doi: 10.1152/jappl.1987.62.2.616. [DOI] [PubMed] [Google Scholar]
- Thompson CH, Macaulay VM, O'Byrne KJ, Kemp GJ, Wilner SM, Talbot DC, Harris AL, Radda GK. Modulation of bryostatin 1 muscle toxicity by nifedipine: effects on muscle metabolism and oxygen supply. British Journal of Cancer. 1996;73:1161–1165. doi: 10.1038/bjc.1996.224. [DOI] [PMC free article] [PubMed] [Google Scholar]
- Trump ME, Heigenhauser GJF, Putman CT, Spriet LL. Importance of muscle phosphocreatine during intermittent maximal exercise. Journal of Applied Physiology. 1996;80:1574–1580. doi: 10.1152/jappl.1996.80.5.1574. [DOI] [PubMed] [Google Scholar]
- van Deursen J, Heerschap A, Oerlemans F, Ruitenbeek W, Jap P, ter Laak H, Wieringa B. Skeletal muscles of mice deficient in muscle creatine kinase lack burst activity. Cell. 1993;74:621–631. doi: 10.1016/0092-8674(93)90510-w. [DOI] [PubMed] [Google Scholar]
- Vandenborne K, McCully K, Kakihira H, Prammer M, Bolinger L, Detre JA, De Meirleir K, Walter G, Chance B, Leigh JS. Metabolic heterogeneity in human calf muscle during maximal exercise. Proceedings of the National Academy of Sciences of the USA. 1991;88:5714–5718. doi: 10.1073/pnas.88.13.5714. [DOI] [PMC free article] [PubMed] [Google Scholar]
- Walter G, Vandenborne K, McCully KK, Leigh JS. Noninvasive measurement of PCr recovery kinetics in single human muscles. American Journal of Physiology. 1997;272:C525–534. doi: 10.1152/ajpcell.1997.272.2.C525. [DOI] [PubMed] [Google Scholar]
- Walter GA. Noninvasive evaluation of metabolic capacities in human skeletal muscles. Dissertation Abstracts International. 1997;58:1163. 03B. [Google Scholar]
- Wolfe CL, Gilbert HF, Brindle KM, Radda GK. Determination of buffering capacity of rat myocardium during ischemia. Biochimica et Biophysica Acta. 1988;971:9–20. doi: 10.1016/0167-4889(88)90156-5. [DOI] [PubMed] [Google Scholar]
- Yoshida T, Watari H, Tagawa K. Effects of active and passive recoveries on splitting of the inorganic phosphate peak determined by P-31 nuclear magnetic resonance spectroscopy. NMR in Biomedicine. 1996;9:13–19. doi: 10.1002/(SICI)1099-1492(199602)9:1<13::AID-NBM394>3.0.CO;2-9. [DOI] [PubMed] [Google Scholar]