

Abstract
We have examined the force-velocity characteristics of tetanically activated human adductor pollicis working in vivo, in the fresh and fatigued states.
The increase in force in response to stretch was divided into two major components. The first, steady, component persisted after the stretch and is concluded not to be a function of active cycling cross-bridges because it was not affected by either the velocity of the stretch or the level of muscle activation.
The origin of the second, transient, component of the increased force seen during stretch is consistent with cross-bridge activity since it increased with increasing velocity of stretch and was proportional to the level of activation.
It is likely that both components of the stretch response make a significant contribution to muscle performance when acting to resist a force. For the fastest stretch used, the contributions of cross-bridge and non-cross-bridge mechanisms were equal. For the slowest stretch, lasting 10 s and over the same distance, the force response was attributed almost entirely to non-cross-bridge mechanisms.
As a result of acute fatigue (50 % isometric force loss) there were only small reductions in the non-cross-bridge component of the force response to stretch, while the cross-bridge component decreased in absolute terms.
The transient component of the stretch response increased as a result of fatigue, relative to the isometric force, while the force during shortening decreased. The results are consistent with a decrease in cross-bridge turnover in fatigued muscle.
It is well documented that when activated skeletal muscle is stretched the force sustained by the muscle increases above maximal isometric values and that the additional force increases with increasing velocities of stretch (Katz, 1939; Edman et al. 1978). Most of the work in this area has involved isolated muscle preparations but when human muscle was stretched during a voluntary contraction, eccentric forces were found to be lower (Webber & Kriellaars, 1997), not significantly higher (Westing et al. 1988, 1990, 1991) or only marginally higher (Thomson & Chapman, 1988) than maximal isometric force. Consequently a clear dependency of eccentric force on stretch velocity has not been demonstrated during voluntary efforts.
The differences between studies on human muscle and isolated preparations may be due to inhibition of neural drive during voluntary contractions (Westing et al. 1990; Dudley et al. 1990; Webber & Kriellaars, 1997) but differing relationships between eccentric force and stretch velocity have been reported, even when electrical stimulation was used. For example, eccentric-to-isometric force ratios of about 1.2 (Westing et al. 1990), 1.4 (Dudley et al. 1990), but also 1.8 (Cook & McDonagh, 1995), have been obtained. The response of active muscle to stretch is complex even in isolated and single fibre preparations and the nature of the different phases of the response is not clearly understood (Noble, 1992). Adding additional external compliance, as with muscle working in vivo, further complicates the interpretation of the data. It is important, however, to address the question of stretch of muscle-tendon complexes working in vivo since, ultimately, this is how the skeletal muscles are used.
The first point addressed in the present study is the contribution of the cross-bridge components of the stretch response in relation to other elements, possibly to series and parallel elements. There are ample indications that there are different components to the stretch response. Not only is force enhanced during the stretch but also the isometric force remains elevated for some time after the movement has finished (e.g. Abbott & Aubert, 1952; Edman et al. 1978). This long lasting component (component 3 in Noble, 1992) of the stretch-induced force increase probably originates outside the cross-bridges (Edman & Tsuchiya, 1996) and consequently has to be taken into account whenever the response to stretch is studied. The analysis used by Noble (1992) was suitable for single fibre preparations; it remains to be seen whether it is also applicable to large muscle-tendon complexes working in vivo.
The second question addressed here concerns the effect of fatigue on the response of the whole muscle-tendon complex to stretch. High intensity, metabolically demanding exercise leads to a considerable loss of muscle power, as has been shown in fatigued animal (De Haan et al. 1988) and human muscle (James et al. 1995; De Ruiter et al. 1999). Thus far, the effects of fatigue on the eccentric part of the force-velocity relationship have only been studied in isolated frog fibres at 0°C (Curtin & Edman, 1994). Whilst many fundamental mechanisms are common to all skeletal muscles, the balance between potential rate limiting steps during fatigue may vary between amphibian and mammalian muscles. Examples of this are the contribution of calcium re-uptake during relaxation (Allen et al. 1989; Westerblad & Allen, 1993) or the importance of hydrogen ions in the fatigue process at different temperatures (Westerblad et al. 1997).
The objective of the work described here was firstly to characterise the stretch response of the human adductor pollicis stimulated to contract in vivo and, secondly, to determine to what extent the different components of the response are affected by fatigue.
METHODS
Subjects
The study was approved by the local ethical committee and eight healthy female subjects (aged 19-26 years) took part after giving their written informed consent. Female subjects were selected because in male subjects, who have, in general, larger and stronger hands, the motor system was not powerful enough to stretch at high velocities the adductor pollicis muscle. The subjects were all right handed and did not undertake any regular exercise that particularly involved the hand muscles. They visited the laboratory on three different occasions. On the first occasion they were familiarised with the procedures and electrical stimulation. The measurements reported here were made on the second and third visits.
Force recording and stimulation
Methods for stimulating the adductor pollicis and recording force are given in detail elsewhere (De Ruiter et al. 1998). Briefly, the subject sat in an adjustable chair with the left forearm supinated, and the hand (palm up) securely fixed horizontally with the thumb abducted and in contact with a vertical rod. The rod was attached to a strain gauge, mounted below the plane of the hand, which measured the force applied by the thumb. The rod was attached by a lever system to a linear motor so that controlled shortening and lengthening of the adductor pollicis could be achieved by rotating the thumb. A thumb angle of 0 deg was defined as the position in which the thumb was fully adducted and touching the index finger. The timing and duration of stimulation, onset and speed of motor movement and data sampling frequency (1000 Hz) of the force and length signal were computer controlled.
The adductor pollicis muscle was activated by percutaneous electrical stimulation of the ulnar nerve at the wrist with constant current unidirectional square wave pulses of 100 μs duration (Digitimer Ltd, model DS7, Welwyn Garden City, UK). Unless otherwise indicated a stimulation frequency of 80 Hz was used. The current was set 30 % above the stimulus that produced maximal isometric tetanic force.
To maintain a constant muscle temperature, the hand and forearm were immersed in a water bath at 45°C for 20 min prior to the test. During the experiment a lamp was used to maintain skin temperature over the adductor pollicis at 36.0 ± 0.5°C, measured with a thermocouple.
Concentric contractions
During the second visit to the laboratory the concentric part of the force-velocity relationship for fresh and fatigued adductor pollicis muscle was obtained. Isovelocity shortening contractions at different angular velocities (0, 76.4, 152.8, 229.2, 305.6 and 382.0 deg s−1) were studied. The method used has been described in detail and validated elsewhere (De Ruiter et al. 1999) but one modification was made. The stimulation frequency was increased from 80 to 150 Hz during shortening at 152.8 and 229.2 deg s−1 and to 300 Hz during shortening at 305.6 and 382.0 deg s−1. Stimulation frequencies were increased to guarantee maximal muscle activation at the higher shortening speeds as, at these speeds, the force generated was low and muscle shortening started after only a few milliseconds of isometric contraction. Pilot experiments indicated that force output at high velocities of shortening was slightly increased when higher (150 and 300 Hz) stimulation frequencies were applied, although the effect was not as large as that recently demonstrated in rat muscle (de Haan, 1998). Force during isovelocity shortening contractions was measured at a thumb angle of 51 deg, which was the optimum for force production, although it should be noted that the angle-force relationship was very flat over a wide range (36-74 deg) of thumb angles (De Ruiter et al. 1998; and Fig. 1). Data were fitted (least squares) to the hyperbolic relationship described by Hill (1938).
Figure 1. Force-thumb angle relationships of adductor pollicis muscle.
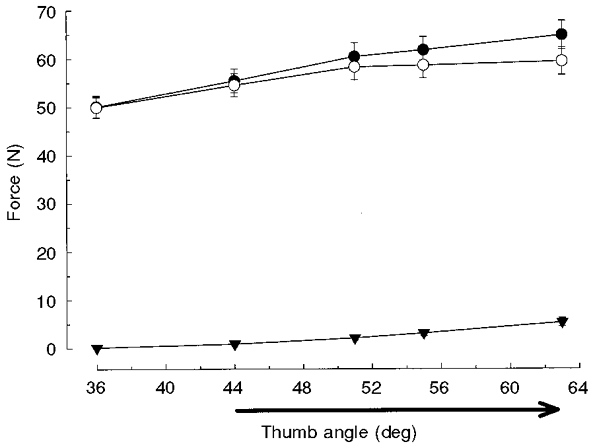
Total (•), passive (▾) and active (total – passive; ○) force (n = 8, means ±s.e.m.) at different thumb angles. The standard stretch trajectory (44-63 deg) is indicated by the arrow.
Active stretch
One week following the concentric measurements, the subjects returned to the laboratory and the eccentric part of the force- velocity relationship was investigated. Stretches began from the maximally activated isometric state. Following 500 ms of isometric activation (80 Hz) at a thumb angle of 44 deg, the thumb was abducted by the motor to an angle of 63 deg at a variety of constant angular velocities (0, 9.6, 19.1, 28.7, 38.2, 76.4 and 152.8 deg s−1) applied in random order. The isometric force before the stretch (Fbefore) was measured 500 ms after the start of stimulation (e.g. Fig. 2). The 19 deg stretch trajectory was chosen because the angle-force relationship of adductor pollicis muscle was almost flat in the thumb angle range 44-63 deg (Fig. 1). A stretch of 19 deg (abduction) was large enough, at all velocities, to show the characteristic later part of the stretch response where forces increased linearly with the increase in thumb angle (e.g. Fig. 2). Stimulation was continued for a further 500 ms after the stretch and isometric force (Fafter) was measured just before the end of stimulation. Isometric contractions (1 s duration, at thumb angles of 51, 55 and 63 deg) were interjected during the sequence of eccentric contractions.
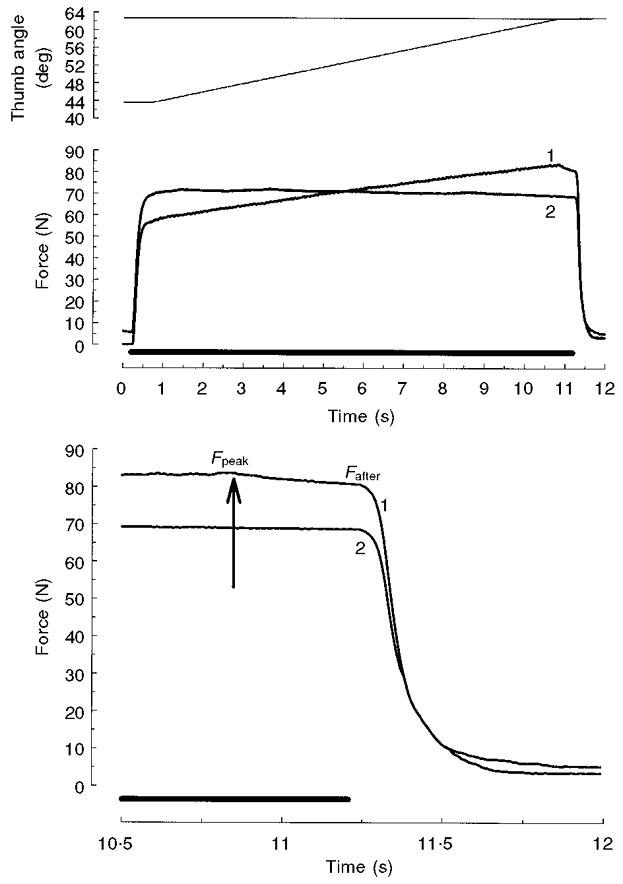
Figure 2. Force record during and following isovelocity stretches at 76.4 deg s−1.
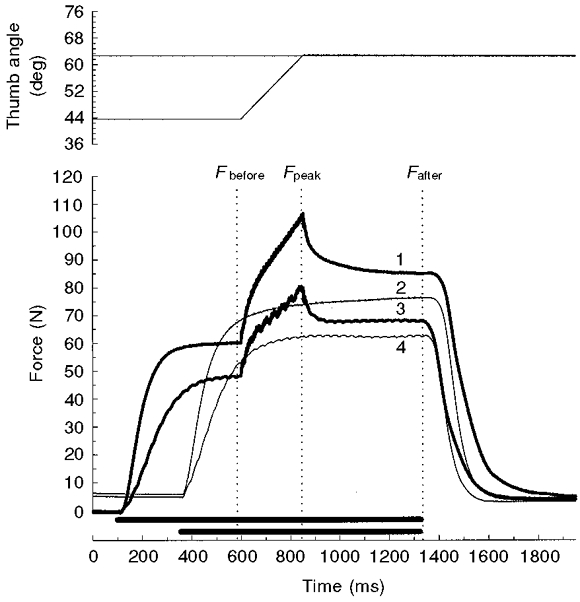
Angular displacement (top) and force data (bottom) for one subject. Stimulation (indicated by the bars above the time axis) was either at 80 Hz (traces 1 and 2) or 30 Hz (traces 3 and 4). Vertical dotted lines indicate where the forces were measured, before (Fbefore), at the peak (Fpeak) and 500 ms following the stretch (Fafter). The thick traces are the force responses before, during and after stretches from 44 to 63 deg thumb angle at 76.4 deg s−1. Note that with both the 80 and 30 Hz stimulation, the isometric force after the stretch (Fafter) was enhanced compared to the isometric forces at the 63 deg thumb angle without a preceding stretch (thin traces).
To study the effect of decreased activation, or number of attached cross-bridges, on the force response to stretch, the isometric force at the start of lengthening was reduced in two ways. The first involved reducing the stimulation frequency to 30 Hz while abduction remained at 44-63 deg (Fig. 2). In the second approach the force at the start of lengthening was reduced by beginning the stretch from an isometric contraction at a smaller (36 deg) thumb angle, on the ascending limb of the angle-force relationship (Fig. 1). In the latter case, the thumb was abducted to 55 deg to keep the length of the stretch constant at 19 deg. Three minutes rest was allowed between each contraction.
Data analysis and model of stretch response
To describe and quantify the force responses to stretch, the traces have been decomposed into three components (Fig. 3), based largely on the model proposed by Noble (1992). The first component (component A), which has sometimes been further subdivided into two components, 1 and 2 (Fig. 1 of Noble, 1992), is probably due to a velocity-dependent increased force production of the cross-bridges during stretch. If this were the case it would be anticipated that component A would depend on the stretch velocity and the number of attached cross-bridges.
Figure 3. Proposed components of stretch-induced force enhancement (modelled data).
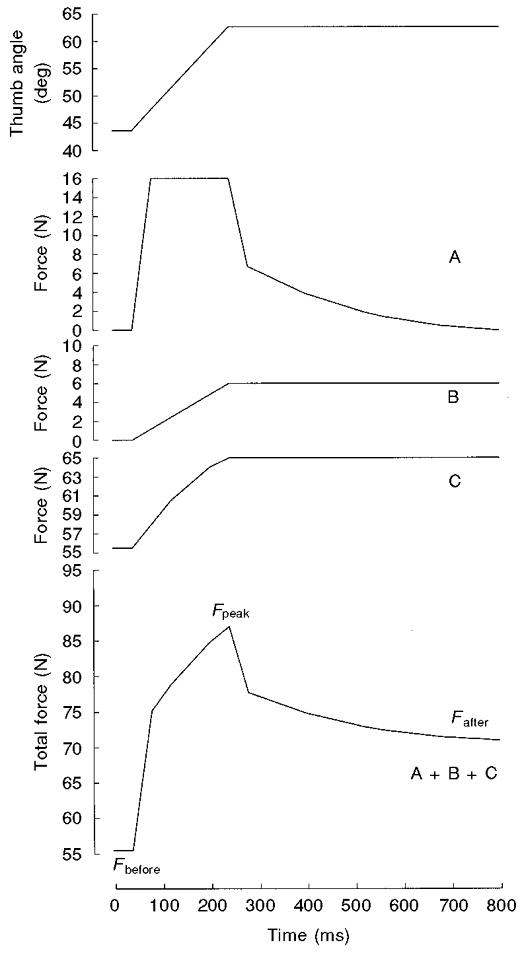
The maximally activated adductor pollicis muscle was stretched by abduction of the thumb (at 76.4 deg s−1) from the isometric force plateau at the 44 deg thumb angle (top panel). Component A is the force response of cross-bridges to constant velocity stretch. Component B is the length-dependent element. Component C follows the total (= active + passive) force-thumb angle relationship of the muscle. The difference between isometric force after and before the stretch (Fafter–Fbefore) was used as a measure of the steady component of the stretch-induced force enhancement, reflecting the combined effects of components B and C. The difference between the peak force (Fpeak) and Fafter was used to quantify the transient component A. Note that this is a qualitative model and that the absolute force values (y-axis) were added following analysis of the data to give an impression of the relative contribution of each of the three components to the total force output during a stretch at 76.4 deg s−1.
The second component (component B) is proposed to be length dependent. The origin of component B (component 3 in Fig. 1 of Noble, 1992) is not known but it has been suggested not to be the cross-bridges and is probably related to the involvement of passive muscle structures during stretch. Therefore, this component would be expected to be independent of the stretch velocity. Component B is more significant at longer muscle lengths and is also related to the long lasting enhancement of isometric force observed following a stretch (Edman & Tsuchiya, 1996) but the extent to which this component decays following stretch is uncertain. In the present model, component B is shown as remaining constant following stretch (Fig. 3).
A third component (component C) was expected in the present study because muscles were stretched on the ascending limb of the thumb angle-force relationship. This, in turn, is made up of two components: active force, varying as a result of filament overlap, and a passive component (see Fig. 1). Of these two, the active component might be expected to vary with levels of activation and velocity of stretch.
The three components (A, B and C) of the model and their expected combined effects on total force output are visualised in Fig. 3. It was assumed that component A was only present during the stretch and would decay relatively soon (within 500 ms) after the end of the stretch (e.g. Noble, 1992); hence it will be referred to as the transient component of the stretch-induced force increase. The difference between the peak force at the end of the stretch (Fpeak) and the isometric force 500 ms after the stretch (Fafter) was taken to represent the transient component of the stretch-induced force increase. The combined effects of components B and C would account for the difference between the isometric force level after and immediately before the stretch. Therefore Fafter-Fbefore was taken as a measure of the steady component of the stretch-induced force increase.
Fatigue
After the force-velocity measurements had been completed in the fresh muscle, the blood supply was occluded by inflating a cuff around the upper arm and the muscle was fatigued by 59 contractions. During these repetitive contractions the stimulation frequency was set at 50 Hz to minimise possible failure of electrical activity. There were 57 isovelocity shortening (152.8 deg s−1) contractions, during which the adductor pollicis shortened from thumb angles of 74 to 36 deg. The contractions were of 240 ms duration, with 760 ms rest between contractions to allow complete force relaxation before the thumb was abducted back to 74 deg for the start of the next contraction. The 20th and 40th contractions were isovelocity (76.4 deg s−1) lengthening contractions, which were introduced to monitor the effect of developing fatigue on eccentric force at 76.4 deg s−1.
Immediately following the fatigue protocol, and with the muscle maintained ischaemic, a series of contractions was carried out to obtain either the concentric (second test occasion) or the eccentric part (third test occasion) of the force-velocity relationship. The concentric series consisted of contractions at 0, 76.4, 152.8, 229.2, 305.6 and 382 deg s−1 applied in random order. The eccentric series (50 Hz stimulation frequency) always began with a lengthening contraction at 76.4 deg s−1 after which two isometric contractions (at 55 and 63 deg) and four isovelocity lengthening contractions (at 9.55, 19.1, 38.2 and 152.8 deg s−1) were applied in random order. These contractions were followed by another two lengthening contractions at 76.4 deg s−1 (from 44 to 63 deg, and from 36 to 55 deg thumb angle). The concentric and eccentric series of contractions in the fatigued state took less than 25 s, after which the cuff around the arm was deflated and the muscle was allowed to recover.
Recovery
Recovery was assessed at 6 min following deflation of the cuff. Either a concentric contraction at 152.8 deg s−1 (second test occasion) or, on the third test occasion, two eccentric contractions at 76.4 deg s−1 (from 44 to 63 deg and from 36 to 55 deg with 80 Hz stimulation frequency) were applied. In addition, on both test occasions, three isometric contractions (at thumb angles of 51, 55 and 63 deg) were studied, all applied in random order with 1 min rest in between.
Statistics
For eccentric contractions, the condition in which forces were obtained with 80 Hz stimulation frequency and with stretches from 44 to 63 deg thumb angle was defined as the standard condition. ANOVA for repeated measures was used for determination of statistical significance (P < 0.05). Simple contrasts were used to further analyse whether conditions were different, compared to the standard condition. Unless indicated otherwise, the results are presented as means ±s.e.m.
RESULTS
Fresh muscle
Figure 2 shows the force response to isovelocity stretches at 76.4 deg s−1 with 80 and 30 Hz stimulation. Similarly shaped force traces were obtained under all conditions. Following an initial relatively fast increase in force at the beginning of stretch, there was a later phase during which force increased linearly (r2 > 0.96) with the increase in the thumb angle until the end of the stretch.
After the stretch the isometric force declined to a value that was still greater than the isometric force attained at the longer muscle length (thumb angle) without a preceding stretch (Fig. 2). A portion of this additional force could be due to differences in the active and passive tensions at different muscle lengths. Based on the force-length (thumb angle) relationship obtained with 80 Hz stimulation (Fig. 1) and including both the active and passive force (component C in Fig. 3), an increase of 9.5 ± 1.3 N would be expected following a stretch from the 44 to 63 deg thumb angle (Fig. 1, •). However, the average isometric force difference (Fafter–Fbefore, the steady component) following a stretch at 76.4 deg s−1 was 15.6 ± 1.7 N. Thus, on top of the expected thumb angle-dependent force increase (component C in Fig. 3), there was an extra increase in isometric force of 6.1 ± 1.1 N (P < 0.05) following a stretch at 76.4 deg s−1, which is related to component B in the model (Fig. 3).
The traces from one subject (Fig. 2) show that reducing the activation in the fresh muscle reduced the transient component of the stretch response (Fpeak–Fafter) roughly in proportion to the reduction in initial isometric force (Fbefore). However, the steady component of the force enhancement following stretch appeared to be relatively unaffected by a decrease in the stimulation frequency. Combined data at one velocity of stretch (76.4 deg s−1) from all subjects and including both fresh and recovered muscles are shown in Fig. 4A (○). This shows the steady component to be independent of the initial isometric force over a broad range (from 54.8 ± 1.9 to 31.4 ± 1.7 N). The steady component varied from 14.8 ± 1.7 N, when stretched from 36 to 55 deg (no. 3 in Fig. 4A), to 17.3 ± 1.7 N for the recovered muscle stimulated at 30 Hz (no. 6 in Fig. 4A). Only this last value was significantly different from the standard condition (80 Hz stimulation frequency, stretches from 44 to 63 deg; no. 1 in Fig. 4A).
Figure 4. The effects of the isometric force level before stretch and stretch velocity on two different force components.
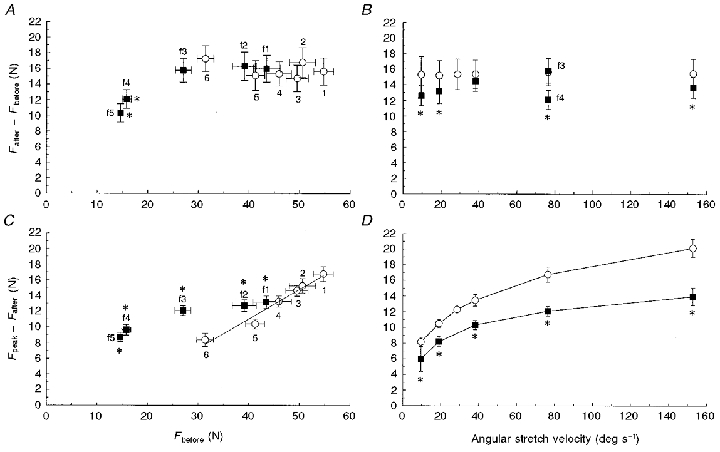
The dependency of the steady component (A and B) and the transient component (C and D) on Fbefore and stretch velocity, in the fresh (○) and fatigued (▪) muscle. See Figs 1 and 2 for explanations of Fbefore, Fafter and Fpeak. All data in A and C are from stretches at 76.4 deg s−1; the numbers indicate the different conditions used to vary Fbefore: 1, standard condition: stretches from 44 to 63 deg, 80 Hz stimulation; 2, from 44 to 63 deg, recovered muscle; 3, from 36 to 55 deg; 4, from 36 to 55 deg, recovered muscle; 5, from 44 to 63 deg, 30 Hz stimulation; 6, from 44 to 63 deg, 30 Hz stimulation, recovered muscle. f1, f2, f3, respectively, are from the 20th, 40th and 60th contraction during the fatigue protocol and f4 and f5 (stretches from 36 to 55 deg) are data from the last contractions in the fatigued state. Note the linear relationship between Fbefore and Fpeak–Fafter in the unfatigued muscle (C, 1-6): y = 0.38 x– 4.0 (r2= 0.97). *Significantly different from unfatigued value.
In contrast to the steady component, the transient component showed a significant linear relationship with initial isometric force (○, Fig. 4C; r2= 0.97) under the six different conditions in the fresh and recovered muscle.
The two components of the stretch response also differed with respect to their velocity dependency. Figure 4B (○) shows that the steady component was independent of stretch velocity, ranging from 15.2 ± 1.9 N (at 19.1 deg s−1) to 15.6 ± 1.7 N (at 76.4 deg s−1). In contrast, the transient component increased significantly with increasing stretch velocity (Fig. 4D), from 8.2 ± 0.6 N (at 9.6 deg s−1) to 20.2 ± 1.2 N (at 152.8 deg s−1). These findings are consistent with the transient component of the response being related to attached cross-bridges while the steady component is largely unrelated to cross-bridge activity.
Figure 5 shows an example of an additional experiment in which a fresh adductor pollicis muscle was stretched at a very low velocity (1.9 deg s−1, lasting 10 s). The isometric force following the stretch was considerably enhanced and the magnitude of this enhancement was similar to that following stretches at higher velocities (see also Fig. 2, which shows data obtained from the same subject). This finding illustrates that the steady component is seen even at the very lowest velocity of stretch and consequently appears not to decay appreciably whilst the muscle is active. Fpeak,however, was only slightly higher than Fafter, consistent with the velocity dependence of the transient component.
Figure 5. Force in response to stretch at 1.9 deg s−1.
Example of an additional experiment in which the adductor pollicis muscle was either stretched from 44 to 63 deg at a very low velocity (1.9 deg s−1; trace 1) or isometrically stimulated for the same duration at the 63 deg thumb angle (trace 2). Data are from the same subject as in Fig. 2. The top panel shows angular displacement. Stimulation (50 Hz) is indicated by the bar above the time axes. The last part of the force traces (middle panel) is shown enlarged in the bottom panel, where the arrow indicates the end of the stretch. Note that isometric force following the stretch (Fafter) was considerably enhanced compared to the isometric force without a preceding stretch (trace 2); also note that peak stretch force (Fpeak) was only 3.1 N higher than Fafter.
Fatigue
Stretch-induced force responses
Measurements made on the experimental day during which the eccentric data were collected are presented in Fig. 6. During the fatigue protocol both isometric and concentric force declined (phase 2, Fig. 6). After 6 min recovery, the forces were approximately back to baseline levels (phase 4, Fig. 6); isometric force at the 51 deg thumb angle (52.8 ± 2.7 N) was not significantly different from that of fresh muscle (55.6 ± 1.8 N). However, isometric force before stretch, that is at the 44 deg thumb angle (50.7 ± 2.6 versus 54.7 ± 2.0 N, P < 0.05), and force during the shortening contractions at 152.8 deg s−1 (24.0 ± 1.5 versus 25.2 ± 1.5 N, P < 0.05), had not completely recovered.
Figure 6. Force changes during the ischaemic fatigue protocol.
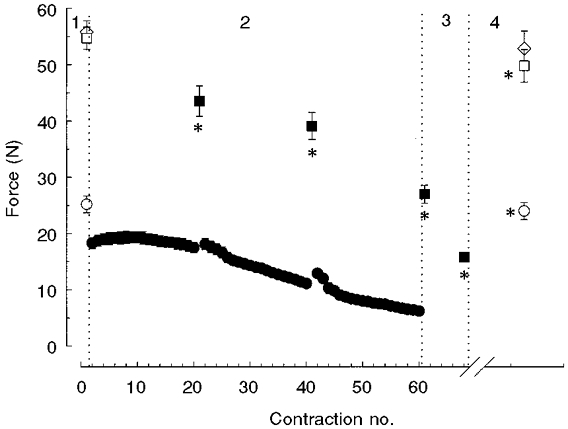
Concentric force during shortening at 152.8 deg s−1 (circles) and isometric force at the 44 deg thumb angle (squares) before (1, open symbols), during (2) the fatigue protocol, in the fatigued state (3) and following 6 min recovery (4, open symbols). Baseline values (1,4) for isometric force at the 51 deg thumb angle (open diamonds) are also shown. Note that the relatively low value for concentric force at the start of the fatigue protocol compared to the baseline value is due to the lower stimulation frequency (50 instead of 150 Hz) applied during the protocol. *Significantly different from the unfatigued value (1).
The effect of fatigue on the force profiles during stretch is illustrated for one subject in Fig. 7 (stretches at 76.4 deg s−1). During the course of the fatigue protocol there was a considerable loss of isometric force and relaxation became profoundly slower. Nevertheless, the response to stretch-induced force increase was relatively less affected (f1-f4 in Fig. 7).
Figure 7. Examples of force during and immediately following isovelocity stretches at 76.4 deg s−1 at different levels of fatigue.
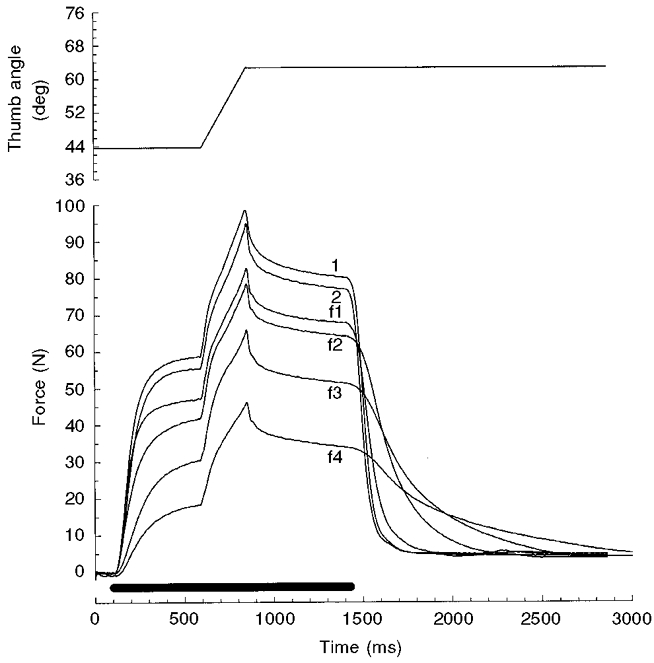
The six force traces are of one subject and illustrate the force responses in the unfatigued (1) and recovered (2) muscle, and during increasing fatigue (f1-f4). Traces f3 and f4, respectively, are the first and last contraction of the series applied following the fatigue protocol. Note the further reduction of force and the more pronounced slowing of relaxation in f4 compared to f3.
The results for all subjects are summarised in Fig. 4 (▪). During the fatigue protocol the isometric force before the stretch decreased significantly from 54.8 ± 1.7 N (no. 1 in Fig. 4A and C) to 27.0 ± 1.6 N (49.6 ± 3.0 %) during the first contraction at 76.4 deg s−1 in the fatigued state (f3 in Fig. 4A and C). Note that the steady component of the force increase (▪, Fig. 4A) remained constant despite the 50 % reduction in isometric force. However, during the last two contractions at 76.4 deg s−1, which were at the end of the series in the fatigued state (f4 and f5 in Fig. 4A), there was a significant reduction in the steady component. Small, but significant, fatigue-induced reductions were also found at the other velocities (▪, Fig. 4B). However, as with the findings in the fresh muscle (○), the steady component was independent of stretch velocity in the fatigued state.
The transient component increased significantly from 6.0 ± 1.6 N at 9.6 deg s−1 to 14.0 ± 1.0 N at 152.8 deg s−1 (▪, Fig. 4D), illustrating that the transient component increased with an increase in stretch velocity although the relationship differed between the fresh and fatigued muscles.
Force-velocity relationships
The complete force-velocity relationships of human adductor pollicis muscle are presented in Fig. 8A. The isometric force was 56.4 ± 2.6 N but with an increase in shortening velocity, concentric force decreased to 10.2 ± 0.7 N at 382.0 deg s−1 with Vmax being estimated as 852 ± 29 deg s−1 in the fresh muscle (□). In contrast, eccentric force increased with the increase in the stretch velocity to 74.3 ± 3.4 N at 152.8 deg s−1 (▪).
Figure 8. Force-velocity relationships of human adductor pollicis muscle.
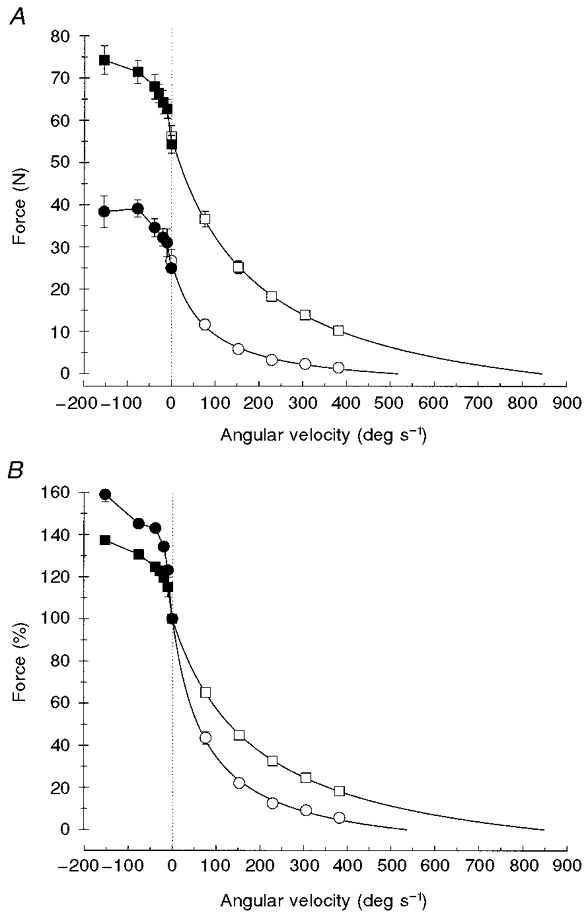
Force-velocity relationships for concentric (open symbols) and eccentric (filled symbols) contractions for unfatigued (squares) and fatigued muscle (circles), in absolute values (A) and relative to the maximal isometric force (B). Eccentric forces were calculated by subtracting the steady component (Fafter–Fbefore) from Fpeak. Note that the data obtained with stretches at 76.4 deg s−1 in the fatigued state were affected by a sequence effect (see text for explanation).
In the fatigued muscle (circles in Fig. 8A) forces were significantly reduced in all types of contraction. Isometric force and estimated maximal shortening velocity decreased to 27.0 ± 2.7 N and 540 ± 56 deg s−1, respectively. The index a/Po (where a is a constant and Po the maximal isometric force) also decreased significantly (from 0.23 ± 0.02 to 0.14 ± 0.03), indicating that the curvature of the concentric part of the relationship increased with fatigue.
Eccentric forces were also significantly lower during fatigue (Fig. 8A, •; see also Fig. 4D). However, relative to the maximal isometric force (Fbefore) the eccentric forces increased with fatigue (e.g. from 137.3 ± 1.5 to 159.0 ± 3.6 % at 152.8 deg s−1), whereas concentric forces remained reduced when expressed as a percentage of the maximal isometric force (○, Fig. 8B). Note that the relatively high value for the eccentric force at the stretch velocity of 76.4 deg s−1 during fatigue (•; Fig. 8A) is due to a sequence effect; 76.4 deg s−1 was always the first velocity tested in the fatigue state. The subsequent lengthening contractions (at the other velocities) were applied in random order (see Methods), each contraction adding to the fatigue. Thus, in the fatigued state, fatigue was somewhat less when the muscle was stretched at 76.4 deg s−1 and consequently eccentric force at 76.4 deg s−1 was relatively high compared to the other velocities (•, Fig. 8A). In addition, because fatigue affected isometric force more than eccentric force, eccentric force at 76.4 deg s−1 was relatively low when expressed as a percentage of the isometric force (Fig. 8B).
DISCUSSION
The present study is the first to investigate the complete force-velocity relationship of maximally activated intact human muscle in both fresh and fatigued states.
A particular interest was the force response to stretch and the results demonstrate two components: one (the steady component) that appears to be independent of activation and velocity and is not affected by fatigue, and a second (the transient component) that is proportional to activation, influenced by stretch velocity and affected by fatigue, as would be expected if it reflected some aspect of cross-bridge function. It is interesting that despite the presence of additional series compliance of the muscle-tendon complex working in vivo, the force responses are, at least qualitatively, similar to those reported for isolated preparations (Joyce et al. 1969; Edman et al. 1978, 1981; Sugi & Tsuchiya, 1988; Stienen et al. 1992; Edman & Tsuchiya, 1996; Herzog & Leonard, 1997).
Components of the stretch response
It was anticipated that in the intact muscle the contribution of series and parallel elastic structures to the total force response would be greater than that found in previous studies on isolated muscle fibres and it was important to see whether the type of analysis used for single fibres could be applied to a human muscle working in vivo. To separate the cross-bridge-related part of the response, we analysed our data using a (qualitative) model based on the work of Edman and co-workers, as described by Noble (1992). We have used the isometric force difference (Fafter–Fbefore) as a measure of the steady part of the stretch-induced force increase (components B and C in the model), which was assumed not to depend on cross-bridge activity. Two of the present findings support this assumption. Firstly, the steady component did not change over a 50 % range of force reduction brought about by reducing the number of attached cross-bridges at the start of stretch (Fig. 4A). Secondly, the steady component was independent of stretch velocity (Fig. 4B). The results in Figs 2 and 5 demonstrate that the effect must decay very slowly, if at all, whilst the muscle remains active. These features make it highly unlikely that the mechanisms underlying the steady component of the force enhancement are a function of the cross-bridge activity.
In the present model there are two different components (B and C) which together determine the magnitude of the steady component. Component C is the change in active and passive force associated with the thumb angle-dependent change in filament overlap. Component C accounted for approximately 60 % of the steady component, the remaining 40 % being related to component B of our model.
In relation to component B, it has been suggested (Edman & Tsuchiya, 1996) that it arises from the recruitment of parallel elastic structures during stretch, which may support weaker sarcomeres that are pulled out by stronger sarcomeres in series (Morgan, 1990). The ‘popping’ (weaker) sarcomeres could, in theory, take up some or all of the imposed length change with structures such as titin filaments transmitting the force generated by the shorter/stronger sarcomeres thus generating a greater force than expected for the overall length of the muscle (Morgan, 1994). There is growing evidence that sarcomere non-uniformity occurs during a stretch (for references see Morgan, 1994) and this provides a reasonable explanation for the origins of the steady component on the right-hand descending limb of the length-tension relationship. However, in the present experiments muscles were stretched on the ascending limb of their length-force relationship and consequently the steady component can only be explained in this fashion if it is assumed that there is considerable variation in fibre lengths and that a significant population of fibres are being stretched on the descending limb of their length-force relationship. Whatever the exact mechanism behind the isometric force increase, our findings that the steady component is independent of stretch velocity, and to a considerable extent of force, support the proposition that the steady component is essentially independent of cross-bridge properties.
The relatively rapid force increase at the beginning of the stretch in the present study is comparable with that found in other preparations (Joyce et al. 1969; Edman et al. 1978, 1981; Sugi & Tsuchiya, 1988; Stienen et al. 1992; Edman & Tsuchiya, 1996; Herzog & Leonard, 1997). It is interesting to note that in the single fibre preparations, such as those used by Edman and co-workers (1978, 1981), where external compliances would have been minimal, the force traces reached a plateau shortly after the start of the stretch. However, in the study of Joyce et al. (1969) in which a cat muscle preparation was used, where there would have been appreciable external compliance, the force response continued to increase after the initial rapid response to stretch, much as seen in our present work. This transient component (component A, in our model) of the total force increase is probably caused by attached cross-bridges being, on average, stretched or distorted, compared to the population of attached cross-bridges during an isometric contraction. If, indeed, the transient component arises from cross-bridge interactions it would be expected to depend on the number of attached cross-bridges and on stretch velocity. We have taken Fpeak–Fafter as a measure for the transient component and, in agreement with our hypothesis, the transient component decreased when the number of force-generating cross-bridges was reduced (Fig. 4C) and increased with increasing stretch velocity (Fig. 4D).
In the present experiments, the maximum eccentric force was 137.3 ± 1.5 % of the isometric force and it was obtained when the muscle was stretched at 152.8 deg s−1 (Fig. 8). This is unlikely to be the true maximum since it is evident in Fig. 4D that force continued to increase at the highest velocities. However, mechanical constraints of the apparatus meant that 152.8 deg s−1 was the highest velocity that could be used. The 37.3 % additional force achieved compares with values for isolated fibre preparations of between 50 and 100 % (Edman et al. 1978; Lombardi & Piazzesi, 1990; Stienen et al. 1992; Curtin & Edman, 1994). In whole muscle preparations values are usually about 50 % (Flitney & Hirst 1978; Harry et al. 1990). Nevertheless, the 37 % increase in the present study is higher than that reported for voluntary eccentric contractions in humans (Thomson & Chapman, 1988; Dudley et al. 1990; Westing et al. 1990; Webber & Kriellaars, 1997). It is important to note that the range of values for the eccentric force in the literature is partly due to the different methods used to calculate it. In principle, there are a number of ways to proceed and the method used should depend on the objective of the study. We have chosen to express the peak of the transient component (Fpeak) relative to the isometric force obtained before the stretch, which is comparable to what has been done by others (e.g. Curtin & Edman, 1994). However, because we aimed to obtain concentric and eccentric force-velocity relationships, which would reflect cross-bridge function, we corrected for the steady component of the stretch-induced force enhancement; Fafter–Fbefore was subtracted from Fpeak. Nevertheless, it is obvious that in consideration of human performance (see below), the total (uncorrected) force is of relevance. Not correcting our data for the steady component of the force enhancement would have increased eccentric force relative to the isometric force; consequently, the eccentric parts of the force-velocity relationships, especially in the fatigued muscle (see ‘Effects of fatigue’), would have been shifted upwards.
Stretching active muscles is a normal part of daily activity whether it be in absorbing energy when landing from a jump or stepping down, lowering an object or body weight, or controlling limb position when working against an antagonist muscle. Consequently it is of interest to consider how cross-bridges and other components contribute to this important aspect of performance. When the fresh muscle was stretched at 76.4 deg s−1 the steady and transient (cross-bridge-related) components of the stretched-induced force increase were of about the same size (respectively, 15.6 ± 1.7 and 16.8 ± 1.0 N). At slower stretches the relative contribution of the steady component increased (compare Fig. 4B and D, see also Fig. 5). In addition, large amplitude stretches will emphasise the non-cross-bridge (steady) component while small rapid stretches will largely reflect cross-bridge function. Clearly the steady component plays a major role in the overall response to stretch of intact muscle-tendon complexes. Not only does this component increase the peak force resisting stretch but there is evidence that this additional force can help maintain force during subsequent shortening contractions (Ettema et al. 1992).
Force-velocity relationship
The concentric part of the force-velocity relationship reported here is very similar to that obtained in our previous study (De Ruiter et al. 1999) although in the present study the curvature of the relationship (a/Po) tended to be somewhat higher (0.23 ± 0.02, compared to 0.28 ± 0.04 obtained previously) and Vmax (852 ± 29 deg s−1) was relatively high compared to our previous findings (773 ± 73 deg s−1). These differences are most probably caused by the higher stimulation frequencies used at the faster velocities of shortening (300 instead of 80 Hz) (de Haan, 1998; see Methods).
The adductor pollicis has a complex architecture with fibres that vary in length so it is impossible to translate the angular displacements given here into accurate muscle lengths. However, assuming an overall muscle length of 4.5 cm and an average fibre length of one-half of that, then the maximum velocity of shortening for the fresh muscle in Fig. 8 represents about 6 muscle lengths s−1 or 12 fibre lengths s−1; corresponding values in fatigued muscle were 3.8 muscle lengths s−1 and 7.5 fibre lengths s−1. Likewise the maximum velocity of stretch used in these experiments was about 2 fibre lengths s−1.
Effects of fatigue
As a result of the fatigue protocol, isometric force decreased by 50 % whilst the decrease in concentric forces was very dependent on the velocity of shortening, preferentially decreasing at higher velocities as a consequence of the reduction in Vmax and increased curvature. The decrease in the transient component during stretch was less than that of isometric force (e.g. Fig. 7) and consequently when eccentric force is expressed as a percentage of isometric force, the fatigued muscle sustained relatively greater forces than the fresh muscles (Fig. 8B). The highest value (159.0 ± 3.6 %) was obtained when the fatigued muscle was stretched at 152.8 deg s−1. Note that if we had not corrected Fpeakfor the steady component, the relative eccentric force at 152.8 deg s−1 would have been considerably higher (219.4 ± 10.3 %). It seems likely that, had we been able to achieve a faster stretch, the eccentric force would have continued to increase and possibly plateau. What would be interesting to know is whether, given a sufficiently high velocity of stretch, both fresh and fatigued muscles would have reached the same high plateau of force, expressed as a percentage of isometric force.
We are not aware of other studies on the eccentric part of the force-velocity relationship of in vivo human muscle during fatigue. Curtin & Edman (1994) with frog muscle also found that eccentric force production was less affected by fatigue than concentric force production, during moderate fatigue (26 % decrease of isometric force) in isolated frog fibre. The present study expands that earlier observation by finding similar results for intact human muscle, not only for moderate but also more severe fatigue (isometric force loss > 50 %).
Curtin & Edman (1994) suggest two possible causes of the relative preservation of eccentric force during fatigue. The first is the existence of cross-bridges that are attached but in a low force state, possibly as a result of increased intracellular inorganic phosphate. These cross-bridges would contribute little to the isometric force but would increase the stiffness of the muscle and provide additional force when stretched. The problem with this explanation is that it explains an initial increase in force, but as the stretch continues and cross-bridges are forcibly detached, it is difficult to see why cross-bridges that were formerly attached in the low force state should behave any differently from cross-bridges that were previously in the high force state. The second possibility is that in the fatigued state cross-bridges are cycling more slowly. This could account for both the decrease in force seen with concentric contractions and the increase in eccentric force. If cross-bridge cycling is slowed with fatigue there should be an increase in the economy of maintaining isometric force. There is some evidence that this might be the case (Fig. 5 of Hultman & Sjöholm, 1983; Westra et al. 1988) but much more evidence is required to prove a causal relationship between changes in cross-bridge cycling and the observed changes in the force-velocity relationship.
To summarise, we have demonstrated that the response of stimulated human muscle in vivo to stretch can be divided into two major components. The steady component persists after the stretch, and is concluded to arise from structures other than the cross-bridges because it was not affected by the velocity of the stretch, the number of attached cross-bridges or by fatigue. The transient component of the force response has characteristics that are consistent with cross-bridge function, being dependent on the level of activation and velocity of stretch. It is likely that both components of the stretch response make a significant contribution to muscle performance, the precise proportions depending on the speed and length of the stretch. As a result of acute fatigue the muscle's capacity to sustain force during stretch was better preserved than the ability to generate isometric force while concentric force production showed the greatest decline. These findings are consistent with slower cross-bridge cycling in fatigued muscles but this is by no means proven, and there remain interesting questions to be answered about the metabolic correlates of changes in the force-velocity relationship with fatigue.
References
- Abbott BC, Aubert XM. The force exerted by active striated muscle during and after change of length. The Journal of Physiology. 1952;117:77–86. [PMC free article] [PubMed] [Google Scholar]
- Allen DJ, Lee JA, Westerblad H. Intracellular calcium and tension during fatigue in isolated single muscle fibres from Xenopus laevis. The Journal of Physiology. 1989;415:433–458. doi: 10.1113/jphysiol.1989.sp017730. [DOI] [PMC free article] [PubMed] [Google Scholar]
- Cook CS, McDonagh MJN. Force responses to controlled stretches of electrically stimulated human muscle-tendon complex. Experimental Physiology. 1995;80:477–490. doi: 10.1113/expphysiol.1995.sp003862. [DOI] [PubMed] [Google Scholar]
- Curtin NA, Edman KAP. Force-velocity relation for frog muscle fibres: effects of moderate fatigue and intracellular acidification. The Journal of Physiology. 1994;475:483–494. doi: 10.1113/jphysiol.1994.sp020087. [DOI] [PMC free article] [PubMed] [Google Scholar]
- De Haan A. The influence of stimulation frequency on force-velocity characteristics of in situ rat medial gastrocnemius muscle. Experimental Physiology. 1998;83:77–84. doi: 10.1113/expphysiol.1998.sp004093. [DOI] [PubMed] [Google Scholar]
- De Haan A, Van Doorn JE, Sargeant AJ. Age-related changes in power output during repetitive contractions of rat medial gastrocnemius muscle. Pflügers Archiv. 1988;412:665–667. doi: 10.1007/BF00583770. [DOI] [PubMed] [Google Scholar]
- De Ruiter CJ, De Haan A, Jones DA, Sargeant AJ. Shortening-induced force depression in human adductor pollicis muscle. The Journal of Physiology. 1998;507:583–591. doi: 10.1111/j.1469-7793.1998.583bt.x. [DOI] [PMC free article] [PubMed] [Google Scholar]
- De Ruiter CJ, Jones DA, Sargeant AJ, De Haan A. The measurement of force/velocity relationships of fresh and fatigued human adductor pollicis muscle. European Journal of Applied Physiology. 1999;80:386–393. doi: 10.1007/s004210050608. [DOI] [PubMed] [Google Scholar]
- Dudley GA, Harris RT, Duvoisin MR, Hather BM, Buchanan P. Effect of voluntary vs. artificial activation on the relationship of muscle torque to speed. Journal of Applied Physiology. 1990;69:2215–2221. doi: 10.1152/jappl.1990.69.6.2215. [DOI] [PubMed] [Google Scholar]
- Edman KAP, Elzinga G, Noble MIM. Enhancement of mechanical performance by stretch during tetanic contractions of vertebrate skeletal muscle fibres. The Journal of Physiology. 1978;281:139–155. doi: 10.1113/jphysiol.1978.sp012413. [DOI] [PMC free article] [PubMed] [Google Scholar]
- Edman KAP, Elzinga G, Noble MIM. Critical sarcomere extension required to recruit a decaying component of extra force during stretch in tetanic contractions of frog skeletal muscle fibers. Journal of General Physiology. 1981;78:365–382. doi: 10.1085/jgp.78.4.365. [DOI] [PMC free article] [PubMed] [Google Scholar]
- Edman KAP, Tsuchiya T. Strain of passive elements during force enhancement by stretch in frog muscle fibres. The Journal of Physiology. 1996;490:191–205. doi: 10.1113/jphysiol.1996.sp021135. [DOI] [PMC free article] [PubMed] [Google Scholar]
- Ettema GJC, Huijing PA, De Haan A. The potentiating effect of prestretch on the contractile performance of rat gastrocnemius medialis muscle during subsequent shortening and isometric contractions. Journal of Experimental Biology. 1992;165:121–136. doi: 10.1242/jeb.165.1.121. [DOI] [PubMed] [Google Scholar]
- Flitney FW, Hirst DG. Cross-bridge detachment and sarcomere ‘give’ during stretch of active frog's muscle. The Journal of Physiology. 1978;276:449–465. doi: 10.1113/jphysiol.1978.sp012246. [DOI] [PMC free article] [PubMed] [Google Scholar]
- Harry JD, Ward AW, Heglund NC, Morgan DL, McMahon TA. Crossbridge cycling theories cannot explain high-speed lengthening behaviour in frog muscle. Biochemical Journal. 1990;57:201–208. doi: 10.1016/S0006-3495(90)82523-6. [DOI] [PMC free article] [PubMed] [Google Scholar]
- Herzog W, Leonard TR. Depression of cat soleus forces following isokinetic shortening. Journal of Biomechanics. 1997;30:865–872. doi: 10.1016/s0021-9290(97)00046-8. [DOI] [PubMed] [Google Scholar]
- Hill AV. The heat of shortening and the dynamic constants of muscle. Proceedings of the Royal Society. 1938;B126:136–195. doi: 10.1098/rspb.1949.0019. [DOI] [PubMed] [Google Scholar]
- Hultman E, Sjöholm H. Energy metabolism and contraction force of human skeletal muscle in situ during electrical stimulation. The Journal of Physiology. 1983;345:525–532. doi: 10.1113/jphysiol.1983.sp014994. [DOI] [PMC free article] [PubMed] [Google Scholar]
- James C, Sacco P, Jones DA. Loss of power during fatigue in human leg muscles. The Journal of Physiology. 1995;484:237–246. doi: 10.1113/jphysiol.1995.sp020661. [DOI] [PMC free article] [PubMed] [Google Scholar]
- Joyce GC, Rack PMH, Westbury DR. The mechanical properties of cat soleus muscle during controlled lengthening and shortening movements. The Journal of Physiology. 1969;204:461–474. doi: 10.1113/jphysiol.1969.sp008924. [DOI] [PMC free article] [PubMed] [Google Scholar]
- Katz B. The relation between force and speed in muscular contraction. The Journal of Physiology. 1939;96:45–64. doi: 10.1113/jphysiol.1939.sp003756. [DOI] [PMC free article] [PubMed] [Google Scholar]
- Lombardi V, Piazzesi G. The contractile reponse during steady lengthening of stimulated frog muscle fibres. The Journal of Physiology. 1990;431:141–171. doi: 10.1113/jphysiol.1990.sp018324. [DOI] [PMC free article] [PubMed] [Google Scholar]
- Morgan DL. New insights into the behaviour of muscle during active lengthening. Biophysical Journal. 1990;57:209–221. doi: 10.1016/S0006-3495(90)82524-8. [DOI] [PMC free article] [PubMed] [Google Scholar]
- Morgan DL. An explanation for the residual increased tension in striated muscle after stretch during contraction. Experimental Physiology. 1994;79:831–838. doi: 10.1113/expphysiol.1994.sp003811. [DOI] [PubMed] [Google Scholar]
- Noble MIM. Enhancement of mechanical performance of striated muscle by stretch during contraction. Experimental Physiology. 1992;77:539–552. doi: 10.1113/expphysiol.1992.sp003618. [DOI] [PubMed] [Google Scholar]
- Stienen GJM, Versteeg PGA, Papp Z, Elzinga G. Mechanical properties of skinned rabbit psoas and soleus muscle fibres during lengthening: effects of phosphate and Ca2+ The Journal of Physiology. 1992;451:503–523. doi: 10.1113/jphysiol.1992.sp019176. [DOI] [PMC free article] [PubMed] [Google Scholar]
- Sugi H, Tsuchiya T. Stiffness changes during enhancement and deficit of isometric force by slow length changes in frog skeletal muscle fibres. The Journal of Physiology. 1988;407:215–229. doi: 10.1113/jphysiol.1988.sp017411. [DOI] [PMC free article] [PubMed] [Google Scholar]
- Thomson DB, Chapman AE. The mechanical response of active human muscle during and after stretch. European Journal of Applied Physiology. 1988;57:691–697. doi: 10.1007/BF01075990. [DOI] [PubMed] [Google Scholar]
- Webber S, Kriellaars D. Neuromuscular factors contributing to in vivo eccentric moment generation. Journal of Applied Physiology. 1997;83:40–45. doi: 10.1152/jappl.1997.83.1.40. [DOI] [PubMed] [Google Scholar]
- Westerblad H, Allen DG. The contribution of [Ca2+]i to the slowing of relaxation in fatigued single fibres from mouse skeletal muscle. The Journal of Physiology. 1993;468:729–740. doi: 10.1113/jphysiol.1993.sp019797. [DOI] [PMC free article] [PubMed] [Google Scholar]
- Westerblad H, Bruton JD, Lännergren J. The effect of intracellular pH on contractile function of intact, single fibres of mouse muscle declines with increasing temperature. The Journal of Physiology. 1997;500:193–204. doi: 10.1113/jphysiol.1997.sp022009. [DOI] [PMC free article] [PubMed] [Google Scholar]
- Westing SH, Cresswell AG, Thorstensson A. Muscle activation during maximal voluntary eccentric and concentric knee extension. European Journal of Applied Physiology. 1991;62:104–108. doi: 10.1007/BF00626764. [DOI] [PubMed] [Google Scholar]
- Westing SH, Seger JY, Karlson E, Ekblom B. Eccentric and concentric torque-velocity characteristics of the quadriceps femoris in man. European Journal of Applied Physiology. 1988;58:100–104. doi: 10.1007/BF00636611. [DOI] [PubMed] [Google Scholar]
- Westing SH, Seger JY, Thorstensson A. Effects of electrical stimulation on eccentric and concentric torque-velocity relationships during knee extension in man. Acta Physiologica Scandinavica. 1990;140:17–22. doi: 10.1111/j.1748-1716.1990.tb08971.x. [DOI] [PubMed] [Google Scholar]
- Westra HG, De Haan A, Van Doorn JE, De Haan EJ. Anaerobic energy changes and mechanical output during tetani of rat muscle in situ. Pflügers Archiv. 1988;412:121–127. doi: 10.1007/BF00583740. [DOI] [PubMed] [Google Scholar]