

Abstract
Acetyl phosphate (acetyl-P) serves critical roles in coenzyme A recycling and ATP synthesis. It is the intermediate of the Pta-AckA pathway that inter-converts acetyl-coenzyme A and acetate. Acetyl-P also can act as a global signal by donating its phosphoryl group to specific two-component response regulators. This ability derives from its capacity to store energy in the form of a high-energy phosphate bond. This bond, while critical to its function, also destabilizes acetyl-P in cell extracts. This lability has greatly complicated biochemical analysis, leading in part to widely varying acetyl-P measurements. We therefore developed an optimized protocol based on two-dimensional thin layer chromatography that includes metabolic labeling under aerated conditions and careful examination of the integrity of acetyl-P within extracts. This protocol results in greatly improved reproducibility, and thus permits precise measurements of the intracellular concentration of acetyl-P, as well as that of other small phosphorylated molecules.
Keywords: Phosphoric Acid Esters; Chromatography, Thin Layer
Introduction
Acetyl phosphate (acetyl-P) is the high-energy intermediate of the reversible Pta-AckA pathway (Fig. 1). The Pta-AckA pathway inter-converts acetyl-coenzyme A (acetyl-CoA), ADP, and inorganic phosphate (Pi) with acetate, coenzyme A (HS-CoA) and ATP. When functioning in the direction of acetate synthesis, this pathway serves three functions: 1) to incorporate Pi, 2) to recycle coenzyme A (HS-CoA) and 3) to produce ATP. This synthesis of ATP relies on the ability of acetyl-P to store, in the form of its high-energy phosphate bond, about fifty percent more energy than ATP (reviewed by (1)).
Fig. 1.
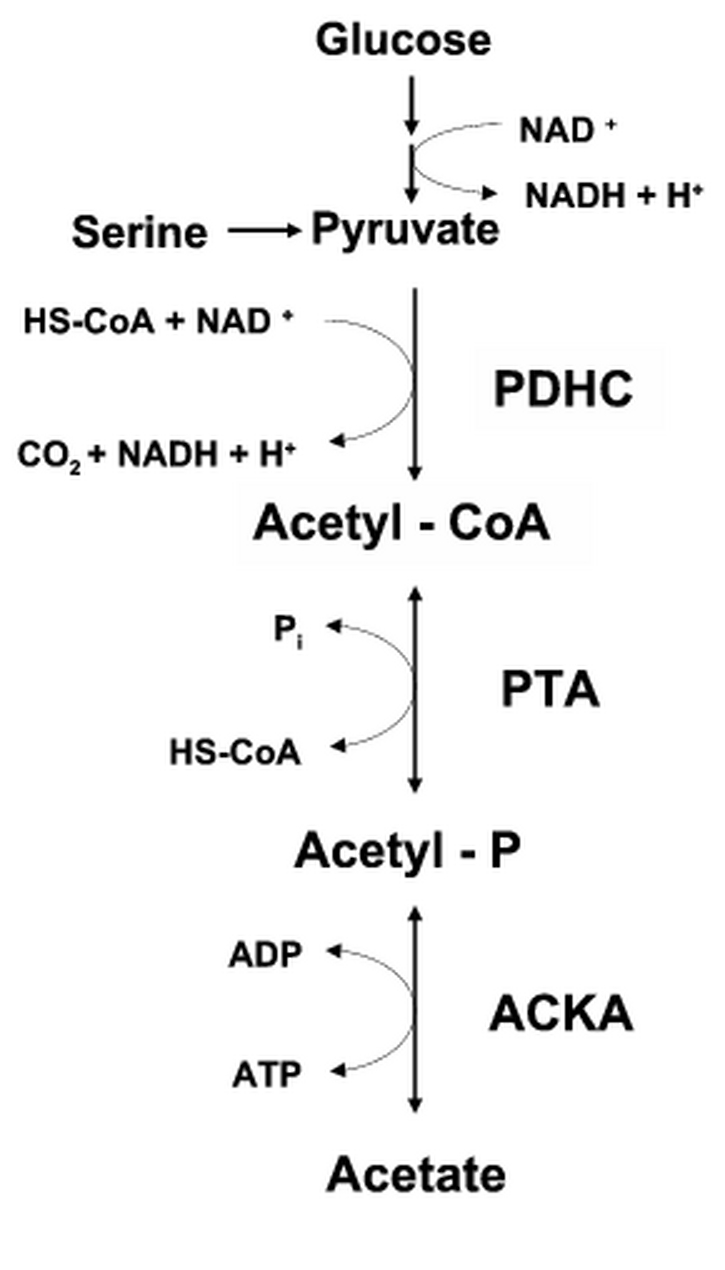
The PDHC-PTA-ACKA pathway: Glucose and serine (the preferred sugar and amino acid carbon sources of E. coli) are metabolized to pyruvate. The pyruvate is converted to acetyl-CoA through the action of pyruvate dehydrogenase complex (PDHC). The acetyl-CoA is converted to acetyl-P by phosphotransacetylase (PTA) and the acetyl-P is converted to acetate by acetate kinase (ACKA). HS-CoA, coenzyme A; NAD+ and NADH, oxidized and reduced forms of nicotinamide adenine dinucleotide; Pi, inorganic phosphate.
The ability of acetyl-P to store energy also forms the basis for a fourth proposed role: to act as a global signal. Several lines of evidence suggest a role for acetyl-P in global regulation in diverse species. For example, in Escherichia coli K-12, acetyl-P regulates the biosynthesis of flagella, capsule and likely type 1 pili (2, 3). These surface organelles are virulence factors intimately involved in the development of biofilms (reviewed by (4)). Thus, it is perhaps not surprising that mutants of E. coli that lack either Pta and/or AckA build defective biofilms (3). In Listeria monocytogenes, acetyl-P has been implicated in the activation of VirR, a global regulator required for virulence in mice (5). In Vibrio cholerae, pta mutants that cannot synthesize acetyl-P do not produce the toxin-coregulated pilus, colonize mice poorly, and exhibit reduced virulence (6). Likewise, pta mutants of Salmonella enterica are attenuated (7), perhaps because they are defective for acid tolerance (8).
Acetyl-P was hypothesized to function as a signal by donating its phosphoryl group to a subset of response regulators (RR) of the family of two-component signal transduction (2CST) pathways (9, 10). The validity of this hypothesis is of critical importance because most human pathogens possess both 2CST pathways critical to the regulation of virulence factors and the capacity to synthesize acetyl-P. Furthermore, humans do not possess either 2CST pathways or the ability to produce acetyl-P, making this proposed regulatory system a prime candidate for anti-microbial therapies.
Although it was proposed more than a decade ago, and despite a wealth of supportive data, the mechanism of acetyl-P signaling had until recently remained unclear (reviewed by (1)). There were two prime reasons for this uncertainty. First, direct observation in vivo of RR phosphorylation is extremely challenging. Second, the genetic experiments performed in lieu of this direct demonstration had been less than definitive.
Recently, Wolfe and co-workers used epistasis analysis, a powerful genetic approach, to provide definitive evidence that acetyl-P functions as a global signal through a mechanism involving RcsB (2), a RR known to control about 5% of the E. coli genome (4, 10) and up to 20% of the Salmonella enterica genome, including many virulence genes (12). However, this study was unable to determine whether acetyl-P functioned as a global signal through direct phosphorylation of RRs, or through an indirect mechanism. Much of the confusion regarding the mechanism of acetyl-P function results from uncertainty regarding its intracellular concentration. Previous studies had reported varying concentrations of intracellular acetyl-P, most of which appeared insufficient to allow function through direct phosphorylation (13-17). However, acetyl-P can be quite labile and we hypothesized that this lability could have led to a significant underestimate of its intracellular concentration. Because two-dimensional thin layer chromatography (2D-TLC) permits direct observation of acetyl-P, we used this approach to carefully measure the intracellular acetyl-P concentration and found that it can reach levels that are considerably higher than previously reported (18). As part of this study, we optimized the assay designed by Bochner and Ames (19, 20) and adapted by McCleary and Stock (14). By carrying out the labeling under aerated conditions that are typical of physiological experiments, and by developing means to monitor the overall stability of acetyl-P within our extracts, we were able to greatly improve the accuracy and reproducibility of acetyl-P measurements that had hampered interpretation of previous reports (13-17). In this report, we provide an in-depth methods supplement to our optimized 2D-TLC protocol, which can be used to monitor acetyl-P and other small, phosphorylated compounds.
Materials and Methods
Bacterial strain
All bacterial strains used in this study are derivatives of E. coli K-12. The parent strain, AJW678, is wild-type (WT) for acetate metabolism (21). The mutant strains AJW1939 (ackA; (21)), AJW2013 (pta ackA; (3)), CP904 (pta; (13)) and AJW1781 (acs; (22)) are isogenic derivatives of AJW678. ackA mutants are defective for the degradation of acetyl-P, pta mutants are defective its synthesis, pta ackA mutants are defective for both, and acs mutants are defective for the assimilation of small amounts of acetate (1).
Media and growth conditions
Cells were grown on LB plates containing 1% (w/v) tryptone, 0.5% (w/v) yeast extract, 0.5% (w/v) NaCl, and 1.5% (w/v) bacto agar. When necessary, either kanamycin (40 μg/ml) or tetracycline (15 μg/ml) was added to the growth medium.
10x MOPS salts were prepared as described (23) with the exception of K2HPO4. To facilitate the uptake of [32Pi] during metabolic labeling, the K2HPO4 concentration in MOPS salts was reduced to a final concentration of 0.2 mM (19) (referred to as mMOPS). mMOPS medium was prepared by supplementing 1x mMOPS salts with 0.8% sodium pyruvate and 10 μg/ml thiamine. Because the parent strain AJW678 and its derivatives are auxotrophic for L-threonine, L-histidine, L-leucine, and L-methionine, these amino acids were added to a final concentration of 100 μg/ml
Labeling of cells
All cultures were incubated at 37°C and shaken at 250 rpm. For cells grown under microaerophilic conditions, overnight cultures were diluted to an OD600 of approximately 0.03 in sufficient media to fill approximately 70-80% of a 12 x 75 mm test-tube, unless noted otherwise. This provided adequate culture for sampling without reducing the culture volume to less than 30% of the total tube volume. For cells grown under aerobic conditions, 10 ml of media and 150 ml flasks were used. Each experiment utilized two parallel cultures. One culture was labeled with 30 μCi/ml [32Pi] (carrier free in dilute HCl, pH 2-3, GE Healthcare, Piscataway, NJ), while the parallel culture was used to ascertain the OD600. All cultures were shaken approximately 1.5 hrs prior to initiation of sampling (18).
Preparation of labeled extracts
100 μl aliquots were collected from [32Pi]-labeled cultures at 35 - 90 min intervals, unless noted otherwise. Each sample was then placed into a 1.5 ml microcentrifuge tube with 10 μl ice-cold 11 N formic acid (Fisher, Hanover Park, IL). The formic acid stops metabolism, lyses cells, and stabilizes small, phosphorylated compounds (19).
Following incubation in an ice bath for 30 min, unincorporated Pi was precipitated by the addition of 16.5 μl precipitate solution (200 mM sodium-tungstate, 200 mM tetraethylammonium-HCl, 50 mM procaine) as described previously (20). Samples were either immediately subjected to analysis by 2D-TLC or flash frozen in an ethanol/dry ice bath and stored at -20°C. Frozen samples were thawed for about 5 min until the solution became viscous. The sample was then subjected to centrifugation at 4°C and 15,800 X g for 15 min. The supernatant (100 μl) was immediately neutralized by the addition of 8 μl of 2-picoline (19) and the samples were stored at -20°C until separation by 2D-TLC.
Two-dimensional thin layer chromatography (2D-TLC)
Unless stated otherwise, separation of acetyl-P was carried out on EMD PEI cellulose-F plates (EMD Chemicals, La Jolla, CA). At the lower left corner of a 10 cm x 10 cm plate, a 5 μl sample was spotted and allowed to dry for 40 min under the fume hood. The plate was then taken by the margin corner, immersed in methanol, and agitated 8-9 times. The plate was removed from the methanol and shaken gently to remove the excess methanol. This washing process was repeated twice more, and the plate allowed to dry under the hood for 40 min. The plate was then subjected to 2D-TLC according to McCleary and Stock (14). The first dimension consisted of 0.52 M LiCl (Mallinckrodt, Phillipsburg, NJ) and 1% (v/v) glacial acetic acid (Fisher, Hanover Park, IL); the second dimension consisted of 1.0 M ammonium acetate and 0.35 M ammonium chloride (Sigma, St. Louis, MO) that had been adjusted to pH 3.5 with glacial acetic acid. Plates were developed in the first dimension for 45 min, dried for 40 min in the fume hood, immersed in methanol for 15 min, allowed to dry in the fume hood, and subjected to development in the second dimension for 90 min.
Quantification of incorporated 32P
After development in both dimensions, plates were thoroughly dried (1 h) in the fume hood. Radioactivity was detected by exposure to a phosphor screen for 18-24 hrs and by scanning at a resolution of 100 μm on a Typhoon 8600 Variable Mode Imager (Molecular Dynamics Inc., Sunnyvale, CA). Analysis was performed using the bundled ImageQuant software without background correction. Because of uncertainty regarding changes in abundance of particular metabolites under the differing growth conditions, the radioactivity corresponding to acetyl-P or Pi was calculated as the percentage of the total radioactivity present on the TLC plate (18 ).
Determining the position of acetyl-P on a 2D-TLC Plate
The migration during 2D-TLC of acetyl-P and Pi derived from E. coli extracts was determined by comparison to synthetic acetyl-[32P], which was prepared as described (14). The synthetic acetyl-[32P] was precipitated to remove the unincorporated [32Pi], the supernatant liquid diluted 1:1000, and divided into 5 μL aliquots, and processed by 2D-TLC as described above.
Fig. 2.
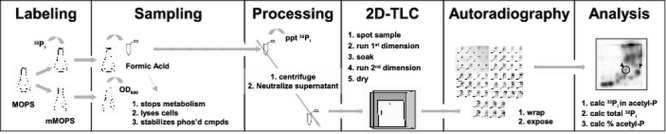
Schematic of the procedure. An overnight culture is grown in MOPs media supplemented with the desired carbon source. In the morning, two parallel mMOPS cultures are prepared: one "hot" and one "cold". The "hot" culture is supplemented with [32Pi] and is used to continuously label the cells. The "cold" culture is used to monitor growth in terms of optical density at 600 nm (OD600) and is prepared such that the surface:volume ratio remains identical to that of the "hot" culture throughout the entire sampling process. At regular intervals, a 100 μl sample is removed from the"hot" culture and immediately dispensed into 10 μl of 11 N formic acid. The formic acid stops metabolism, lyses the cells, and stabilizes phosphorylated compounds. The sample is then processed, precipitating the unincorporated [32Pi], centrifuging the precipitant, and neutralizing the supernatant fluid. 10 μl of the supernatant is applied to one corner of a TLC plate and permitted to dry. The plate is then rinsed with methanol, thoroughly dried, and immersed in the first dimension solvent. After development in the first dimension, the plate is soaked in methanol, allowed to thoroughly dry, turned 90 degrees, and immersed in the second dimension solvent. After development in the second dimension, the plate is removed, soaked in methanol and allowed to thoroughly dry. The plate is wrapped and exposed to a phosphorimager screen overnight. The plate is scanned and the percentage of acetyl-P is calculated by dividing the amount of signal corresponding to acetyl-P by the total signal.
Results and Discussion
Choice of assay
Our studies of the interaction between acetyl-P and 2CST pathways required the development of an accurate, reproducible method to quantify the intracellular concentration of acetyl-P in WT cells, as well as in mutants defective in acetate metabolism. Although multiple techniques had been reported for the measurement of acetyl-P (13-17), we utilized a modified version of the method developed by Bochner and Ames (14, 19, 20). A major advantage of this method is that it allows for the rapid direct identification of acetyl-P, which is particularly important due to the instability of the molecule. Furthermore, it permits the identification and measurement of other small, phosphorylated molecules (such as acetyl-CoA and ATP), which allows direct comparison of acetyl-P to other key metabolic intermediates.
Choice of medium
The methodology employed by Bochner and Ames (19) requires the labeling of cells with [32Pi]. Small, phosphorylated molecules are then extracted, fractionated by 2D-TLC, and detected by phosphorimaging. The medium used in these experiments (referred to as complete MOPS; (23)) contains sufficient phosphate (1.32 mM) to prevent efficient labeling with [32Pi]. Therefore, we reduced the concentration of K2HPO4 in MOPS minimal media to 0.2 mM (referred to as mMOPS), which supported growth at the same rate and to nearly the same optical density as cells grown in complete MOPS (18).
Choice of labeling procedure
Previous reports involving this methodology utilized cells that were labeled in the absence of shaking. For example, Bochner and Ames added [32Pi] to a static culture, from which samples were removed on a periodic basis for analysis (19). In contrast, McCleary and Stock grew cells under shaking conditions, but then removed samples from the culture, and incubated the cells in the presence of [32Pi] at room temperature in the absence of shaking (14). While the continuous labeling/static culture approach utilized by Bochner and Ames led to efficient labeling, the majority of physiological experiments are carried out on aerated cells. The approach utilized by McCleary and Stock was even less similar to the majority of physiological experiments, in that their protocol required the transfer of aerated cells cultured at 37°C to non-aerated conditions at a reduced temperature. Both the change in aeration and temperature downshift would be expected to result in alterations in the intracellular concentration of phosphorylated compounds - especially acetyl-P, whose steady state levels have been shown to be influenced by temperature (13) and would be predicted to be sensitive to oxygen tension (reviewed by (1)). We therefore developed a procedure for labeling under aerated conditions. We prepared duplicate cultures for each strain. One culture was incubated continuously with [32Pi], while the other parallel culture was used to determine the relative cell number by measurement of optical density (OD600).
Optimization of 2D-TLC
The method reported by Bochner and Ames (20) utilized treatment with a precipitate solution (200 mM sodium-tungstate, 200 mM tetraethylammonium-HCl, 50 mM procaine) to remove unincorporated [32Pi] and phosphorylated macromolecules, as well as to stabilize labile phosphorylated small molecules. This precipitation procedure was reported to remove greater than 99.9% of the Pi present in formic acid extracts (20), which is consistent with our results (Fig. 3, compare panel A to panels B-D).
Fig. 3.

Optimization of the 2D-TLC. Wild-type cells (strain AJW678) were labeled at 37°C in mMOPS supplemented with 0.8% pyruvate, harvested, processed, and subjected to 2D-TLC. (A) Separation of a lysate that was not precipitated. Note that the [32Pi] obscures the acetyl-P signal. (B) Separation using the following solvents: first dimension buffer, 0.75 guanidine HCl (19), second dimension buffer, as described in Materials and Methods (14). Notice the streaking in the first dimension that obscures the acetyl-P signal (arrow) and the lack of resolution along the right edge caused by prolonged development in the second dimension. (C) Separation using the McCleary and Stock system (14). Although the signals in the lower left corner are well-resolved, the acetyl-P signal is obscured by streaking in the first dimension (arrow). (D) Separation using the optimized McCleary and Stock solvent system. Note that the acetyl-P signal is well resolved (arrow).
Following precipitation, the samples were fractionated by PEI cellulose in two dimensions. We employed a variety of TLC conditions, and found that the buffer conditions described by McCleary and Stock (14) resulted in the best separation of acetyl-P (Fig. 3, compare panels C and B). We also found that 20X20 cm PEI cellulose-F plates (cut into 10X10 sections) from EMD resulted in resolution that was superior to that seen with plates from other vendors. In contrast to Bochner and Ames (19), who recommended that the spotted and dried plate be soaked in methanol for 5 min, we found that rinsing the plates with methanol gave superior results. Moreover, we found that the development time greatly affected the quality of the separation. Plates developed for 45-60 minutes in the first dimension and 90-120 minutes in the second dimension showed the greatest resolution of acetyl-P. Longer development times resulted in a significant reduction in resolution and the migration of acetyl-P as a streak (Fig. 3, compare panels C and D). Finally, we observed that complete drying between solvent systems was critical. After completion of development in the first dimension, the plates were immersed in methanol for 15 min, and then allowed to dry thoroughly (45 min). These steps were found to be critical for the removal of buffer from the first dimension. After development in the second dimension, the plates were allowed to dry thoroughly in a fume hood, and then exposed to a phosphorimager screen.
Identification of acetyl-P
We identified the migration position of acetyl-P (Fig. 3, panels B-D, arrow) using three different approaches. First, we added synthetic acetyl-[32P] to formic acid extracts prepared from [32Pi]-labeled WT cells (AJW678), and subjected the samples to analysis by 2D-TLC (18). Second, we demonstrated that the spot corresponding to acetyl-P showed a genetic dependency on the pta and ack genes (see Fig. 3 of (18)). The ackA pta mutant would not be expected to produce a signal corresponding to acetyl-P, since pta and ackA are the only genes known to be involved in acetyl-P biosynthesis. In contrast, the ackA mutant (strain AJW1939) is unable to degrade acetyl-P to acetate, and would be expected to accumulate acetyl-P. As expected, the ackA pta mutant and the ackA mutant exhibited a significant decrease and increase, respectively, relative to their WT parent in the signal predicted to correspond to acetyl-P.
Third, we made use of the ability of the Pta-AckA pathway to function in the assimilation of exogenous acetate. We utilized a pta mutant (strain CP904), which is unable to inter-convert acetyl-P and acetyl-CoA. We grew these cells in mMOPS supplemented with pyruvate and [32Pi] to mid-exponential phase, whereupon we added 10 mM acetate, 10 mM propionate, or buffer. Samples were removed at 30-minute intervals and processed (Fig. 4). When grown on pyruvate, the pta mutant (which cannot convert acetyl-CoA to acetyl-P) produced only a faint spot in the region corresponding to acetyl-P, similar to that observed with extracts of the pta ackA mutant (see Fig. 3D of (18)). Efforts to identify this faint spot were unsuccessful; however, it is clearly not acetyl-P produced by the Pta-AckA pathway and it is unlikely to be either propionyl-P or a product of pyruvate oxidase. Whether it corresponds to acetyl-P synthesized by a presently unidentified pathway remains unknown (18). Nonetheless, when grown on the same medium supplemented with acetate, this strain utilized the ackA gene product to assimilate acetate, resulting in an intense spot corresponding to the position of acetyl-P.
Fig. 4.
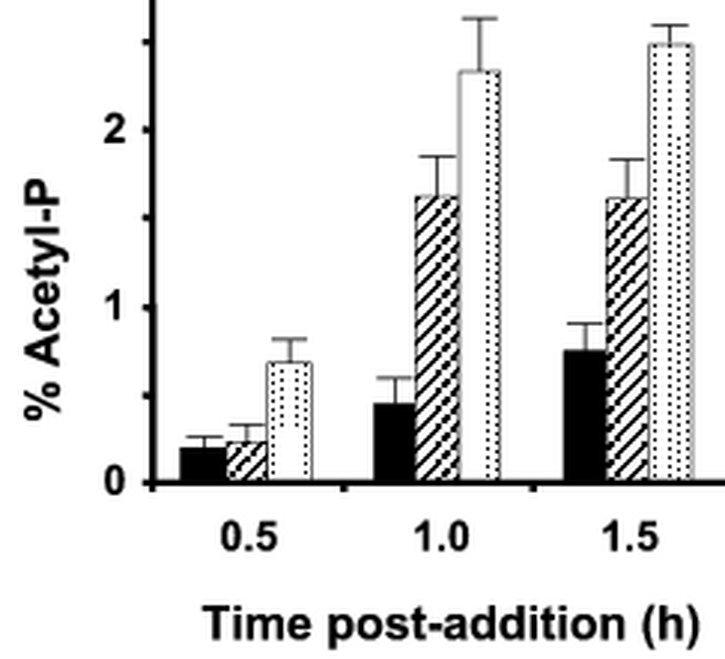
Verification of the location of the signal that corresponds to acetyl-P. A pta mutant (strain CP904) was labeled at 37°C in mMOPS supplemented with 0.8% pyruvate. During mid-exponential growth, the culture was split into three equal parts: one culture was left untreated (solid bars), a second culture was supplemented with 10 mM propionate (hatched bars), and the third was supplemented with 10 mM acetate (stippled bars). Samples were harvested 0.5, 1.0, and 1.5 hours following treatment, processed, separated by 2D-TLC, and the percentage of signal attributed to acetyl-P calculated.
Previous reports had suggested that propionate can also function as a substrate for AckA (24, 25). Consistent with these previous results, we observed that cells cultured with pyruvate and exposed to propionate produced a spot in the same location, albeit with less intensity. These results demonstrate that small differences (one carbon) in the length of the acyl chain do not significantly alter the separation characteristics of the phosphorylated compound and shows that this method can be used for the analysis of propionyl-P.
Instability of acetyl-P during TLC
Analysis of the extracts of labeled E. coli by TLC demonstrated the presence of a spot that co-migrated with Pi (see Fig. 3D in (18)). This Pi could result from incomplete precipitation of unincorporated label or from instability of acetyl-P during separation. Preliminary analysis of labeled formic acid extracts from ackA mutant cells (strain AJW1939), WT cells (strain AJW678), and ackA pta mutant cells (strain AJW2013) led us to suspect a correlation between the acetyl-P and Pi signals; regression analysis confirmed this correlation (Fig. 5), suggesting that acetyl-P and Pi possess a precursor-product relationship. Since the precipitation procedure has been reported to remove greater than 99.9% of the Pi present in formic acid extracts (20), we hypothesized that the Pi resulted from the breakdown of acetyl-P during 2D-TLC. We tested this hypothesis by preparing synthetic acetyl-[32P], precipitating the unincorporated Pi, and subjecting the acetyl-P to 2D-TLC; the separation procedure released Pi. The percentage of Pi varied from separation to separation, ranging from 10% to 45% (18). To ensure the comparability of samples, single time point samples harvested from multiple cultures were processed simultaneously. Likewise, whenever possible, samples representing sets of two or more time points also were processed at the same time. This approach typically yielded large R2 values in the range of 0.85 to 0.95 (data not shown). Furthermore, this approach allowed us to easily identify and discard compromised samples (i.e. those with unusually high amounts of Pi that fell outside the 99% confidence interval).
Fig. 5.
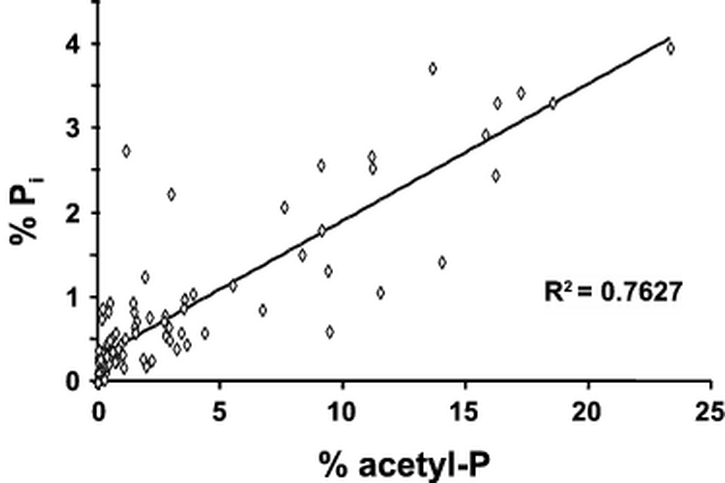
Correlation between the percentages of acetyl phosphate (acetyl-P) and inorganic phosphate (Pi). Wild-type cells (strain AJW678), an ackA mutant (strain AJW1939), or an ackA pta mutant (strain AJW2013) were grown in mMOPS supplemented with 0.8% pyruvate at 37°C, harvested at regular time intervals, lysates prepared and processed, subjected to 2D-TLC, and the signals corresponding to acetyl-P and Pi quantified, as described. n = 95; R2 = 0.76. Data is representative of one experiment performed in triplicate.
Affect of sampling frequency and surface/volume ratio on acetyl-P concentrations
During our early experiments, we observed that acetyl-P concentrations varied whenever the aeration of the culture was interrupted for frequent sampling (Fig. 6B). These results led us to hypothesize that this variance resulted from decreases in oxygen tension in cultures not undergoing agitation. Such changes would be expected to affect the acetyl-P concentration by influencing the flux of acetyl-CoA into the TCA cycle (reviewed by (1)). Consistent with this hypothesis, analysis of the labeled formic acid extracts showed that acetyl-P concentration fluctuated as the culture approached and entered stationary phase, when the volume of medium approached and passed 20% of the total volume of the tube (Fig. 6A). In contrast, when care was taken to harvest small volumes - we used 100 μl - relative to the total culture volume) and by sampling as often as possible but at intervals of no less than 30 minutes, we obtained highly reproducible results (Fig 7).
Fig. 6.

Frequent sampling results in variance of acetyl-P measurements. ackA mutant cells (strain AJW1939) were grown in mMOPS supplemented with 0.8% pyruvate at 37°C, harvested at regular time intervals, lysates prepared and processed, subjected to 2D-TLC, and the signal corresponding to acetyl-P quantified. (A) A representative experiment in which relatively large samples (200 μL) were harvested from 2 mL cultures in 12 x 75 mm tubes, ensuring that the SA : vol ratio dropped below 20% shortly after the culture entered into stationary phase; this event occurred at an OD600 of about 0.5. (B) An amalgamation of several replicate experiments in which samples were harvested during mid-exponential growth to early stationary phase, a several hour-long interval during which the acetyl-P pool of the ackA mutant tends to be relatively stable (18).
Fig. 7.

Reproducibility of the assay. Triplicate cultures of (A) WT cells (strain AJW678) and (B) acs mutant cells (strain AJW1781) were grown in mMOPS supplemented with 0.8% pyruvate at 37°C under microaerophilic conditions. The cells were then processed and examined by 2D-TLC.
Acetyl-P concentration varies as a function of carbon source
Our previous studies focused on cells that were cultured in the presence of pyruvate as their sole carbon source (Fig. 7 and (18)). To extend our understanding of the relationship between carbon source and acetyl-P, we grew WT cells (strain AJW678) on the following carbon sources: glucuronate, glucose and glucitol (also known as sorbitol). Like cells grown on pyruvate, those grown on glucose accumulated large amounts of acetyl-P during exponential growth, which became depleted as the cells approached stationary phase (Fig. 8A). Cells grown on glucuronate also accumulated large amounts of acetyl-P, but these did not become depleted as the cells entered stationary phase. Finally, acetyl-P levels remained low when cells were grown on glucitol.
Fig. 8.
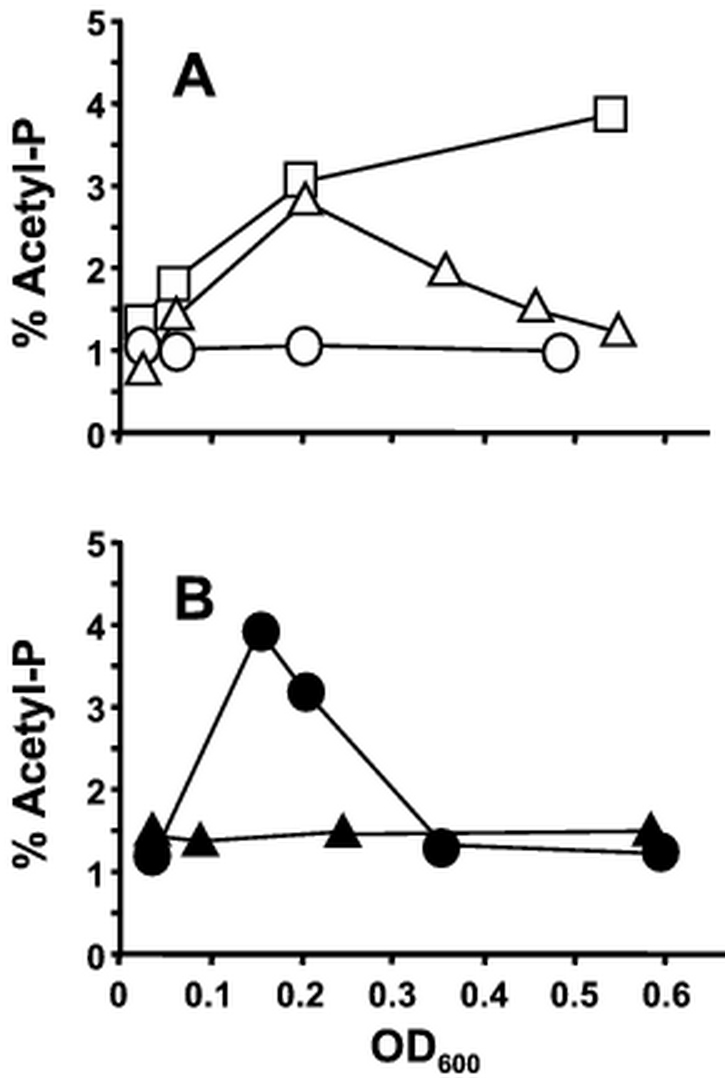
Redox state of the carbon source does not correlate with acetylphosphogenesis. (A) Cells were grown at 37°C in mMOPS supplemented with 0.4% glucuronate (redox state = +2, open squares), 0.4% glucose (redox state = 0, open triangles), or 0.4% glucitol (redox state = -1, open circles). (B) Cells were grown in mMOPS supplemented with 0.4% mannose (redox state = 0, closed triangles) and 0.4% mannitol (redox state = -1, closed circles). A glucitol control was included; it exhibited similar behavior to that shown in Panel A. All assays were performed in triplicate. The error bars were smaller than the symbols.
Glucuronate, glucose, and glucitol are related compounds that differ only in their redox state. Glucuronate is an oxidized derivative (redox state = +2) of glucose (redox state = 0), while glucitol is a reduced variant (redox state = -1). Thus, the accumulation of acetyl-P appeared to correlate with redox state. However, cells grown on mannitol (redox state = -1) accumulated acetyl-P, while cells grown on mannose (redox state = 0) did not (Fig. 8B). Therefore, the relationship between acetyl-P and carbon source is more complex than simple changes in redox state. Given that glucose and mannitol are catabolite-repressing sugars, while glucitol and mannose are not, these data suggest the possibility that the sugar phosphotransferase system (PTS) is involved (26).
Conclusion
The optimized protocol reported in this communication results in several advantages over previous methods for the measurement of acetyl-P, and has led to several insights into the regulation of acetyl-P biosynthesis. First, the protocol uses labeling carried out under aerated conditions, which allows for better integration of the data with other types of physiological measurements. Second, our protocol includes a method to monitor the integrity of the acetyl-P within extracts, which allows for the removal of substandard preparations from the analysis. Third, our protocol yields a relative concentration of acetyl-P with respect to other phosphorylated molecules within the cell; however, it can be easily adapted to provide an absolute concentration. Fourth, we have used this method to show that the synthesis of acetyl-P is influenced by the nature of the carbon source, through a complex mechanism that may involve the PTS system.
Acknowledgments
We thank Shivannee Shah and David S. Thach for help with various aspects of the assay, Sylvia A. Reimann for checking the protocol, the National Institute of General Medical Sciences (GM066130) for providing funding to AJW, and the United States Department of Agriculture (Award 2005-35319-15304) for providing funding to DHK.
Abbreviations
- 2D-TLC
two-dimensional thin layer chromatography
- acetyl-P
acetyl phosphate
- PTA
phosphotransacetylase
- PDHC
pyruvate dehydrogenase complex
Protocols
Protocol 1 - Labeling of cells
Materials
sterile glass culture tubes, 12x75 mm for microaerophilic growth conditions or sterile 150 ml Erlenmeyer flasks for aerobic growth conditions
microcentrifuge tubes
mMOPS buffer
mMOPS buffer (modified MOPS)
Prepare 10xMOPS as described (23) with the exception of K2HPO4. To facilitate the uptake of [32Pi], the K2HPO4 concentration is reduced to 0.2 mM.
1x mMOPS is supplemented with 10 mg/ml thiamine.
1x mMOPS is supplemented with the carbon source. Standardize the concentration to the number of carbons. In this study, we used 0.8% sodium pyruvate (3 carbons) and 0.4% sugar (6 carbons).
1x mMOPS is supplemented with auxotrophic requirements. The strains used in this study were auxotrophic for L-threonine, L-histidine, L-leucine, and L-methionine. These were added to a final concentration of 100 μg/ml.
Sterilize by filtration.
Radiolabelled inorganic phosphate
[32Pi] (carrier free in dilute HCl)
Protocol
-
For microaerophilic growth conditions, use 12x75 mm glass tubes. To achieve microaerophilic conditions, use enough media to fill approximately 70-80% of the test-tube (7.75 - 8.75 ml). This ensures that enough culture will be available for sampling without reducing the culture volume to less than 30% of the tube volume.
For aerobic conditions, use 150 ml flasks. Dilute as above, but use 10 ml medium.
Dilute overnight cultures to OD600 of 0.03.
Divide the culture into two samples with equal volumes, one for labeling with [32Pi] and one for taking OD600 samples. It is important that the surface area (SA) to volume (vol) ratio of the cultures is the same in both hot and cold cultures, and this ratio must be maintained throughout the experiment.
Label the hot culture sample with [32Pi] to a final concentration of 30 µCi/ml.
Incubate both cultures shaking at approx. 250 rpm and 37°C.
Protocol 2 - Preparation of labeled extracts
Reagents
11N formic acid
2-picoline
Precipitation solution (stable for 10-12h)
To make 1 ml precipitation solution, mix 400 μl tetraethylammonium-HCl (0.5M), 500 μl sodium tungstate (0.4M), and 100 μl procaine (0.5M).
Note: TEAC and Na-tungstate stock solutions are stable, whereas the procaine stock solution is light- and air-sensitive and, therefore, only stable for 2 weeks.
Protocol
Harvest the first sample approx. 1-1.5 h after labeling. After the first sample, take a sample every 45-90 min. Stoppage of the cultures too often will cause changes in acetyl-P levels.
Harvest 100 ml of the cold sample for OD600 measurements and 100 ml of the [32Pi]-labeled sample for processing as described below.
Aliquot 10 µl of cold 11N formic acid into a microcentrifuge tube. Keep the tube on ice.
Add 100 µl of labeled sample to the formic acid. Keep the sample on ice at all times. Higher temperatures dramatically increase the hydrolysis of acetyl-P that occurs under acidic conditions
Incubate sample for 30 min in an ice bath.
Add 16.5 µl of ice-cold precipitation solution and mix well by pipeting up and down. The sample can either be shock-frozen in an ethanol-dry ice bath or centrifuged immediately.
Centrifuge at 4°C for 15 min at 15800 x g.
Pipet 8 µl of 2-picoline into a fresh microcentrifuge tube.
Add 100 ml supernatant from the centrifuged samples to the 2-picoline to neutralize the sample. Mix by pipeting up and down.
Immediately shock-freeze the samples. Store at -20°C. Samples can be stored up to 4 weeks, but it is not recommended to keep them longer than 1 week due to the decay of 32P. Avoid repeated freezing and thawing, which leads to hydrolysis of acetyl-P.
Protocol 3 - Two-Dimensional Thin Layer Chromatography (2D-TLC)
Materials
PEI cellulose-F TLC plates (EMD Chemicals) cut into 10x10cm
TLC Tanks
glass tray
phosphorscreen
Typhoon 8600 Variable Mode Imager
autoradiography cassette
Reagents
methanol
-
1st dimension buffer
- 0.52 M LiCl
- 1% acetic acid
-
2nd dimension buffer
- 1 M ammonium acetate
- 0.35 M ammonium chloride
- adjust to pH 3.5 with glacial acetic acid
Protocol
Spot 5 µl of thawed samples on the lower left corner of the TLC plate, about 2 cm in from either edge
Let spots dry for 35-45 min. This step and all the following drying steps are crucial.
Rinse plates in methanol. Fill a glass tray with about an inch of methanol and, holding the plate by the top corner in the margin immerse and agitate the plate back and forth eight or nine times, shake gently to rid excess methanol. Repeat washing process twice more.
Let plates dry for 35 - 45 min.
Fill TLC tank with 1st dimension buffer so it coats the bottom of the tank.
Develop the plate in the 1st dimension for 45 min.
Remove plate from the tank and dry for 25 min.
Soak plates in methanol for 15 min.
Let plates dry for 30 min.
Fill TLC tanks with 2nd dimension buffer.
Develop plates in the 2nd dimension for 90 min.
Remove plates from tank and dry thoroughly for 1 h.
-
Wrap plates in PVC wrap and expose them in an autoradiography cassette to a phosphorscreen for at least
12 h.
Radioactivity is detected on a Typhoon 8600 Variable Mode Imager and analyzed using the bundled ImageQuant software without background correction.
The signal produced by acetyl-P is calculated as the percentage of the total signal of the TLC plate.
References
- The acetate switch. Wolfe AJ. Microbiol. Mol. Biol. Rev. 2005;69:12–50. doi: 10.1128/MMBR.69.1.12-50.2005. [DOI] [PMC free article] [PubMed] [Google Scholar]
- Acetyl phosphate-sensitive regulation of flagellar biogenesis and capsular biosynthesis depends on the Rcs phosphorelay. Fredericks CE, Shibata S, Aizawa S-I, Reimann SA, Wolfe AJ. Mol. Microbiol. 2006;61:734–747. doi: 10.1111/j.1365-2958.2006.05260.x. [DOI] [PubMed] [Google Scholar]
- Evidence that acetyl phosphate functions as a global signal during biofilm development. Wolfe AJ, Chang D-E, Walker JD. Mol. Microbiol. 2003;48:977–988. doi: 10.1046/j.1365-2958.2003.03457.x. [DOI] [PubMed] [Google Scholar]
- A complex transcription network controls the early stages of biofilm development by Escherichia coli. Pruss BM, Besemann C, Denton A, Wolfe AJ. J. Bacteriol. 2006;188:3731–3739. doi: 10.1128/JB.01780-05. [DOI] [PMC free article] [PubMed] [Google Scholar]
- VirR, a response regulator critical for Listeria monocytogenes virulence. Mandin P, Fsihi H, Dussurget O. Mol. Microbiol. 2005;(57):1367–1380. doi: 10.1111/j.1365-2958.2005.04776.x. [DOI] [PubMed] [Google Scholar]
- Use of signature-tagged transposon mutagenesis to identify Vibrio cholerae genes critical for colonization. Chiang SL, Mekalanos JJ. Mol. Microbiol. 1998;27:797–805. doi: 10.1046/j.1365-2958.1998.00726.x. [DOI] [PubMed] [Google Scholar]
- Mutation of phosphotransacetylase but not isocitrate lyase reduces the virulence of Salmonella enterica serovar Typhimurium in mice. Kim YR, Brinsmade SR, Yang Z, Escalante-Semerena J, Fierer J. Infect. Immun. 2006;74:2498–2502. doi: 10.1128/IAI.74.4.2498-2502.2006. [DOI] [PMC free article] [PubMed] [Google Scholar]
- Autoinduction of the OmpR response regulator by acid shock and control of the Salmonella enterica acid tolerance response. Bang IS, Audia JP, Park YK, Foster JW. Mol. Microbiol. 2002;44:1235–1250. doi: 10.1046/j.1365-2958.2002.02937.x. [DOI] [PubMed] [Google Scholar]
- Is acetyl phosphate a global signal in Escherichia coli? McCleary WR, Stock JB, Ninfa AJ. J. Bacteriol. 1993;175:2793–2798. doi: 10.1128/jb.175.10.2793-2798.1993. [DOI] [PMC free article] [PubMed] [Google Scholar]
- Gene regulation by phosphate in enteric bacteria. Wanner BL. J. Cell. Biochem. 1993;51:47–54. doi: 10.1002/jcb.240510110. [DOI] [PubMed] [Google Scholar]
- The Rcs phosphorelay: a complex signal transduction system. Majdalani N, Gottesman S. Annu. Rev. Microbiol. 2005;59:379–405. doi: 10.1146/annurev.micro.59.050405.101230. [DOI] [PubMed] [Google Scholar]
- The RcsCDB signaling system and swarming motility in Salmonella enterica serovar Typhimurium: dual regulation of flagellar and SPI-2 virulence genes. Wang Q, Zhao Y, McClelland M, Harshey RM. J. Bacteriol. 2007;189:8447–8457. doi: 10.1128/JB.01198-07. [DOI] [PMC free article] [PubMed] [Google Scholar]
- Regulation of acetyl phosphate synthesis and degradation, and the control of flagellar expression in Escherichia coli. Pruss BM, Wolfe AJ. Mol. Microbiol. 1994;12:973–984. doi: 10.1111/j.1365-2958.1994.tb01085.x. [DOI] [PubMed] [Google Scholar]
- Acetyl phosphate and the activation of two-component response regulators. McCleary WR, Stock JB. J. Biol. Chem. 1994;269:31567–31572. [PubMed] [Google Scholar]
- Micromethod for the measurement of acetyl phosphate and acetyl coenzyme A. Hunt AG. Methods Enzymol. 1986;122:43–50. doi: 10.1016/0076-6879(86)22146-1. [DOI] [PubMed] [Google Scholar]
- Requirements of acetyl phosphate for the binding protein-dependent transport systems in Escherichia coli. Hong JS, Hunt AG, Masters PS, Lieberman MA. Proc. Natl. Acad. Sci. 1979;76:1213–1217. doi: 10.1073/pnas.76.3.1213. [DOI] [PMC free article] [PubMed] [Google Scholar]
- The role of acetylphosphate in active transport. Hong J-S, Hunt AG. J. Supramol. Struct. 1980;4:77–77. [Google Scholar]
- The intracellular concentration of acetyl phosphate in Escherichia coli is sufficient for direct phosphorylation of two-component response regulators. Klein AH, Shulla A, Reimann SA, Keating DH, Wolfe AJ. J. Bacteriol. 2007;189:5574–5581. doi: 10.1128/JB.00564-07. [DOI] [PMC free article] [PubMed] [Google Scholar]
- Complete analysis of cellular nucleotides by two-dimensional thin layer chromatography. Bochner BR, Ames BN. J. Biol. Chem. 1982;257:9759–9769. [PubMed] [Google Scholar]
- Selective precipitation orthophosphate from mixtures containing labile phosphorylated metabolites. Bochner BR, Ames BN. Anal. Biochem. 1982;122:100–107. doi: 10.1016/0003-2697(82)90257-3. [DOI] [PubMed] [Google Scholar]
- Regulation of acetyl coenzyme A synthetase in Escherichia coli. Kumari S, Beatty CM, Browning DF. J. Bacteriol. 2000;182:4173–4179. doi: 10.1128/JB.182.15.4173-4179.2000. [DOI] [PMC free article] [PubMed] [Google Scholar]
- Cloning, characterization, and functional expression of acs, the gene which encodes acetyl coenzyme A synthetase in Escherichia coli. Kumari S, Tishel R, Eisenbach M, Wolfe AJ. J. Bacteriol. 1995;177:2878–2886. doi: 10.1128/jb.177.10.2878-2886.1995. [DOI] [PMC free article] [PubMed] [Google Scholar]
- Culture medium for enterobacteria. Neidhardt FC, Bloch PL, Smith DF. J Bacteriol. 1974;119:736–747. doi: 10.1128/jb.119.3.736-747.1974. [DOI] [PMC free article] [PubMed] [Google Scholar]
- Involvement of ack-pta operon products in alpha-ketobutyrate metabolism by Salmonella typhimurium. Van Dyk TK, LaRossa RA. Mol. Gen. Genet. 1987;207:435–440. doi: 10.1007/BF00331612. [DOI] [PubMed] [Google Scholar]
- Purification and characterization of two extremely thermostable enzymes, phosphate acetyltransferase and acetate kinase, from the hyperthermophilic eubacterium Thermotoga maritima. Bock A-K, Glasemacher J, Schmidt R, Schonheit P. J. Bacteriol. 1999;181:1861–1867. doi: 10.1128/jb.181.6.1861-1867.1999. [DOI] [PMC free article] [PubMed] [Google Scholar]
- How phosphotransferase system-related protein phosphorylation regulates carbohydrate metabolism in bacteria. Deutscher J, Francke C, Postma PW. Microbiol. Mol. Biol. Rev. 2006;70:939–1031. doi: 10.1128/MMBR.00024-06. [DOI] [PMC free article] [PubMed] [Google Scholar]