

Abstract
Objectives
Peripheral benzodiazepine receptors (PBRs) are upregulated on activated microglia and are thereby biomarkers of neuroinflammation. We developed a PET ligand with an aryloxyanilide structure, [O-methyl-11C]N-acetyl-N-(2-methoxybenzyl)-2-phenoxy-5-pyridinamine ([11C]PBR28), to image PBRs. The objectives of the current study were to evaluate kinetics of brain uptake, and the influence of the peripheral binding on the arterial input function in rhesus monkey.
Methods
Brain (baseline: n=6, blocking: n=1) and whole-body PET imaging (baseline: n=3, blocking: n=1) of [11C]PBR28 were performed with the measurement of radiometabolite-corrected arterial input function in all brain and two whole body scans.
Results
Saturating doses of nonradioactive PBR ligands markedly increased [11C]PBR28 in plasma (∼400% increase) and brain (∼200%) at 2 min by displacing radioligand from PBRs in peripheral organs. Brain uptake of radioactivity peaked in baseline scans at ∼40 min after injection of [11C]PBR28 and was high (∼300% standardized uptake value). The images showed no receptor-free region that could be used for reference tissue analysis. Thus, quantitation of receptor density required measurement of parent radioligand in arterial plasma. Nondisplaceable uptake was estimated from the blocked scans and was only ∼5% of total distribution volume measured under baseline conditions. Distribution volume of [11C]PBR28 was stably determined within 110 min of scanning.
Conclusions
Regional brain uptake of [11C]PBR28 in monkey could be quantified as a value proportional to the density of receptors - namely, as equilibrium distribution volume. [11C]PBR28 had high levels of specific binding in brain and should provide a sensitive measure of changes in PBRs.
INTRODUCTION
The peripheral benzodiazepine receptor (PBR and also called translocator protein (18 kDa)) was initially characterized as a high affinity binding site for diazepam displaceable with Ro5-4864 (4′-chloro-diazepam) and is present at high densities in lung, liver, heart, spleen, and kidney (Anholt et al., 1985; Braestrup et al., 1977). PBRs are transmembrane proteins located primarily in mitochondria and may play important roles in cholesterol transport, hormone synthesis, and immunomodulation (Papadopoulos et al., 2006). PBRs have lower concentrations in healthy brain than in peripheral organs and are primarily located in glial cells, with highest densities in olfactory bulb, choroid plexus, and the ependymal lining of the ventricles (Anholt et al., 1984; Benavides et al., 1983; Cymerman et al., 1986). PBR expression is markedly increased in activated microglia and reactive astrocytes in the central nervous system (Banati, 2002, , 2003) and may be a useful biomarker of neuroinflammation. For example, we imaged and quantified increased densities of PBRs surrounding a cerebral stroke in rats with positron emission tomography (PET) (Imaizumi et al., 2007b).
For over two decades, [11C]-(R)-PK 11195 [(R)-N-[11C]methyl-N-(methylpropyl)-1-(2-chlorophenyl)-isoquinoline-3-carboxamide] has been the most widely used PET radioligand for PBRs. Brain uptake of [11C]-(R)-PK 11195 increases in several acute neurological and neurodegenerative disorders associated with inflammation (Galiegue et al., 2003). Recently, a new class of aryloxyanalide-based radioligands have been developed (Okuyama et al., 1999), and they have 4 to 18 times greater affinity for PBRs than PK 11195 (Chaki et al., 1999). Among this class of ligands, [11C]DAA1106 and [18F]FEDAA1106 (Fig. 1) have successfully imaged PBRs in human and nonhuman primates with high brain uptake and a high percentage of specific binding (Fujimura et al., 2006; Ikoma et al., 2007; Maeda et al., 2004; Zhang et al., 2003). We also synthesized aryloxyanilide-based PET ligands that have high affinity and selectivity for PBRs: [11C]PBR01, [18F]PBR06, and [11C]PBR28 (Fig. 1 and Table 1) (Briard et al., 2005a; Briard et al., 2005b). [11C]PBR01 and [18F]PBR06 showed similar kinetics of brain uptake and washout in rhesus monkey (Imaizumi et al., 2007a). The kinetics were slow enough for the longer-lived [18F]PBR06 to be preferred over the [11C]PBR01 to obtain stable values of distribution volume, a parameter that is proportional to receptor density. We also found that injection of nonradioactive PBR ligands increased the plasma concentration of radioligand about ten fold, presumably due to blockade of receptors in peripheral organs (Imaizumi et al., 2007a).
Figure 1.
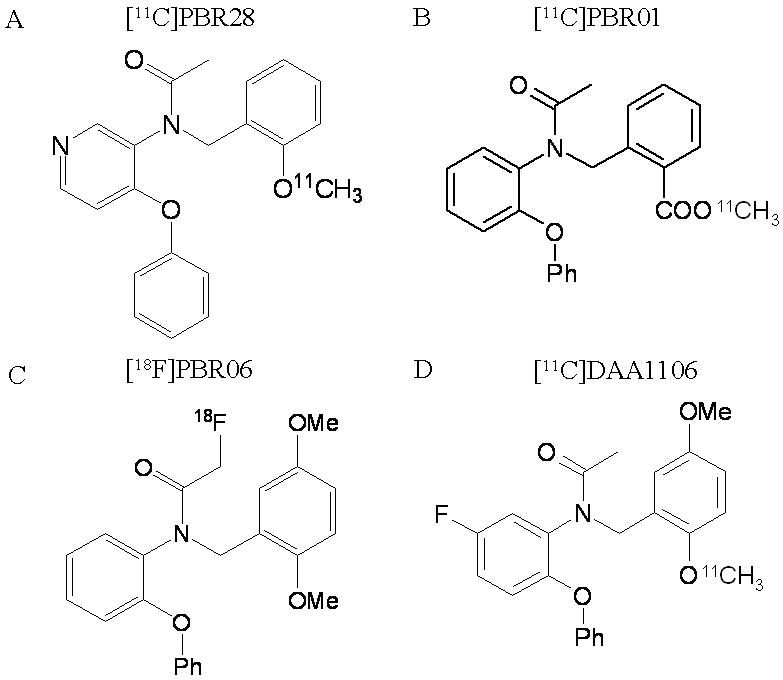
Structures of PBR radioligands.
Table 1.
Chemical properties of PBR ligands
| Ligands | Ki (nM)* | LogD | cLogD | fP (%) |
|---|---|---|---|---|
| PBR01 | 0.24 | - | 4.4 | - |
| PBR06 | 0.30 | 4.05 | 4.37 | 3.5 |
| PBR28 | 0.59 | 3.01 | 2.95 | 5.6 |
| DAA1106 | 0.21 | - | 4.28 | - |
| PK 11195 | 4.12 | 3.97 | 5.28 | - |
Determined with rhesus brain
PBR28 has lower lipophilicity (LogD = 3.01 vs. 4.05) and lower receptor affinity (Ki = 0.59 vs. 0.30 nM) than PBR06 (Table 1). The significance of these different in vitro parameters for in vivo imaging is difficult to predict. Nevertheless, PBR28 may have faster clearance from brain than [18F]PBR06 and be useful as a 11C-labeled radioligand. The main objectives of this study were to assess the utility of [11C]PBR28 to quantify PBRs in brain and to understand the influence of the binding to peripheral organs on the arterial input function. As in our prior studies with [18F]PBR06 and [11C]PBR01 (Imaizumi et al., 2007a), injection of receptor saturating doses of nonradioactive PBR ligands markedly increased the plasma concentration of [11C]PBR28. Thus, the percentage of specific binding in brain could be measured only by calculating a value like distribution volume, which corrects for plasma concentration of radioligand. Using compartmental methods to measure brain uptake, we found that [11C]PBR28 provided accurate estimates of PBR densities with high levels of specific binding.
MATERIALS AND METHODS
Synthesis of radioligand
PBR28 was labeled by 11C-methylation of the O-desmethyl precursor, as described by Briard et al., (2005a).The specific activity of [11C]PBR28 at time of injection was 101 ± 89 GBq/μmol (Table 2), with these and subsequent data are expressed as mean ± SD.
Table 2.
Nonhuman primate PET scans with [11C]PBR28
| Scan # | PET | Scan length (h) | Animal # | Blocking agent | Blocking dose (mg/kg) | Specific activity (GBq/mmol) | Injected activity (MBq) | Mass dose (μg/kg) |
|---|---|---|---|---|---|---|---|---|
| Brain imaging | ||||||||
| #1 Baseline | GE Advance | 2.5 | 1 | - | - | 30 | 157 | 0.082 |
| #2 Baseline | HRRT | 2 | 1 | - | - | 35 | 72 | 0.035 |
| #3 Baseline | HRRT | 3 | 2 | - | - | 69 | 187 | 0.072 |
| #4 Baseline | HRRT | 3 | 1 | - | - | 39 | 153 | 0.071 |
| #5 Baseline | HRRT | 3 | 2 | - | - | 79 | 276 | 0.100 |
| #6 Baseline | GE Advance | 2.5 | 1 | - | - | 217 | 209 | 0.017 |
| #7 Blocked | GE Advance | 2 | 1 | DAA1106 | 3 mg/kg | 240 | 186 | 0.014 |
| Whole-body imaging | ||||||||
| #8 Baseline | GE Advance | 2 | 3 | - | - | 83 | 329 | 0.245 |
| #9 Baseline | GE Advance | 2 | 4 | - | - | 67 | 414 | 0.313 |
| #10 Baseline | GE Advance | 2 | 4 | - | - | 219 | 348 | 0.066 |
| #11 Blocked | GE Advance | 2 | 4 | PK 11195 | 10 mg/kg | 229 | 332 | 0.061 |
Receptor binding and lipophilicity of PBR28, PBR06, PBR01, and PK 11195
Selectivity of PBR28
The NIMH Psychoactive Drug Screening Program measured the affinity of PBR28 for a large number of receptors and transporters. Detailed receptor binding protocols are available at their web site (http://pdsp.med.unc.edu). The selectivity of PBR01 and PBR06 were reported in our previous paper (Imaizumi et al., 2007a).
PBR Affinity
Following previously described procedures (Chaki et al., 1999), we measured the inhibition constant Ki, of PBR28, PBR01, PBR06, and PK11195 to displace [3H]PK 11195 binding in monkey brain (temporal and parietal lobes) mitochondrial preparations. Ki values for each test compound were calculated according to the equation of Cheng and Prusoff (Cheng and Prusoff, 1973), using the KD (dissociation constant of the tritiated radioligand) value of [3H]PK 11195 obtained from Scatchard analysis.
Lipophilicity of PBR28 and PBR06
[11C]PBR28 and [18F]PBR06 were dissolved in phosphate buffer (pH 7.4; 0.15 M) at a specific concentration of ∼12 μCi/μL. The radiochemical purity of this preparation was greater than 99%. Log D7.4(Oct) was measured six times for each radioligand at room temperature.
Plasma free fraction (fP) of PBR28 and PBR06
Whole blood was drawn from three monkeys and then centrifuged at 1,800 g for 5 min. The supernatant plasmas (700 μL each for PBR28 and 1000 μL each for PBR06) were separately placed in six tubes. To each plasma, [11C]PBR28 (14 μCi; 1 μL) or [18F]PBR06 (15 μCi; 6 μL) were added. Assays for fP were performed according to Gandelman et al. (1994).
PET scans
All animal experiments were performed in accordance with the Guide for the Care and Use of Laboratory Animals and were approved by the NIMH Animal Care and Use Committee. We used four rhesus monkeys (Macaca mulatta, 10.4 ± 4.6 kg; Table 1). Anesthesia was initiated with ketamine (10 mg/kg IM) and then maintained with 1.6% isoflurane and 98.4% O2. Electrocardiograph, body temperature, heart and respiration rates were measured throughout the experiment. Body temperature was maintained between 37.0 and 37.5 °C.
We used two PET scanners for brain image experiments (scan #1 - 7 in Table 1). The GE Advance device (General Electric Medical Systems, Waukesha, WI) has a reconstructed resolution of 7.5 mm full-width half-maximum in all directions in 3D mode. The High Resolution Research Tomograph (HRRT; Siemens/CPS, Knoxville, TN, USA) device has a reconstructed resolution of 2.5 mm full-width half-maximum in all directions in 3D mode. PET scans were acquired for 120 to 180 min in 33 to 45 frames with scan duration ranging from 30 s to 5 min. A blocking experiment (scan #7) was performed by administering DAA1106 (3 mg/kg IV) with the radiotracer. In all brain scans, arterial blood sampling was performed to measure [11C]PBR28 and the radiometabolite levels in plasma.
We also performed one receptor-blocked and three baseline whole-body imaging scans (#8 - 11) in two other monkeys to evaluate PBR distribution in the entire body. Dynamic scans (2D) were acquired on the GE Advance in four segments of the body (head to upper thigh) in frames of increasing duration (75 s to 15 min) for a total scan time of 120 min. A blocking experiment was performed by administering PK 11195 (10 mg/kg IV) at the same time as the radioligand. In one set of baseline and blocked whole-body experiments using the same monkey (scans #10 & 11), arterial blood sampling was performed to measure [11C]PBR28 separated from radiometabolites.
Measurement of [11C]PBR28 and radiometabolites in plasma
The plasma time-activity curve was corrected by the fraction of unchanged radioligand, as previously described (Zoghbi et al., 2006). Blood samples (0.5 mL each) were drawn at 15 s intervals until 2 min, followed by 1 mL samples at 3, 5, 10, 30, 60, 90, and 120 min. Each blood sample was immediately put in heparinized tubes and then separated into plasma and blood cell fraction by centrifugation. Plasma samples (450 μL) were mixed with acetonitrile (700 μL) containing reference PBR28. Distilled water (100 μL) was added and mixed well. Total radioactivity in this solution was measured with a calibrated gamma counter. Deproteinized plasma samples were centrifuged at 10,000 × g for 1 min to remove denatured proteins. The supernatant was then analyzed directly by reversed phase high-performance liquid chromatography (HPLC) on a Novapak C18 column (4 μm, 100 × 8 mm; Waters Corp., Milford, MA, USA) with a radial compression module RCM-100, eluted with MeOH: H2O: Et3N (75: 25: 0.1 by vol.) at 2.0 mL/min. The percent recovery of radioactivity in the supernatant from each sample was calculated relative to that in the precipitate which was 94.3% ± 1.4% (n = 97). The recovery efficiency of plasma standards was 93.8% ± 5.3% (n = 6) for [11C]PBR28.
Image analysis
Tomographic images were analyzed with PMOD 2.65 (pixel-wise modeling software; PMOD Technologies Ltd., Adliswil, Switzerland) (Burger et al., 1998). For brain studies (scans #1 - 7), a summed image from all frames was co-registered using Statistical Parametric Mapping (SPM) 2 (Wellcome Department of Cognitive Neurology, London, U.K.) to a T1- weighted magnetic resonance (MR) image acquired separately on a GE 1.5 T Signa device (SPGR, TR/TE/flip angle = 13.1 ms / 5.8 ms / 45°, 0.4 × 0.4 × 1.5 mm with coronal acquisition on a 256 × 256 × 60 matrix). Regions of interest were defined on the MR image for the frontal (volume: 152 mm3), temporal (208 mm3), parietal (170 mm3), and occipital (130 mm3) cortices, cerebellum (619 mm3), putamen (139 mm3), thalamus (87 mm3), and choroid plexus of 4th ventricle (111 mm3). To normalize brain uptake relative to injected activity and the body weight, standardized uptake values (%SUV) were calculated as (% injected activity per cm3 brain) × g body weight.
For whole-body studies (#8 - 11), tomographic images were compressed anterior-posterior into a single planar image. Compared to tomographic slices, the planar images improved visualization of organs with high activity: brain, heart, lungs, spleen, and urinary bladder. Using monkey #4, one baseline (#10) and one blocked (#11) scan was performed on the same day at the same body position. Identical regions of interest were used for both scans. Decay-corrected organ activity was expressed as a percentage of the entire activity present in frame 1 in each of the four segments. The “remainder of body” was calculated for each time point as the activity of the whole body minus that in the organs listed above. The area under the time-activity curves for each organ and the remainder of body were calculated by the trapezoidal method up to the last data acquisition at 120 min.
Estimation of distribution volume with metabolite-corrected arterial input function
Time-activity data were analyzed with both one- and two-tissue compartment models (Cunningham and Lammertsma, 1995), using the radiometabolite-corrected plasma input function. Rate constants (K1, k2, k3, and k4) were estimated with weighted least squares and the Marquardt optimizer. Brain data of each frame was weighted based on the noise equivalent counts.
We followed the recently proposed consensus nomenclature for reversibly binding radioligands (Innis et al., In press), where VT is total distribution volume, including specific and nondisplaceable uptake.
Statistical analysis
Goodness-of-fit by nonlinear least squares analysis was evaluated using the Akaike information criterion (AIC) (Akaike, 1974) and model selection criterion (MSC). AIC is calculated by the following formula,
MSC is calculated by the following formula,
where n is the number of data points, wi is the weights applied to the points, p is the number of parameters, Ycali is the value calculated by a model and Yobsi are the observed data in an experiment.
MSC is a modification of the AIC. The most appropriate model is that with the smallest AIC and the largest MSC value. MSC was proposed by Micromath Scientific Software (Salt Lake City, Utah, USA) and implemented in their program, ‘Scientist’.
Goodness-of-fit by one- and two-tissue compartment models was compared with F statistics (Hawkins et al., 1986). A value of P <0.05 was considered significant for F statistics.
The standard error of non-linear least squares estimation for rate constants was given by the diagonal of the covariance matrix (Carson, 1986) and expressed as a percentage of the rate constant (coefficient of variation, %COV).
RESULTS
In vitro properties of PBR ligands
PBR28 potently displaced [3H]PK 11195 binding to crude mitochondrial preparations of monkey brain. The Ki values of this compounds showed higher affinity (0.58 ± 0.25 nM) than PK 11195 (Ki = 3.48 ± 1.26 nM; n = six measurements for each ligand).
PBR28 was quite selective for PBRs, and a concentration of 10 μM caused less than 50% displacement of specific binding at 33 receptors and 3 transporters: serotonin 5HT1a, 5HT1b, 5HT1d, 5HT1e, 5HT2a, 5HT2b, 5HT2c, 5HT3, 5HT5a, 5HT6, 5HT7, adrenergic alpha1a, alpha1b, alpha2a, alpha2b, alpha2c, beta1, beta2, beta3, dopamine D1, D2, D3, D4, histamine H1, H2, H3, H4, muscarinic cholinergic M2, M5, GABAA receptors composed of alpha1beta1gamma2, alpha2beta2gamma2, alpha5beta2gamma2, and alpha6beta2gamma2 subunits; dopamine, norepinephrine, and serotonin transporters.
The measured lipophilicity (Log D7.4(Oct)) of [11C]PBR28 and [18F]PBR06 was 3.01 ± 0.01 and 4.05 ± 0.02, respectively (n = 6 measurements for each radioligand). The plasma free fraction (fP) of [11C]PBR28 and [18F]PBR06 was 5.6% ± 0.06% and 3.5% ± 0.02%, respectively (n = 9 measurements for each). The in vitro properties of PBR ligands are summarized in Table 1.
Pharmacological effects in nonhuman primates
A total of eleven PET scans were performed in four monkeys (Table 2). The injected mass dose of [11C]PBR28 was 0.10 ± 0.09 μg/kg (Table 2). In all baseline and blocking experiments using DAA1106 (3 mg/kg IV) and PK 11195 (10 mg/kg IV), the differences between pre- and post-injection vital signs were: < 15 mm Hg for systemic blood pressure, < 10/min for pulse, < 5/min for respiratory rate, and < 0.3 °C for temperature.
Plasma analysis
After injection of [11C]PBR28, plasma activity of unchanged radioligand peaked at ∼2 min and decreased quickly thereafter (Fig. 2C) in baseline scans of both brain and whole body. One radioactive metabolite was detected in plasma, increased over time, and exceeded 50% of total plasma activity at 30 min. The HPLC retention times for PBR28 and radiometabolites in plasma were 4.45 ± 0.19 and 2.16 ± 0.13 min, respectively (in a total of 118 radiochromatograms from a total of 9 scans). These results show that the radiometabolite was less lipophilic than the parent radioligand.
Figure 2.

Representative [11C]PBR28 brain time-activity curves, compartmental fittings and radioligand concentrations in plasma at baseline (A & C; scan #6, Table 2) and after receptor blockade (B & D; scan #7, Table 2). The aryloxyanilide derivative DAA1106 (3 mg/kg IV) was injected with [11C]PBR28 in the blocking experiment. In the brain curves (A & B), the dashed and solid line is the one- and two-tissue compartment fitting, respectively. For the plasma curves (C & D), the inset graphs show the lower plasma activities after 10 min. Symbols: (×) putamen, (△) plasma parent, (■) major radiometabolite.
The concentration of parent radioligand in plasma markedly increased after administering the receptor blocking agent (Fig. 2D). For example, the concentration of [11C]PBR28 at 5 min increased from 27% to 146% SUV after 3 mg/kg DAA1106 administration (Fig. 2 C & D). PBRs are found in high density in peripheral organs such as lung and kidney (Anholt et al., 1986). Receptor-saturating doses of the nonradioactive ligands increased the plasma concentration of radiotracer by blocking these peripheral sites (Fig. 3). Clearance of [11C]PBR28 from plasma was 1,531 ± 473 mL/min in baseline scans (#1 - 7) and 242 and 243 mL/min in blocking scans (#9 & #10), respectively.
Figure 3.
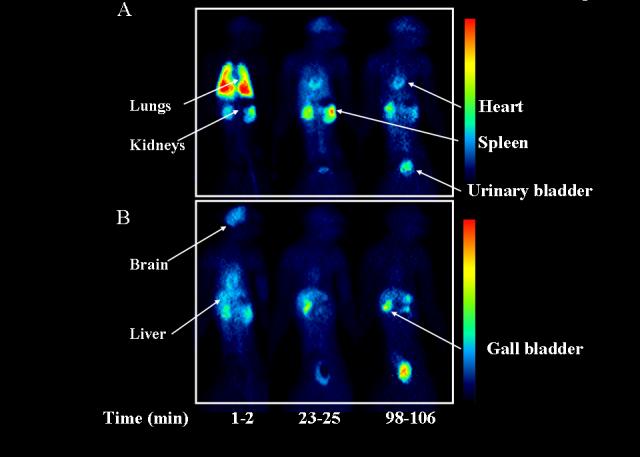
Biodistribution of [11C]PBR28 in monkey baseline (A; scan #10) and receptor-blocked (B; scan #11) experiments at 1-2, 23-25, and 98-106 min after injection. In these planar images, the left side of the animal is on the left side of the image.
Distribution and blockade of brain uptake
In baseline experiments, [11C]PBR28 showed high peak uptake in brain (∼300% SUV) and was widely distributed, with greater activity in gray than white matter (Fig. 3A). The choroid plexus in the 4th ventricle had the highest radioactivity at late times (Fig. 4A), consistent with the known distribution of PBRs.
Figure 4.

[11C]PBR28 PET images at baseline (A; scan #6 in Table 2) and after receptor blockade (B; scan #7 in Table 2). [11C]PBR28 showed high brain uptake (300% SUV) and widespread distribution in brain. The choroid plexus of the 4th ventricle (marked with arrow on sagittal images) had highest activity within the skull. PET images from the GE Advance were averaged from 80 to 120 min. To allow easier identification of brain anatomy, the monkey’s MRI images were coregistered to the PET and overlaid in a faint black/white color scale. Activities (%SUV) in both panels are shown on the same color scale on the right.
In blocking experiments, brain activity at early times was increased due to elevated plasma concentrations of radiotracer. For example, the peak uptake of [11C]PBR28 was ∼300% SUV at baseline and ∼500% SUV after receptor blockade (Fig. 2A & B). Nevertheless, receptor blockade in brain was evident from the faster washout compared to baseline. That is, receptors were blocked by nonradioactive ligand, and the radioligand was not significantly retained in brain. For example, under baseline conditions, peak brain uptake occurred at about 40 min and decreased only 1.3% in the 15 min period thereafter. In contrast, for the receptor-blocked condition, brain uptake peaked at about 4 min and decreased by 62% in the subsequent 15 min (Fig. 2A & B).
Specific binding can be roughly estimated by comparing brain activity before and after blockade at later time points, when the effects of blood flow are less prominent. In Fig. 2, the average uptake of [11C]PBR28 in the period 60 - 90 min was 300% SUV at baseline and 73% SUV after blockade, suggesting that 76% of total uptake was displaceable - i.e., (300-73)/300 = 76%. These values for specific binding are underestimations, since they did not correct for the higher plasma [11C]PBR28 concentrations in the blocked condition. Although this simple empirical analysis showed that the majority of brain uptake of [11C]PBR28 was displaceable, equilibrium distribution volumes from compartmental modeling will be more accurate, since they correct for brain uptake relative to the plasma radioligand concentrations.
[11C]PBR28 compartmental analysis
In all baseline experiments, both one- and two-tissue compartment models converged in all regions. The difference between one- and two-tissue compartmental fitting was not significant by F-test in all regions of all experiments (P >0.05; Figure 2A). In all regions, MSC and AIC values were similar for the two models (Table 3). Moreover, one-tissue compartment model well identified each rate constant with %COV <10% (Table 3), but two-tissue compartment model showed poor identifiability (Table 3). Therefore, the one-tissue compartment model well described the kinetics of [11C]PBR28, and the two-tissue compartment model was not statistically justified. Average VT values from all baseline scans by one-tissue compartment model were 97, 135, and 111 mL·cm-3 in cerebellum, putamen, and choroid plexus of the 4th ventricle, respectively (Table 3).
Table 3.
Kinetic analysis of PBR baseline experiments
| Region | K1 (mL cm-3 min-1) | k2 (min-1) | VT (mL cm-3) | MSC | AIC |
|---|---|---|---|---|---|
| One-tissue compartment model | |||||
| Cerebellum | 0.83 (1.7) | 0.009 (5.7) | 97 | 3.85 | 764 |
| Putamen | 0.71 (1.3) | 0.006 (7.4) | 135 | 4.08 | 754 |
| Choroid plexus | 0.95 (1.6) | 0.009 (6.3) | 111 | 3.42 | 785 |
| Region | K1 (mL cm-3 min-1) | k2 (min-1) | k3 (min-1) | k4 (min-1) | VT (mL cm-3) | MSC | AIC |
|---|---|---|---|---|---|---|---|
| Two-tissue compartment model | |||||||
| Cerebellum | 0.84 (>100) | 0.120 (>100) | 0.511 (>100) | 0.463(>100) | 115 | 3.99 | 757 |
| Putamen | 0.86 (34.8) | 0.328 (>100) | 0.632 (>100) | 0.329 (>100) | 160 | 4.22 | 748 |
| Choroid plexus | 0.89 (42.6) | 0.024 (>100) | 0.938 (>100) | 0.728 (>100) | 134 | 3.43 | 782 |
Numbers in parentheses reflect the identifiably of rate constants and are expressed as %COV.
MSC: Model selection criterion. AIC: Akaike information criterion.
In the blocking experiments (scan #7), only one-compartment models converged (Fig. 2B). Each rate constant was well identified with %COV <10%. VT values were 1.5, 1.7 and 1.7 mL·cm-3 in cerebellum, putamen, and choroid plexus of the 4th ventricle, respectively.
In summary, VT values were measured accurately by one-tissue compartment model in baseline scans. VT values in the blocked scan were quite low, suggesting that >95% of VT in baseline scans was specific binding.
Although measurement of test retest reproducibility was not the aim of this study, we happened to scan two monkeys more than once. One monkey was scanned on 4 different occasions over a period of 17 months. The average distribution volume of all brain regions showed considerable variability and had average values of 61, 91, 117, and 148 mL • cm-3. The other monkey was scanned twice with an interval of 4 months showing distribution volumes of 152 and 214 mL • cm-3. The cause(s) of this poor reproducibility are unknown but could reflect actual changes in PBR densities in this animal over time or reproducibility of the plasma measurements.
Estimation of minimal scan length for [11C]PBR28 to measure distribution volume
One-compartment kinetic analyses were performed with scan durations ranging from 0 to 60, increasing to 0 to 150 min in 10 min increments. Values of VT obtained with shortened data length were compared with those obtained with the full data set. After 110 min, VT by one-tissue compartment model became independent of scan length in all regions. The results for cerebellum are shown in Fig. 5. Percentage differences in VT obtained with shortened and full length data were within ± 10% after 110 min in five baseline experiments in frontal cortex, cerebellum, and choroid plexus of the 4th ventricle. In these regions, the COV of rate constants was also less than 10% after 110 min. Therefore, the value of VT was stably and accurately determined with 110 min of scanning for [11C]PBR28.
Figure 5.

Relationship between VT in cerebellum of [11C]PBR28 obtained by a one-tissue compartment model and experiment duration. Baseline scans were analyzed using brain data from time 0 to the specified time. For all baseline scans, 100 min imaging time provided V within ±10% of the values obtained with the full length data. Scan #1 (×); #3 (●); #4 (△); #5 (▲); #6 (□) (see Table 2).
[11C]PBR28 whole body biodistribution
In baseline experiments (scans #8-10), two types of organs were visually identified (Fig 3A) with moderate to high levels of activity: those with high densities of PBRs (e.g., brain, lungs, kidneys, spleen, and heart) and those involved with metabolism and excretion pathways (e.g., liver and urinary bladder). Peak values of the percentage injected activity in lungs, kidneys, brain and heart were 56% at 2 min (Fig. 6A), 7.1% at 8 min (Fig. 6B), 6.4% at 10 min and 4.6% at 2 min, respectively. Compared to baseline scans, the blocking experiment (scan #11) decreased areas under the curve in organs with PBRs (brain, lungs, kidneys, and heart) and increased areas under the curve in organs involved with metabolism and excretion (liver and bladder). In addition, receptor blockade increased the area under the curve of the remainder of the body and caused more uniform distribution of activity throughout the body (Figs. 3 and 6). The areas under the organ curve of the baseline scans (#9 and 10) were averaged and compared to blockade scan #11. The areas under curve (% injected activity × h) in baseline and blocked experiments were 834 and 250, 287, and 165 and 273 and 165 for lungs, brain, and kidneys, respectively. Thus, the percentage displaceable activity was 70%, 42% and 50% in lungs, brain, and kidneys, respectively (Table 4). These calculations, however, do not account for changes in arterial plasma activity, and the true percentage of specific binding in these organs is unknown. In addition, unlike the activity in brain which is protected from most polar radiometabolites, the activity in peripheral organs is composed of both parent radioligand and metabolites.
Figure 6.

Time-activity curves for [11C]PBR28 serial PET of lungs (A) and kidneys (B) in the baseline (scan #8 - 10) and receptor blocked experiments (scan #11). In baseline experiments, data are expressed as the average of three monkeys. Both data are corrected for radioactive decay. Symbols: (□) lungs and (△) kidneys at baseline experiments; (■) lungs (▲) kidneys after receptor blockade
Table 4.
Area under curves of source organs and remainder of body
| Target organ | Baseline (N=3) AUC (% fraction×h) | Blocking (N=1) AUC (% fraction×h) |
|---|---|---|
| Brain | 287 | 165 |
| Lungs | 834 | 250 |
| Kidneys | 273 | 136 |
| Heart | 88 | 46 |
| Liver | 168 | 222 |
| Bladder | 42 | 98 |
| Reminder of the body | 1217 | 1819 |
AUC: Area under curves calculated by the trapezoidal method up to 120 min.
DISCUSSION
We evaluated a new 11C-labelled PET PBR radioligand with an aryloxyanilide structure. Receptor blockade caused rapid and substantial washout of activity from brain, consistent with high levels of specific binding. Receptor blockade also markedly increased the concentration of radioligand in plasma. Thus, analysis of only the brain curves would significantly underestimate the percentage of specific binding. Instead, we estimated specific binding based on distribution volume (VT), which normalizes brain uptake relative to plasma concentrations of the radioligand. One-compartmental analysis showed good fitting (Fig. 2A) with high identifiability of VT (Table 3), and the estimates were independent of scan length after 100 min (Fig. 4). Comparison of VT between baseline and blocked scans showed that > 95% of total binding was specific in nonhuman primate brain. Because of these properties, [11C]PBR28 is a promising ligand to detect even small changes in PBRs.
Our studies of baseline and preblocked scans showed that an unusually large percentage (>95%) of brain uptake represented specific binding to PBRs in brain. Could some deficiencies of our experimental design artificially caused this high estimate? We considered two possibilities: adequacy of blockade by DAA1106 and effect of DAA1106 on plasma free fraction. First, Maeda et al. (2004) reported that 1 mg/kg DAA1106 caused ∼ 80% occupancy of PBRs in monkey brain, and we used a preblocking dose of 3 mg/kg. Thus, our dose may not have saturated all receptors, which would have caused an overestimation of nonspecific binding and an underestimation of specific binding. Second, DAA1106 may have displaced [11C]PBR28 binding to plasma proteins. If so, the resulting elevation of the radioligand’s plasma free fraction would again have overestimated nonspecific binding and underestimated specific binding. Thus, if these two factors were important in our studies, the estimated percentage of specific binding in brain would have been even greater. Nevertheless, the time course of receptor occupancy by radioligand and blocking agent (DAA1106) were certainly not identical, and any significant disparities between them may not have been adequately compensated by the compartmental modeling.
Comparison to Other PBR Radioligands
The new PET ligands based on aryloxyanilide structure (DAA1106. PBR01, PBR06, and PBR28) have about ten fold greater affinity (Ki = 0.21 - 0.59 nM) than the classical ligand PK 11195 (Ki = 4.12 nM), measured in vitro with homogenates from monkey brain (Table 1). Receptor binding at low radioligand concentrations is proportional to the product of receptor density and affinity (Innis et al., In press). Thus, higher affinity of the aryloxyanilide ligands compared to PK 11195 would generate greater specific binding in brain than PK 11195, all other factors being equal. The current study measured total distribution volume (VT) in both baseline and blocking scans with a metabolite-corrected arterial input function and found that >95% of total brain activity was specific binding. Our prior study of [11C]PBR01 and [18F]PBR06 also found relatively high percentages (∼90%) of specific brain uptake in monkeys (Imaizumi et al., 2007a). Comparable studies of specific binding corrected for plasma concentrations of radioligand have not been reported for [11C]-(R)-PK 11195. Although we cannot make a direct comparison, a study of [11C]-(R)-PK 11195 in a human with a brain tumor suggested that specific binding is less than one-third of total uptake (Pappata et al., 1991).
We previously reported that [11C]PBR01 and [18F]PBR06 have similar kinetics in plasma and brain of monkeys (Imaizumi et al., 2007a). Because the half-life of 18F is about 5.5 times longer than that of 11C, [18F]PBR06 could be imaged for a much longer time than [11C]PBR01 and thereby provided more time-stable and accurate measures of receptor binding. Thus, for an 18F-labled radioligand, we recommend [18F]PBR06.
The goal of the current study was to assess whether [11C]PBR28 would have faster kinetic parameters than [11C]PBR01 and allow earlier estimates of distribution volume. In fact, [11C]PBR28 gave more than 90% of the terminal distribution volume within 100 to 110 min, whereas [11C]PBR01 required more than 150 min. The reasons for the superior performance of [11C]PBR28 are uncertain but are likely related to its two fold lower affinity and ten fold lower lipophilicity compared to [11C]PBR01 (Table 1). Thus, on the basis of these data in nonhuman primates, we propose to advance [11C]PBR28, rather than [11C]PBR01, into human studies, although we are mindful that the kinetics may turn out to be significantly different.
Distribution and Elimination
PBR imaging in brain demonstrates the pharmacokinetic interaction of distribution and elimination because of the high density of receptors in peripheral organs. Similar effects have been reported for the serotonin transporter ligands, [11C]cyanoimipramine (Suhara et al., 1998) and [11C]DASB (Parsey et al., 2006), where lungs initially trap a high percentage of the radioligand. In fact, for [11C]PBR28, whole body imaging of monkeys showed that peripheral organs like lung and kidney contained a greater number of PBRs than brain itself (Fig. 3A). The high affinity of the PBR radioligands causes prolonged retention in non-metabolic organs. Thus, distribution of the radioligand to these protected reservoirs delays its elimination - i.e., metabolism and excretion. Furthermore, the slow return of radioligand to plasma maintains more stable concentrations and delays washout from brain.
Blockade of PBRs in the body with nonradioactive ligand markedly increased plasma concentrations of [11C]PBR28 and decreased clearance by about six fold from 1,500 to 240 mL min-1. The decreased clearance could be misinterpreted to mean that receptor blockade decreased the rate of elimination of the radioligand. We calculated clearance (CL) with the standard formula:
where dose is the injected activity and AUC is the area under the curve of plasma concentration vs. time curve. Unlike typical clinical pharmacokinetic studies, we measured many early time points (e.g., initially every 15 s) so our calculated AUC reflected distribution as well as elimination (Rowland and Tozer, 1995). Thus, the six fold decrease in clearance associated with receptor blockade was caused primarily by increased AUC, which itself reflected decreased distribution to multiple organs of the body.
Use of Two PET Cameras
For [11C]PBR28 brain imaging, we initiated studies with the GE Advance and subsequently acquired data with the higher resolution Siemens HRRT. Measured as the full-width at half maximum, the resolutions of the GE Advance and HRRT are 7.5 and 2.5 mm, respectively. Therefore, differences in resolution could affect quantitation of small targets like the choroid plexus of the 4th ventricle. The results of the choroid plexus described above were obtained using regions with an average volume of 111 mm3. To assess the effect of greater spatial resolution, images from both cameras were reanalyzed using smaller ROIs with an average volume of 17 mm3. Even for this visually detectable small structure, the small and large regions gave similar values for the HRRT and GE Advance, with average differences of 0.9% and 3.0% in VT, respectively. We also found no difference between cameras in previous experiments using [11C]PBR01 and [18F]PBR06 (Imaizumi et al., 2007a). We think the use of two cameras did not confound the interpretation of the results for large regions, since both were calibrated relative to the same phantom. In addition, the comparison between studies (e.g., baseline versus blocked) used the same device. Thus, differences between cameras due to spatial resolution did not substantially affect our results.
CONCLUSION
Binding and temporary sequestration of [11C]PBR28 in peripheral organs affected the uptake and washout of radioligand in brain. Because of these peripheral effects on distribution and because of the lack of any identifiable receptor-free background region in brain, we used compartmental modeling to quantify brain uptake and to correct for the plasma concentrations of radioligand. [11C]PBR28 showed sufficient signal and appropriate kinetics to allow quantitative analysis of the total brain uptake (specific plus nondisplaceable radioactivity) with 100 - 110 min of imaging in nonhuman primate brain. The high proportion of specific relative to nonspecific binding should provide high sensitivity to detect small changes of PBRs in brain and possibly also in peripheral organs.
Supplementary Material
ACKNOWLEDGMENTS
This research was supported by the Intramural Program of NIMH (project #Z01-MH-002795-04). We thank Jeih-San Liow, PhD for processing PET data; John Bacher, DVM for veterinarian services; Robert Gladding for acquiring the PET data; PMOD Technologies for providing its image analysis and modeling software; the staff of the PET Department for successful completion of the studies; and Amanda Farris, BS for manuscript preparation. In vitro receptor screening at all sites other than that labeled with [3H]PK 11195 were performed by the NIMH Psychoactive Drug Screening Program (contract # NO1MH32004).
Financial support: Intramural Research Program of the National Institute of Mental Health (project #Z01-MH-002795-04)
Footnotes
Publisher's Disclaimer: This is a PDF file of an unedited manuscript that has been accepted for publication. As a service to our customers we are providing this early version of the manuscript. The manuscript will undergo copyediting, typesetting, and review of the resulting proof before it is published in its final citable form. Please note that during the production process errors may be discovered which could affect the content, and all legal disclaimers that apply to the journal pertain.
References
- Akaike H. A new look at the statistical model identification. IEEE Trans. Automat. Contr. 1974;AC19:716–723. [Google Scholar]
- Anholt RR, De Souza EB, Oster-Granite ML, Snyder SH. Peripheral-type benzodiazepine receptors: autoradiographic localization in whole-body sections of neonatal rats. J. Pharmacol. Exp. Ther. 1985;233:517–526. [PubMed] [Google Scholar]
- Anholt RR, Murphy KM, Mack GE, Snyder SH. Peripheral-type benzodiazepine receptors in the central nervous system: localization to olfactory nerves. J. Neurosci. 1984;4:593–603. doi: 10.1523/JNEUROSCI.04-02-00593.1984. [DOI] [PMC free article] [PubMed] [Google Scholar]
- Anholt RR, Pedersen PL, De Souza EB, Snyder SH. The peripheral-type benzodiazepine receptor. Localization to the mitochondrial outer membrane. J. Biol. Chem. 1986;261:576–583. [PubMed] [Google Scholar]
- Banati RB. Visualising microglial activation in vivo. Glia. 2002;40:206–217. doi: 10.1002/glia.10144. [DOI] [PubMed] [Google Scholar]
- Banati RB. Neuropathological imaging: in vivo detection of glial activation as a measure of disease and adaptive change in the brain. Br. Med. Bull. 2003;65:121–131. doi: 10.1093/bmb/65.1.121. [DOI] [PubMed] [Google Scholar]
- Benavides J, Quarteronet D, Imbault F, Malgouris C, Uzan A, Renault C, Dubroeucq MC, Gueremy C, Le Fur G. Labelling of “peripheral-type” benzodiazepine binding sites in the rat brain by using [3H]PK 11195, an isoquinoline carboxamide derivative: kinetic studies and autoradiographic localization. J. Neurochem. 1983;41:1744–1750. doi: 10.1111/j.1471-4159.1983.tb00888.x. [DOI] [PubMed] [Google Scholar]
- Braestrup C, Albrechtsen R, Squires RF. High densities of benzodiazepine receptors in human cortical areas. Nature. 1977;269:702–704. doi: 10.1038/269702a0. [DOI] [PubMed] [Google Scholar]
- Briard E, Hong J, Musachio JL, Zoghbi SS, Fujita M, Imaizumi M, Cropley V, Innis RB, Pike VW. Synthesis and evaluation of two candidate 11C-labeled radioligands for brain peripheral benzodiazepine receptors. J. Label. Compd. Radiopharm. 2005a;48:S71. [Google Scholar]
- Briard E, Shah J, Musachio JL, Zoghbi SS, Fujita M, Imaizumi M, Cropley V, Innis RB, Pike VW. Synthesis and evaluation of a new 18F-labeled ligand for PET imaging of brain benzodiazepine receptors. J. Label. Compd. Radiopharm. 2005b;48(Suppl 1):S4. [Google Scholar]
- Burger C, Mikolajczyk K, Grodzki M, Rudnicki P, Szabatin M, Buck A. JAVA tools quantitative post-processing of brain PET data. J. Nucl. Med. 1998;39:277P. [Google Scholar]
- Carson R. Parameter estimation in positron emission tomography. In: Phelps M, Mazziotta J, Schelbert H, editors. Positron Emission Tomography and Autoradiography: Principles and Applications for the Brain and Heart. Raven Press; New York: 1986. pp. 347–390. [Google Scholar]
- Chaki S, Funakoshi T, Yoshikawa R, Okuyama S, Okubo T, Nakazato A, Nagamine M, Tomisawa K. Binding characteristics of [3H]DAA1106, a novel and selective ligand for peripheral benzodiazepine receptors. Eur. J. Pharmacol. 1999;371:197–204. doi: 10.1016/s0014-2999(99)00118-1. [DOI] [PubMed] [Google Scholar]
- Cheng Y, Prusoff WH. Relationship between the inhibition constant (Ki) and the concentration of inhibitor which causes 50 per cent inhibition (IC50) of an enzymatic reaction. Biochem. Pharmacol. 1973;22:3099–3108. doi: 10.1016/0006-2952(73)90196-2. [DOI] [PubMed] [Google Scholar]
- Cunningham V, Lammertsma A. Radioligand studies in brain: Kinetic analysis of PET data. Med. Chem. Res. 1995:5. [Google Scholar]
- Cymerman U, Pazos A, Palacios JM. Evidence for species differences in ‘peripheral’ benzodiazepine receptors: an autoradiographic study. Neurosci. Lett. 1986;66:153–158. doi: 10.1016/0304-3940(86)90182-5. [DOI] [PubMed] [Google Scholar]
- Fujimura Y, Ikoma Y, Yasuno F, Suhara T, Ota M, Matsumoto R, Nozaki S, Takano A, Kosaka J, Zhang MR, Nakao R, Suzuki K, Kato N, Ito H. Quantitative analyses of 18F-FEDAA1106 binding to peripheral benzodiazepine receptors in living human brain. J. Nucl. Med. 2006;47:43–50. [PubMed] [Google Scholar]
- Galiegue S, Tinel N, Casellas P. The peripheral benzodiazepine receptor: a promising therapeutic drug target. Curr. Med. Chem. 2003;10:1563–1572. doi: 10.2174/0929867033457223. [DOI] [PubMed] [Google Scholar]
- Hawkins RA, Phelps ME, Huang S-C. Effects of temporal sampling, glucose metabolic rates, and disruptions of the blood-brain barrier on the FDG model with and without a vascular compartment: studies in human brain tumors with PET. J. Cereb. Blood Flow Metab. 1986;6:170–183. doi: 10.1038/jcbfm.1986.30. [DOI] [PubMed] [Google Scholar]
- Ikoma Y, Yasuno F, Ito H, Suhara T, Ota M, Toyama H, Fujimura Y, Takano A, Maeda J, Zhang MR, Nakao R, Suzuki K. Quantitative analysis for estimating binding potential of the peripheral benzodiazepine receptor with [11C]DAA1106. J. Cereb. Blood Flow Metab. 2007;27:173–184. doi: 10.1038/sj.jcbfm.9600325. [DOI] [PubMed] [Google Scholar]
- Imaizumi M, Briard E, Zoghbi SS, Gourley JP, Hong J, Musachio JL, Gladding R, Pike VW, Innis RB, Fujita M. Kinetic evaluation in nonhuman primates of two new PET ligands for peripheral benzodiazepine receptors in brain. Synapse. 2007a;61:595–605. doi: 10.1002/syn.20394. [DOI] [PubMed] [Google Scholar]
- Imaizumi M, Kim HJ, Zoghbi SS, Briard E, Hong J, Musachio JL, Ruetzler C, Chuang DM, Pike VW, Innis RB, Fujita M. PET imaging with [11C]PBR28 can localize and quantify upregulated peripheral benzodiazepine receptors associated with cerebral ischemia in rat. Neurosci. Lett. 2007b;411:200–205. doi: 10.1016/j.neulet.2006.09.093. [DOI] [PubMed] [Google Scholar]
- Innis RB, Cunningham VJ, Delforge J, Fujita M, Gjedde A, Gunn RN, Holden J, Houle S, Huang S-C, Ichise M, Iida H, Ito H, Kimura Y, Koeppe RA, Knudsen GM, Knuuti J, Lammertsma AA, Laruelle M, Logan J, Maguire RP, Mintun MA, Morris ED, Parsey R, Price JC, Slifstein M, Sossi V, Suhara T, Votaw JR, Wong DF, Carson RE. Consensus nomenclature for in vivo imaging of reversibly binding radioligands. J. Cereb. Blood Flow Metab. doi: 10.1038/sj.jcbfm.9600493. In press. [DOI] [PubMed] [Google Scholar]
- Maeda J, Suhara T, Zhang MR, Okauchi T, Yasuno F, Ikoma Y, Inaji M, Nagai Y, Takano A, Obayashi S, Suzuki K. Novel peripheral benzodiazepine receptor ligand [11C]DAA1106 for PET: an imaging tool for glial cells in the brain. Synapse. 2004;52:283–291. doi: 10.1002/syn.20027. [DOI] [PubMed] [Google Scholar]
- Okuyama S, Chaki S, Yoshikawa R, Ogawa S, Suzuki Y, Okubo T, Nakazato A, Nagamine M, Tomisawa K. Neuropharmacological profile of peripheral benzodiazepine receptor agonists, DAA1097 and DAA1106. Life Sci. 1999;64:1455–1464. doi: 10.1016/s0024-3205(99)00079-x. [DOI] [PubMed] [Google Scholar]
- Papadopoulos V, Baraldi M, Guilarte TR, Knudsen TB, Lacapere JJ, Lindemann P, Norenberg MD, Nutt D, Weizman A, Zhang MR, Gavish M. Translocator protein (18kDa): new nomenclature for the peripheral-type benzodiazepine receptor based on its structure and molecular function. Trends Pharmacol. Sci. 2006;27:402–409. doi: 10.1016/j.tips.2006.06.005. [DOI] [PubMed] [Google Scholar]
- Pappata S, Cornu P, Samson Y, Prenant C, Benavides J, Scatton B, Crouzel C, Hauw JJ, Syrota A. PET study of carbon-11-PK 11195 binding to peripheral type benzodiazepine sites in glioblastoma: a case report. J. Nucl. Med. 1991;32:1608–1610. [PubMed] [Google Scholar]
- Parsey RV, Ojha A, Ogden RT, Erlandsson K, Kumar D, Landgrebe M, Van Heertum R, Mann JJ. Metabolite considerations in the in vivo quantification of serotonin transporters using 11C-DASB and PET in humans. J. Nucl. Med. 2006;47:1796–1802. [PubMed] [Google Scholar]
- Rowland M, Tozer T. Lea and Fibiger. 1995. Clinical Pharmacokinetics, Concepts and Applications. Chapter 19. [Google Scholar]
- Suhara T, Sudo Y, Yoshida K, Okubo Y, Fukuda H, Obata T, Yoshikawa K, Suzuki K, Sasaki Y. Lung as reservoir for antidepressants in pharmacokinetic drug interactions. Lancet. 1998;351:332–335. doi: 10.1016/S0140-6736(97)07336-4. [DOI] [PubMed] [Google Scholar]
- Zhang MR, Kida T, Noguchi J, Furutsuka K, Maeda J, Suhara T, Suzuki K. [11C]DAA1106: radiosynthesis and in vivo binding to peripheral benzodiazepine receptors in mouse brain. Nucl. Med. Biol. 2003;30:513–519. doi: 10.1016/s0969-8051(03)00016-7. [DOI] [PubMed] [Google Scholar]
- Zoghbi SS, Shetty HU, Ichise M, Fujita M, Imaizumi M, Liow J-S, Shah J, Musachio JL, Pike VW, Innis RB. PET imaging of the dopamine transporter with [18F]FECNT: A polar radiolabeled metabolite confounds brain radioligand measurements. J. Nucl. Med. 2006;47:520–527. [PubMed] [Google Scholar]
Associated Data
This section collects any data citations, data availability statements, or supplementary materials included in this article.