


Abstract
An RNA-binding protein places a surface helix, β-ribbon, or loop in an RNA helix groove and/or uses a cavity to accommodate unstacked bases. Hence, our strategy for predicting RNA-binding residues is based on detecting a surface patch and a disparate cleft. These were generated and scored according to the gas-phase electrostatic energy change upon mutating each residue to Asp−/Glu− and each residue's relative conservation. The method requires as input the protein structure and sufficient homologous sequences to define each residue's relative conservation. It yields as output a priority list of surface patch residues followed by a backup list of surface cleft residues distant from the patch residues for experimental testing of RNA binding. Among the 69 structurally non-homologous proteins tested, 81% possess a RNA-binding site with at least 70% of the maximum number of true positives in randomly generated patches of the same size as the predicted site; only two proteins did not contain any true RNA-binding residues in both predicted regions. Regardless of the protein conformational changes upon RNA-binding, the prediction accuracies based on the RNA-free/bound protein structures were found to be comparable and their binding sites overlapped as long as there are no disordered RNA-binding regions in the free structure that are ordered in the corresponding RNA-bound protein structure.
INTRODUCTION
During post-transcriptional control, RNA metabolic processes such as splicing, polyadenylation, messenger RNA (mRNA) stability, mRNA localization and translation occur. All these chemical reactions involving RNA depend on the interactions between RNA and their target proteins. Consequently, identifying the key RNA recognition amino acid (aa) residues is important for understanding various critical biological processes such as mRNA processing, gene expression, protein synthesis, viral replication, cellular defense and developmental regulation (1). Despite the importance of protein–RNA interactions, they are less well understood compared with protein–DNA interactions primarily because RNA structures are more varied than DNA structures, resulting in a wider range of mechanisms for protein–RNA interactions. Whereas proteins seldom bind single-stranded (ss) DNA, they often bind ssRNA in a variety of secondary structures such as hairpins/stem-loops, bulges and loops (2). Furthermore, although RNA differs from DNA by the substitution of uracil for thymine and the presence of a 2′-OH group, their double-stranded (ds) conformations are quite different: dsRNA is found mainly in the A conformation with a narrow and deep major groove and a broad, shallow minor groove, but dsDNA is found mainly in the B conformation with a wide and accessible major groove but a narrow and deep minor groove (2).
Several statistical analyses of protein–RNA complex structures in the Protein Data Bank (PDB) (3) have revealed the following features of protein−RNA interactions (4–10). Proteins bind RNA either by placing a secondary structure such as an α-helix, a 310-helix, a β-ribbon, or a loop in the groove of an RNA helix or by using β-sheet surfaces to create binding pockets in order to accommodate unstacked ssRNA bases (5). These empirical observations imply that the RNA binds either to a surface patch and/or to a cavity in the protein. The statistical analyses have also suggested some factors governing RNA-binding affinity and specificity. RNA-binding proteins achieve (i) RNA-binding affinity through favorable charge−charge interactions between positively charged Arg and Lys residues and the negatively charged RNA phosphate and (ii) specificity through directional hydrogen–bonding interactions and van der Waals (vdW) or non-polar contacts with specific bases as well as steric exclusion of other bases (5,9,10). DNA-binding proteins employ a similar recognition strategy to bind dsDNA except that cavities and non-polar contacts are less frequently employed (5).
In addition to the aforementioned statistical analyses, a few studies have also attempted to predict RNA-binding proteins or residues. Given the protein sequence, support vector machines have been used to identify RNA-binding proteins and to assign them to different functional classes depending on the type of RNA bound (11–13). Support vector machines have also been used to predict RNA-binding sites from the protein sequence with ∼69% accuracy, 70% specificity and 66% sensitivity (14). Other machine learning approaches using a neural network classifier (15) and a Naïve Bayes classifier (16), trained and tested on the same data set, yielded similar performance with an accuracy around 77%, specificity equal to 47% and sensitivity between 40–43%. In addition to sequence-based methods, residue and residue pairing preferences at the protein–RNA interface and the relative residue conservation at each position have been used to predict protein–RNA interface residues given the 3D structure and homologous sequences of a RNA-binding protein (17). However, the specificity+ (the ratio of true positives to predicted interface residues) and sensitivity+ (the ratio of true positives to true interface residues) of the prediction are anti-correlated; hence although the specificity+ reached as high as 80%, the corresponding sensitivity+ is only 10%. Interestingly, conservation alone was found to be a poor predictor of RNA interfaces, as the highest specificity+ was only ∼40%. This is because not all highly conserved surface residues constitute protein–RNA interface residues; thus considering conservation alone led to many false positives.
Here, given the 3D structure of a RNA-binding protein and its sequence homologs, we present a strategy for predicting RNA-binding regions on the basis of the following three criteria: The first criterion relies on the empirical observation that RNA-binding sites are comprised of multiple disparate regions, which are located not only on surface patches in analogy to DNA-binding sites, but also in binding pockets/cavities (5,10). The second criterion is founded on the physical principle that the RNA-binding site contains electropositive atoms providing charge–charge/dipole/quadrupole and hydrogen bonding interactions with electronegative RNA atoms. In the absence of RNA or water molecules, the positively charged or polar aa residues containing these electropositive atoms are in an unfavorable electrostatic environment (18); replacing one of these residues with a negatively charged Asp−/Glu− would therefore alleviate the electrostatic repulsion among the electropositive atoms. The third criterion is based on an evolutionary principle that functionally important residues and aa residues in the vicinity, which form a cluster of spatially interacting residues, are usually highly conserved within the same family (19). Consequently, our strategy for predicting RNA-binding residues first generates irregular surface patches and clefts based on the second and third criteria. It then makes use of the first criterion to identify two disparate RNA-binding regions: (i) an irregular patch containing residues that are not only the most conserved, but also most electrostatically stabilized in the absence of solvent upon mutation to Asp−/Glu− out of all the surface patches generated and (ii) a cleft containing the most conserved residues among the clefts generated. The method was tested first on a set of 69 structurally non-homologous proteins with RNA-bound structures and subsequently, on a smaller subset containing 18 proteins with 3D structures in the absence and presence of RNA.
MATERIALS AND METHODS
Test set of RNA-binding proteins
The method for predicting RNA-binding sites was tested on a heterogeneous set of 69 structurally non-homologous RNA-binding proteins with RNA-bound X-ray structures solved to ≤3 Å resolution. This dataset was taken from our previous work (20), but five proteins with insufficient sequence homologs to define the conservation of each residue were omitted. The type of RNA bound to the protein such as dsRNA, mRNA, ribosomal RNA (rRNA), small nuclear RNA (snRNA), signal recognition particle RNA (srpRNA), transfer RNA (tRNA) and viral RNA (vRNA), the corresponding PDB code/chain and chain length are listed in the first three columns of Table 1, respectively.
Table 1.
RNA-binding residue predictions based on the 3D structures of 69 structurally non-homologous protein–RNA complexes
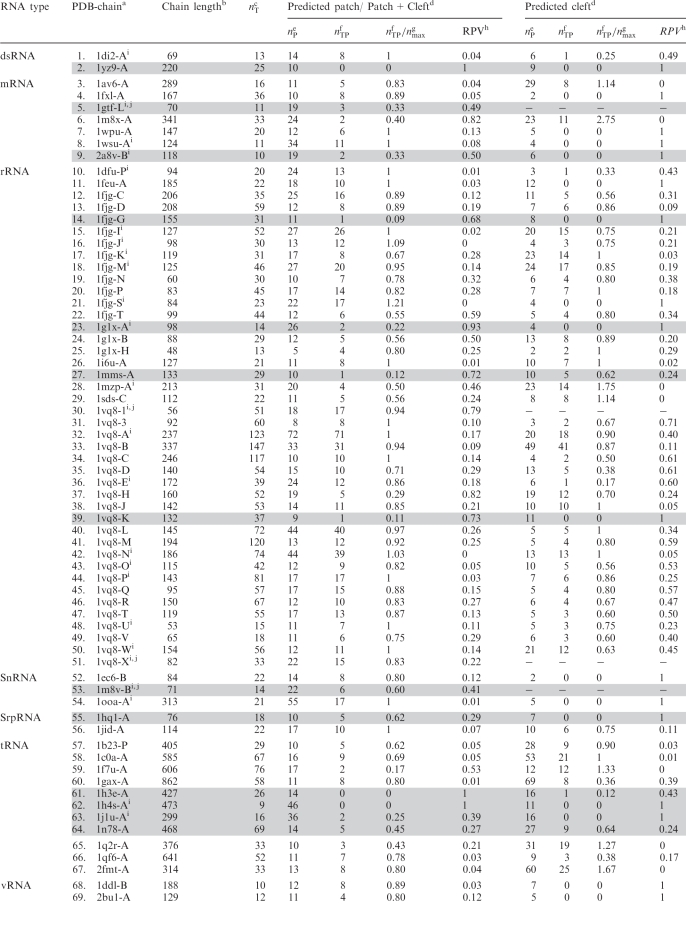 |
aPDB entry of the RNA-bound protein structure followed by the protein chain.
bThe number of aa residues in the protein chain.
cThe number of true RNA-binding residues based on the protein/RNA complex structure.
dThe patch or cleft is generated and scored as described in the Materials and Methods section.
eThe number of predicted RNA-binding residues, which is equal to the number of solvent accessible residues in the patch/cleft.
fThe number of true positives or correctly predicted RNA-binding residues in the patch/cleft.
gThe maximum number of true-positive RNA-binding residues among all the randomly generated patches. Proteins with nTP/nmax < 0.7 in both predicted regions are highlighted by the gray background.
hThe random pick value (RPV), is the fraction of random patches with true-positive RNA-binding residues ≥nTP.
iThe top-ranked patch is merged with nearby top-ranking clefts.
jFor these small proteins, two disparate RNA-binding sites could not be found, and only a single RNA-binding site was predicted.
The method for predicting RNA-binding sites was also tested on a heterogeneous set of 18 structurally non-homologous RNA-binding proteins with both RNA-bound and RNA-free X-ray structures solved to ≤3 Å resolution (Table 2). This dataset was obtained by searching the PDB for all RNA-binding proteins with the same CATH code (21) as that of the representative RNA-bound protein and whose structures have been solved to ≤3 Å resolution in the absence of RNA. Among the RNA-free protein structures with the same CATH code, the highest resolution structure was selected as the representative structure. The type of RNA bound to the protein, the PDB code/chain of the RNA-free and corresponding RNA-bound protein are listed in the first three columns of Table 2, respectively.
Table 2.
RNA-binding residue predictions based on the 3D structures of 18 structurally non-homologous RNA-free and RNA-bound proteinsa
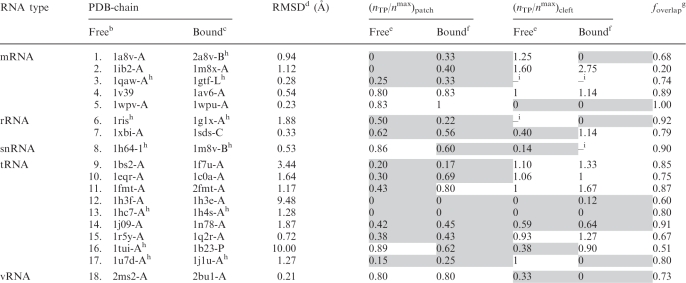 |
aSee footnotes to Table 1, except that the gray background highlights predicted regions with nTP/nmax < 0.7.
bPDB entry of the RNA-free protein structure.
cPDB entry of the RNA-bound protein structure.
dThe root mean square deviation of the Cα atoms in the RNA-free protein structure relative to the respective RNA-bound protein structure.
eThe ratio of nTP to nmax in the patch or cleft predicted using the RNA-free protein structure.
fThe ratio of nTP to nmax in the patch or cleft predicted using the RNA-bound protein structure.
gThe overlapping fraction, foverlap, is computed according to Equation 5.
hThe top-ranked patch is merged with nearby top-ranking clefts.
iThe dash sign means that another disparate RNA-binding site could not be found.
Definition of true RNA-binding residues
A residue was defined as RNA-binding if any of its non-hydrogen atoms are within vdW contact or hydrogen bonding distance to any RNA non-hydrogen atom directly or indirectly via a bridging water molecule. The HBPLUS (22) program was used to compute all possible vdW contacts and hydrogen bonds in the protein–RNA complex structure, which are defined by a donor atom to an acceptor atom distance of 3.9 and 3.35 Å, respectively. The number of true RNA-binding residues in each protein–RNA complex structure, nT, is listed in column four of Table 1.
Definition of solvent accessible residues
The percentage aa accessibility is defined as the percent ratio of the solvent-accessible surface area (SASA) of the side-chain X in the protein to the SASA of X in the tripeptide, –Gly–X–Gly–. As in previous studies (23), an aa with a relative SASA >5% is considered accessible for interacting with RNA, whereas that with a relative SASA ≤5% is deemed buried and inaccessible to a RNA molecule. The MOLMOL (24) program was used to compute the relative SASA of each aa from the protein structure using a solvent probe radius of 1.4 Å.
Assignment of protonation states of ionizable residues
For a given RNA-binding protein, all Asp/Glu residues were deprotonated, while Arg/Lys residues were protonated. His residues were protonated if both side chain nitrogen atoms were within hydrogen bonding distance to any aa acceptor atom or water oxygen; otherwise they were assumed to be neutral, and the side chain nitrogen that is within hydrogen bonding distance of an acceptor atom or water oxygen in the protein was protonated.
Electrostatic ranking of each residue
Each residue was assigned an ‘electrostatic rank’ (denoted as Rankelei) based on whether it and its surrounding residues became electrostatically stabilized upon mutation to Asp−/Glu−. Thus, given the 3D structure of a l-residue RNA-binding protein, l mutant structures were generated by mutating each wild-type aa to Asp−/Glu− depending on its size and shape. Ala, Asn, Asp, Cys, Gly, Ser, Thr, or Val were mutated to Asp−, while the other residues were mutated to Glu−. The side chain replacements were carried out using the SCWRL (25) program, which identifies the most common side-chain χ1 and χ2 angles for the mutant Asp−/Glu− residue corresponding to the backbone ϕ and ψ angles of the wild-type residue at that position. Each mutant structure was then energy minimized with heavy constraints on all non-hydrogen atoms using the AMBER (26) program to relieve bad contacts.
Having generated the l mutant structures, the gas-phase electrostatic energy of the wild-type ( ) or mutant (
 ) protein in the folded state relative to that in an extended reference state (
 or
or  ) was computed. In this extended reference state, the residues do not interact with one another, hence the electrostatic energy of the wild-type (
 ) or mutant (
 ) unfolded protein is simply the sum of the individual residue energies, and their difference is equal to the difference between the electrostatic energies of the native residue at position i (
 ) and the corresponding mutant Asp−/Glu− residue (
 ). Thus, the change in the gas-phase electrostatic energy upon mutating aa i to Asp−/Glu− is given by:
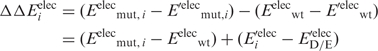 |
1 |
A negative ΔΔEeleci implies that aa i is electrostatically stabilized upon mutation to an Asp−/Glu−. The gas-phase electrostatic energies were computed with the all-hydrogen-atom AMBER force field (27) with ε = 1 using the AMBER (26) program.
Knowing  , the average electrostatic energy change of aa i and its surrounding, <ΔΔEelec>i was computed from:
| 2 |
where the summation in Equation (2) is over  residues, which include aa i and all residues j whose Cα atoms are within 10 Å of the Cα atom of aa i. The l <ΔΔEelec>i values were then ordered from the most negative to the least negative/most positive and used to rank the l residues from 1 to 10 such that residues with the top 10% most negative <ΔΔEelec>i values were ranked 1, residues with the next 10% most negative <ΔΔEelec>i values were ranked 2, etc. (Supplementary Table S1).
Evolutionary ranking of each residue
Each residue was also assigned a ‘conservation rank’ (denoted as  ) based on the relative conservation of the residue and its surrounding residues. For residue at position i in a given RNA-binding protein, a conservation score, Ci, was computed by the ConSurf program version 3.0 (19,28). The Ci score reflects the evolutionary rate of the residue at position i in the phylogenetic tree generated on the basis of a protein's homologous sequences. The Ci score is an integer number, ranging from 1 to 9, with 1 indicating a rapidly evolving and thus variable residue at position i, whereas 9, a slowly evolving, conserved residue.
Knowing the Ci values, the average conservation of aa i and its surrounding, <C>i, was computed from:
| 3 |
where the summation in Equation (3) is over aa i and all residues j whose Cα atoms are within 10 Å of the Cα atom of aa i. Residues were then ranked from 1 to 10 such that residues with the top 10% largest <C>i values were ranked 1, residues with the next 10% largest <C>i values were ranked 2, etc. (Supplementary Table S1).
Combined electrostatic and evolutionary ranking of each residue
The  and
and  values were multiplied to yield an overall ranking of each residue, denoted as Ranki. Residues were ranked from 1 to 10 such that residues with the top 10% smallest
  values were ranked 1, residues with the next 10% smallest
  values were ranked 2, etc. (Supplementary Table S1).
Generating surface patches
Given the 3D structure of a l-residue RNA-binding protein, l irregular patches of various sizes were generated as follows: The Cα atom of each residue was chosen as the center of a patch and used to search for the nearest neighboring residue. If the latter residue has an overall electrostatic and evolutionary Rank≤5, it was included in the patch and its Cα atom defined a new center to search for the nearest neighboring residue. This process was repeated until the nearest neighboring residue had a Rank >5. Patches containing at least 10 solvent accessible (surface) residues were considered as RNA-binding site candidates. However, if <3 patch candidates were found, the minimum number of surface residues in a patch was reduced by one successively until three or more candidates were found.
Generating protein clefts
Given the 3D protein structure, the 10 largest clefts (comprising cavities and grooves) were found using the SURFNET program (29). The SURFNET algorithm detects clefts; i.e. gap regions, by fitting spheres into spaces between any two atoms [see (29) for details]. If any atom of a residue was assigned as a constituent of the cleft by the SURFNET program, then this residue was regarded as a component of the cleft. When atoms of a residue were assigned to two different clefts, the residue was assigned to the larger of the two clefts. Residues constituting a given cleft were removed if their overall Rank is >5. Clefts with 10 or more solvent accessible residues were considered as RNA-binding site candidates. However, if <3 cleft candidates were found, the minimum number of surface residues in the cleft was reduced by one successively until three or more candidates were found.
Predicting RNA-binding residues
For each RNA-binding protein, two disparate RNA-binding regions were predicted, namely, a surface patch and a cleft. Each patch was scored using the  and
and  values according to Equation (4):
| 4 |
where the summation is over all Npatchi residues constituting patch i. The patch region with the smallest < > value (denoted by Patch1) is predicted to be the RNA-binding site. On the other hand, each cleft was scored according to the mean Ci value of all the residues constituting the cleft. The cleft with the largest <C> value (denoted by Cleft1) is predicted to be another RNA-binding site.
To determine if the two predicted regions are disparate, the center of gravity of each region was determined, and the closest Cα atom was chosen as the respective center. If the distance between the Patch1 and Cleft1 centers is more than 10 Å, the two predicted RNA-binding regions are considered disparate. However, if this distance is ≤10 Å, Patch1 and Cleft1 were merged to yield a single RNA-binding region, and its gravity center was determined. In this case, another disparate RNA-binding candidate was determined by considering either the cleft with the next largest <C> or the patch with the next smallest <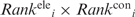 > value. The closest Cα atom to the gravity center of the RNA-binding candidate was chosen as the respective center, and its distance to the merged Patch1 and Cleft1 center was evaluated. If this distance is <10 Å, the procedure was repeated; otherwise it was halted. The putative RNA-binding residues are the solvent accessible residues in the two disparate RNA-binding regions; the total number of solvent accessible residues in each predicted RNA-binding region, nP, is given in Table 1.
Assessing the statistical significance of the predicted RNA-binding sites
For a given l-residue RNA-binding protein, if nTP of the nP surface residues are true positives, the statistical significance of such a prediction was assessed by computing the random pick value, (RPV), which is the probability of randomly picking a nP-residue surface region whose number of true RNA-binding residues is greater than or equal to that in the predicted site. Thus, l ‘random’ patches with the same number of nP surface residues as the predicted patch or cleft were generated by choosing the Cα atom of each residue as an initial center to search for the nearest neighboring residue. The latter residue was included in the patch and its Cα atom defined a new center to search for the nearest neighboring residue. This process was repeated until the ‘random’ patch contained nP surface residues, which are assumed to bind RNA. Among the nP surface residues in each random patch, the number, nTR, of true RNA-binding residues was counted and the maximum number, nmax, was recorded. The RPV value was then computed as the fraction of random patches with nTR ≥ nTP. An RPV equal to zero means that zero chance of randomly picking a patch with nP surface residues containing greater than or equal to nTP true RNA-binding residues, whereas an RPV equal to one indicates no RNA-binding residues in the predicted RNA-binding region.
Assessing the accuracy of the predicted RNA-binding sites
The strategy used to assess the accuracy of a given prediction is similar to that used in previous studies (18,30): the prediction for a given RNA-binding protein was deemed correct if the number of true positives, nTP, in the predicted RNA-binding region is ≥0.7 nmax; i.e. nTP/nmax ≥ 0.7.
Analyzing the overlap between the RNA-binding sites from the RNA-free and RNA-bound protein structures
The extent to which a RNA-binding site derived from the RNA-free protein structure overlapped with that derived from the corresponding RNA-bound structure was analyzed as follows. Let  and
and  denote the total number of predicted RNA-binding residues derived from the RNA-free and RNA-bound protein structures, respectively, while
  is the number of predicted RNA-binding residues common to both binding sites. The overlapping fraction, foverlap, is defined as
| 5a |
| 5b |
For example, the total number of predicted RNA-binding residues based on the free 1a8v-A structure is 19, while that based on the RNA-bound 2a8v-B structure is 25. Since 13 predicted RNA-binding residues are common to both binding sites, the overlapping fraction, foverlap = 13/19 = 0.68 (Supplementary Table S2).
RESULTS
Given the 3D structure of a RNA-binding protein, our method predicted two disparate RNA-binding sites. To validate the method, it was first tested on 69 structurally non-homologous proteins whose structures have been solved in the presence of RNA. For each predicted site, Table 1 lists (i) nP, the total number of predicted RNA-binding residues; (ii) nTP, the number of predicted RNA-binding residues that truly bind RNA; i.e. the number of true positives; (iii) nTP/nmax, the ratio of the number of true positives in the predicted site to the maximum number of true positives in randomly generated patches, each containing nP surface residues; and (iv) RPV, the probability of randomly picking a nP surface residue region whose number of true RNA-binding residues is greater than or equal to that in the predicted site. Figure 1 illustrates a predicted RNA-binding patch. For some small proteins, two disparate RNA-binding sites could not be found, and only a single RNA-binding site was predicted. Proteins with no correctly predicted region(s); i.e. nTP/nmax < 0.7, are shaded.
Figure 1.

Predicted RNA-binding residues in the top merged patch+cleft (in blue) derived using the RNA-free elongation factor tu structure (1tui-A). The ‘true’ RNA-binding residues derived from the respective RNA-bound structure (1b23-P) structure are in yellow, while those that are correctly predicted are in cyan.
Predicting a single RNA-binding site
For a given RNA-binding protein, if we first choose the top-ranked surface patch and then a spatially disparate cleft, the first predicted RNA-binding region corresponds to either the top-ranked patch (if its center is more than 10 Å from the top-ranked cleft center) or the top-ranked patch merged with nearby top-ranking clefts (see Materials and Methods section). Among the 69 structurally non-homologous RNA-binding proteins, 65% (or 45/69) had a correctly predicted RNA-binding patch or patch + cleft with nTP/nmax ≥ 0.7; out of these, 47% (21/45) were statistically significant with RPV ≤0.1 (Table 1). A correctly predicted ribosomal protein (1vq8-1) exhibited a rather high RPV value of 0.79, indicating a 79% chance of randomly choosing a patch containing the same number of surface residues and ≥ number of true RNA-binding residues as the predicted patch. This is because this protein is essentially a RNA-binding domain with 91% (51/56) of the constituent residues involved in RNA binding. Three proteins, one bound to dsRNA (1yz9-A) and two bound to tRNA (1h3e-A, 1h4s-A) have predicted patches with RPV = 1, indicating no ‘true’ RNA-binding residues were predicted.
On the other hand, if we first choose the top-ranked cleft and subsequently a spatially disparate patch, the first predicted RNA-binding region corresponds to the top-ranked cleft alone or merged with nearby top-ranking patches (see Materials and Methods section). Based solely on the predicted cleft or cleft + patch for each protein, 59% (or 41/69) were correctly predicted with nTP/nmax ≥ 0.7 (Supplementary Table S3). Furthermore, 11 proteins possess no ‘true’ RNA-binding residues (RPV = 1) in the predicted cleft region; viz., 1yz9-A, 1fxl-A, 1wpu-A, 1feu-A, 1fjg-G, 1vq8-K, 1ec6-B, 1hq1-A, 1h4s-A, 1ddl-B and 2bu1-A. Thus, when only one RNA-binding site is predicted for each protein, choosing first a patch instead of a cleft yields better prediction accuracy.
Predicting two disparate RNA-binding sites
Since RNA-binding sites are comprised of multiple disparate regions located on surface patches or clefts (see Introduction section), a cleft with highest mean conservation <C> that was spatially disparate from the top-ranked patch was also predicted as a RNA-binding site (see Materials and Methods section). Including a disparate RNA-binding cleft, in addition to the predicted patch, improved the accuracy of the RNA-binding residue prediction by 16%: out of the 69 test proteins in Table 1, 56 or 81% had at least one correctly predicted RNA-binding site with nTP/nmax ≥ 0.7. The RNA-binding site predictions for 11 RNA-binding proteins with insufficient true positives in the predicted patches were rescued by the cleft prediction. These correspond to the PDB chains 1m8x-A, 1fjg-K, 1fjg-T, 1g1x-B, 1mzp-A, 1sds-C, 1vq8-H, 1b23-P, 1c0a-A, 1f7u-A and 1q2r-A. For example, in the pumilio-homology domain complexed with mRNA, 1m8x-A, the predicted patch contains only two true positive RNA-binding residues, but the introduced cleft comprises 11 true positive RNA-binding residues with RPV = 0, meaning zero chance of randomly picking a patch with the same number of surface residues and ≥ number of true RNA-binding residues as the predicted cleft. However, two proteins (1yz9-A and 1h4s-A) did not contain any true RNA-binding residues (RPV = 1) in both predicted regions. Out of the 45 proteins with correct patch predictions, only 20 proteins also had correct predictions for the spatially disparate cleft. The above results indicate experimentally testing the top-ranked patch or merged patch + cleft before testing the spatially disparate cleft of a given protein for RNA binding.
For 44 proteins in Table 1, the top-ranked cleft and patch are spatially disparate, but for the remaining 25 proteins, the results may depend on the order in which the RNA-binding sites are chosen. The above accuracy of 81% was obtained by choosing first the top-ranked surface patch and then a spatially disparate cleft. If, instead, we chose first the top-ranked cleft and subsequently a spatially disparate patch, a comparable accuracy of 83% was obtained: 57/69 had at least one correctly predicted RNA-binding site with nTP/nmax ≥ 0.7 (Supplementary Table S3). Thus, when two disparate RNA-binding sites are predicted, the prediction accuracy is not too sensitive to the first choice of a patch or a cleft, in contrast to that for a single RNA-binding site.
Effect of conformational changes upon RNA binding on RNA-binding site prediction
To evaluate how the predicted RNA-binding sites/residues would change when protein conformational changes upon RNA binding were neglected in using the RNA-free protein structures, the method was applied to a test set of 18 non-homologous proteins whose X-ray structures had been solved in the absence and presence of RNA. For the test proteins in Table 2, the Cα root mean square deviation (RMSD) of the RNA-free structure from the respective RNA-bound structure ranges from 0.21 to 10 Å. Regardless of the protein conformational changes upon RNA binding, the prediction accuracy based on the RNA-free and RNA-bound protein structures are comparable: 12 versus 10 of the 18 test proteins in Table 2 had at least one correctly predicted RNA-binding site with nTP/nmax ≥ 0.7 based on the RNA-free and RNA-bound protein structures, respectively.
To further assess the sensitivity of our method to protein conformational changes accompanying RNA binding, we identified those RNA-binding residues derived from the RNA-free and RNA-bound protein structures that are identical, and computed the overlapping fraction, foverlap, according to Equation (5). The foverlap values in Table 2 indicate that more than half of the RNA-binding residues derived from the RNA-free and RNA-bound protein structures are identical for all but the 1ib2-A RNA-free protein. Notably, even when the Cα RMSD of the RNA-free protein, 1tui, from the respective tRNA-bound structure (1b23) is as large as 10 Å, half of the RNA-binding residues derived from the two structures are identical; also 13/18 proteins in Table 2 exhibit foverlap ≥ 0.70.
Analyses of the proteins with foverlap <0.7 show that the RNA-binding residues predicted from the bound states of three proteins are missing in the corresponding free structures. For example, residues 1141–1143, 1145–1150, 1152–1156, 1158–1159 and 1161–1168 comprise the patch predicted from the RNA-bound structure of pumilio-homology domain (1m8x-A), but residues 1150–1168 are missing in the respective RNA-free structure (1ib2-A); hence foverlap = 0.20. Based on the RNA-bound structure of tyrosyl-tRNA synthetase (1h3e-A), the predicted RNA-binding cleft comprises of residues 79, 82, 83, 92, 144, 148, 149, 153, 167−171, 173, 174, 178, but residues 80–100 in the free structure (1h3f-A) are missing. Likewise, based on the RNA-bound structure of queuine tRNA-ribosyltransferase (1q2r-A), the predicted RNA-binding cleft is composed of residues 45, 47–49, 52, 73, 76–78, 92, 102, 106, 110, 111, 127, 128, 232–234, 260, 261, 264, 280–283, 286, 289, 290, 292 and 303, but residues 110 and 125–133 are missing in the free structure (1r5y). Interestingly, a stretch of missing residues in the free 1h3f-A (aa 85–100) and 1r5y (aa 125–133) structures are predicted to be disordered according to the neural network VLXT and/or VSL1 predictors of natural disordered regions (PONDR) (31,32). [Access to PONDR® was provided by Molecular Kinetics (6201 La Pas Trail-Ste 160, Indianapolis, IN 46268; 317-280-8737; E-mail: main@molecularkinetics.com). VL-XT is copyright© 1999 by the WSU Research Foundation, all rights reserved. PONDR® is copyright© 2004 by Molecular Kinetics, all rights reserved]. The above analysis shows that the binding sites predicted from the RNA-free and RNA-bound protein structures overlap if there are no disordered RNA-binding regions in the free structure that are ordered in the corresponding RNA-bound protein structure.
To further verify that our method is not too sensitive to protein conformational changes, the method was applied not only to the representative RNA-free structures, but also to the respective homologous structures of lower resolution. The results summarized in Supplementary Table S4 show that the prediction accuracy based on the representative structures is generally unchanged when lower-resolution homologous structures are employed, provided that residues missing in the representative X-ray structure are also missing at the respective positions in the homologous structures. In a few cases, however, the representative structure yielded no true RNA-binding residues (nTP/nmax = 0), but the lower-resolution homologous structure yielded a correctly predicted site with nTP/nmax ≥ 0.7. One reason is due to missing RNA-binding residues in the representative structure that are resolved in the respective homologous structure. For example, RNA-binding residues 1156 and 1159 are missing in the 1.9 Å 1ib2-A representative structure, but are present in the 2.2 Å 1m8w homologous structure. Likewise, the side chains of RNA-binding residues 41 and 60 are missing in the 1wpv-A and 1wpt-A structures, respectively, but are present in the other homologous structures (1wrn, 1wro, 1vea, 1wps).
DISCUSSION
In this article, we have developed a reliable method for predicting two disparate RNA-binding sites on a given RNA-binding protein based on detecting evolutionarily conserved residues located in (i) an electrostatically unstable surface patch and (ii) a cavity or groove. The method requires as input the protein structure and sufficient homologous sequences to define the relative conservation of each residue. It yields as output two sets of putative RNA-binding residues: the first set derived from a surface patch should be experimentally verified before testing the second set derived from a protein cleft. The method has the advantage of not being too sensitive to protein conformational changes upon RNA binding (Table 2 and Supplementary Table S4). On the other hand, it has the limitation of not being able to predict those RNA-binding regions whose folding is coupled with RNA binding, as these regions would be disordered in the free protein structure. This limitation, however, would be expected in all methods that depend on the protein structure in predicting RNA-binding residues. It may be alleviated using the PONDR (31,32) predictors to predict disordered segments in a protein from its sequence, but more RNA-free structures would be needed to test if this would indeed improve the prediction accuracy.
Analysis of proteins with no apparent correctly predicted RNA-binding residues
One or more RNA-binding residues were correctly predicted using the RNA-free protein structures in Table 2, except for two proteins; viz., tyrosyl-tRNA-synthetase (TyrRS, 1h3f-A) and prolyl-tRNA-synthetase (ProRS, 1hc7-A). These two proteins are aminoacyl-tRNA-synthetases, which play a crucial role in protein synthesis by catalyzing the covalent coupling of its specific tRNA and aa in two steps. In the first step, the enzyme catalyzes the formation of an aminoacyl-adenylate (aa-AMP) from its cognate aa and ATP with the release of inorganic pyrophosphate. In the second step, the aminoacyl moiety is transferred from the aa-AMP to the 3′-terminal adenosine of the tRNA. Interestingly, for these two enzymes, the predicted sites correspond to the active-site pocket containing the aa-AMP intermediate.
For TyrRS (1h3f) and ProRS (1hc7), a predicted patch/cleft includes residues involved in binding ATP and tyrosinol or prolinol based on the structures of the corresponding tRNA-bound enzyme complexes (Table 3). Notably, in both the TyrRS/tRNATyr (1h3e) (33) and ProRS/tRNAPro (1h4s) (34) complex structures, the tRNA 3′-end is disordered. However, the structure of the GluRS/tRNAGlu/glutamol–AMP complex (1n78) (35) shows the tRNA 3′-terminal CytCytAde in the active site, within hydrogen bonding distance or vdW contact of residues 9, 41, 43, 44, 47, 107, 112, 116, 145, 177, 180, 181, 185, 187 and 209. Indeed, residues 9, 41, 43, 44, 47, 180, 187 and 209 were predicted to bind RNA based on the free glutamyl-tRNA-synthetase structure (1j09). Hence, some of the RNA-binding residues predicted using the free TyrRS (1h3f-A) and ProRS (1hc7-A) structures might be involved in binding the tRNA 3′-end.
Table 3.
Predicted RNA-binding residues in aminoacyl–tRNA–synthetases
| PDB-chain | Binding site | Predicted RNA-binding residues |
|---|---|---|
| 1h3f-A | Patch | I168−Y175, A178, Q179 |
| Clefta | L42, G43–D45, P46−D50, H52, G54, H55, V58, G77, F79, Y108, Q111, R155−D157, H171, E172, Y175, A178, Q179, G194, D196, Q197, N200, P222, L223, V225, R230, E231, K232, S234, K235, S236, I237, Y240, T244 −P246 | |
| 1hc7-A | Patchb | S15, L19, Y30–T36, S88, E90, L91, E113, T114, R142, W143, E144, M145–R148, L151, R152, E155, F156, L157, W158, K199, K202–F205, A206, G207, Q225, A226, T228, H230, L232, N235, F236, S258, G260, S262, W263, R264, Q437, E438, T441, T443, A476, Y477 |
| Cleft | I37–V39, Y44, L70, F71, F87, P89, A92, V93, V108, N139, V141, W143, E155, L157 | |
| 1j09-A | Patch | L235, R237, N238, P239, D240, K241, T242, K243, I244, S245, K246, R247, K248, S249, H250 |
| Cleftc | A7, S9, P10, T11, G12, D13, H15, G17, T18, I21, E41, D42, T43, D44, R45, A46, R47, V49, K180, Y184, T186, Y187, A206, E208, W209, L235, K243, I244, S245, K246, R247, S249, H250, S252, W255 |
aResidues in bold underlined are involved in binding ATP or tyrosinol based on the corresponding structure of tyrosyl-tRNA synthetase complexed with its cognate tRNATyr, ATP and tyrosinol (1h3e-A).
bResidues in bold underlined are involved in binding ATP or prolinol based on the corresponding structure of prolyl-tRNA synthetase complexed with its cognate tRNAPro, ATP and prolinol (1h4q-A).
cResidues in bold underlined are involved in binding the tRNA 3′-terminal CytCytAde based on the structure of glutamyl-tRNA synthetase complexed with its cognate tRNAGlu and glutamol-AMP (1n78-A).
Comparison with other methods
As mentioned in the Introduction section, machine-learning approaches have also been used to predict RNA-binding sites (14–16). To compare the prediction accuracy of these methods with the present one, the methods to be compared have to be tested using the same set of proteins, the same definition of true RNA-binding residues, and the same accuracy criteria. Since the BindN server (14) is available, this method, which employs a support vector machine classifier, was compared with our method by using it to predict the RNA-binding residues in the 69 structurally non-homologous RNA-binding proteins. To reduce the number of false positive predictions, RNA-binding residues were predicted by setting the expected specificity to 80% in the BindN server. Since our method employs both sequence and structural information, whereas the BindN server uses sequence information only, it should yield more reliable predictions than BindN. Indeed, it predicts more true RNA-binding residues among the predicted ones than BindN: the ratio of true positives to predicted RNA-binding residues is 51% (1036/2026) using the present method, but 43% (1516/3496) using the BindN server (14).
SUPPLEMENTARY DATA
Supplementary data are available at NAR Online.
ACKNOWLEDGEMENTS
Funding for this work was provided by the National Science Council, Taiwan (NSC 95-2113-M-001-038-MY5). Funding to pay the Open Access publication charges for this article was provided by NSC 95-2113-M-001-038-MY5.
Conflict of interest statement. None declared.
REFERENCES
- 1.Tuschl T. Functional genomics: RNA sets the standard. Nature. 2003;421:268–272. doi: 10.1038/421220a. [DOI] [PubMed] [Google Scholar]
- 2.Draper DE. Protein-RNA recognition. Annu. Rev. Biochem. 1995;64:593–620. doi: 10.1146/annurev.bi.64.070195.003113. [DOI] [PubMed] [Google Scholar]
- 3.Berman HM, Westbrook J, Feng Z, Gilliland G, Bhat TN, Weissig H, Shindyalov IN, Bourne PE. The Protein data bank. Nucleic Acids Res. 2000;28:235–242. doi: 10.1093/nar/28.1.235. [DOI] [PMC free article] [PubMed] [Google Scholar]
- 4.Cusack S. RNA-protein complexes. Curr. Opin. Struct. Biol. 1999;9:66–73. doi: 10.1016/s0959-440x(99)80009-8. [DOI] [PubMed] [Google Scholar]
- 5.Draper DE. Themes in RNA-protein recognition. J. Mol. Biol. 1999;293:255–270. doi: 10.1006/jmbi.1999.2991. [DOI] [PubMed] [Google Scholar]
- 6.Jones S, Daley DT, Luscombe NM, Berman HM, Thornton JM. Protein-RNA interactions: a structural analysis. Nucleic Acids Res. 2001;29:943–954. doi: 10.1093/nar/29.4.943. [DOI] [PMC free article] [PubMed] [Google Scholar]
- 7.Treger M, Westhof E. Statistical analysis of atomic contacts at RNA-protein interfaces. J. Mol. Recognit. 2001;14:199–214. doi: 10.1002/jmr.534. [DOI] [PubMed] [Google Scholar]
- 8.Kim H, Jeong E, Lee SW, Han K. Computational analysis of hydrogen bonds in protein-RNA complexes for interaction patterns. FEBS Lett. 2003;552:231–239. doi: 10.1016/s0014-5793(03)00930-x. [DOI] [PubMed] [Google Scholar]
- 9.Morozova N, Allers J, Myers J, Shamoo Y. Protein-RNA interactions: exploring binding patterns with a three-dimensional superposition analysis of high resolution structures. Bioinformatics. 2006;22:2746–2752. doi: 10.1093/bioinformatics/btl470. [DOI] [PubMed] [Google Scholar]
- 10.Ellis JJ, Broom M, Jones S. Protein-RNA interactions: structural analysis and functional classes. Proteins. 2007;66:903–911. doi: 10.1002/prot.21211. [DOI] [PubMed] [Google Scholar]
- 11.Cai YD, Lin SL. Support vector machines for predicting rRNA-, RNA-, and DNA-binding proteins from amino acid sequence. Biochim. Biophys. Acta. 2003;1648:127–133. doi: 10.1016/s1570-9639(03)00112-2. [DOI] [PubMed] [Google Scholar]
- 12.Han LY, Cai CZ, Lo SL, Chung MC, Chen YZ. Prediction of RNA-binding proteins from primary sequence by a support vector machine approach. RNA. 2004;10:355–368. doi: 10.1261/rna.5890304. [DOI] [PMC free article] [PubMed] [Google Scholar]
- 13.Yu X, Cao J, Cai Y, Shi T, Li Y. Predicting rRNA-, RNA-, and DNA-binding proteins from primary structure with support vector machines. J. Theor. Biol. 2006;240:175–184. doi: 10.1016/j.jtbi.2005.09.018. [DOI] [PubMed] [Google Scholar]
- 14.Wang L, Brown SJ. BindN: a web-based tool for efficient prediction of DNA and RNA binding sites in amino acid sequences. Nucleic Acids Res. 2006;34:W243–W248. doi: 10.1093/nar/gkl298. [DOI] [PMC free article] [PubMed] [Google Scholar]
- 15.Jeong E, Chung I, Miyano S. A neural network method for identification of RNA-interacting residues in protein. Genome Inform. Ser. Workshop Genome Inform. 2004;15:105–116. [PubMed] [Google Scholar]
- 16.Terribilini M, Lee JH, Yan C, Jernigan RL, Honavar V, Dobbs D. Prediction of RNA binding sites in proteins from amino acid sequence. RNA. 2006;12:1450–1462. doi: 10.1261/rna.2197306. [DOI] [PMC free article] [PubMed] [Google Scholar]
- 17.Kim OTP, Yura K, Go N. Amino acid residue doublet propensity in the protein-RNA interface and its application to RNA interface prediction. Nucleic Acids Res. 2006;34:6450–6460. doi: 10.1093/nar/gkl819. [DOI] [PMC free article] [PubMed] [Google Scholar]
- 18.Chen YC, Wu CY, Lim C. Predicting DNA-binding sites on proteins from electrostatic stabilization upon mutation to Asp/Glu and evolutionary conservation. Prot. Struct. Funct. Bioinform. 2007;67:671–680. doi: 10.1002/prot.21366. [DOI] [PubMed] [Google Scholar]
- 19.Landau M, Mayrose I, Rosenberg Y, Glaser F, Martz E, Pupko T, Ben-Tal N. ConSurf 2005: the projection of evolutionary conservation scores of residues on protein structures. Nucleic Acids Res. 2005;33:299–302. doi: 10.1093/nar/gki370. [DOI] [PMC free article] [PubMed] [Google Scholar]
- 20.Wu CY, Chen YC, Lim C. In preparation. 2008. Specific RNA-binding structural motifs using a structural alphabet. [Google Scholar]
- 21.Pearl F, Todd A, Sillitoe I, Dibley M, Redfern O, Lewis T, Bennett C, Marsden R, Grant A, Lee D, et al. The CATH domain structure database and related resources Gene3D and DHS provide comprehensive domain family information for genome analysis. Nucleic Acids Res. 2005;33:D247–D251. doi: 10.1093/nar/gki024. [DOI] [PMC free article] [PubMed] [Google Scholar]
- 22.McDonald IK, Thornton JM. Satisfying hydrogen bonding potential in proteins. J. Mol. Biol. 1994;238:777–793. doi: 10.1006/jmbi.1994.1334. [DOI] [PubMed] [Google Scholar]
- 23.Jones S, Shanahan HP, Berman HM, Thornton JM. Using electrostatic potentials to predict DNA-binding sites on DNA-binding proteins. Nucleic Acids Res. 2003;31:7189–7198. doi: 10.1093/nar/gkg922. [DOI] [PMC free article] [PubMed] [Google Scholar]
- 24.Koradi R, Billeter M, Wuthrich K. MOLMOL: a program for display and analysis of macromolecular structures. J. Mol. Graph. 1996;14:51–55. doi: 10.1016/0263-7855(96)00009-4. [DOI] [PubMed] [Google Scholar]
- 25.Canutescu AA, Shelenkov AA, Dunbrack RLJ. A graph-theory algorithm for rapid protein side-chain prediction. Protein Sci. 2003;12:2001–2014. doi: 10.1110/ps.03154503. [DOI] [PMC free article] [PubMed] [Google Scholar]
- 26.Case DA, Darden T, Cheatham Iii TE, Simmerling C, Wang J, Duke RE, Luo R, Merz KM, Pearlman DA, Crowley M. AMBER 9. San Francisco: University of California; 2006. [Google Scholar]
- 27.Duan Y, Wu C, Chowdhury S, Lee MC, Xiong G, Zhang W, Yang R, Cieplak P, Luo R, Lee T, et al. A point-charge force field for molecular mechanics simulations of proteins based on condensed-phase quantum mechanical calculations. J. Comput. Chem. 2003;24:1999–2012. doi: 10.1002/jcc.10349. [DOI] [PubMed] [Google Scholar]
- 28.Glaser F, Pupko T, Paz I, Bell RE, Bechor D, Martz E, Ben-Tal N. ConSurf: Identification of functional regions in proteins by surface-mapping of phylogenetic information. Bioinformatics. 2003;19:163–164. doi: 10.1093/bioinformatics/19.1.163. [DOI] [PubMed] [Google Scholar]
- 29.Laskowski RA. SURFNET: a program for visualizing molecular surfaces, cavities, and intermolecular interactions. J. Mol. Graph. 1995;13:323–330. doi: 10.1016/0263-7855(95)00073-9. [DOI] [PubMed] [Google Scholar]
- 30.Jones S, Thornton J. Prediction of protein-protein interaction sites using patch analysis. J. Mol. Biol. 1997;272:133–143. doi: 10.1006/jmbi.1997.1233. [DOI] [PubMed] [Google Scholar]
- 31.Li X, Romero P, Rani M, Dunker AK, Obradovic Z. Predicting protein disorder for N-, C-, and internal regions. Genome Inform. 1999;10:30–40. [PubMed] [Google Scholar]
- 32.Romero P, Obradovic Z, Li X, Garner E, Brown C, Dunker AK. Sequence complexity of disordered protein. Proteins. 2001;42:38–48. doi: 10.1002/1097-0134(20010101)42:1<38::aid-prot50>3.0.co;2-3. [DOI] [PubMed] [Google Scholar]
- 33.Yaremchuk A, Kriklivyi I, Tukalo M, Cusack S. Class I tyrosyl-tRNA synthetase has a class II mode of cognate tRNA recognition. EMBO J. 2002;21:3829–3840. doi: 10.1093/emboj/cdf373. [DOI] [PMC free article] [PubMed] [Google Scholar]
- 34.Yaremchuk A, Tukalo M, Grotli M, Cusack S. A succession of substrate induced conformational changes ensures the amino acid specificity of Thermus thermophilus prolyl-tRNA synthetase: comparison with histidyl-tRNA synthetase. J. Mol. Biol. 2001;309:989–1002. doi: 10.1006/jmbi.2001.4712. [DOI] [PubMed] [Google Scholar]
- 35.Sekine S, Nureki O, Dubois DY, Bernier S, Chenevert R, Lapointe J, Vassylyev DG, Yokoyama S. ATP binding by glutamyl-tRNA synthetase is switched to the productive mode by tRNA binding. EMBO J. 2003;22:676–688. doi: 10.1093/emboj/cdg053. [DOI] [PMC free article] [PubMed] [Google Scholar]
Associated Data
This section collects any data citations, data availability statements, or supplementary materials included in this article.