Abstract
We asked whether down-regulation of GH signaling could block carcinogenesis in the Probasin/TAg rat, a model of aggressive prostate cancer. The Spontaneous Dwarf rat, which lacks GH due to a mutation (dr) in its GH gene, was crossed with the Probasin/TAg rat, which develops prostate carcinomas at 100% incidence by 15 wk of age. Progeny were heterozygous for the TAg oncogene and homozygous for either the wild-type GH gene (TAg/Gh+/+) or the dr mutation (TAg/Ghdr/dr). Prostate tumor incidence and burden were significantly reduced, and tumor latency was delayed in TAg/Ghdr/dr rats relative to TAg/Gh+/+ controls. At 25 wk of age, loss of GH resulted in a 20 and 80% decrease in the area of microinvasive carcinoma in the dorsal and lateral lobes, respectively. By 52 wk of age, invasive prostate adenocarcinomas were observed in all TAg/Gh+/+ rats, whereas the majority of TAg/Ghdr/dr did not develop invasive tumors. Suppression of carcinogenesis could not be attributed to alterations in prostate expression of TAg or androgen receptor or changes in serum testosterone levels. As carcinogenesis progressed in TAg/Gh+/+ rats, prostate GHR mRNA and protein expression increased significantly, but prostate IGF-I receptor mRNA and protein levels dropped. Furthermore, serum IGF-I and prostate IGF-I levels did not change significantly over the course of carcinogenesis. These findings suggest that GH plays a dominant role in progression from latent to malignant prostate cancer driven by the powerful probasin/TAg fusion gene in rats and suggest that GH antagonists may be effective at treating human prostate cancer.
PROSTATE CANCER is a significant cause of morbidity and mortality in American men (1). Although it is known that androgens play a central role in prostate cancer development and progression, other hormones and growth factors are also involved in prostate growth and may play a role in the development of prostate cancer. Recent clinical and epidemiological studies suggest that the GH/IGF axis is important for normal human prostate growth. For example, chronic GH deficiency in adulthood is associated with reduced prostate volume (2), whereas the prevalence of prostate hyperplasia has been reported to be lower in GH-deficient patients than in controls (3). Also, acromegalics are known to have enlarged prostates that decrease significantly in size in response to somatostatin analogs or after surgical removal of a pituitary tumor to lower GH levels (4).
GH signaling has proven to be important in regulating proliferation of cancer cells in laboratory-based studies. Human prostate cancer cell lines such as LNCaP and PC3 express GH receptors (GHRs) at levels greater than observed in normal tissue (5). Pollak and colleagues (6) have reported that the growth of androgen-independent PC3 cells is slowed in GH-deficient Little mice (Ghrhrlit/lit) on a SCID background relative to control SCID mice. These studies support the notion that GH signaling is important for the growth of advanced human prostate cancers.
IGF-I is an important mediator of many of the biological activities of GH (7). Several epidemiological studies have focused on the role of the GH/IGF axis in prostate carcinogenesis (8). In three prospective studies, a positive association was found between serum IGF-I and prostate cancer risk (9,10,11); however, in another study, an inverse relationship was observed (12). Case-control studies also are divided with some studies suggesting that elevated serum IGF-I is associated with increased prostate cancer risk (13,14,15,16,17,18,19), whereas others find little or no association (20,21,22,23,24). Metaanalyses of the literature conducted to date agree that there is a positive association between serum IGF-I level and prostate cancer risk (25,26). With regard to GH, a recent case-control study suggests that elevated basal GH serum titers lowered prostate cancer risk (27). Therefore, although epidemiological studies suggest that the GH/IGF axis may influence carcinogenesis in the prostate, more work is needed to clarify this issue. Animal models in which hormone signaling can be better controlled may be helpful in determining the role of the GH/IGF axis in prostate carcinogenesis.
We previously demonstrated that the GH pathway supports the progression of TAg-mediated prostate cancers from initiated cells to prostatic intraepithelial neoplasia (PIN) using the GHR knockout mouse model (28). In the present study, we expand on these findings by evaluating the effect of GH signaling on prostate carcinogenesis in the rat with a different mechanism of GH signaling disruption (loss of functional GH). Furthermore, we assessed whether the lack of GH can prevent the progression of PIN to fully malignant prostate cancer, which is a transition of great significance to human prostate disease. Our approach was to cross the Spontaneous Dwarf rat (SDR), which lacks any detectable GH due to a mutation in its GH gene (gene symbol dr; Ghdr/dr) and has only 10% of the plasma IGF-I found in wild-type rats, with the Probasin/TAg rat, which develops prostate cancers induced by a transgene consisting of the rat probasin promoter driving expression of the simian virus 40 large T antigen (TAg) (29). Probasin/TAg rats develop PIN by 4 wk of age and prostate carcinomas at 100% incidence by 15 wk of age (29). The lesions found in the Probasin/TAg rat model resemble the human disease in their hormonal responsiveness and histopathology, which makes it an ideal model for studies on the prevention of prostate cancer progression. To dissect out the separate contributions of reduced GH and IGF-I to the progression of prostate cancer, we assessed the expression of prostatic GHR, IGF-I, and IGF-I receptor (IGF-IR) at the mRNA and protein level during development of this malignancy in this novel rat model. Our results suggest that GH signaling plays a significant role in prostate cancer progression.
Materials and Methods
Animals
The Probasin/TAg transgenic rat was developed by Shirai and colleagues (29) on a Sprague Dawley background. The transgene includes the early region of SV40 containing TAg targeted to the prostate by the rat probasin gene promoter. The SDR arose in a colony of Sprague-Dawley rats at Morishita Pharmaceutical Co, Shiga, Japan, in 1977 (30). The phenotype is due to a nonsense point mutation designated dr that results in an unstable mRNA transcript roughly half the size of the normal Gh mRNA transcript (31). Pituitary Gh mRNA is only 3–6% of control, and GH protein is undetectable in serum of the SDR (32), which displays postnatal growth retardation and proportionate dwarfism (33). Also, serum IGF-I titers are only about 10% of control Sprague Dawley rats (34).
For the current studies, Probasin/TAg rats were crossed with SDRs of the same Sprague Dawley background. Genotyping was conducted by PCR as previously described (29,35). Offspring of this initial cross were used to generate rats for the current studies that carried one copy of the probasin/TAg transgene in the presence (TAg/Gh+/+) or absence (TAg/Ghdr/dr) of the wild-type GH gene. Male rats were killed by rapid decapitation (without anesthesia) at 5, 10, 25, or 52 wk of age. These time points were chosen to represent progressive stages of prostate cancer development from PIN to invasive tumors in TAg/Gh+/+rats. Trunk blood was obtained, and serum samples were stored at −80 C. The entire genitourinary tract (prostate lobes, seminal vesicles, ampullary glands, proximal ductus deferens, bladder, and proximal urethra) was excised en bloc. The lobes of prostates were dissected with the aid of a dissecting microscope. Half of the lateral prostate (LP) tissues were frozen in liquid nitrogen and stored at −80 C for RNA extraction, whereas the contralateral LP from each animal was fixed in 10% neutral buffered formalin and embedded for standard paraffin sections.
Histopathology
Four-micrometer serial sections were placed on SuperFrost/Plus slides (Fisher Scientific Co., Pittsburgh, PA) and stained with hematoxylin and eosin, which typically afforded adequate visualization of the all lobes. The slides were independently read by two pathologists experienced in rodent prostate pathology and who were blinded to the genotype of the specimens. The dorsal prostate (DP), LP, and ventral prostate (VP) were separately analyzed for absence or presence of hyperplasia with nuclear atypia characterized as murine PIN (mPIN), microinvasive adenocarcinomas, and invasive carcinomas using criteria similar to those established for mouse prostate lesions by the Mouse Models of Human Cancer Consortium Prostate Cancer Committee (36). Low-grade and high-grade mPIN were distinguished on the basis of standard criteria used in human pathology (37). Well differentiated carcinomas were composed exclusively or predominantly of discreet, well formed glands. In moderately differentiated carcinomas, gland formation was clearly evident, but focal to extensive areas were composed of fused glands or more solid areas. Poorly differentiated tumors were characterized by being composed predominantly or exclusively of more solid sheets or nests of cancer cells; no attempt was made to distinguish poorly differentiated adenocarcinomas from poorly differentiated carcinomas with neuroendocrine differentiation. Finally, the area of carcinoma within each specimen was measured using image analysis software (MetaVue; Universal Imaging, Downingtown, PA).
Immunohistochemistry (IHC)
Expression of androgen receptor (AR), TAg, p63, Cytokeratin 18 (CK18), probasin, prostate binding protein (PBP), GHR, IGF-I, and IGF-IR were evaluated by IHC following protocols recommended by the respective antibody vendors. Paraffin sections were heat-immobilized (60 C, 1 h), deparaffinized in three changes of xylene, hydrated in a series of graded ethanol, and rinsed in several changes of distilled water. Heat-induced antigen retrieval was performed either in a microwave oven (TAg and IGF-IR) or in a pressure cooker (p63, CK18, probasin, PBP, AR, and IGF-I; Decloaking Chamber; Biocare Medical, Concord, CA). No heat-induced antigen retrieval was needed for GHR. Endogenous peroxidase was quenched using H2O2 (3%, 10 min). After blocking with the appropriate serum, the prostate sections were treated with mouse anti-TAg (1:50, PAb101; BD PharMingen, San Diego, CA), rabbit anti-p63 (1:500, H137; Santa Cruz Biotechnology, Santa Cruz, CA), sheep anti-CK18 (1:200, PH504; Binding Site, Birmingham, UK), rabbit anti-probasin (1:2500), rabbit anti-PBP (1:500), rabbit anti-AR (2 μg/ml, PG21), mouse anti-GHR (1:80; Abcam Inc., Cambridge, MA), rabbit anti-IGF-I (prediluted; Abcam), rabbit anti-IGF-IRβ (1:50; Cell Signaling Technology Inc., Danvers, MA), and sequentially with secondary antibodies and Vectastain Elite ABC kit (Vector Laboratories, Burlingame, CA) for rabbit and sheep primary antibody or Dako LSAB2 System horseradish peroxidase (Dako, Carpinteria, CA) for mouse primary antibodies. Sections were rinsed in PBS and incubated with 3,3′-diaminobenzidine (Sigma Chemical Co., St. Louis, MO). Slides were counterstained in hematoxylin, dehydrated in graded ethanol, cleared in xylene, and mounted using Permount mounting medium.
Serum testosterone and IGF-I
Serum testosterone levels were measured by RIA using Coat-A-Count Total Testosterone (Diagnostic Products Corp., Los Angeles, CA). Serum IGF-I levels were assessed using the Nichols Institute Diagnostics human IGF-I RIA Kit (San Juan Capistrano, CA) after acid/ethanol extraction according to the manufacturer’s instructions.
RNA isolation and RT
Total RNA was isolated from snap-frozen LP of Gh+/+, Ghdr/dr, TAg/Gh+/+, and TAg/Ghdr/dr rats using the QIAGEN RNeasy Mini Kit (QIAGEN, Valencia, CA) with deoxyribonuclease treatment, according to the manufacturer’s instructions. The amount of RNA recovered was determined using the Ribogreen RNA quantification kit (Molecular Probes, Eugene, OR). Purity of the RNA samples was determined by UV spectroscopy. Total RNA (1 μg) was reversed transcribed using random hexamer primers and reagents supplied in the cDNA First Strand Synthesis kit (MRI Fermentas, Hanover, MD). The cDNA obtained was treated with ribonuclease H (1U; MRI Fermentas), and duplicate aliquots (1 μl) were amplified by quantitative real-time RT-PCR, where samples are run against synthetic standards to estimate mRNA copy number (see below). The amount of total RNA added to each RT reaction mix and its quality were confirmed by electrophoresis through 1.5% agarose gels stained with ethidium bromide.
Primer selection and quantitative RT-PCR
Primers were designed using Primer 3 software (http://frodo.wi.mit.edu/cgi-bin/primer3/primer3_www.cgi; Steve Rozen, Whitehead Institute for Biomedical Research, Cambridge, MA) with selection parameters set as previously published (38,39). The specific primers used for quantitative RT-PCR were as follows: GHR sense 5′-ACT GGC AGC ATG TGA AGA AGA-3′ and antisense 5′-GGA ACT GGT ACT GGG GGT AAA-3′, IGF-I sense 5′-TTG TGG ATG AGT GTT GCT TCC-3′ and antisense 5′-GGT CTT GTT TCC TGC ACT TCC-3′, and IGF-IR sense 5′-CGC CTC CAA CTT TGT CTT TG-3′ and antisense 5′-TCG ACT TGC GAT CCG TAT TT-3′. Quantitative RT-PCR were performed on an Mx3000P QPCR System (Stratagene, La Jolla, CA). Details regarding the development, validation, and application of a quantitative RT-PCR to measure expression levels of different transcripts have been published (38,39). Thermal cycling profile consisted of a preincubation step at 95 C for 10 min, followed by 40 cycles of denaturation (95 C, 30 sec), annealing (61 C, 1 min), and extension (72 C, 30 sec). The efficiency of amplification for all standard curves was 97–103%, meaning all templates in each cycle were copied. To estimate the starting copy number of cDNA, RT samples were PCR amplified and the signal compared with that of standard curve run on the same plate. In addition, total RNA samples that were not reverse transcribed and a control lacking cDNA were routinely run in each plate to control for genomic DNA contamination and to monitor potential exogenous contamination, respectively.
Statistical analysis
All the data are presented as means ± sem. The significance of intergroup differences in tumor incidence, tumor burden, serum hormone levels, and gene expression levels were analyzed using two-tailed Student’s t test or one-way ANOVA (three groups or more), unless otherwise indicated.
Results
Characteristics of TAg/Ghdr/dr rat
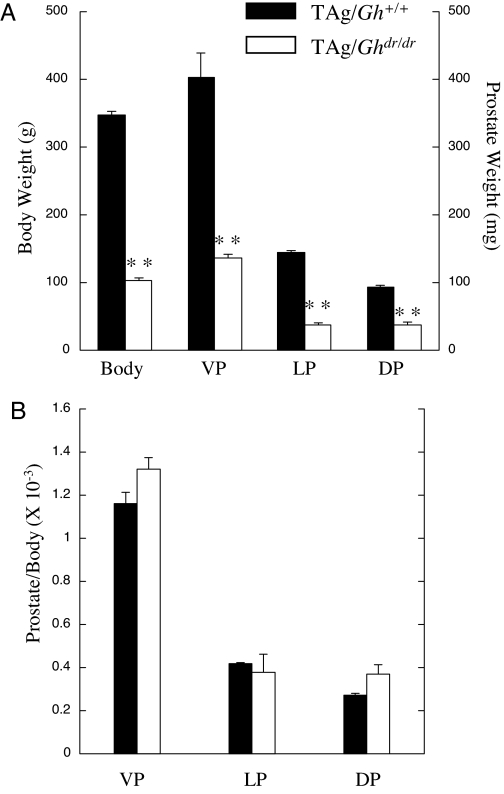
As expected, postnatal growth of the TAg/Ghdr/dr rats was significantly reduced compared with TAg/Gh+/+ rats (Fig. 1A). Although there was no significant difference in body weight between TAg/Gh+/+ and TAg/Ghdr/dr rats at birth, body weight was significantly reduced at 10 wk of age in TAg/Ghdr/dr rats (100 ± 5 g) compared with age-matched TAg/Gh+/+ littermates (355 ± 19 g, P < 0.0001). The weights of the major organs of the TAg/Ghdr/dr rats were also decreased compared with those of the TAg/Gh+/+ rats (data not shown). Except for their small size, the organs exhibited no gross anatomic abnormalities.
Figure 1.
Comparison of body and prostate weights and prostate differentiation marker expression between TAg/Gh+/+ and TAg/Ghdr/dr rats at 10 wk of age. A, Body and lobe weights of TAg/Ghdr/dr rats were distinguished from controls (n = 10 per group); B, prostate lobe/body weight ratios for comparison between TAg/Gh+/+ and TAg/Ghdr/dr are shown. Although the TAg/Ghdr/dr rats were less than half the weight of wild-type littermates, the prostate weight to body weight ratios were not significantly different between the two genotypes (P > 0.05, Student’s t test). **, Significantly different from TAg/Gh+/+ control (P < 0.01).
Gross prostate morphology in TAg/Ghdr/dr rat
The seminal vesicles, coagulating gland, VP, LP, and DP were all present and of normal appearance but reduced in size in TAg/Ghdr/dr rats compared with TAg/Gh+/+ rats. The average VP, LP, and DP weights at 10 wk of age were significantly lower in TAg/Ghdr/dr than in TAg/Gh+/+ (P < 0.0001; Fig. 1A). However, no significant differences in the prostate lobe to body weight ratios were observed between TAg/Ghdr/dr and TAg/Gh+/+ rats (Fig. 1B), indicating that the reduction in prostate weight is proportionate to the reduction in body weight, consistent with an effect of reduced GH action.
Loss of GH did not affect prostate development or differentiation
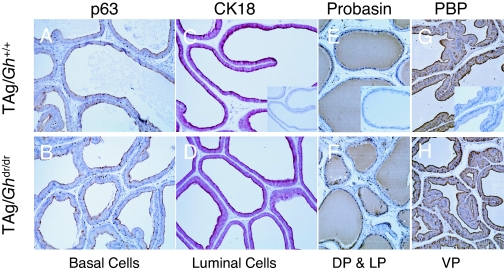
To examine the effect of GH signaling on prostate development and differentiation in the TAg/Ghdr/dr rat, several biomarkers were evaluated by IHC at 10 wk of age. Markers of prostatic epithelial cell differentiation included p63 for basal cells and CK18 for the luminal cell subpopulation. Functional differentiation was assessed by immunostaining for probasin and PBP, the major prostatic secretory proteins in DP and VP, respectively (40). In TAg/Gh+/+ prostates, basal cells were intermittently localized by p63 staining along the basement membrane in the proximal and distal regions of the DP, LP, and VP (Fig. 2A). This pattern was not affected by the loss of GH in the TAg/Ghdr/dr prostates (Fig. 2B). The majority of the prostatic epithelium in both TAg/Gh+/+ and TAg/Ghdr/dr rats stained positive for CK18, indicating the presence of differentiated luminal cells (Fig 2, C and D). Furthermore, in both genotypes, probasin and PBP strongly stained in the prostatic epithelium (Fig. 2, E–H). Thus, loss of GH did not appear to affect epithelial cell cytodifferentiation or functional differentiation in TAg/Ghdr/dr.
Figure 2.
Loss of GH did not affect prostate development or differentiation. Prostate tissue sections from TAg/Gh+/+ (C, D, E, and F) or TAg/Ghdr/dr (G, H, I, and J) were stained for p63 (C and G, basal cell specific), CK18 (D and H, luminal cells), probasin (E and I, major prostatic secretory proteins in DL and LP) or PBP (D and H, major prostatic secretory proteins in VP). Insets represent negative controls for immunostaining. Original magnification, ×400 (C and G) or ×200 (D–F and H–J).
Prostate carcinogenesis was retarded by disruption of GH signaling in the TAg/Ghdr/dr rat
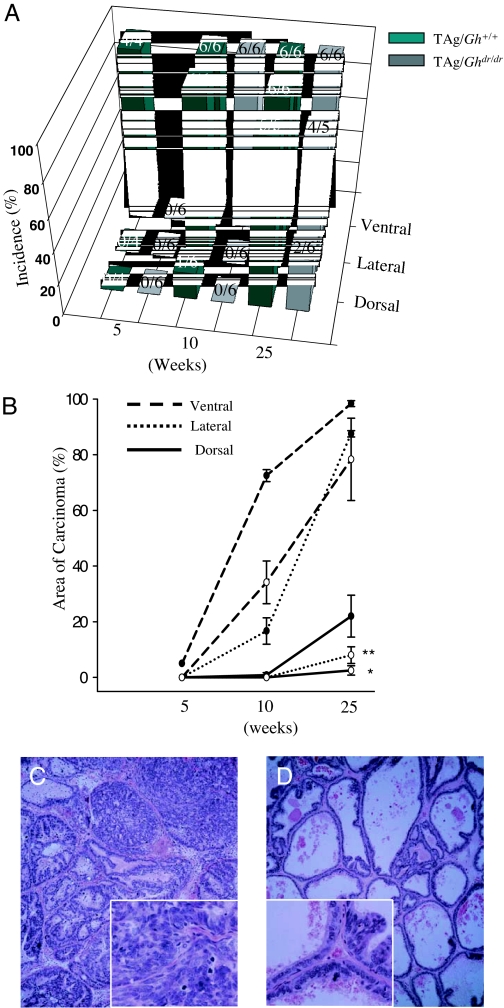
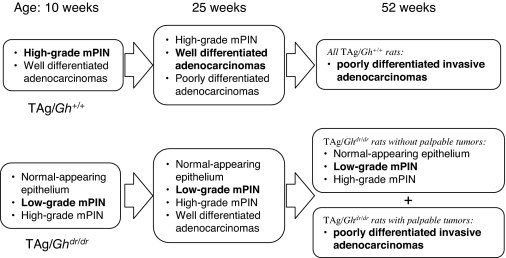
The incidence and latency of microinvasive carcinomas in VP, LP, and DP are presented in Fig. 3A. All of the TAg/Gh+/+ rats developed carcinoma in the VP by 5 wk of age, in the LP by 10 wk of age, and the DP by 25 wk of age. This lobe-specific penetrance was also observed in TAg/Ghdr/dr rats. However, the absence of GH in the TAg/Ghdr/dr increased latency in all three lobes and decreased incidence in the dorsal and lateral lobes. Furthermore, the tumor burden, when expressed as percentage of lobe occupied by tumor, was significantly reduced in TAg/Ghdr/dr relative to TAg/Gh+/+ controls. As shown in Fig. 3B, at 25 wk of age, loss of GH resulted in an 80 and 20% decrease (P < 0.0001 and P < 0.05) in the area of carcinoma in the LP (Fig. 3, C and D) and DP, respectively. The area of carcinoma in the VP also tended to be decreased, but this difference did not achieve significance. The effect of the lack of GH was most prominent in the LP, where normal epithelium persisted longest, mPIN progressed more slowly, and microinvasive cancers were fewer and less extensive in TAg/Ghdr/dr rats than in TAg/Gh+/+ rats (Table 1 and Fig. 4). By 52 wk of age, large invasive, poorly differentiated, or undifferentiated prostate adenocarcinomas were observed in all 13 TAg/Gh+/+rats. In contrast, nine of 15 (60%) TAg/Ghdr/dr rats did not develop large palpable invasive tumors despite the high incidence and multiplicity of microinvasive carcinomas in their VP. Figure 4 provides a qualitative summary of the delayed progression of prostate carcinogenesis in the TAg/Ghdr/dr rats compared with the TAg/Gh+/+ rats. The most significant observation in TAg/Ghdr/dr rats is the decreased incidence of low-grade mPIN developing into high-grade mPIN and the lack of development of adenocarcinoma even at 1 yr of age. Although loss of GH retarded the onset and progression of cancer in all prostate lobes, the delay was greatest in the LP. Thus, the LP was used in the present study as the tissue model for characterizing GH and IGF-I action in the TAg/Gh+/+ and TAg/Ghdr/dr rats.
Figure 3.
Prostate carcinogenesis was retarded by disruption of GH signaling in the TAg/Ghdr/dr rat. A, Incidences of microinvasive carcinomas in the two genotypes are shown with the number of rats examined (for example, 2/6 means two of six animals harbored prostatic carcinomas); B, percent area of microinvasive prostatic carcinomas measured using MetaVue image analysis software and expressed as a percentage of total prostate tissue area (•, TAg/Gh+/+; ○, TAg/Ghdr/dr); C and D, representative hematoxylin- and eosin-stained sections of the LP in both genotypes from 25-wk-old rats. The insets in C and D are four times the magnification of the overall image and highlight areas within the larger panels. C illustrates high-grade mPIN and microinvasive carcinomas in TAg/Gh+/+ rats at 25 wk. High-grade mPIN was composed of a markedly increased epithelial cell density with cribriform, micropapillary, or tufting growth patterns, and pronounced cellular atypia. Nuclear chromatin was increased in density, and clumping was common, whereas the basement membrane appeared to be intact. Adenocarcinomas showed microinvasion into the surrounding stroma. Cellular pleomorphism such as nuclear irregularity was much more pronounced in carcinomas than in high-grade mPIN. Prominent nucleoli and apoptotic bodies were often observed. D illustrates normal epithelium and one focus of low-grade mPIN in a TAg/Ghdr/dr rat, which was the predominant phenotype in this animal. *, Significantly different from TAg/Gh+/+ control, P < 0.05; **, P < 0.01.
Table 1.
Area (mean percent ± sem) of mPIN and microinvasive carcinomas in the LP by age
| 5 wk
|
10 wk
|
25 wk
|
52 wka
|
|||||
|---|---|---|---|---|---|---|---|---|
| TAg/Gh+/+ | TAg/Ghdr/dr | TAg/Gh+/+ | TAg/Ghdr/dr | TAg/Gh+/+ | TAg/Ghdr/dr | TAg/Gh+/+ | TAg/Ghdr/dr | |
| Normal-appearing epithelium | 0 | 10 ± 2 | 0 | 10 ± 7 | 0 | 17 ± 7 | 0 | 35 ± 9 |
| Low-grade PIN | 35 ± 5 | 80 ± 7 | 15 ± 4 | 67 ± 7 | 1 ± 1 | 40 ± 8 | 0 | 50 ± 9 |
| High-grade PIN | 65 ± 5 | 10 ± 5 | 70 ± 4 | 23 ± 7 | 11 ± 1 | 35 ± 9 | 0 | 15 ± 5 |
| Microinvasive carcinoma | 0 | 0 | 15 ± 5 | 0 | 88 ± 1 | 8 ± 3 | 0 | 0 |
Rats bearing invasive prostate tumors were not included.
Figure 4.
Summary of prostate histopathology at specific time points during carcinogenesis in TAg/Gh+/+ and TAg/Ghdr/dr rats. Predominant histopathological phenotype is written in bold for each group.
Prostate expression of TAg, GH signaling endpoints, and AR as well as circulating testosterone was not affected by loss of GH in TAg/Ghdr/dr rat
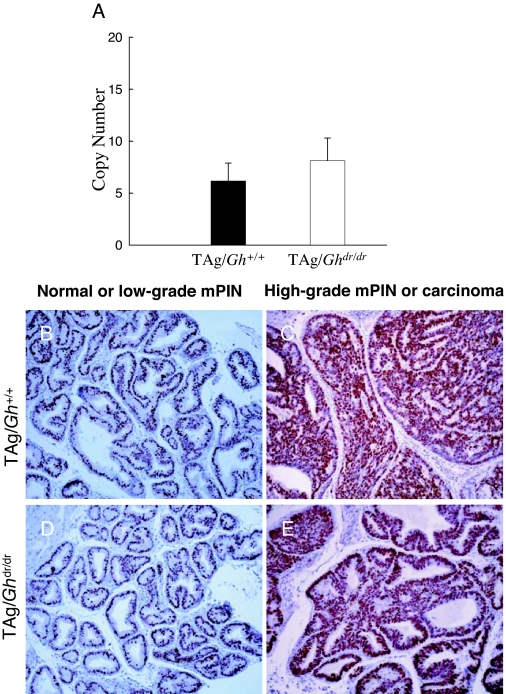
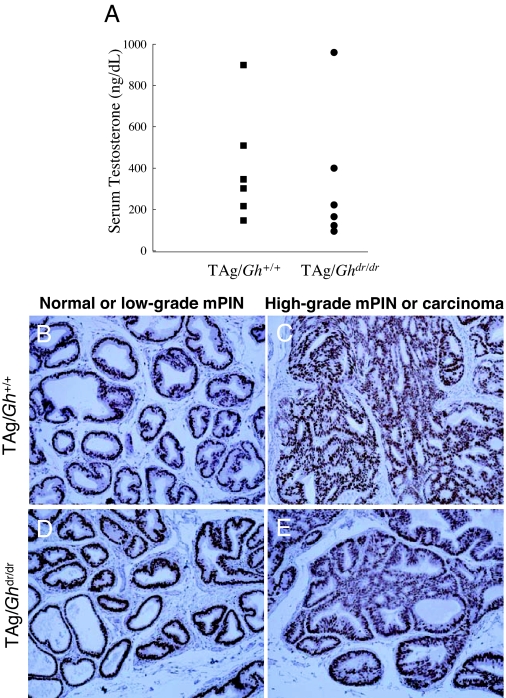
The level of TAg expression in the LP was measured by quantitative RT-PCR. There was no difference between TAg/Gh+/+ and TAg/Ghdr/dr in TAg mRNA abundance (6.2 ± 1.7 vs. 8.1 ± 2.2 copy number, P = 0.70; Fig. 5A), consistent with the presence of identical numbers of immunoreactive epithelial cells in these animals (Fig. 5, B–E). Also, the absence of GH was not associated with reduced LP expression of GHR, IGF-IR, or IGF-I at 10, 25, and 52 wk of age (Table 2, TAg/Gh+/+ vs. TAg/Ghdr/dr within age tested). Serum testosterone levels were analyzed in groups of adult (12 wk) male TAg/Gh+/+ and TAg/Ghdr/dr. Testosterone levels were not affected by GH status between TAg/Gh+/+ and TAg/Ghdr/dr rats (403 ± 111 vs. 326 ± 134 ng/dl, respectively, P = 7.0; Fig. 6A). Furthermore, IHC analysis of AR demonstrated that there was no difference in AR protein expression between TAg/Ghdr/dr and TAg/Gh+/+ rats in normal or cancerous prostate epithelial cells (Fig. 6, B–E). These results are consistent with our previous report that disruption of the GHR in the mouse did not affect prostatic TAg expression, serum testosterone, or prostatic AR expression (28) and, together, indicate that the reduction in prostate tumor growth in TAg/Ghdr/dr rats cannot be accounted for by a reduction in oncogene (TAg) expression, lack of testosterone stimulation, or loss of the AR.
Figure 5.
Inhibition of prostate carcinogenesis in the TAg/Ghdr/dr rat is not due to a lack of prostatic TAg expression. A, Quantitative RT-PCR and immunohistochemical analysis of TAg expression in the TAg/Gh+/+ vs. the TAg/Ghdr/dr rat prostate at 5 wk of age. B–E, Nuclear expression of TAg protein in TAg/Gh+/+ (B and C) and TAg/Ghdr/dr (D and E) rats. Prostates were excised and fixed in formalin and embedded in paraffin before sectioning. No significant difference in TAg expression was observed in either normal-appearing/low-grade PIN (B and D) or high-grade PIN/carcinomas (C and E) in both genotypes.
Table 2.
Summary of mRNA and protein expression of GHR, IGF-IR, and IGF-I in the rat LP
| Target | Genotype
|
|||
|---|---|---|---|---|
| Gh+/+ | TAg/Gh+/+ | Ghdr/drb | TAg/Ghdr/dr | |
| GHR | ||||
| 10 wk | +++ | ++ | +++ | +++ |
| 785 ± 89a | 755 ± 126a | 1,104 ± 194a | 848 ± 109a | |
| 25 wk | ++ | +++ | ++ | ++ |
| 422 ± 84a | 1,729 ± 256a,a | 547 ± 155a | 628 ± 37a | |
| 52 wk | – | +++(+) | – | – |
| 278 ± 9a | 3,171 ± 554a | 521 ± 71a,b | 271 ± 41a | |
| Tumor | ++ | |||
| 788 ± 34a,a | ||||
| IGF-IR | ||||
| 10 wk | ++ | + | + | ± |
| 17,307 ± 3,799a | 17,340 ± 1,483a | 18,840 ± 4,624 | 15,955 ± 1,048a | |
| 25 wk | + | + | + | +++ |
| 12,169 ± 3,120a,a | 5,192 ± 1,020a | 10,996 ± 1,557 | 18,784 ± 1,067a | |
| 52 wk | + | ± | ++ | ++ |
| 4,565 ± 483a | 992 ± 371a | 11,891 ± 950b | 9,547 ± 1,643a | |
| Tumor | – | |||
| 2,723 ± 96a | ||||
| IGF-I | ||||
| 10 wk | ++ | ++ | +++ | +++ |
| 11,523 ± 770a,a | 6,299 ± 699a | 17,183 ± 3,556 | 12,301 ± 2,168 | |
| 25 wk | ++ | ++ | +++ | +++ |
| 10,208 ± 884a | 8,938 ± 1214a | 12,175 ± 1,873 | 9,377 ± 699 | |
| 52 wk | +++ | ++ | +++ | ++ |
| 14,177 ± 544a | 10,809 ± 1,772a,b | 12,823 ± 993 | 9,854 ± 609 | |
| Tumor | ++ | |||
| 9,283 ± 1,325 | ||||
Plus and minus signs indicate relative protein expression as judged by IHC as follows: +++, marked expression/high level; ++, moderate expression/intermediate level; +, low expression/low level; ±, minimal expression/very low level; –, no detectable expression. Numbers represent copy numbers of mRN as determined by quantitative RT-PCR. Data within each genotype and target group were analyzed by one-way ANOVA with Newman-Keuls multiple comparison test.
Values that do not share a common letter superscript differ significantly (P ≤ 0.05). Values that share a common superscript letter or that have no superscript are not significantly different (P > 0.05).
Significant difference from non-TAg Gh+/+ of same age and target.
Figure 6.
Serum testosterone and prostatic androgen receptor levels were unaltered by disruption of GH signaling. A, Serum testosterone levels in TAg/Gh+/+ and TAg/Ghdr/dr rats were not affected by GH expression status. Serum testosterone was measured by RIA in adult (12 wk) male rats (n = 6 per group). B–E, Disruption of the GH gene did not affect prostatic AR expression in either TAg/Gh+/+ (B and C) or TAg/Ghdr/dr (D and E) rats. Furthermore, AR expression was similar in normal prostate epithelial cells/low-grade PIN (B and D) and high-grade PIN/carcinomas (C and E) in both TAg/Gh+/+ and TAg/Ghdr/dr. Prostates were excised and processed for IHC analysis.
Prostate GHR expression increased during cancer progression
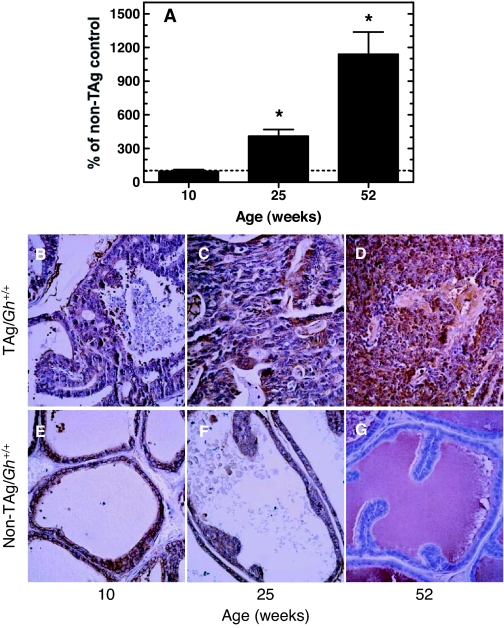
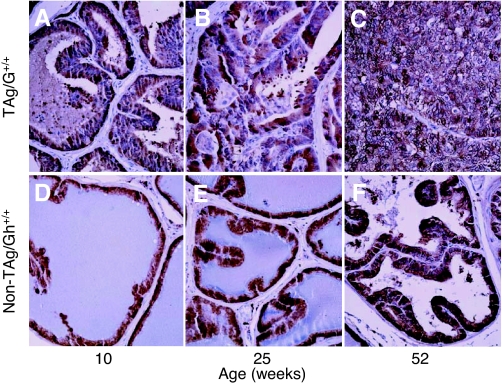
To examine GH/IGF signaling in the prostate gland during cancer progression, LPs of TAg/Gh+/+, TAg/Ghdr/dr, and non-TAg, age-matched control rats (Gh+/+ and Ghdr/dr) were analyzed for GHR, IGF-IR, and IGF-I using quantitative RT-PCR and IHC. Relative to non-TAg Gh+/+ rats, GHR mRNA levels were not altered in LPs of TAg/Gh+/+ rats at 10 wk of age, when mPIN and/or well-differentiated adenocarcinomas were observed (Fig. 7A and Table 2). However, by 25 wk of age, when well-differentiated to poorly differentiated adenocarcinomas had occupied over 80% of the LPs of TAg/Gh+/+ rats, GHR mRNA levels were 4.1-fold higher than that observed in age-matched Gh+/+ control (no TAg) LPs. At 52 wk, when the LPs of TAg/Gh+/+ rats were dominated by invasive cancers, GHR mRNA levels had increased 11.4-fold in TAg/Gh+/+ rats, compared with Gh+/+ rats. These findings were confirmed by IHC staining (Fig. 7, B–G, and Table 2), which showed that GHR protein levels in LPs of 10- and 25-wk-old TAg/Gh+/+ rats that contained PIN or well-differentiated tumor cells were comparable to that in the LPs of non-Tag/Gh+/+ rats and were up-regulated in moderately or poorly differentiated tumor cells of more advanced cancers observed at 52 wk. In contrast, GHR protein levels in the LPs of non-TAg/Gh+/+ rats was undetectable at 52 wk (Fig. 7G and Table 2).
Figure 7.
Prostatic GHR in TAg/Gh+/+ rats increased significantly during carcinogenesis. A, Quantitative RT-PCR analysis of GHR mRNA expression in the lateral prostates of TAg/Gh+/+ rats relative to cancer-free, age-matched non-TAg controls. The levels of GHR mRNA during carcinogenesis in TAg/Gh+/+ rats are presented relative to GHR mRNA levels in age-matched, cancer-free (no TAg oncogenic transgene, Gh+/+) prostates, which were assigned a value of 100%. *, Significantly different from age-matched non-TAg control (P < 0.01). B–D, IHC analysis of prostate GHR expression in TAg/Gh+/+ rats during prostate cancer progression at 10, 25, or 52 wk of age. E–G, IHC analysis of prostate GHR expression in Gh+/+ rats at 10, 25, or 52 wk of age.
Expression of GHR mRNA in the LPs of TAg/Ghdr/dr rats did not change significantly from that observed in Ghdr/dr (no TAg) control rat LPs at either 10 or 25 wk of age (Table 2). Expression of GHR decreased at 52 wk of age in TAg/Ghdr/dr rats that were tumor free but was elevated in TAg/Ghdr/dr rats that had developed prostate tumors. The mRNA results were confirmed for GHR protein expression using IHC (Table 2). The protein level of GHR remained moderate at 10 and 25 wk in normal epithelium and PIN tissue but appeared all but absent at 52 wk of age in non-TAg/Ghdr/dr and tumor-free TAg/Ghdr/dr animals (Table 2). In those TAg/Ghdr/dr rats that developed prostate tumors, expression of GHR protein was noticeably more abundant and similar to that observed in 10-wk-old rats, but the staining was far less intense than in tumors of TAg/Gh+/+ rats at 52 wk (Table 2). These results indicate that a marked decrease in GHR expression occurs in the LP with age in the absence of tumor, whereas GHR expression increases as tumors develop, independent of circulating GH levels.
Prostate IGF-IR expression decreased during prostate cancer progression in TAg/Gh+/+ rats but persisted in cancer-resistant TAg/Ghdr/dr rats
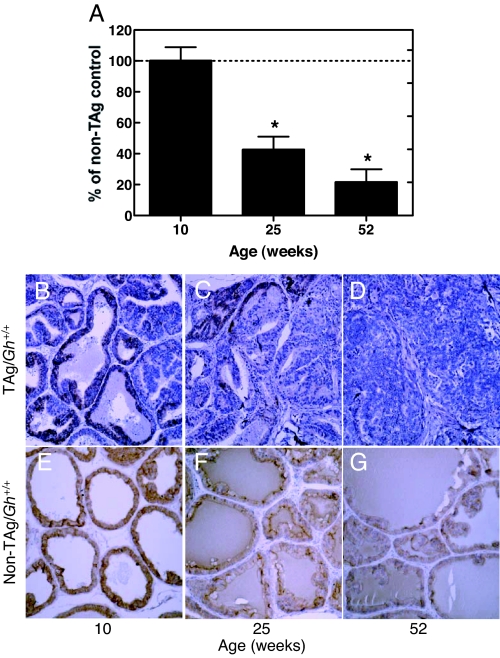
Expression of prostatic IGF-IR mRNA of TAg/Gh+/+ rats did not change in comparison with age-matched non-TAg Gh+/+ controls during the early stages of prostate cancer in this model (up to 10 wk of age; Fig. 8A and Table 2). Interestingly, however, IGF-IR mRNA levels were significantly reduced (57%) in the prostates of 25-wk-old non-TAg/Gh+/+ rats and in TAg/Gh+/+ rats with advanced adenocarcinomas. IGF-IR mRNA continued to decrease to 22% of non-TAg/Gh+/+ values as prostate cancer progressed to macroscopic invasive tumors at 52 wk of age. The level of immunostaining for the IGF-IR protein for the most part paralleled the changes observed in mRNA levels. Although IGF-IR protein levels declined with age in the absence of TAg (Fig. 8, E–G, and Table 2), IGF-IR protein levels were further reduced in adenomatous foci of LPs from 25- and 52-wk-old TAg/Gh+/+ rats (Fig. 8, C and D) compared with normal tissue of non-Tag controls (Fig. 4, F and G).
Figure 8.
Prostatic IGF-IR expression decreased significantly as prostate cancer progressed. A, Quantitative RT-PCR analysis of IGF-IR mRNA expression in the lateral prostates of TAg/Gh+/+ rats. The levels of GHR mRNA during carcinogenesis in TAg/Gh+/+ rats are presented relative to GHR mRNA levels in age-matched, cancer-free (no TAg oncogenic transgene, Gh+/+) prostates, which were assigned a value of 100%. *, Significantly different from age-matched non-TAg control (P < 0.001). B–D, IHC analysis of prostate IGF-IR expression in TAg/Gh+/+ rats during prostate cancer progression at 10, 25, or 52 wk of age. E–G, IHC analysis of prostate IGF-IR expression in Gh+/+ rats at 10, 25, or 52 wk of age.
The mRNA and protein expression of IGF-IR in TAg/Ghdr/dr rats was lower than that of age-matched non-TAg Ghdr/dr controls at 10 wk of age (Table 2). However, in contrast to the significantly reduced mRNA IGF-IR expression levels in TAg/Gh+/+, mRNA IGF-IR expression increased (1.7-fold) in 25-wk-old TAg/Ghdr/dr rats, and protein expression was also markedly increased. By 52 wk, prostates in tumor-free TAg/Ghdr/dr rats had IGF-IR mRNA and protein levels that were lower than at 25 wk but similar to non-TAg controls, which had increased levels compared with 25 wk. In contrast, mRNA expression of IGF-IR was reduced and protein expression was virtually absent in the invasive tumors of TAg/Ghdr/dr rats; this is similar to what was observed in the invasive tumors from TAg/Gh+/+ rats. In this model system, therefore, progression of invasive prostate tumors in both TAg/Gh+/+ and TAg/Ghdr/dr rats was associated with down-regulation of the IGF-IR. Furthermore, persistence of IGF-IR expression in 25- and 52-wk-old TAg/Ghdr/dr rats was associated with delayed prostate carcinogenesis.
Prostate IGF-I expression did not increase during prostate cancer progression
Prostate IGF-I mRNA levels in 10-wk-old TAg/Gh+/+ rats was about half that of age-matched, non-TAg Gh+/+ rats (Table 2). The IGF-I mRNA level increased but remained below non-TAg levels at 25 wk of age TAg/Gh+/+ as well as in 52-wk-old TAg/Gh+/+ rats, all of which developed invasive prostate tumors. Analysis of IGF-I by IHC indicated that there was no change in prostatic IGF-I protein expression during the transition from normal prostate epithelial cells to mPIN lesions (Fig. 9, A–F, and Table 2), even in the poorly differentiated cancer cells (Fig. 9C). Although IHC analysis of IGF-I protein did not confirm the decrease in IGF-I mRNA, both methods indicate that prostatic IGF-I expression did not increase during prostate carcinogenesis in TAg/Gh+/+ rats. In the TAg/Ghdr/dr rats, similar to the TAg/Gh+/+ rats, no increase in the expression of prostate IGF-I (neither mRNA nor protein levels) was observed during carcinogenesis. Even in the invasive prostate tumors, prostate IGF-I remained at levels similar to (protein) or below (mRNA) those in age-matched non-TAg controls (Table 2). Thus, there was no increase in the prostatic IGF-I level during prostate cancer development and progression.
Figure 9.
Prostatic IGF-I protein expression did not increase as prostate cancer progressed. A–C, IHC analysis of prostate IGF-I expression in TAg/Gh+/+ rats during prostate cancer progression at 10, 25, or 52 wk of age; D–F, IHC analysis of prostate IGF-I expression in Gh+/+ rats lacking TAg at 10, 25, or 52 wk of age.
Serum IGF-I levels did not increase during prostate cancer progression
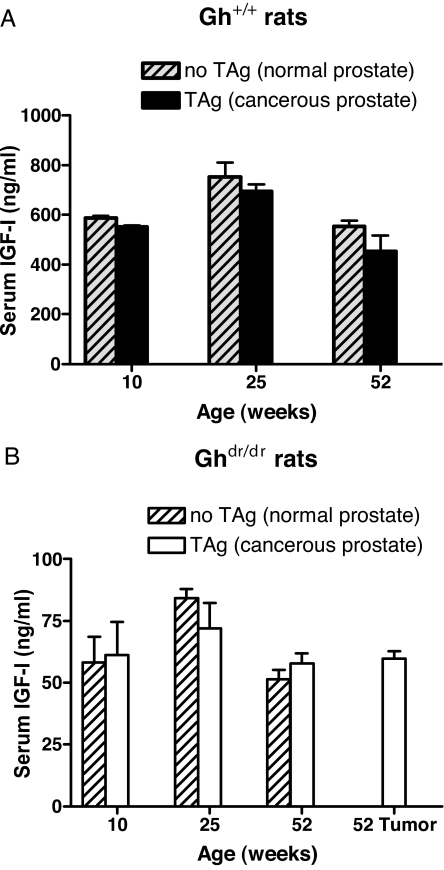
As discussed in the introductory section above, serum IGF-I titers have been reported to correlate positively with prostate carcinogenesis in some epidemiological studies, but not others. In both Gh+/+ and Ghdr/dr rats, serum IGF-I titers were independent of the presence or absence of the TAg oncogene and prostate carcinogenesis (Fig. 10). The serum IGF-I levels in the tumor-bearing TAg/Gh+/+ or TAg/Ghdr/dr rats were comparable to the levels in non-TAg Gh+/+ or Ghdr/dr controls, respectively. Thus, serum IGF-I levels were not elevated during prostate tumor progression in this model.
Figure 10.
Serum IGF-I levels did not increase as prostate cancer progressed. Serum IGF-I titers in Gh+/+ rats (A) or Ghdr/dr rats (B) with or without the TAg oncogene. The concentrations of serum IGF-I were determined by RIA (n = 5 per group).
Discussion
The absence of GH resulted in significantly smaller prostates in the dwarf (TAg/Ghdr/dr) rats relative to the GH wild-type rats (Fig. 1A). These findings suggest that the prostate volume in rats is sensitive to the effects of GH. It is well established that GH is important for prostate growth in men (2,3,41). Acromegalics have enlarged prostates, even though their androgen levels are lower than in normal men (42). Furthermore, in acromegalics rendered GH deficient due to aggressive surgical and medical therapy to reduce pituitary GH output, prostates shrank to volumes smaller than prostates of acromegalic patients with unchanged GH levels (41). Despite the small size of the prostates in TAg/Ghdr/dr rats, the decrease in their prostate weight was proportional to the reduction in overall body weight (Fig. 1B). Importantly, the TAg/Ghdr/dr prostates appeared to be normally differentiated (Fig. 2) in terms of their gross anatomy, histology, and expression of p63, CK18, probasin, and PBP, which are markers of prostate differentiation (40,43,44). Expression of p63 is limited to the basal layer of the prostate and is absolutely required for development of the prostate because p63 knockout mice do not develop a prostate gland (45). CK18 is expressed in differentiated prostate luminal cells and is diagnostic of fully mature prostate luminal cells (46,47). Probasin and PBP are the major prostatic secretory proteins in dorsal and ventral prostate, respectively (40,43,44). Thus, loss of GH signaling did not appear to affect epithelial cell cytodifferentiation or functional differentiation, and changes in carcinogenesis between the two genotypes are not likely to be a function of altered epithelial cell differentiation.
We have previously reported in a mouse model that TAg expression driven by the C3 promoter fragment was not affected by deletion of the GHR (28). Here, we observed that TAg expression driven by the probasin promoter in the rat prostate was similarly unaffected by the presence or absence of GH (Fig. 5). Even though fewer prostate lesions were observed in TAg/Ghdr/dr than TAg/Gh+/+ rats (Fig. 3), the two genotypes had similar TAg expression levels within each of the various degrees of prostate lesion severity.
The development of prostate carcinomas in the Probasin/TAg rat is known to be androgen dependent (29). Castration at a young age inhibited prostate tumor formation completely, whereas testosterone propionate administration induced microinvasion in prostate carcinomas. Castration after tumor development induced complete tumor involution within 5 wk. Thus, it was a concern whether androgen signaling was affected by the loss of GH in TAg/Ghdr/dr. However, serum testosterone levels in TAg/Ghdr/dr rats were not significantly different from testosterone levels in control rats (Fig. 6). Immunohistochemical analysis demonstrated that there was no difference in AR expression between TAg/Ghdr/dr and TAg/Gh+/+ rats in normal or cancerous prostate epithelial cells. Furthermore, the secretory function of the prostate gland is dependent on circulating androgens and functional prostatic AR (48), and no differences between TAg/Ghdr/dr and TAg/Gh+/+ rats were observed in the expression levels of the major prostatic secretory proteins or functional differentiation markers in the dorsal-lateral (probasin) and ventral prostate (PBP). Together, these data indicate that the protective effect of GH deficiency on carcinogenesis in this model is not due to dysregulation of androgen levels or the expression of AR in the rat prostate epithelium. This conclusion suggests the interesting possibility that therapies directed against the GH/IGF axis might be appropriate for combination therapy with antiandrogens and that substances that down-regulate the GH/IGF axis may be effective in the treatment of androgen-independent cancers for which new therapies are urgently needed.
Because TAg/Ghdr/dr rats have very low IGF-I serum titers (10% of TAg/Gh+/+ rats, Fig. 10) in addition to no detectable serum GH, and because serum IGF-I titers have been reported to correlate positively with prostate carcinogenesis in some epidemiological studies, we evaluated the relative contributions of prostatic GH and IGF-I signaling to prostate carcinogenesis in this model system. It is notable that IHC findings showed that GHR is present in prostate epithelial cells, thus allowing direct GH action (Fig. 7 and Table 2). Furthermore, the increase in GHR expression observed as prostate cancer progressed suggests that prostate tumor cells may become more sensitive to the direct effects of circulating GH during tumor progression and that prostatic GH signaling may contribute to advancement of this malignancy.
In contrast to GHR expression, the expression of prostatic IGF-IR mRNA in TAg/Gh+/+ rats decreased as prostate carcinogenesis progressed (Fig. 8 and Table 2). These findings are not consistent with a report that IGF-IR expression in human prostate cancer cell lines is higher in more advanced-stage, hormone-independent cell lines than in androgen-dependent cells (49) but are in agreement with reports that IGF-IR mRNA was not detected in a series of advanced/metastatic-stage human prostate carcinomas (50,51). Plymate and colleaguesh (52) reported that reexpression of the IGF-IR in a malignant human prostate epithelial cell line resulted in decreased tumor growth and proposed that IGF-IR may reactivate cellular differentiation. Taken together, the present and previous findings suggest that high levels of prostatic IGF-IR expression may induce a differentiation pathway that can suppress the malignant phenotype and that down-regulation of IGF-IR may play a significant role in the development of advanced prostate cancer.
No increase in serum (Fig. 10) or prostate IGF-I mRNA or protein (Table 2) levels was observed with advanced cancer progression in rats of either GH genotype bearing the TAg gene or in their respective non-TAg controls. Although IGF-I may be required for cell maintenance and division, it is not the primary driving force behind prostate tumor progression in this animal model.
Based on the results presented here, we propose that direct GH stimulation at the prostatic level plays a marked role in the progression of mPIN to malignant and invasive prostate cancers in the TAg/Gh+/+ rat. These findings may have important translational implications. Human PIN lesions occur at a similar incidence in individuals of populations at either high or low risk for the development of prostate cancer (53), and the difference in mortality rates between high- and low-risk populations is believed to be due to differences in the progression of early-stage lesions to advanced prostate cancers. Because findings from the current study suggest that increased GH signaling may directly stimulate the progression of prostate cancer, GH antagonism by use of a GH antagonist (54,55) or methods to reduce endogenous GH via a GHRH antagonist (56) may be a useful treatment modality for men diagnosed with early-stage disease. Furthermore, up-regulation of GHR and loss of IGF-IR may serve as an early marker of advanced disease. The newly established TAg/Ghdr/dr rat model described herein may facilitate further understanding of the role that the GH/IGF axis plays during initiation and progression of prostate cancer.
Footnotes
First Published Online December 13, 2007
Abbreviations: AR, Androgen receptor; CK18, cytokeratin 18; DP, dorsal prostate; GHR, GH receptor; IHC, immunohistochemistry; LP, lateral prostate; mPIN, murine prostatic intraepithelial neoplasia; PBP, prostate binding protein; PIN, prostatic intraepithelial neoplasia; SDR, Spontaneous Dwarf rat; TAg, simian virus 40 large T antigen; VP, ventral prostate.
This work was supported by National Institutes of Health Grant R03 AG020820 and U.S. Army MRMC Grant W81XWH-04-1-0201.
Disclosure Statement: The authors of this manuscript have nothing to declare.
References
- Jemal A, Siegel R, Ward E, Murray T, Xu J, Thun MJ 2007 Cancer statistics, 2007. CA Cancer J Clin 57:43–66 [DOI] [PubMed] [Google Scholar]
- Colao A, Di Somma C, Spiezia S, Filippella M, Pivonello R, Lombardi G 2003 Effect of growth hormone (GH) and/or testosterone replacement on the prostate in GH-deficient adult patients. J Clin Endocrinol Metab 88:88–94 [DOI] [PubMed] [Google Scholar]
- Colao A, Spiezia S, Di Somma C, Marzullo P, Cerbone G, Pivonello R, Faggiano A, Lombardi G 2000 Effect of GH and/or testosterone deficiency on the prostate: an ultrasonographic and endocrine study in GH-deficient adult patients. Eur J Endocrinol 143:61–69 [DOI] [PubMed] [Google Scholar]
- Colao A, Marzullo P, Spiezia S, Giaccio A, Ferone D, Cerbone G, Di Sarno A, Lombardi G 2000 Effect of two years of growth hormone and insulin-like growth factor-I suppression on prostate diseases in acromegalic patients. J Clin Endocrinol Metab 85:3754–3761 [DOI] [PubMed] [Google Scholar]
- Reiter E, Kecha O, Hennuy B, Lardinois S, Klug M, Bruyninx M, Closset J, Hennen G 1995 Growth hormone directly affects the function of the different lobes of the rat prostate. Endocrinology 136:3338–3345 [DOI] [PubMed] [Google Scholar]
- Pollak M, Beamer W, Zhang JC 1998 Insulin-like growth factors and prostate cancer. Cancer Metastasis Rev 17:383–390 [DOI] [PubMed] [Google Scholar]
- Butler AA, LeRoith D 2001 Minireview: tissue-specific versus generalized gene targeting of the igf1 and igf1r genes and their roles in insulin-like growth factor physiology. Endocrinology 142:1685–1688 [DOI] [PubMed] [Google Scholar]
- Roberts Jr CT 2004 IGF-1 and prostate cancer. Novartis Found Symp 262:193–199; discussion 199–204, 265–198 [PubMed] [Google Scholar]
- Chan JM, Stampfer MJ, Giovannucci E, Gann PH, Ma J, Wilkinson P, Hennekens CH, Pollak M 1998 Plasma insulin-like growth factor-I and prostate cancer risk: a prospective study. Science 279:563–566 [DOI] [PubMed] [Google Scholar]
- Harman SM, Metter EJ, Blackman MR, Landis PK, Carter HB 2000 Serum levels of insulin-like growth factor I (IGF-I), IGF-II, IGF-binding protein-3, and prostate-specific antigen as predictors of clinical prostate cancer. J Clin Endocrinol Metab 85:4258–4265 [DOI] [PubMed] [Google Scholar]
- Stattin P, Bylund A, Rinaldi S, Biessy C, Dechaud H, Stenman UH, Egevad L, Riboli E, Hallmans G, Kaaks R 2000 Plasma insulin-like growth factor-I, insulin-like growth factor-binding proteins, and prostate cancer risk: a prospective study. J Natl Cancer Inst 92:1910–1917 [DOI] [PubMed] [Google Scholar]
- Woodson K, Tangrea JA, Pollak M, Copeland TD, Taylor PR, Virtamo J, Albanes D 2003 Serum insulin-like growth factor I: tumor marker or etiologic factor? A prospective study of prostate cancer among Finnish men. Cancer Res 63:3991–3994 [PubMed] [Google Scholar]
- Oliver SE, Gunnell D, Donovan J, Peters TJ, Persad R, Gillatt D, Pearce A, Neal DE, Hamdy FC, Holly J 2004 Screen-detected prostate cancer and the insulin-like growth factor axis: results of a population-based case-control study. Int J Cancer 108:887–892 [DOI] [PubMed] [Google Scholar]
- Mantzoros CS, Tzonou A, Signorello LB, Stampfer M, Trichopoulos D, Adami HO 1997 Insulin-like growth factor 1 in relation to prostate cancer and benign prostatic hyperplasia. Br J Cancer 76:1115–1118 [DOI] [PMC free article] [PubMed] [Google Scholar]
- Wolk A, Mantzoros CS, Andersson SO, Bergstrom R, Signorello LB, Lagiou P, Adami HO, Trichopoulos D 1998 Insulin-like growth factor 1 and prostate cancer risk: a population-based, case-control study. J Natl Cancer Inst 90:911–915 [DOI] [PubMed] [Google Scholar]
- Wolk A, Andersson SO, Mantzoros CS, Trichopoulos D, Adami HO 2000 Can measurements of IGF-1 and IGFBP-3 improve the sensitivity of prostate-cancer screening? Lancet 356:1902–1903 [DOI] [PubMed] [Google Scholar]
- Khosravi J, Diamandi A, Mistry J, Scorilas A 2001 Insulin-like growth factor I (IGF-I) and IGF-binding protein-3 in benign prostatic hyperplasia and prostate cancer. J Clin Endocrinol Metab 86:694–699 [DOI] [PubMed] [Google Scholar]
- Chan JM, Stampfer MJ, Ma J, Gann P, Gaziano JM, Pollak M, Giovannucci E 2002 Insulin-like growth factor-I (IGF-I) and IGF binding protein-3 as predictors of advanced-stage prostate cancer. J Natl Cancer Inst 94:1099–1106 [DOI] [PubMed] [Google Scholar]
- Li L, Yu H, Schumacher F, Casey G, Witte JS 2003 Relation of serum insulin-like growth factor-I (IGF-I) and IGF binding protein-3 to risk of prostate cancer (United States). Cancer Causes Control 14:721–726 [DOI] [PubMed] [Google Scholar]
- Cutting CW, Hunt C, Nisbet JA, Bland JM, Dalgleish AG, Kirby RS 1999 Serum insulin-like growth factor-1 is not a useful marker of prostate cancer. BJU Int 83:996–999 [DOI] [PubMed] [Google Scholar]
- Janssen JA, Wildhagen MF, Ito K, Blijenberg BG, Van Schaik RH, Roobol MJ, Pols HA, Lamberts SW, Schroder FH 2004 Circulating free insulin-like growth factor (IGF)-I, total IGF-I, and IGF binding protein-3 levels do not predict the future risk to develop prostate cancer: results of a case-control study involving 201 patients within a population-based screening with a 4-year interval. J Clin Endocrinol Metab 89:4391–4396 [DOI] [PubMed] [Google Scholar]
- Chen C, Lewis SK, Voigt L, Fitzpatrick A, Plymate SR, Weiss NS 2005 Prostate carcinoma incidence in relation to prediagnostic circulating levels of insulin-like growth factor I, insulin-like growth factor binding protein 3, and insulin. Cancer 103:76–84 [DOI] [PubMed] [Google Scholar]
- Kurek R, Tunn UW, Eckart O, Aumuller G, Wong J, Renneberg H 2000 The significance of serum levels of insulin-like growth factor-1 in patients with prostate cancer. BJU Int 85:125–129 [DOI] [PubMed] [Google Scholar]
- Finne P, Auvinen A, Koistinen H, Zhang WM, Maattanen L, Rannikko S, Tammela T, Seppala M, Hakama M, Stenman UH 2000 Insulin-like growth factor I is not a useful marker of prostate cancer in men with elevated levels of prostate-specific antigen. J Clin Endocrinol Metab 85:2744–2747 [DOI] [PubMed] [Google Scholar]
- Renehan AG, Zwahlen M, Minder C, O’Dwyer ST, Shalet SM, Egger M 2004 Insulin-like growth factor (IGF)-I, IGF binding protein-3, and cancer risk: systematic review and meta-regression analysis. Lancet 363:1346–1353 [DOI] [PubMed] [Google Scholar]
- Shi R, Berkel HJ, Yu H 2001 Insulin-like growth factor-I and prostate cancer: a meta-analysis. Br J Cancer 85:991–996 [DOI] [PMC free article] [PubMed] [Google Scholar]
- Fuhrman B, Barba M, Schunemann HJ, Hurd T, Quattrin T, Cartagena R, Carruba G, Muti P 2005 Basal growth hormone concentrations in blood and the risk for prostate cancer: a case-control study. Prostate 64:109–115 [DOI] [PubMed] [Google Scholar]
- Wang Z, Prins GS, Coschigano KT, Kopchick JJ, Green JE, Ray VH, Hedayat S, Christov KT, Unterman TG, Swanson SM 2005 Disruption of growth hormone signaling retards early stages of prostate carcinogenesis in the C3(1)/T antigen mouse. Endocrinology 146:5188–5196 [DOI] [PubMed] [Google Scholar]
- Asamoto M, Hokaiwado N, Cho YM, Takahashi S, Ikeda Y, Imaida K, Shirai T 2001 Prostate carcinomas developing in transgenic rats with SV40 T antigen expression under probasin promoter control are strictly androgen dependent. Cancer Res 61:4693–4700 [PubMed] [Google Scholar]
- Okuma S 1984 [Study of growth hormone in spontaneous dwarf rat]. Nippon Naibunpi Gakkai Zasshi 60:1005–1014 (Japanese) [DOI] [PubMed] [Google Scholar]
- Takeuchi T, Suzuki H, Sakurai S, Nogami H, Okuma S, Ishikawa H 1990 Molecular mechanism of growth hormone (GH) deficiency in the spontaneous dwarf rat: detection of abnormal splicing of GH messenger ribonucleic acid by the polymerase chain reaction. Endocrinology 126:31–38 [DOI] [PubMed] [Google Scholar]
- Nogami H, Takeuchi T, Suzuki K, Okuma S, Ishikawa H 1989 Studies on prolactin and growth hormone gene expression in the pituitary gland of spontaneous dwarf rats. Endocrinology 125:964–970 [DOI] [PubMed] [Google Scholar]
- Okuma S 1980 Spontaneous dwarf rat. Exp Anim 29:301–305 [Google Scholar]
- Gargosky SE, Nanto-Salonen K, Tapanainen P, Rosenfeld RG 1993 Pregnancy in growth hormone-deficient rats: assessment of insulin-like growth factors (IGFs), IGF-binding proteins (IGFBPs) and IGFBP protease activity. J Endocrinol 136:479–489 [DOI] [PubMed] [Google Scholar]
- Nogami H, Watanabe T, Takeuchi T 1992 Effect of growth hormone (GH) on the promotion of body weight gain in the spontaneous dwarf rat: a novel experimental model for isolated GH deficiency. Horm Metab Res 24:300–301 [DOI] [PubMed] [Google Scholar]
- Shappell SB, Thomas GV, Roberts RL, Herbert R, Ittmann MM, Rubin MA, Humphrey PA, Sundberg JP, Rozengurt N, Barrios R, Ward JM, Cardiff RD 2004 Prostate pathology of genetically engineered mice: definitions and classification. The consensus report from the Bar Harbor meeting of the Mouse Models of Human Cancer Consortium Prostate Pathology Committee. Cancer Res 64:2270–2305 [DOI] [PubMed] [Google Scholar]
- Bostwick DG 1995 High grade prostatic intraepithelial neoplasia. Cancer 75(S7):1823–1836 [Google Scholar]
- Luque RM, Gahete MD, Hochgeschwender U, Kineman RD 2006 Evidence that endogenous SST inhibits ACTH and ghrelin expression by independent pathways. Am J Physiol Endocrinol Metab 291:E395–E403 [DOI] [PubMed] [Google Scholar]
- Luque RM, Kineman RD 2006 Impact of obesity on the growth hormone axis: evidence for a direct inhibitory effect of hyperinsulinemia on pituitary function. Endocrinology 147:2754–2763 [DOI] [PubMed] [Google Scholar]
- Heyns W, De Moor P 1977 Prostatic binding protein. A steroid-binding protein secreted by rat prostate. Eur J Biochem 78:221–230 [DOI] [PubMed] [Google Scholar]
- Colao A, Marzullo P, Spiezia S, Ferone D, Giaccio A, Cerbone G, Pivonello R, Di Somma C, Lombardi G 1999 Effect of growth hormone (GH) and insulin-like growth factor I on prostate diseases: an ultrasonographic and endocrine study in acromegaly, GH deficiency, and healthy subjects. J Clin Endocrinol Metab 84:1986–1991 [DOI] [PubMed] [Google Scholar]
- Colao A, Marzullo P, Ferone D, Spiezia S, Cerbone G, Marino V, Di Sarno A, Merola B, Lombardi G 1998 Prostatic hyperplasia: an unknown feature of acromegaly. J Clin Endocrinol Metab 83:775–779 [DOI] [PubMed] [Google Scholar]
- Dodd JG, Sheppard PC, Matusik RJ 1983 Characterization and cloning of rat dorsal prostate mRNAs. Androgen regulation of two closely related abundant mRNAs. J Biol Chem 258:10731–10737 [PubMed] [Google Scholar]
- Matusik RJ, Kreis C, McNicol P, Sweetland R, Mullin C, Fleming WH, Dodd JG 1986 Regulation of prostatic genes: role of androgens and zinc in gene expression. Biochem Cell Biol 64:601–607 [DOI] [PubMed] [Google Scholar]
- Signoretti S, Waltregny D, Dilks J, Isaac B, Lin D, Garraway L, Yang A, Montironi R, McKeon F, Loda M 2000 p63 is a prostate basal cell marker and is required for prostate development. Am J Pathol 157:1769–1775 [DOI] [PMC free article] [PubMed] [Google Scholar]
- Hsieh JT, Zhau HE, Wang XH, Liew CC, Chung LW 1992 Regulation of basal and luminal cell-specific cytokeratin expression in rat accessory sex organs. Evidence for a new class of androgen-repressed genes and insight into their pairwise control. J Biol Chem 267:2303–2310 [PubMed] [Google Scholar]
- Prins GS, Birch L 1995 The developmental pattern of androgen receptor expression in rat prostate lobes is altered after neonatal exposure to estrogen. Endocrinology 136:1303–1314 [DOI] [PubMed] [Google Scholar]
- Cunha GR, Young P 1991 Inability of Tfm (testicular feminization) epithelial cells to express androgen-dependent seminal vesicle secretory proteins in chimeric tissue recombinants. Endocrinology 128:3293–3298 [DOI] [PubMed] [Google Scholar]
- Iwamura M, Sluss PM, Casamento JB, Cockett AT 1993 Insulin-like growth factor I: action and receptor characterization in human prostate cancer cell lines. Prostate 22:243–252 [DOI] [PubMed] [Google Scholar]
- Tennant MK, Thrasher JB, Twomey PA, Drivdahl RH, Birnbaum RS, Plymate SR 1996 Protein and messenger ribonucleic acid (mRNA) for the type 1 insulin-like growth factor (IGF) receptor is decreased and IGF-II mRNA is increased in human prostate carcinoma compared to benign prostate epithelium. J Clin Endocrinol Metab 81:3774–3782 [DOI] [PubMed] [Google Scholar]
- Chott A, Sun Z, Morganstern D, Pan J, Li T, Susani M, Mosberger I, Upton MP, Bubley GJ, Balk SP 1999 Tyrosine kinases expressed in vivo by human prostate cancer bone marrow metastases and loss of the type 1 insulin-like growth factor receptor. Am J Pathol 155:1271–1279 [DOI] [PMC free article] [PubMed] [Google Scholar]
- Plymate SR, Bae VL, Maddison L, Quinn LS, Ware JL 1997 Reexpression of the type 1 insulin-like growth factor receptor inhibits the malignant phenotype of simian virus 40 T antigen immortalized human prostate epithelial cells. Endocrinology 138:1728–1735 [DOI] [PubMed] [Google Scholar]
- Bostwick DG, Eble JN 1997 Urologic surgical pathology. 1st ed. St. Louis: Mosby [Google Scholar]
- Kopchick JJ, Parkinson C, Stevens EC, Trainer PJ 2002 Growth hormone receptor antagonists: discovery, development, and use in patients with acromegaly. Endocr Rev 23:623–646 [DOI] [PubMed] [Google Scholar]
- van der Lely AJ, Kopchick JJ 2006 Growth hormone receptor antagonists. Neuroendocrinology 83:264–268 [DOI] [PubMed] [Google Scholar]
- Schally AV, Varga JL 2006 Antagonists of growth hormone-releasing hormone in oncology. Comb Chem High Throughput Screen 9:163–170 [DOI] [PubMed] [Google Scholar]


