Abstract
Phytochromes are light-sensing pigments found in plants and bacteria. For the first time, the Pfr photoreaction of a phytochrome has been subject to ultrafast infrared vibrational spectroscopy. Three time constants of 0.3 ps, 1.3 ps, and 4.0 ps were derived from the kinetics of structurally specific marker bands of the biliverdin chromophore of Agp1-BV from Agrobacterium tumefaciens after excitation at 765 nm. VIS-pump-VIS-probe experiments yield time constants of 0.44 ps and 3.3 ps for the underlying electronic-state dynamics. A reaction scheme is proposed including two kinetic steps on the S1 excited-state surface and the cooling of a vibrationally hot Pfr ground state. It is concluded that the upper limit of the E-Z isomerization of the C15 = C16 methine bridge is given by the intermediate time constant of 1.3 ps. The reaction scheme is reminiscent of that of the corresponding Pr reaction of Agp1-BV as published earlier.
INTRODUCTION
In plants and bacteria, a multitude of processes is controlled by phytochromes (1,2), a class of photoreceptor proteins with two photochemically interconvertible and thermally stable states Pr and Pfr that absorb in the red and far-red spectral region, respectively. This feature of phytochromes not only allows the investigation of two different reactions of the same chromophore within one binding environment, but also makes them prototypes for biomimetic bistable light-driven switches. Three-dimensional structures of the chromophore-binding environments of bacterial phytochromes, DrBphP (3,4) and RpBphP3 (5), have recently been resolved.
The primary processes of the two photoconversions involve a Z-E isomerization of the methine bridge between rings C and D of the bilin chromophore for the Pr reaction and an E-Z isomerization for the Pfr reaction (6,7). Each reaction pathway involves several intermediate states, with the first ones being lumi-R (Pr reaction) and lumi-F (Pfr reaction), which are formed quickly after photoexcitation. The following reaction steps occur on the microsecond to millisecond timescale and have been characterized by UV/VIS, FTIR, and resonance Raman (RR) spectroscopy using low-temperature trapping techniques (8–15). In all bacterial and plant phytochromes known so far, the relatively slow Pr photoreaction takes place within ∼5–100 ps as opposed to the relatively fast Pfr photoreaction which occurs on the timescale of a few picoseconds (16–18).
The primary photoreaction of the Pr form of different members of the phytochrome family has been subject to numerous investigations, including ultrafast VIS-VIS (17–22) and VIS-IR (23,24) pump-probe as well as fluorescence (25–27) spectroscopy. In contrast, the literature on the primary processes of the Pfr reaction is still very scarce. However, the high rate of its excited electronic-state decay has been quantified by ultrafast VIS-VIS spectroscopy (16–18). Further, fluorescence studies on the Pfr form of oat phytochrome do not show any detectable fluorescence (26), in line with a very efficient quenching of the excited electronic state.
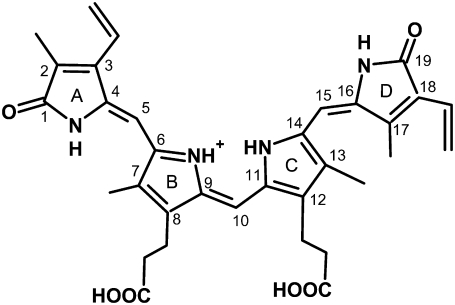
In this work, we address the primary photoreaction of the Pfr form of the biliverdin-binding phytochrome Agp1 (Fig. 1) from Agrobacterium tumefaciens (28) by ultrafast mid-IR transient absorption spectroscopy. To our knowledge, this is the first ultrafast IR investigation of the Pfr reaction of a member of the phytochrome family. Details of the chromophore-protein interaction in Agp1-BV have already been obtained by site-directed mutagenesis and mass spectrometry, showing the covalent binding of the biliverdin (BV) chromophore via its ring A-vinyl side chain to the Cys20 residue (29). In both stable states, Pr and Pfr, the chromophore has been found protonated via RR spectroscopy and flash photolysis experiments (30). Recent results using locked bilin chromophores (31,32) suggest that the chromophore configuration is ZZZssa in Pr and ZZEasa in Pfr (ZZZssa and ZZEasa denote the configuration (Z, E) and conformation (a, s) of the methine bridges in the order A-B, B-C, and C-D).
FIGURE 1.
Chemical structure of the biliverdin (BV) chromophore in ZZEasa configuration, as suggested for the Pfr state (31).
As has been demonstrated earlier (34,35), ultrafast mid-IR spectroscopy is an excellent method to monitor light-induced structural dynamics. Here, it allows us to follow the transient vibrational spectra of the molecular states along the primary Pfr photoisomerization in Agp1-BV with subpicosecond time resolution. Combined with the electronic-states dynamics as obtained by transient absorption measurements in the visible spectra, different reaction models for the primary Pfr reaction can be evaluated.
METHODS
Sample preparation
Agp1 from Agrobacterium tumefaciens was expressed and purified as already described elsewhere (28). A D2O (pD = 7.8) buffer solution (20 mM Tris, 50 mM NaCl) was used for all experiments. The protein was concentrated by ultrafiltration (YM-50, Centricon, Houston, TX) to a viscous smear, homogeneously spread on a 1.5-inch-diameter CaF2 window (2 mm thick) and sealed by a second, similar window. In the absorption maximum of the Pr form at λmax = 700 nm, the optical density of the sample was between ∼0.5 OD and ∼1.0 OD, equivalent to a pathlength of ∼25–50 μm. This translates to an optical density of ∼2 in the amide I/II-region of the steady-state FTIR spectrum of the sample. Note that the photoinduced IR-difference signals (see discussion below) are three orders-of-magnitude smaller (∼1 mOD). To allow experiments in the region of high amide I background absorption, samples of lower optical density were used.
The sample was rotated and moved in the focus plane of the laser beam perpendicular to the direction of incidence during the experiment to provide fresh sample conditions for each laser pulse, i.e., to exchange the (microscopic) excited sample volume between two pump-and-probe events (1.6 ms) and to allow for sufficient recovery of the Pfr state. To avoid photoproduct buildup, firstly an excitation wavelength of λexc = 765 nm on the red edge of the Pfr absorption band was chosen. Secondly, the sample was irradiated by background light from a halogen lamp (K2500-LCD, red filter, Schott, Mainz, Germany), fitting the absorption spectrum of the Pr form (λmax = 700 nm). All measurements were performed at room temperature. Sample integrity was confirmed by static FTIR and UV/VIS spectroscopy before and after the experiments. Except for general bleaching of the steady-state absorption in the visible up to ∼10% until the sample was discarded, no spectral changes were observed.
Pump-probe spectrometer
The short laser pulses for the pump-probe spectrometer were generated in nonlinear optical devices. A Ti:Sa-regenerative amplifier system (CPA 2001, Clark-MXR, Dexter, MI) was used as pump source for the whole experiment. The visible pump pulses were generated in a homebuilt noncollinear optical parametric amplifier (NOPA), yielding pulses tunable between 470 and 765 nm with pulse lengths routinely at 60 fs.
Infrared probe pulses were generated in a two-stage optical parametric amplifier with subsequent difference frequency mixing. The center wavelength of the probe pulses is tunable between 800 cm−1 and 2500 cm−1 (36). After passing through the sample, the probe pulses with a typical full width at half-maximum (FWHM) of 100 cm−1 are dispersed in a polychromator and detected by a 32-element MCT array (Infrared Systems Development, Winter Park, FL), comprising a spectral window of ∼300 nm (≈90 cm−1 at 1750 cm−1 and ≈40 cm−1 at 1180 cm−1). The pump beam was chopped at 318 Hz (half the laser repetition rate), and pump-induced absorption differences were evaluated on a single-shot basis. Control measurements on a thin silicon wafer were performed before and after each experiment to determine the time zero and the FWHM of the instrument response function (typically 280 fs). The optical path through the front CaF2 window and other parameters were identical to those of the phytochrome measurements. The spectral resolution, which varies slightly with the probe wavenumber, was typically 2.5 cm−1.
For VIS-VIS pump-probe experiments, the same NOPA was used as pump source, and the probe pulses were generated by a second NOPA. The chopping scheme was the same as in VIS-IR experiments. After passing through the sample, the probe pulses (spectral width ∼20 nm) were dispersed by a monochromator (bandwidth 6 nm) and detected by a photodiode. Time zero and FWHM of the system response (100 fs) were determined by cross correlation in a BBO crystal or in a SiC-photodiode (two-photon absorption (37)).
The recorded data are the pump-induced absorbance changes ΔA(Δt, λpr); cuts along the time axis (Δt) are transients for fixed wavenumbers; and cuts along the probe wavenumber axis (λpr) are difference spectra at discrete delay times. The broadband IR probe pulses along with the detector array allow the detection of one spectral window at a given center wavelength (see above). Comparability and normalization of the IR data within the entire investigated spectral regions (Figs. 2 and 3) was achieved via sufficient overlap between adjacent spectral windows.
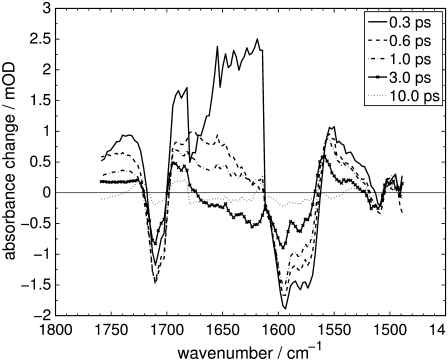
FIGURE 2.
Difference spectra of the carbonyl and ethylenic stretch regions of Agp1-BV Pfr after excitation at λexc = 765 nm at selected delay times.
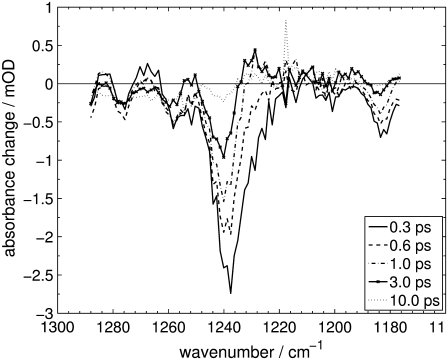
FIGURE 3.
Difference spectra of the fingerprint region of Agp1-BV Pfr after excitation at λexc = 765 nm at selected delay times.
Negative absorbance changes display the disappearance of IR absorption and thus depopulation of the Pfr electronic ground-state vibrations (bleach bands). Positive absorbance changes indicate the absorption of newly populated vibrational states.
The obtained absorbance changes ΔA(Δt, λpr) between 0.4 ps and 50 ps were analyzed by a global multiexponential fit,
 |
(1) |
with A0(λpr) being the pump-induced absorption changes for Δt → ∞ and Ai(λpr) being the decay associated spectra (DAS) of the corresponding time constants τi.
RESULTS
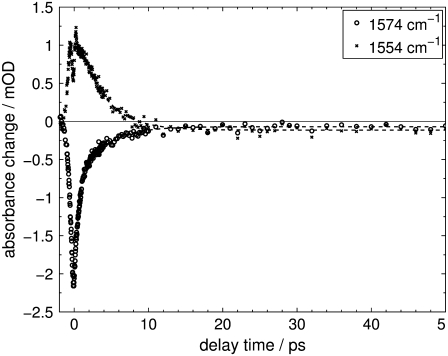
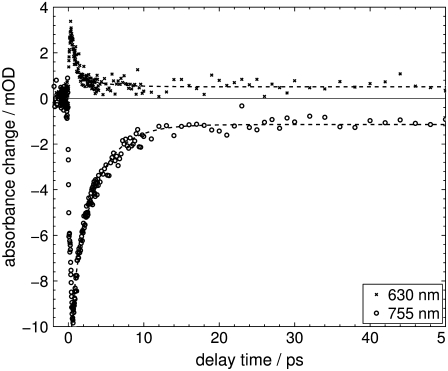
Transient IR absorption spectra of Agp1-BV after photoexcitation at λexc = 765 nm were recorded for the carbonyl and ethylenic stretch regions (1490–1760 cm−1) and the fingerprint region (1177–1288 cm−1). Difference spectra in the respective spectral regions at various delay times are depicted in Figs. 2 and 3. To correlate the transient vibrational signals (Fig. 4) with the electronic-state dynamics, ultrafast VIS-VIS pump-probe experiments were conducted on the same samples, with excitation at 765 nm and probing at 630, 655, 680, 705, 730, and 755 nm (see Fig. 5 for representative transients).
FIGURE 4.
Transient absorption changes of Agp1-BV Pfr after excitation at λexc = 765 nm at selected probe wavenumbers of 1554 cm−1 and 1574 cm−1. (Dashed line) Global fit with time constants of τ1 = 0.3 ± 0.1 ps, τ2 = 1.3 ± 0.1 ps, and τ3 = 4.0 ± 0.1 ps. For the fit, only data after 400 fs delay time was used to exclude nonlinear artifacts before (perturbed free induction decay (57)) and at time zero (cross phase modulation (58)) as well as the system response.
FIGURE 5.
Transient absorption changes of Agp1-BV Pfr after excitation at λexc = 765 nm at selected probe wavelengths of 630 nm and 755 nm. (Dashed line) Global fit with time constants of tV1 = 0.44 pm 0.05 ps, and tV2 = 3.3 pm 0.1 ps. Data before 400 fs delay time was excluded from the fit.
Band assignment
The structural dynamics of the biliverdin chromophore are monitored by the temporal evolution of vibrational marker bands. The timescale of the detected absorbance changes and the fact that the most significant structural changes are to be expected from the chromophore strongly suggest an assignment of the detected signals to vibrations of the BV chromophore rather than the protein moiety. Taking into account results from experiments using locked chromophores (31,32), we base our band assignment on the commonly accepted assumption that the chromophore structure of the Pfr form is ZZEasa. In support of the literature-based assignments, density functional theory (B3LYP/6-31G**) frequency calculations (38) on the ZZEasa chromophore were performed. For the calculations, all pyrrole nitrogens were modeled as protonated (30), no counterion was used, and vibrational frequencies were scaled with a global factor of 0.9613 (39).
In the carbonyl stretch region (see Fig. 2), the instantaneous bleach band at 1710 cm−1 is assigned to the C19 = O stretching vibration, based on the results in the literature (9,10,40) and our own calculations. The hydrogen bonding of the ring D carbonyl group to His280 (3,15) lowers its stretching frequency significantly, whereas the ring A carbonyl group is not hydrogen-bonded and shows up at higher wavenumbers in PhyA-PΦB (10). Furthermore, since the isomerization occurs at the methine-bridge linking rings C and D, the contribution of modes located on ring D to the difference spectra can be expected to be substantially larger.
The manifold of bleach bands with peaks at 1594 cm−1, 1580 cm−1, and 1574 cm−1 can be assigned to C=C stretching vibrations of the π-system comprised by the pyrrole rings and the linking methine bridges. Previous FTIR experiments on isotope-labeled Cph1-PCB (40), as well as RR experiments on Agp1-BV (30) and PhyA-PΦB (13,14), and FTIR experiments on PhyA-PΦB (9) have found these bands and assigned them to C=C stretching modes. In addition, our own calculations show a multitude of modes with dominant C=C stretching character in this spectral region.
Two pyrrole breathing modes located mainly on rings B and C are favored for the assignment of the small bleach band at 1509 cm−1. The frequencies of these two modes were calculated to 1491 cm−1 and 1523 cm−1. The involvement of their constituent atoms in the delocalized π-system of the chromophore backbone makes them sensitive to the isomerization.
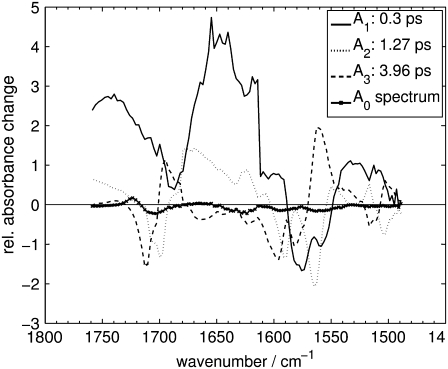
The broad and short-lived positive signal between 1610 cm−1 and 1700 cm−1 appears almost instantaneously and decays with a time constant of 0.3 ps (see analysis below, Fig. 6). Thus, it is likely due to S1 vibrational modes.
FIGURE 6.
Decay-associated spectra for the Pfr primary reaction of Agp1-BV in the carbonyl and ethylenic stretch regions as derived from a global fit.
In the fingerprint region, our own calculations show numerous C-H rocking and C-C stretching vibrations, so that the assignment of the difference bands in Fig. 3 at 1276 cm−1, 1238 cm−1 and 1184 cm−1 to modes of that character is only qualitative.
Kinetic analysis
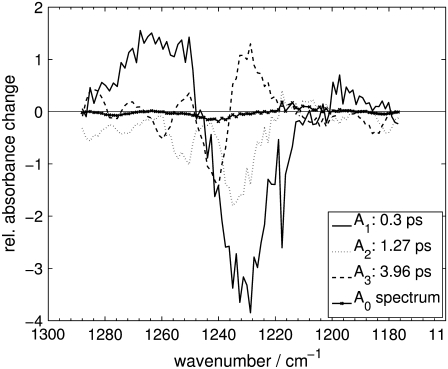
A global analysis of the complete time-resolved IR data was performed via Eq. 1. Three exponentials are necessary to fit the data, whereas a four-exponential approach does not increase the goodness of fit. This analysis yields time constants of τ1 = 0.3 ± 0.1 ps, τ2 = 1.3 ± 0.1 ps, and τ3 = 4.0 ± 0.1 ps, and the corresponding decay-associated spectra (DAS) A1, A2 and A3, as shown in Figs. 6 and 7 for the respective spectral regions. Singular value decomposition of the time-resolved difference spectra and triexponential fit of the most significant component (not shown) renders time constants of 0.3 ps, 1.0 ps, and 3.6 ps. This further corroborates the results of the global fit.
FIGURE 7.
Decay-associated spectra for the Pfr primary reaction of Agp1-BV in the fingerprint region as derived from a global fit.
The further discussion will make significant use of the shapes of the DAS, whose features can be compiled as follows (note that negative/positive amplitudes of the DAS represent absorbance strength, which increases/decreases with the respective time constants): A1 shows signals that appear within the system response time of the experiment, thus positive signals are interpreted as signals from the first states detectable by the experiment. The short-lived and broad absorption bands centered at ∼1740 cm−1, 1650 cm−1, and 1265 cm−1 are then likely to be caused by S1 vibrational modes that are formed rapidly after photoexcitation. The negative contributions in A1 at ∼1563 cm−1 and 1230 cm−1, together with its local minimum at ∼1697 cm−1, do not show any significant overlap with the ground-state bleach signals at 1710 cm−1, 1594 cm−1, and 1238 cm−1, but are systematically red-shifted. Furthermore, they show a systematic overlap with negative contributions of A2 and positive contributions of A3, suggesting that A1 and A2 represent processes that feed a state related to A3. In the context of the described systematics, it is plausible to regard the local minimum of A1 at 1697 cm−1 as a negative contribution in A1, in line with those at 1563 cm−1 and 1230 cm−1, since the broad positive S1-absorption in A1 can easily obscure negative bands.
On the other hand, the negative contributions of A3 coincide well with the most prominent ground-state bleach signals at 1710 cm−1, 1594 cm−1, and 1238 cm−1, in addition to further minor bleach signals at 1511 cm−1, 1277 cm−1, 1260 cm−1, and 1186 cm−1. Overall, A3 shows a shape that is typical for vibrational cooling, with negative contributions overlapping with ground-state absorption bands, and positive contributions that are systematically red-shifted and asymmetrically broadened to the red side of the spectrum. Such characteristic patterns have been observed with transient IR spectroscopy on azobenzene (41) and protonated Schiff base retinal in solution (42) and have been attributed to vibrational cooling in the electronic ground state. Similar processes have been reported for many molecular systems in the condensed phase (43). The time constant τ3 in our experiment complies with the time range found for electronic ground-state vibrational cooling in protein systems (24,34,44).
The A0 spectra of the global analysis of the infrared data represent the residual signals for virtually infinite delay time, and thus should show the difference spectra of lumi-F–Pfr. Although the low isomerization quantum yield (see below) hampers the identification of lumi-F in the A0 spectrum, qualitative agreement is found between the A0-carbonyl region and low-temperature FTIR difference spectra of PhyA-PΦB (9,10).
From the transient absorption experiments in the visible with probe wavelengths of 630, 655, 680, 705, 730, and 755 nm, two global time constants of τV1 = 0.44 ± 0.05 ps and τV2 = 3.3 ± 0.1 ps were derived. Singular-value decomposition analysis as well yields two time constants of 0.6 ps and 3.3 ps, in good agreement with the global fit results. The transients given in Fig. 5 show the recovery of the electronic ground-state bleach (λmax ≈ 750 nm), which is probed at 755 nm, and the decay of the S1 excited-state absorption, which is probed at 630 nm and which accompanies the ground-state bleach decay. It should be kept in mind that the Pfr state of Agp1-BV exhibits significant absorbance between 600 and 800 nm (28). The traces at both wavelengths show contributions from both detectable time constants τV1 and τV2, whereas the amplitude of τV2 is substantially larger for the recovery of the ground-state bleach compared to the excited-state absorption decay. The contribution of the τV2 component in the transient signal at 630 nm is considered due to ground-state processes (see below).
The relative amount of recovery of the initial ground-state bleach signals in the IR allows the determination of the isomerization quantum yield independently of a specific reaction scheme (24). For this purpose, the IR transients at 1710 cm−1, 1594 cm−1, and 1238 cm−1 were quantitatively evaluated. Their average bleach recovery suggests a quantum yield for lumi-F formation of ∼8%, which deviates from the reported value of 0.4% for the Pr formation (28). Note that the only scenario leading to an overestimation of the lumi-F quantum yield is an overlap of the (initial) bleach bands by short-lived absorption bands directly after photoexcitation. This can be excluded for all but the 1710 cm−1 bleach bands, and is thus very implausible to cause an error of one order of magnitude.
DISCUSSION
The analysis of the ultrafast data allows the construction of several reaction schemes for the primary processes, three of which (Schemes A–C, see Fig. 8) are taken into consideration, with Scheme C being discussed in more detail. In the following, τi and τVi are used as given above.
FIGURE 8.
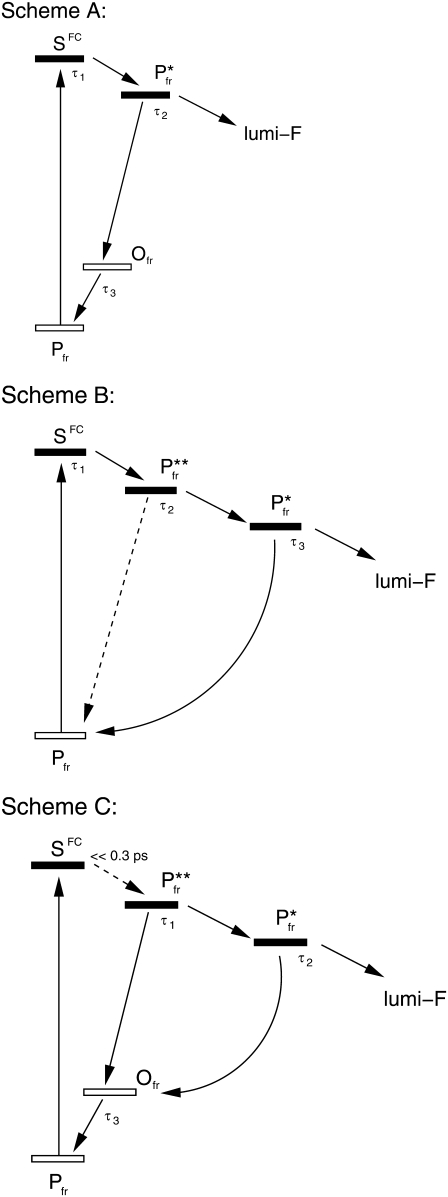
Reaction schemes for the Pfr primary reaction of Agp1-BV (see text). Solid bars denote excited electronic states, open bars denote electronic ground states.
Scheme A includes a structural relaxation from the Franck-Condon region to a S1-state Pfr* within τ1, where a branching occurs. The productive pathway of the branching leads directly to the first metastable photoproduct lumi-F, whereas the nonproductive part decays back to a vibrationally hot electronic ground-state Ofr, which repopulates the (cold) Pfr vibrational ground state. The decay of Pfr* is supposed to occur with a rate constant of 1/τ2 and the Ofr→Pfr transition with a rate of 1/τ3. This reaction scheme is compatible with the analysis of the infrared data in that the positive contributions in A3, which we attribute to a population of Ofr, always coincide spectrally with negative contributions from A1 and A2. Since the rate constants attributed to A1 and A2 are relatively similar, these two processes cannot be viewed as completely decoupled, hence the formation of Ofr shows kinetic contributions from the decay of SFC and Pfr*.
The deficiencies of Scheme A are twofold: Firstly, for the photoreaction to occur on an ultrafast timescale, one would assume the gradient of the S1 surface in the Franck-Condon region to be relatively large. This implies that the initial structural relaxation (not necessarily along the C15 = C16 torsional coordinate) occurs significantly faster than the system response time of the experiment and also faster than τ1. Secondly, the decay of the excited-state absorption as detected in the VIS-VIS experiment shows τV1 as dominant time constant, which is very close to τ1. Thus, we can assume τ1 to represent the dominant S1 decay process, which contradicts its interpretation as movement out of the Franck-Condon region.
Scheme B is considered as a sequential reaction on the S1 excited-state potential energy surface involving two S1 substates, Pfr** and Pfr*. From the Franck-Condon region, the reaction proceeds via Pfr** and Pfr*, with a branching to lumi-F and to the electronic ground-state Pfr (in its vibrational ground state) that occurs with the decay of Pfr*. Here, the time constants are assigned as follows: Relaxation from the Franck-Condon region with τ1, reaction from Pfr** to Pfr* with τ2, decay of Pfr* and formation of lumi-F and Pfr with τ3. An additional reaction path between Pfr** and Pfr cannot be excluded.
Scheme B not only suffers from the same deficiencies as described above for Scheme A. Additionally, it cannot be assumed in general that the decay of the excited electronic-state Pfr* leads directly to a (vibrationally) relaxed electronic ground state. For this unrelaxed ground state not to be traceable in the time-resolved infrared data, either its lifetime has to be small compared to τ3, or its vibrational spectrum has to coincide with that of Pfr* or of Pfr. However, the lifetime of the vibrationally excited electronic ground state can be estimated to ∼3–4 ps by comparison to the Pr reaction (24). Further, since the additional state is assumed to be structurally or vibrationally unrelaxed, its spectrum cannot coincide with that of Pfr, and a coincidence with the Pfr* vibrational spectrum seems far-fetched.
Scheme C accommodates our observations much better and avoids the difficulties of Schemes A and B. Here, the step from the Franck-Condon region to Pfr** is assumed to be much faster than the system response time of the experiment and thus undetectable. With the decay of Pfr**, a first branching occurs with reactions to Pfr* and to the vibrationally unrelaxed electronic ground-state Ofr. The time constant τ1 is assigned to the decay of Pfr**. Pfr*, with a lifetime of τ2, decays with a branching between the formation of the first metastable photoproduct lumi-F and the formation of a structurally unrelaxed form of the educt-state Pfr, subsumed with Ofr. Ofr reacts back to the vibrational ground-state Pfr, via vibrational cooling and structural relaxation within τ3. Since Ofr is populated from Pfr** and Pfr*, it is suggested to comprise vibrationally hot as well as structurally unrelaxed Pfr ground states that cannot be spectrally separated and share closely similar kinetics in their relaxation to Pfr.
It should be pointed out that the construction of the reaction schemes is based on the three time constants and the related DAS that were derived from the highly structured IR data. The two time constants of the VIS transients are nevertheless consistent with the dynamics described in Scheme C. Apparently the fit cannot distinguish between τ1 and τ2, but yields a weighted average τV1. This can be rationalized by the fact that the electronic absorption spectra are generally broad and unstructured, in contrast to vibrational spectra. Thus, the differences between the Pfr** and the Pfr* VIS spectra along with their similar lifetimes do not allow their separation into two kinetic components. The longer lifetime τV2 = 3.3 ps is in fair accordance with τ3 = 4.0 ps obtained in the IR. Following Scheme C, τV2 has then to be attributed to processes on the electronic ground-state surface: 1), the recovery of the vibrationally fully relaxed Pfr electronic ground state, monitored at 755 nm; and 2), the decay of the structurally unrelaxed fraction of Ofr, which is suggested to contribute significantly to the transient absorbance at 630 nm.
Similar time constants have been observed in previous VIS-VIS experiments on the Pfr form of PhyA-PΦB (17) (0.68 ps and 4.0 ps) and the Pfr form of Cph1-PCB (18) (0.54 ps and 3.2 ps). These results suggested a reaction with two consecutive steps, but no specific reaction schemes were presented. For PhyA-PΦB, it remained unclear whether the longer time constant describes an electronic ground- or excited-state process. Similarly, the Cph1-PCB data did not allow an unequivocal assignment of the kinetics to electronic ground- or excited-state dynamics.
So far in this discussion, photoinduced intramolecular processes as transitions between different electronic-state potential energy surfaces, and conformational changes as well as vibrational relaxation of the chromophore, have been addressed. In addition, intermolecular energy flow from the chromophore to the surrounding protein and finally to the buffer solution will lead to an increased temperature of the microscopic sample volume. Timescales for energy conduction and heat diffusion, respectively, through protein matrices, have been found to be on the timescale of our experiment, e.g., 7–20 ps for hemoglobin (45). One temperature effect could be a change in the absorption bands of the surrounding water, leading to a spectrally rather unspecific baseline shift. This was not observed in our experiments. Spectrally specific contributions could originate from heating of the protein backbone, which for bacteriorhodopsin have been shown to yield IR difference bands in the amide II region at ∼1550 cm−1 and (much smaller) in the amide I region (46). The difference signals for long times (A0 spectrum) do not give indications for such bands. Further spectrally specific changes at long delay times (e.g., 50 ps) could be due to the vibrational spectrum of the chromophore, having released its excess energy to the environment. However, the band shift induced by such a small temperature change (a few Kelvin) is negligible, considering the relatively low chromophore concentration (41,46). We therefore conclude that neither the determination of the quantum yield nor the observability of the lumi-F state are affected by a temperature effect.
The identification of A3 (and thus also of τ3) as a relaxation process of a vibrationally unrelaxed Pfr electronic ground state leads to the conclusion that the first metastable photoproduct, which we assume to be lumi-F, can only be populated from the longest living electronic excited-state Pfr*, which decays within τ2 = 1.3 ps. Considering the low quantum yield of the lumi-F formation, the fact that the cooling process is readily observed strongly suggests it to be part of the nonproductive pathway. Thus, an involvement of τ3 in the isomerization reaction is very unlikely. Although the low quantum yield does not allow the detection of lumi-F product bands, this suggests the E-Z isomerization to occur along the excited-state reaction pathway, with an upper limit for the isomerization time of τ2 = 1.3 ps. A stepwise isomerization via a ground-state reaction is implausible, since time-resolved experiments on the Pfr state of other phytochromes (17,18) with higher isomerization quantum yields were also unable to detect spectral changes beyond the order of magnitude of τ3.
The isomerization quantum yield of the Pfr primary reaction, as derived here via the primary recovery of the Pfr educt-state, is very similar to that of the Pr reaction (24). In contrast to the Pr reaction, where the yield of the primary reaction (lumi-R formation) was found to be equal to that of the Pfr formation (28), the corresponding values of the Pfr reaction differ in more than one order of magnitude, i.e., 8% vs. 0.4%. This suggests the possibility of a short-cut reaction originating in an intermediate state along the Pfr→Pr reaction path and leading back to the Pfr form. In consequence, this dark reaction would have to include a thermally driven Z-E isomerization. Double-bond isomerizations of free chromophores often require the energy of an absorbed photon (47,48). Thus, such a short-cut reaction was unexpected. However, dark conversion of, e.g., bacteriorhodopsin (49), PYP (50), or phytochromes (28) are examples for thermally driven isomerization reactions that take place within the protein environment. The dark conversion of Agrobacterium phytochrome Agp2 and some other bacterial phytochromes proceeds from Pr to Pfr (51,52). These examples show that also a Z→E dark isomerization around the C15 = C16 double bond of the bilin chromophore is not impossible. This study suggests that such a dark isomerization is an integral part of the Agp1 photocycle. It seems that Agp1 is an exception in this respect, because the overall quantum yield of the Pfr-to-Pr conversion of other phytochromes is >10% and thus in the range of the Pfr to lumi-F quantum yield estimated here (28). The rather complex Pfr-to-Pr reaction of Agp1 is thus most likely the consequence of an evolutionary process which finally resulted in the rather low Pfr-to-Pr quantum yield of this phytochrome.
Comparison of reaction Scheme C of the Pfr primary reaction (Fig. 8) with the scheme of the Pr primary reaction (24) yields close similarities. The schemes for both reactions are basically identical, with the only difference in the values of the time constants. The decay of the first structurally relaxed excited electronic-state, Pfr** in the Pfr scheme and A in the Pr scheme, with 0.3 and 0.7 ps, respectively, and the relaxation on the electronic ground state, i.e., the decay of Ofr and Or, with 4.0 and 3.3 ps, respectively, show very similar time constants. In contrast, the lifetime of the longest-lived S1 species differs significantly from 1.3 ps in the Pfr reaction to 33.3 ps in the Pr reaction. The very short S1 lifetime in the Pfr reaction is consistent with the vanishingly small fluorescence quantum yield of the Pfr reaction as compared to the Pr reaction (26). Note that the similarity of the reaction schemes for Pr and Pfr implies in turn specific similarities of the two sets of DAS—Ai (Pr) (24) and Ai (Pfr). In fact, qualitative match is found concerning their sign and relative spectral position. Observed differences, e.g., in terms of spectral width and absolute spectral position are not unexpected, since both reactions originate from different chromophore configurations and thus exhibit different ground- and excited-state vibrational spectra.
The observation of a slow Pr reaction and a fast Pfr reaction in Agp1-BV is in line with earlier results on the primary photoreactions of different phytochromes (16–18). Similarly distinct timescales for the forward- and backward-direction of cis-trans isomerizations have been found in the photochemistry of stilbene and azobenzene. In azobenzene, the isomerization processes are completed within 10 ps for the trans-cis and within 1 ps for the cis-trans direction (53). In stilbene, the cis-trans isomerization takes <1 ps and the trans-cis isomerization >10 ps, dependent on the solvent (54). The asymmetry of the reaction kinetics with respect to the initial configuration reflects the differently shaped regions of the excited-state potential energy surfaces that are accessed upon photoexcitation of the respective cis- or trans-state. Certainly, fundamental aspects of cis-trans photoisomerization already discussed for stilbene and azobenzene in solution can be applied to bilin chromophores in a protein environment. However, the example of retinal proteins (55,56) demonstrates how drastically the specific properties of the strongly anisotropic environment realized by the protein moiety can alter the photoinduced isomerization kinetics of a protein-bound chromophore.
In conclusion, femtosecond IR spectroscopy has brought forward a new and more specified reaction scheme of the Pfr photoisomerization of Agp1-BV. Whether or not a unique reaction scheme applies to the Pfr reaction of many phytochromes, if not of phytochromes in general, is up to future studies.
Acknowledgments
The authors thank Peter Hildebrandt and Maria Andrea Mroginski for helpful discussion.
C.S., M.M.N.W., and R.D. acknowledge support by Deutsche Forschungsgemeinschaft, Forschungsschwerpunkt “Optische Technologien und lasergesteuerte Prozesse” Rheinland-Pfalz, and Stiftung Rheinland-Pfalz für Innovation. R.G. was supported by Deutsche Forschungsgemeinschaft Graduiertenkolleg grant No. 792, and T.L. and N.M. by Deutsche Forschungsgemeinschaft grant No. Sfb 498, B2.
Tilman Lamparter's present address is Universität Karlsruhe, Botanik 1, D-76128 Karlsruhe, Germany.
Editor: Feng Gai.
References
- 1.Lamparter, T. 2004. Evolution of cyanobacterial and plant phytochromes. FEBS Lett. 573:1–5. [DOI] [PubMed] [Google Scholar]
- 2.Rockwell, N. C., Y.-S. Su, and J. C. Lagarias. 2006. Phytochrome structure and signaling mechanisms. Annu. Rev. Plant Biol. 57:837–858. [DOI] [PMC free article] [PubMed] [Google Scholar]
- 3.Wagner, J. R., J. S. Brunzelle, K. T. Forest, and R. D. Vierstra. 2005. A light-sensing knot revealed by the structure of the chromophore-binding domain of phytochrome. Nature. 438:325–331. [DOI] [PubMed] [Google Scholar]
- 4.Wagner, J. R., J. Zhang, J. S. Brunzelle, R. D. Vierstra, and K. T. Forest. 2007. High resolution structure of Deinococcus bacteriophytochrome yields new insights into phytochrome architecture and evolution. J. Biol. Chem. 282:12298–12309. [DOI] [PubMed] [Google Scholar]
- 5.Yang, X., E. A. Stojkovic, J. Kuk, and K. Moffat. 2007. Crystal structure of the chromophore binding domain of an unusual bacteriophytochrome, RpBphP3, reveals residues that modulate photoconversion. Proc. Natl. Acad. Sci. USA. 104:12571–12576. [DOI] [PMC free article] [PubMed] [Google Scholar]
- 6.Rüdiger, W., F. Thümmler, E. Cmiel, and S. Schneider. 1983. Chromophore structure of the physiologically active form (Pfr) of phytochrome. Proc. Natl. Acad. Sci. USA. 80:6244–6248. [DOI] [PMC free article] [PubMed] [Google Scholar]
- 7.Mroginski, M. A., D. H. Murgida, D. von Stetten, C. Kneip, F. Mark, and P. Hildebrandt. 2004. Determination of the chromophore structures in the photoinduced reaction cycle of phytochrome. J. Am. Chem. Soc. 126:16734–16735. [DOI] [PubMed] [Google Scholar]
- 8.Eilfeld, P., and W. Rüdiger. 2007. Absorption spectra of phytochrome intermediates. Z. Naturforsch. [C]. 40:109–114. [Google Scholar]
- 9.Foerstendorf, H., E. Mummert, E. Schäfer, H. Scheer, and F. Siebert. 1996. Fourier-transform infrared spectroscopy of phytochrome: difference spectra of the intermediates of the photoreactions. Biochemistry. 35:10793–10799. [DOI] [PubMed] [Google Scholar]
- 10.Foerstendorf, H., C. Benda, W. Gärtner, M. Storf, H. Scheer, and F. Siebert. 2001. FTIR studies of phytochrome photoreactions reveal the C=O bands of the chromophore: consequences for its protonations states, conformation, and protein interaction. Biochemistry. 40:14952–14959. [DOI] [PubMed] [Google Scholar]
- 11.Matysik, J., P. Hildebrandt, W. Schlamann, S. E. Braslavsky, and K. Schaffner. 1995. Fourier-transform resonance Raman spectroscopy of intermediates of the phytochrome photocycle. Biochemistry. 34:10497–10507. [DOI] [PubMed] [Google Scholar]
- 12.Andel III, F., J. C. Lagarias, and R. A. Mathies. 1996. Resonance Raman analysis of chromophore structure in the lumi-R photoproduct of phytochrome. Biochemistry. 35:15997–16008. [DOI] [PubMed] [Google Scholar]
- 13.Kneip, C., D. Mozley, P. Hildebrandt, W. Gärtner, S. E. Braslavsky, and K. Schaffner. 1997. Effect of chromophore exchange on the resonance Raman spectra of recombinant phytochromes. FEBS Lett. 414:23–26. [DOI] [PubMed] [Google Scholar]
- 14.Remberg, A., I. Lindner, T. Lamparter, J. Hughes, C. Kneip, P. Hildebrandt, S. E. Braslavsky, W. Gärtner, and K. Schaffner. 1997. Raman-spectroscopic and light-induced kinetic characterization of a recombinant phytochrome of the cyanobacterium Synechocystis. Biochemistry. 36:13389–13395. [DOI] [PubMed] [Google Scholar]
- 15.von Stetten, D., S. Seibeck, N. Michael, P. Scheerer, M. A. Mroginski, D. H. Murgida, N. Krauss, M. P. Heyn, P. Hildebrandt, B. Borucki, and T. Lamparter. 2007. Highly conserved residues Asp-197 and His-250 in Agp1 phytochrome control the proton affinity of the chromophore and Pfr formation. J. Biol. Chem. 282:2116–2123. [DOI] [PubMed] [Google Scholar]
- 16.Bischoff, M., G. Hermann, S. Rentsch, and D. Strehlow. 1998. Ultrashort processes of native phytochrome: femtosecond kinetics of the far-red-absorbing form Pfr. J. Phys. Chem. A. 102:4399–4404. [Google Scholar]
- 17.Bischoff, M., G. Hermann, S. Rentsch, and D. Strehlow. 2001. First steps in the phytochrome phototransformation: a comparative femtosecond study on the forward (Pr→Pfr) and back reaction (Pfr→Pr). Biochemistry. 40:181–186. [DOI] [PubMed] [Google Scholar]
- 18.Heyne, K., J. Herbst, D. Stehlik, B. Esteban, T. Lamparter, J. Hughes, and R. Diller. 2002. Ultrafast dynamics of phytochrome from the cyanobacterium Synechocystis, reconstituted with phycocyanobilin and phycoerythrobilin. Biophys. J. 82:1004–1016. [DOI] [PMC free article] [PubMed] [Google Scholar]
- 19.Kandori, H., K. Yoshihara, and S. Tokutomi. 1992. Primary process of phytochrome: initial step of photomorphogenesis in green plants. J. Am. Chem. Soc. 114:10958–10959. [Google Scholar]
- 20.Bischoff, M., G. Hermann, S. Rentsch, D. Strehlow, S. Winter, and H. Chosrowjan. 2000. Excited-state processes in phycocyanobilin studied by femtosecond spectroscopy. J. Phys. Chem. B. 104:1810–1816. [Google Scholar]
- 21.Rentsch, S., M. Bischoff, G. Hermann, and D. Strehlow. 1998. Fs spectroscopic studies of the plant photoreceptor phytochrome. Appl. Phys. B. 66:259–261. [Google Scholar]
- 22.Andel III, F., K. C. Hasson, F. Gai, P. A. Anfinrud, and R. A. Mathies. 1997. Femtosecond time-resolved spectroscopy of the primary photochemistry of phytochrome. Biospectroscopy. 3:421–433. [Google Scholar]
- 23.van Thor, J. J., K. L. Ronayne, and M. Towrie. 2007. Formation of the early photoproduct lumi-R of cyanobacterial phytochrome Cph1 observed by ultrafast mid-infrared spectroscopy. J. Am. Chem. Soc. 129:126–132. [DOI] [PubMed] [Google Scholar]
- 24.Schumann, C., R. Groß, N. Michael, T. Lamparter, and R. Diller. 2007. Sub-Picosecond mid-infrared spectroscopy of phytochrome Agp1 from Agrobacterium tumefaciens. ChemPhysChem. 11:1657–1663. [DOI] [PubMed] [Google Scholar]
- 25.Holzwarth, A. R., J. Wendler, B. P. Ruzsicska, S. E. Braslavsky, and K. Schaffner. 1984. Picosecond time-resolved and stationary fluorescence of oat phytochrome highly enriched in the native 124 kDa Protein. Biochim. Biophys. Acta. 791:265–273. [Google Scholar]
- 26.Wendler, J., A. R. Holzwarth, S. E. Braslavsky, and K. Schaffner. 1984. Wavelength-resolved fluorescence decay and fluorescence quantum yield of large phytochrome from oat shoots. Biochim. Biophys. Acta. 786:213–221. [Google Scholar]
- 27.Holzwarth, A. R., E. Venuti, S. E. Braslavsky, and K. Schaffner. 1992. The phototransformation process in phytochrome: I. Ultrafast fluorescence component and kinetic models for the initial Pr→Pfr transformation steps in native phytochrome. Biochim. Biophys. Acta. 1140:59–68. [Google Scholar]
- 28.Lamparter, T., N. Michael, F. Mittmann, and B. Esteban. 2002. Phytochrome from Agrobacterium tumefaciens has unusual spectral properties and reveals an N-terminal chromophore attachment site. Proc. Natl. Acad. Sci. USA. 99:11628–11633. [DOI] [PMC free article] [PubMed] [Google Scholar]
- 29.Lamparter, T., M. Carrascal, N. Michael, E. Martinez, G. Rottwinkel, and J. Abian. 2004. The biliverdin chromophore binds covalently to a conserved cysteine residue in the N-terminus of Agrobacterium phytochrome Agp1. Biochemistry. 43:3659–3669. [DOI] [PubMed] [Google Scholar]
- 30.Borucki, B., D. v. Stetten, S. Seibeck, T. Lamparter, N. Michael, M. A. Mroginski, H. Otto, D. H. Murgida, M. P. Heyn, and P. Hildebrandt. 2005. Light-induced proton release of phytochrome is coupled to the transient deprotonation of the tetrapyrrole chromophore. J. Biol. Chem. 280:34358–34364. [DOI] [PubMed] [Google Scholar]
- 31.Inomata, K., M. A. S. Hammam, H. Kinoshita, Y. Murata, H. Khawn, S. Noack, N. Michael, and T. Lamparter. 2005. Sterically locked synthetic bilin derivates and phytochrome Agp1 from Agrobacterium tumefaciens form photoinsensitive Pr- and Pfr-like adducts. J. Biol. Chem. 280:24491–24497. [DOI] [PubMed] [Google Scholar]
- 32.Inomata, K., S. Noack, M. A. S. Hammam, H. Khawn, H. Kinoshita, Y. Murata, N. Michael, P. Scheerer, N. Krauss, and T. Lamparter. 2006. Assembly of synthetic locked chromophores with Agrobacterium phytochromes Agp1 and Agp2. J. Biol. Chem. 281:28162–28173. [DOI] [PubMed] [Google Scholar]
- 33.Reference deleted in proof.
- 34.Herbst, J., K. Heyne, and R. Diller. 2002. Femtosecond infrared spectroscopy of bacteriorhodopsin chromophore isomerization. Science. 297:822–825. [DOI] [PubMed] [Google Scholar]
- 35.Diller, R., R. Jakober, C. Schumann, F. Peters, J. P. Klare, and M. Engelhard. 2006. The trans-cis isomerization reaction dynamics in sensory rhodopsin II by femtosecond time-resolved midinfrared spectroscopy: chromophore and protein dynamics. Biopolymers. 82:358–362. [DOI] [PubMed] [Google Scholar]
- 36.Peters, F., J. Herbst, J. Tittor, D. Oesterhelt, and R. Diller. 2006. Primary reaction dynamics of halorhodopsin, observed by sub-picosecond IR-vibrational spectroscopy. Chem. Phys. 323:109–116. [Google Scholar]
- 37.Lochbrunner, S., P. Huppmann, and E. Riedle. 2000. Cross-correlation measurements of ultrashort visible pulses: comparison between nonlinear crystals and SiC photodiodes. Opt. Commun. 184:321–328. [Google Scholar]
- 38.Frisch, M. J., G. W. Trucks, H. B. Schlegel, G. E. Scuseria, M. A. Robb, J. R. Cheeseman, J. A. Montgomery, Jr., T. Vreven, K. N. Kudin, J. C. Burant, J. M. Millam, S. S. Iyengar, J. Tomasi, V. Barone, B. Mennucci, M. Cossi, G. Scalmani, N. Rega, G. A. Petersson, H. Nakatsuji, M. Hada, M. Ehara, K. Toyota, R. Fukuda, J. Hasegawa, M. Ishida, T. Nakajima, Y. Honda, O. Kitao, H. Nakai, M. Klene, X. Li, J. E. Knox, H. P. Hratchian, J. B. Cross, V. Bakken, C. Adamo, J. Jaramillo, R. Gomperts, R. E. Stratmann, O. Yazyev, A. J. Austin, R. Cammi, C. Pomelli, J. W. Ochterski, P. Y. Ayala, K. Morokuma, G. A. Voth, P. Salvador, J. J. Dannenberg, V. G. Zakrzewski, S. Dapprich, A. D. Daniels, M. C. Strain, O. Farkas, D. K. Malick, A. D. Rabuck, K. Raghavachari, J. B. Foresman, J. V. Ortiz, Q. Cui, A. G. Baboul, S. Clifford, J. Cioslowski, B. B. Stefanov, G. Liu, A. Liashenko, P. Piskorz, I. Komaromi, R. L. Martin, D. J. Fox, T. Keith, M. A. Al-Laham, C. Y. Peng, A. Nanayakkara, M. Challacombe, P. M. W. Gill, B. Johnson, W. Chen, M. W. Wong, C. Gonzalez, and J. A. Pople. 2004. Gaussian 03, Rev. C02. Gaussian, Wallingford, CT.
- 39.Wong, M. W. 1996. Vibrational frequency prediction using density functional theory. Chem. Phys. Lett. 256:391–399. [Google Scholar]
- 40.van Thor, J. J., N. Fisher, and P. R. Rich. 2005. Assignments of the Pfr-Pr FTIR difference spectrum of cyanobacteria phytochrome Cph1 using 15N and 13C isotopically labeled phycocyanobilin chromophore. J. Phys. Chem. B. 109:20597–20604. [DOI] [PubMed] [Google Scholar]
- 41.Hamm, P., S. M. Ohline, and W. Zinth. 1997. Vibrational cooling after ultrafast photoisomerization of azobenzene measured by femtosecond infrared spectroscopy. J. Chem. Phys. 106:519–529. [Google Scholar]
- 42.Hamm, P., M. Zurek, T. Roschinger, H. Patzelt, D. Oesterhelt, and W. Zinth. 1997. Subpicosecond infrared spectroscopy on the photoisomerization of the protonated Schiff base of all-trans retinal. Chem. Phys. Lett. 268:180–186. [Google Scholar]
- 43.Owrutsky, J., D. Raftery, and R. Hochstrasser. 1994. Vibrational relaxation dynamics in solutions. Annu. Rev. Phys. Chem. 45:519–555. [DOI] [PubMed] [Google Scholar]
- 44.Kim, J. E., and R. A. Mathies. 2002. Anti-Stokes Raman study of vibrational cooling dynamics in the primary photochemistry of rhodopsin. J. Phys. Chem. A. 106:8508–8515. [DOI] [PMC free article] [PubMed] [Google Scholar]
- 45.Lian, T., B. Locke, Y. Kholodenko, and R. Hochstrasser. 1994. Energy flow from solute to solvent probed by femtosecond IR spectroscopy: malachite green and heme protein solutions. J. Phys. Chem. 98:11648–11656. [Google Scholar]
- 46.Rödig, C., H. Georg, F. Siebert, I. Rousso, and M. Sheves. 1999. Temperature effects of excitation laser pulses during step-scan FTIR measurements. Laser Chem. 19:169–172. [Google Scholar]
- 47.Rentsch, S., G. Hermann, M. Bischoff, D. Strehlow, and M. Rentsch. 1997. Femtosecond spectroscopic studies on the red light-absorbing form of oat phytochrome and 2,3-dihydrobiliverdin. Photochem. Photobiol. 66:585–590. [Google Scholar]
- 48.Lamparter, T., and N. Michael. 2005. Agrobacterium phytochrome as an enzyme for the production of ZZE bilins. Biochemistry. 44:8461–8469. [DOI] [PubMed] [Google Scholar]
- 49.Oesterhelt, D., and J. Tittor. 1989. Two pumps, one principle: light-driven ion transport in Halobacteria. Trends Biochem. Sci. 14:57–61. [DOI] [PubMed] [Google Scholar]
- 50.Meyer, T. E., S. Devanathan, T. Woo, E. D. Getzoff, G. Tollin, and M. A. Cusanovich. 2003. Site-specific mutations provide new insights into the origin of pH effects and alternative spectral forms in the photoactive yellow protein from Halorhodospira halophila. Biochemistry. 42:3319–3325. [DOI] [PubMed] [Google Scholar]
- 51.Giraud, E., J. Fardoux, N. Fourrier, L. Hannibal, B. Genty, P. Bouyer, B. Dreyfus, and A. Vermeglio. 2002. Bacteriophytochrome controls photosystem synthesis in anoxygenic bacteria. Nature. 417:202–205. [DOI] [PubMed] [Google Scholar]
- 52.Karniol, B., and R. Vierstra. 2003. The pair of bacteriophytochromes from Agrobacterium tumefaciens are histidine kinases with opposing photobiological properties. Proc. Natl. Acad. Sci. USA. 100:2807–2812. [DOI] [PMC free article] [PubMed] [Google Scholar]
- 53.Satzger, H., C. Root, C. Renner, R. Behrendt, L. Moroder, J. Wachtveitl, and W. Zinth. 2004. Picosecond dynamics in water-soluble azobenzene-peptides. Chem. Phys. Lett. 396:191–197. [Google Scholar]
- 54.Sension, R., S. Repinec, A. Szarka, and R. Hochstrasser. 1993. Femtosecond laser studies of the cis-stilbene photoisomerization reactions. J. Chem. Phys. 98:6291–6315. [Google Scholar]
- 55.Song, L., M. El-Sayed, and J. Lanyi. 1993. Protein catalysis of the retinal subpicosecond photoisomerization in the primary process of bacteriorhodopsin photosynthesis. Science. 261:891–894. [DOI] [PubMed] [Google Scholar]
- 56.Heyne, K., J. Herbst, B. Dominguez-Herradon, U. Alexiev, and R. Diller. 2000. Reaction control in bacteriorhodopsin: impact of Arg82 and Asp85 on the fast retinal isomerization, studied in the second site revertant Arg82Ala/Gly231Cys and various purple and blue forms of bacteriorhodopsin. J. Phys. Chem. B. 104:6053–6058. [Google Scholar]
- 57.Hamm, P. 1995. Coherent effects in femtosecond infrared spectroscopy. Chem. Phys. 200:415–429. [Google Scholar]
- 58.Kovalenko, S. A., A. L. Dobryakov, J. Ruthmann, and N. P. Ernsting. 1999. Femtosecond spectroscopy of condensed phases with chirped supercontinuum probing. Phys. Rev. A. 59:2369–2384. [Google Scholar]


