

Abstract
Analysis of nucleotide diversity within six species of circovirus showed consistently stronger purifying selection at nonsynonymous sites in the rep gene than on those in the cap gene. In addition, synonymous nucleotide diversity in the rep gene was significantly lower than that in the cap gene, suggesting functional constraint even at synonymous sites in rep, which was associated in all six species with strongly negative AT-skew. Of the six virus species examined, four species showed evidence of ongoing purifying selection at nonsynonymous polymorphic sites in the rep gene, indicating the presence of slightly deterious nonsynonymous variants in these populations. The rep gene of porcine circovirus 2 (PCV2) was unique, however, in showing a strong excess of rare nonsynonymous polymorphisms. The excess of rare nonsynonymous polymorphisms suggests a prolonged population bottleneck in PCV2, allowing slightly deleterious mutations to accumulate, followed by a population expansion during which selection to remove these variants has increased in effectiveness. Such a population history is consistent with the epidemiological evidence of a recent worldwide spread of PCV2.
1. Introduction
The circoviruses are a family of viruses with a circular, single-stranded DNA genome, members of which have been found to infect a number of species of birds and mammals. The circovirus genome is remarkably compact, typically including just two major genes: rep (encoding the replicase protein) and cap (encoding the capsid protein). However, a number of alternative products of the rep reading frame have been reported (Mankert and Hillenbrand 2001; Cheung 2003a, -b, -c). There are two closely related circoviruses infecting pigs, porcine circovirus 1 (PCV1) and porcine circovirus 2 (PCV2). PCV1 was first discovered as a contaminant of cultured pig kidney cell line (Allan and Ellis 2000). PCV1 is non-pathogenic, and is believed to be widespread among pigs worldwide. PCV2, on the other hand, is an emerging virus of pigs that is associated with certain disease syndromes, especially postweaning multisystemic wasting syndrome (PMWS), characterized by wasting, dyspnea, and enlarged lymph nodes in pigs around 5–12 weeks of age (Allan and Ellis 2000). While PCV2 appears to be necessary for the appearance of PMWS, it is apparently not sufficient; and infection with other viruses may be required for full development of the syndrome. PMWS was first identified in Western Canada in 1991 and was subsequently reported elsewhere in North America and in Europe, leading to the hypothesis that the spread of PCV2 has been recent (Meehan et al. 1998).
Because of the close relationship between PCV1 and PCV2, comparison of these viruses can potentially provide insights into the evolutionary origin of PCV2 and the molecular basis of pathogenesis, including the role of natural selection (Olvera et al. 2007). Natural selection is an important factor in understanding genomic evolution, including both positive selection (favoring adaptive mutations) and purifying selection (acting to eliminate deleterious mutations; Hughes 1999). Viruses have provided some of the best-documented examples of positive Darwinian selection at the DNA sequence level, particularly selection exerted by the host immune system favoring the evasion of immune recognition (Allen et al. 2000; Evans et al. 1999; Fitch et al. 1991; Hughes et al. 2005; O’Connor et al. 2004; Moore et al. 2002; Seibert et al. 1995). However, as is the case with cellular organisms, the predominant form of natural selection on viral genomes is purifying selection (Hughes 2007a; Hughes and Hughes 2005; Hughes et al. 2007; Jerzak et al. 2005; Nei 1983; Pybus et al. 2007; Saitou and Nei 1986; Suzuki and Gojobori 1997). Because purifying selection acts most strongly on genomic regions that are functionally important, the patterns of purifying selection can be used to identify regions that are least likely to change over the course of evolution. In the case of viruses, knowledge of evolutionarily conserved regions can aid in the design of vaccines and other therapeutic agents because it can help predict the likelihood of evolution of resistant viral genotyes (Brown et al. 2007; Haydon et al. 2001; Slobod et al. 2005; Storgaard et al. 1999).
The strongest evidence for the predominance of purifying selection is the observation that the number of synonymous nucleotide substitutions per synonymous site (dS) substantially exceeds the number of nonsynonymous substitutions per nonsynonymous site (dN) in most genes (Kimura 1977), a pattern observed in viruses as in cellular organisms (Saitou and Nei 1986). This pattern occurs because most nonsynonymous mutations are disruptive to protein structure and thus tend to be eliminated by purifying selection (Kimura 1977). A strongly deleterious mutation may be eliminated immediately; for example, if the mutation has a lethal effect. However, the effectiveness of purifying selection on slightly deleterious mutations depends on the effective population size, being more effective in larger populations (Ohta 1973, 1976, 2002).
During a population bottleneck, slightly deleterious mutations can drift to relatively high frequencies and may even become fixed. A characteristic signature of a species that has undergone expansion following a prolonged bottleneck is an excess of rare nonsynonymous polymorphic variants that show evidence of ongoing purifying selection (Hughes et al. 2003; Hughes and Hughes 2007). These rare nonsynonymous variants represent slightly deleterious mutations that drifted to relatively high frequencies during the bottleneck, when selection against them was ineffective. As the population expands, selection against such slightly deleterious variants becomes increasingly effective, leading to a reduction in allelic frequencies.
Here we analyze nucleotide sequence polymorphism within six circovirus species in order to examine in a comparative framework the patterns of natural selection on the two major protein-coding genes and on intergenic regions. Using an extensive sample of complete genome sequences of PCV2, we analyze the patterns of synonymous and nonsynonymous polymorphism in order to test the hypothesis that this virus has undergone a rapid population expansion following a prolonged bottleneck. We also tested for the role of additional factors, such as nucleotide content and the coding of alternative products (in the case of rep), in accounting for patterns of sequence conservation.
2. Methods
2.1. Alignment and Phylogenetic Analysis
The complete genomes of the following six virus species were obtained from the NCBI data base: beak and feathers disease virus (BFDV), 21 genomes; columbid circovirus (CoCV), 5 genomes; goose circovirus (GCV), 23 genomes; muscovy duck circovirus (MuDCV), 6 genomes; porcine circovirus 1 (PCV1), 22 genomes; and porcine circovirus 2 (PCV1), 215 genomes. For accession numbers of the sequences, see Supplementary Figure S1. Only genomes with full rep and cap open reading frames were used. Within each of the six viral species, noncoding and coding regions were aligned using the CLUSTAL X program (Thompson et al. 1997). Coding sequences were aligned at the amino acid level and the alignment imposed on the DNA sequence. In all pairwise comparisons among a set of sequences, any site at which the alignment postulated a gap in any of the sequences compared was excluded from all pairwise comparisons.
The Rep protein of circoviruses shows homology to that of the nanoviruses (Niagro et al. 1998; Hughes 2004); therefore, the amino acid sequences of the Rep protein were aligned with a Rep protein sequence from banana bunchy top virus (BBTV), which was used as an outgroup to root a phylogenetic tree of Rep sequences (Supplementary Figure S1). Phylogenetic trees were also constructed from nucleotide sequences of both rep and cap genes of the closely related species PCV1 and PCV2. The following methods were used for phylogenetic reconstruction: (1) the neighbor-joining (NJ) method (Saitou and Nei 1987); (2) and the Bayesian method (Huelsenbeck and Ronquist 2001). The NJ trees of amino acid sequences was constructed on the basis of the equal-input model (Kumar et al. 2004). The Bayesian tree of amino acid sequences was reconstructed using the JTT + Γ model, which allows for rate variation among sites (Rodriguez et al. 1990). All parameters were estimated from the data. Four chains were run for 2,500,000 generations, and trees were sampled every 100 generations. Bayesian posterior probabilities were inferred from the last 5000 sampled trees. The reliability of branching patterns in MP and NJ trees was estimated by bootstrapping (Felsenstein 1985); 1000 bootstrap pseudo-samples were used. The rep and cap sequences of the common ancestor of the 215 PCV2 genomes were reconstructed by the maximum parsimony method on the basis of NJ trees using PCV1 sequences as an outgroup.
2.2. Nucleotide Sequence Diversity
The number of synonymous substitutions per synonymous site and the number of nonsynonymous substitutions per nonsynonymous site were estimated by Nei and Gojobori’s (1986) method, using the MEGA2 software (Kumar et al. 2001). Within each of the six virus species, the mean for all pairwise comparisons of the number of synonymous substitutions per synonymous site provided an estimate of nucleotide diversity at synonymous sites (πS); and the mean for all pairwise comparisons of the number of nonsynonymous substitutions per nonsynonymous site provided an estimate of nucleotide diversity at synonymous sites (πN) (Nei and Kumar 2000). The number of nucleotide substitutions per site (d) in non-coding regions was estimated by Jukes and Cantor’s model; the nucleotide diversity (π) in non-coding regions within each virus species was estimated by the mean of d in all pairwise comparisons. Standard errors of πS, πN, and π were estimated by the bootstrap method, which takes into account the non-independence of pairwise comparisons (Nei and Kumar 2000); and z-tests were used to test equality of nucleotide diversities in different genomic regions. In preliminary analyses, more complicated methods for estimating d, dS, and dN yielded essentially identical results, as has been found in other studies when the number of substitutions per site is small (Hughes and French 2007), as in the present data.
In the case of rep genes of PCV1 and PCV2, we estimated πS and πN separately for three regions of the genome (Figure 1), defined on the basis of the two major alternative transcripts rep and rep′, respectively encoding the proteins Rep and Rep′ (Mankertz and Hillenbrand 2001; Cheung 2003b): (1) the 5′ region which is included in both the rep and rep′ transcripts of PCV1 (nucleotides 1-357 of rep in PCV1); (2) the intron region, which is spliced out the rep’ transcript (nucleotides 358-738 of rep in PCV1); and (3) the 3′ region, which is read in an alternative reading frame in rep’ from that used in rep (nucleotides 739-939 of rep in PCV1). The minor alternative transcripts (rep3a, rep3b, and four rep3c variants) use the same start and stop codons as rep and the same reading frame but splice out differing portions of the coding sequence (Cheung 2003a, -b). There are also RNAs (NS462 and NS642) transcribed from regions overlapping the rep ORF but apparently not encoding functional proteins. NS0 apparently encodes a very short (23 a.a.) protein in an alternate reading frame overlapping the 3′end of the rep ORF.
Figure 1.
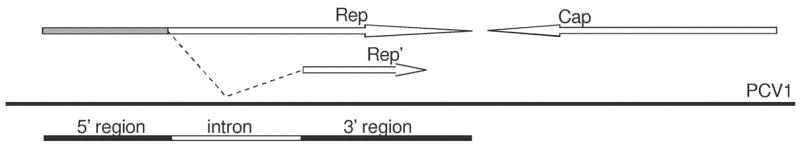
Schematic map of the PCV1 genome (not to scale) that shows overlapping frames of rep and rep′ (after Mankertz and Hillenbrand 2001). Shaded area of rep represents shared 5′ region that is included in both rep and rep′ transcripts. The three genomic regions analyzed were as follows: 5′ region (nucleotides 1-357 of rep in PCV1), intron (nucleotides 358-738 of rep in PCV1) and 3′ region (nucleotides 739-939 of rep in PCV1).
To examine nucleotide content in coding regions, we measured the percent G + C at third codon positions (GC3) and AT-skew, defined as (A − T)/(A+T), at third codon positions. Other measures of nucleotide content were used in preliminary analyses but did not reveal consistent patterns (not shown).
Within each virus species, gene diversity (Nei 1987, p. 177) was estimated separately at each synonymous and nonsynonymous polymorphic site, as in Hughes et al. (2003); where xi is the frequency of the ith allele (nucleotide) at a given locus (site), the gene diversity is 1 − Σxi2. Polymorphic sites were classified as synonymous or nonsynonymous, based on the coding effect of the nucleotide change. There were certain sites that could not be so classified (ambiguous sites), either because both synonymous and nonsynonymous variants occurred at the same site or because, given polymorphic sites within a single codon, the coding effect of a given substitution depended on the pathway taken by evolution. Ambiguous sites constituted 222 of 1993 polymorphic sites (11.2%) in the two major ORFs in the six virus species; these sites were therefore excluded from analyses of gene diversity at individual polymorphic sites.
In order to examine the relative frequency of rare alleles at synonymous and nonsynonymous sites, we compared the average number of nucleotide differences and the number of segregating sites (Tajima 1989) separately for synonymous and nonsynonymous polymorphic sites (Rand and Kann 1996; Hughes 2005; Hughes and Hughes 2007). Excluding ambiguous sites, the following quantities were computed: ks, the mean number of synonymous nucleotide differences for all pairwise comparisons among n allelic sequences; kn, the mean number of nonsynonymous nucleotide differences for all pairwise comparisons among n allelic sequences; S*s, the number of synonymous segregating sites, adjusted for sample size; and S*n, the number of nonsynonymous segregating sites, adjusted for sample size. The adjustment for sample size involves dividing the number of segregating sites by the sum from i = 1 to n − 1 of 1/I (Tajima 1989). The difference between the average number of nucleotide differences and the number of segregating sites is the numerator of Tajima’s (1989) D statistic.
In statistical analyses we used robust methods that avoid the statistically undesirable properties of model-dependence (Hughes et al. 2006). Because gene diversity at polymorphic sites was not normally distributed, nonparametric methods were used. All statistical analyses were conducted using the Minitab statistical package, release 13 (http://www.minitab.com/). We did not use so called codon-based methods of analysis because they depend on several unrealistic assumptions, most notably the assumptions that phylogeny is known with 100% accuracy and that no recombination occurs (Hughes et al. 2006). The assumption of a perfectly known phylogeney was not met in the case of allelic sequences within the six virus species (see Results), as indeed is typical of allelic sequences (Hughes et al. 2006). Likewise, several studies have provided evidence of recombination events in circoviruses (e.g., Heath et al. 2004; Olver et al. 2007). Note that our methods, involving the analysis of the pattern of sequence polymorphism at individual polymorphic sites, do not assume the absence of recombination.
A number of methods of testing for a signature of population expansion in sequence data have been proposed that likewise assume the absence of recombination (for a review, see Ramos-Onsins and Rozas 2002). Because this assumption is questionable in the case of circoviruses (Heath et al. 2004; Olver et al. 2007), we applied the maximum likelihood method of estimating the exponential growth rate (g) implemented in the LAMARC 2.0 program (Kuhner 2006). This method does not assume absence of recombination but does assume that the exponential growth rate has been constant throughout the lifespan of the coalescent tree; that the recombination rate does not vary by position; and that all polymorphism is selectively neutral (Kuhner 2006). The presence of a moderate degree of purifying selection is believed not to affect the results greatly (Kuhner 2006).
3. Results
3.1. Phylogenetic analysis
Figure 2 shows a schematic phylogeny of the Rep proteins of six circovirus species, rooted with Rep from BBTV. The topology shown is that of the NJ tree based on the equal input model and the Bayesian method (see Supplementary Figures S1 and S2 for the detailed phylogenies). In the trees produced by these methods, the four circoviruses of birds clustered together as a monophylogetic group (Figure 2). Both methods placed PCV1 as PCV2 as sister taxa, with strong support (Figure 2). Likewise, both methods placed GCV and MuDCV as sister groups, with strong support (Figure 2). Strongly supported branches separated the six virus species from the others, but within each species few clustering patterns received strong support (Supplementary Figure S1). In phylogenetic trees constructed by both methods, the six virus species formed distinct clusters (Figure 2). However, within these clusters, most branching patterns were not well supported (see Supplementary Figures S1 and S2).
Figure 2.
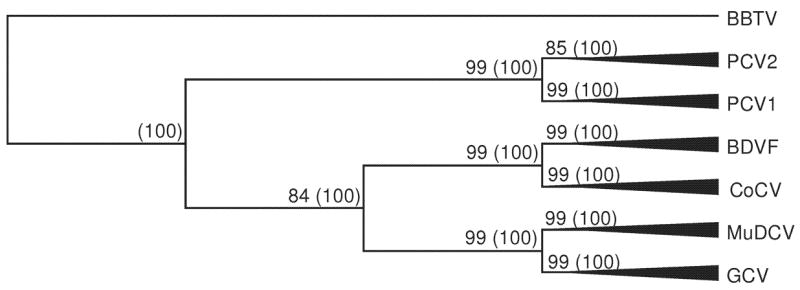
Schematic phylogeny indicating the Rep proteins of the six circoviruses species, based on NJ tree (equal input model) and Bayesian analysis (JTT + Γ model). The phylogenetic tree was rooted with Rep from banana bunchy-top virus (BBTV). Numbers on the branches indicate bootstrap support and (in parentheses) Bayesian posterior probabilities.
3.2. Nucleotide Diversity
Patterns of synonymous and nonsynonymous nucleotide diversity at the two major protein-coding loci showed a consistent pattern in the six circovirus species (Table 1). For all species, πS was significantly greater than πN in the complete coding regions of all six genes (P < 0.001 in every case except cap of PCV1, where P < 0.05; Table 1). In addition, πN in the complete coding region of rep was significantly lower than πN in cap in all six species (Table 1). Thus, both genes showed the effect of past purifying selection acting to eliminate a proportion of nonsynonymous mutations, and there was evidence that this selection is stronger on rep than on cap in all six virus species.
Table 1.
Synonymous (πS) and nonsynonymous (πN) nucleotide diversities (± S.E.) at the two major protein-coding loci of circoviruses.
| Virus | No. sequences | Gene | πS | πN |
|---|---|---|---|---|
| BFDV | 21 | rep | 0.177 ± 0.018a | 0.030 ± 0.002c |
| cap | 0.237 ± 0.023 | 0.087 ± 0.010 | ||
| CoCV | 5 | rep | 0.191 ± 0.022c | 0.019 ± 0.004c |
| cap | 0.465 ± 0.052 | 0.091 ± 0.012 | ||
| GCV | 23 | rep | 0.147 ± 0.018c | 0.009 ± 0.002a |
| cap | 0.357 ± 0.035 | 0.021 ± 0.004 | ||
| MuDCV | 6 | rep | 0.195 ± 0.013b | 0.013 ± 0.003b |
| cap | 0.498 ± 0.105 | 0.028 ± 0.005 | ||
| PCV1 | 22 | rep | ||
| 5′ region | 0.021 ± 0.007 | 0.004 ± 0.001b | ||
| Intron region | 0.014 ± 0.005 | 0.003 ± 0.001b | ||
| 3′ region | 0.009 ± 0.005b | 0.004 ± 0.001b | ||
| All | 0.015 ± 0.003a | 0.003 ± 0.001b | ||
| cap | 0.027 ± 0.005 | 0.014 ± 0.003 | ||
| PCV2 | 215 | rep | ||
| 5′ region | 0.134 ± 0.026 | 0.008 ± 0.003c | ||
| Intron region | 0.037 ± 0.011c | 0.003 ± 0.001c | ||
| 3′ region | 0.019 ± 0.011c | 0.004 ± 0.001c | ||
| All | 0.065 ± 0.010b | 0.005 ± 0.001c | ||
| cap | 0.128 ± 0.017 | 0.029 ± 0.005 |
Tests of the hypothesis that πS or πN in rep (or region of rep) equals the value for the same virus in cap:
P < 0.05;
P < 0.01;
P < 0.001.
Surprisingly, πS in rep was significantly lower than πS in cap in all six virus species (Table 1), suggesting some sort of constraint on synonymous sites in rep. To identify factors associated with this apparent constraint, we examined aspects of nucleotide content at third codon positions. The percent G + C at third positions (GC3) was higher in rep than in cap in the bird circoviruses, but the reverse was true in PCV1 and PCV2 (Table 2). By contrast, there was a consistent difference between the two genes in all six viral species with regard to AT-skew, with strongly negative AT-skew at third positions in rep and either positive or only slightly negative AT-skew at third positions in cap (Table 2). This difference between rep and cap was significant by a Sign Test (Table 2). When the different regions of rep were examined separately in PCV1 and PCV2, the most strongly negatively skewed portion of the gene was the intron region (Table 2).
Table 2.
Percent G + C at third codon positions and AT-skew at third codon position in circovirus genes.
| Virus | Gene | GC3 | AT-skew |
|---|---|---|---|
| BFDV | rep | 60.6% | −0.294 |
| cap | 49.1% | 0.251 | |
| CoCV | rep | 68.5% | −0.215 |
| cap | 56.5% | 0.124 | |
| GCV | rep | 50.3% | −0.284 |
| cap | 47.9% | 0.567 | |
| MuDCV | rep | 52.0% | −0.302 |
| cap | 49.5% | 0.355 | |
| PCV1 | rep | ||
| 5′ region | 55.4% | −0.253 | |
| Intron region | 50.3% | −0.400 | |
| 3′ region | 41.6% | −0.027 | |
| All | 50.4% | −0.262 | |
| cap | 56.5% | 0.041 | |
| PCV2 | rep | ||
| 5′ region | 45.8% | −0.083 | |
| Intron region | 46.5% | −0.234 | |
| 3′ region | 47.8% | −0.134 | |
| All | 46.5% | −0.155 | |
| cap | 58.3% | −0.007 | |
| All species (median) | rep | 51.2% | −0.273a |
| cap | 53.0% | 0.188 |
Sign-test of the hypothesis that median AT-skew in rep equals that in cap: P = 0.031.
An additional factor responsible for constraint on synonymous sites in rep might be alternative splicing of products from this gene. Thus we examined synonymous and nonsynonymous nucleotide diversity in the distinct regions of rep defined by the alternate splicing of this gene in PCV1 (Table 1). In PCV1, πS in the 3′ region of rep was significantly lower than that in cap; and in PCV2, πS was lower in both the intron region and the 3′ region of rep than that in cap. These results suggest unusual constraints in these regions of rep in both PCV1 and PCV2 that affect synonymous as well as nonsynonymous sites.
The two non-coding regions of the genome were designated as follows: (1) region 1, located 5′ to the rep start site and containing the structurally conserved element (SCE), a stem-loop structure involved in DNA replication and the regulation of gene expression (Niagro et al. 1998); and (2) region 2, located 3′ to the rep stop codon. In all six viruses, π in each of these regions was significantly lower than πS in cap (Table 3). Only in BFDV was π in non-coding region 1 significantly different from that in non-coding region 2 (P < 0.001), with the lower value occurring in region 2 (Table 3). The results thus show that the non-coding regions are subject to strong purifying selection in all six viruses.
Table 3.
Nucleotide diversity (π) ± S.E. in intergenic regions of circoviruses.
| Virus | Region 1 | Region 2 | ||
|---|---|---|---|---|
| No. sites | π | No sites | π | |
| BFDV | 132 | 0.160 ± 0.021a | 221 | 0.076 ± 0.011b |
| CoCV | 90 | 0.057 ± 0.019b | 169 | 0.013 ± 0.006b |
| GCV | 130 | 0.063 ± 0.004b | 54 | 0.044 ± 0.019b |
| MuDV | 109 | 0.063 ± 0.015b | 222 | 0.075 ± 0.012b |
| PCV1 | 82 | 0.001 ± 0.001b | 36 | 0.000 ± 0.000b |
| PCV2 | 76 | 0.012 ± 0.007b | 34 | 0.009 ± 0.004b |
Tests of the hypothesis that π equals πS in the cap gene of the same virus (Table 1):
P < 0.05;
P < 0.001.
3.3. Ongoing Purifying Selection
In addition to past purifying selection that has eliminated deleterious mutations, comparison of allelic sequences can provide evidence of ongoing purifying selection acting against slightly deleterious variants present in a population (Hughes et al. 2003). In four of the six virus species, the lowest median gene diversities were seen at nonsynonymous polymorphic sites in rep (Table 4). In all four of these species, median gene diversity at nonsynonymous polymorphic sites in rep was significantly lower than that at synonymous polymorphic sites in cap (Table 4). In three species (BFDV, CcCV, and PCV2), median gene diversity at nonsynonymous polymorphic sites in rep was significantly lower than that at nonsynonymous polymorphic sites in cap (Table 4). Only in PCV2 was median gene diversity at nonsynonymous polymorphic sites in rep significantly lower than that at nonsynonymous polymorphic sites in cap and at synonymous polymorphic sites in both genes (Table 4).
Table 4.
Median gene diversity at individual synonymous and nonsynonymous polymorphic sites (numbers of sites in parentheses) in circovirus rep and cap genes.
| Virus | rep | cap | P (Kruskal-Wallis) | ||
|---|---|---|---|---|---|
| synonymous | nonsynonymous | synonymous | nonsynonymous | ||
| BFDV | 0.172 (106) | 0.091 (84) | 0.245 (89)b | 0.281 (126)c | < 0.001 |
| CoCV | 0.320 (73) | 0.320 (25) | 0.480 (97)b | 0.480 (80)c | <0.001 |
| GCV | 0.287 (85)a | 0.083 (23) | 0.386 (119)c | 0.257 (34) | < 0.001 |
| MuDCV | 0.278 (80) | 0.278 (20) | 0.278 (125) | 0.278 (41) | N.S. |
| PCV1 | 0.087 (23) | 0.087 (18) | 0.087 (33) | 0.087 (36) | N.S. |
| PCV2 | 0.018 (116)c | 0.009 (122) | 0.023 (112)c | 0.019 (110)c | < 0.001 |
Individual comparisons (Dunn’s method) with nonsynonymous sites in rep:
P < 0.05;
P < 0.01;
P < 0.001.
Comparison of the pairwise numbers of differences and corrected numbers of segregating sites at both genes in each species further highlighted a unique pattern at rep in PCV2 (Figure 3). At synonymous sites in both genes, Ks and S*s were scattered around a 45° line, with no cases where Ks or S*s strongly deviated from equality (Figure 3A). At nonsynonymous sites, the pattern was similar except that S*n was much greater than Kn in rep of PCV2 (Figure 3B). Thus, both synonymous and nonsynonymous sites at both genes showed no pronounced deviation from the neutral expectation except for PCV2, where there was evidence of an unusual excess of rare nonsynonymous polymorphisms.
Figure 3.
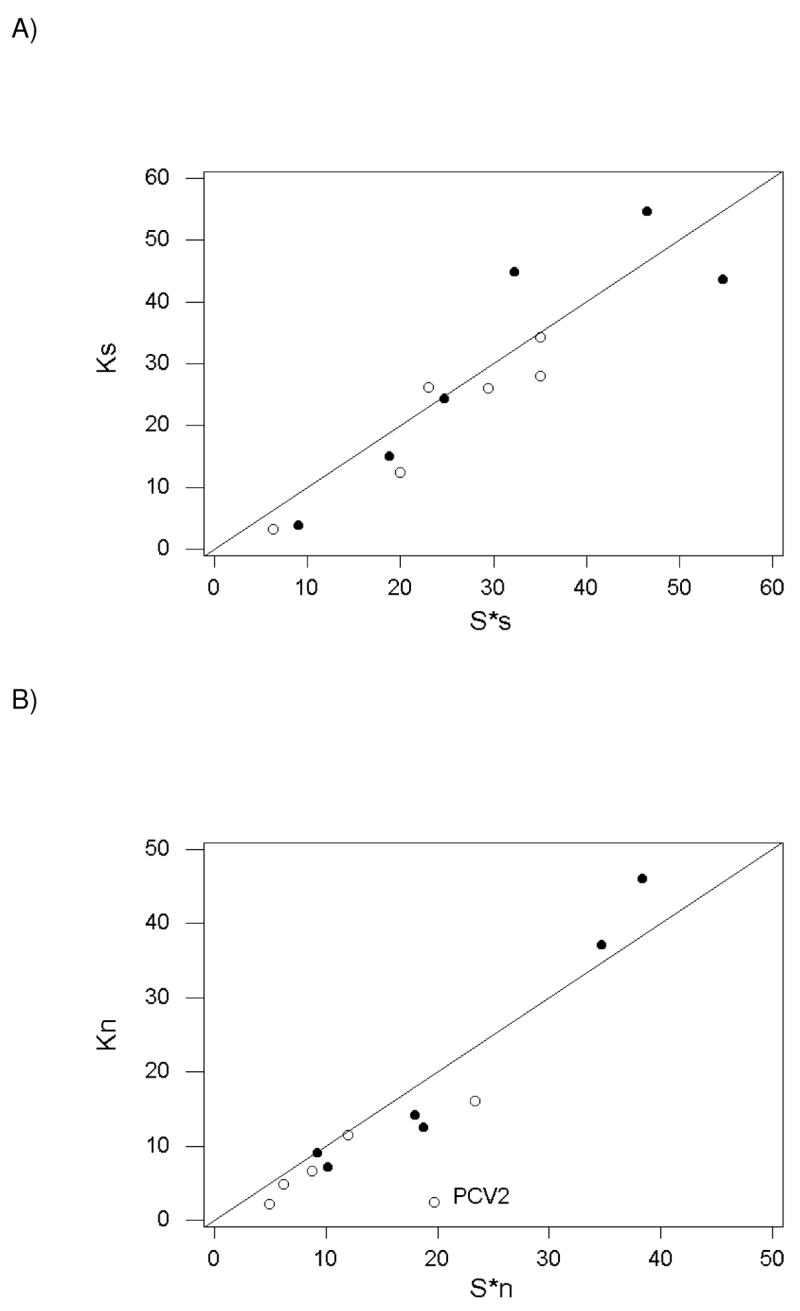
Plots of (A) numbers of pairwise synonymous differences (Ks) vs. adjusted number of synonymous segregating sites (S*s); and (B) numbers of pairwise nonsynonymous differences (Kn) vs. adjusted number of nonsynonymous segregating sites (S*n) in at rep (open circles) and cap (solid circles) in six circovirus species. The outlier value for nonsynonymous polymorphisms in rep of PCV2 is indicated.
There was only one polymorphic sites in either of the two genes of PCV2 (a synonymous site in rep) at which none of the alleles present in the population of sequences analyzed was identical to the reconstructed ancestral sequence for PCV2. Excluding the latter site, the median frequency of non-ancestral nucleotides was significantly lower at nonsynonymous sites in rep than at synonymous sites in rep or at either synonymous or nonsynonymous sites in cap (Figure 4A). The latter three categories showed identical median frequencies (2/215 or 0.0093), exactly twice the median frequency of non-ancestral nucleotides at nonsynonymous sites in rep (1/215 or 0.0046; Figure 4A).
Figure 4.
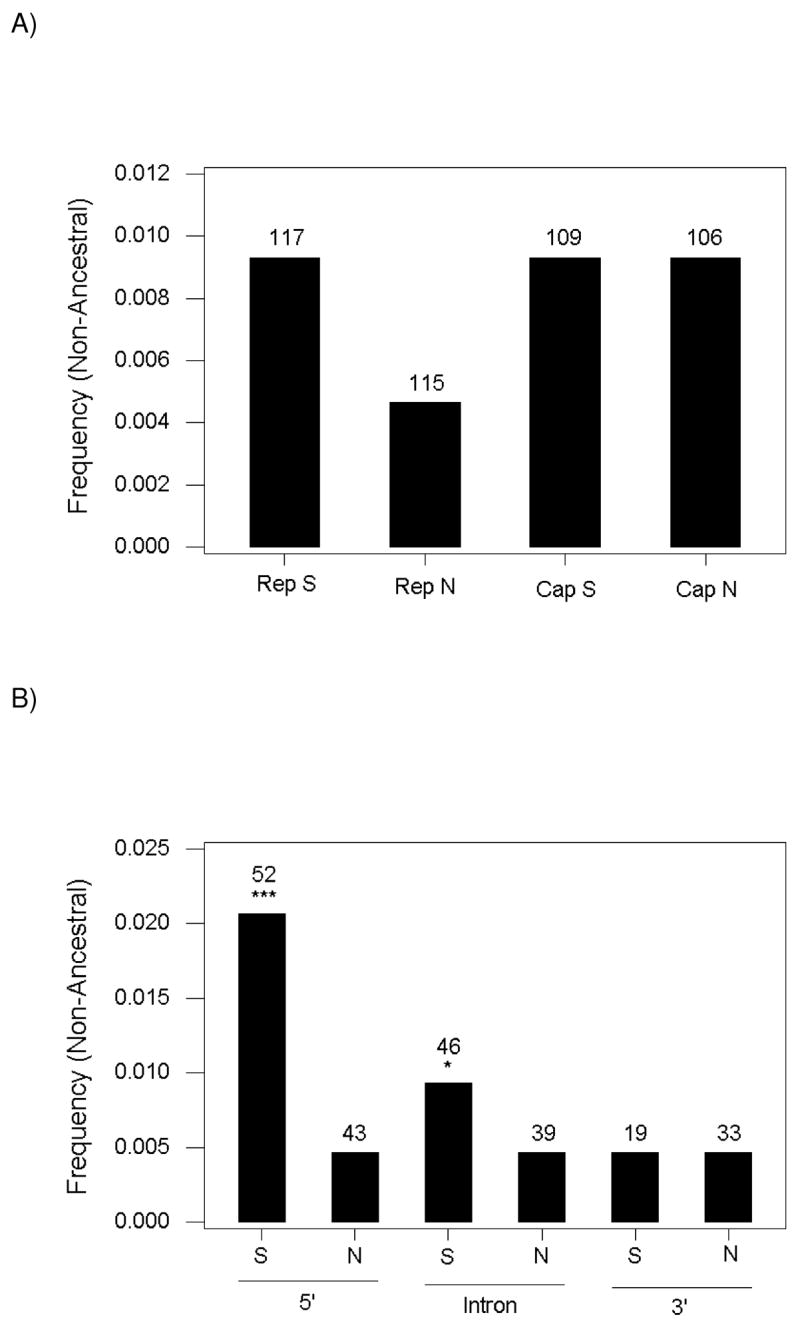
(A) Median frequency of non-ancestral nucleotides at synonymous (S) and nonsynonymous (N) polymorphic sites in rep and cap of PCV2. The difference among medians was significant (Kruskal-Wallis test; P < 0.001). All other categories of sites were significantly different from nonsynonymous sites in rep (P < 0.001) in individual comparisons (Dunn 1964). (B) Median frequency of non-ancestral nucleotides at synonymous (S) and nonsynonymous (N) polymorphic sites in different regions of the rep gene of PCV2. The difference among medians was significant (Kruskal-Wallis test; P < 0.001). Individual comparisons with nonsynonymous sites in the 5′ region: * P < 0.05; *** P < 0.001. Numbers on the tops of bars represent numbers of sites in each category.
The median frequency non-ancestral nucleotides at nonsynonymous sites was identical for each of the three regions of rep (Figure 4B). The median frequency of non-ancestral nucleotides at synonymous sites in the 5′ region was significantly greater than that at nonsynonymous sites in the same region (P < 0.001), as was the median frequency of non-ancestral nucleotides at synonymous sites in the region (P < 0.05; Figure 4B). By contrast, the median frequency of non-ancestral nucleotides at synonymous sites in the 3′ region was identical to that at nonsynonymous sites in all regions (Figure 4B).
Of 78 sites in rep at which a synonymous change was unambiguously reconstructed to have occurred in the ancestor of PCV2, 38 (48.7%) were polymorphic in PCV2. By contrast, of 56 sites in rep at which a nonsynonymous change was unambiguously reconstructed to have occurred in the ancestor of PCV2, only 16 (28.6%) were polymorphic in PCV2. The difference between these two proportions was significant (χ2 = 5.50; 1 d.f.; P = 0.019). Of the sites in rep that both underwent change in the PCV2 ancestor and were polymorphic in PCV2, median gene diversity was significantly lower at nonsynonymous sites (0.0093) than at synonymous sites (0.0184; Wilcoxon Rank Sum test; P = 0.015).
In the case of cap, the proportion of sites at which a synonymous change was unambiguously reconstructed to have occurred in the ancestor of PCV2 and which were polymorphic in PCV2 (35 of 71 or 49.3%) exceeded the proportion of sites at which a nonsynonymous change was unambiguously reconstructed to have occurred in the ancestor of PCV2 and which were polymorphic in PCV2 (32 of 92 or 34.5%); however, the difference was not significant (χ2 = 3.49; 1 d.f.). Of the sites in cap that both underwent change in the PCV2 ancestor and were polymorphic in PCV2, median gene diversity did not differ significantly between nonsynonymous (0.0320) and synonymous (0.0185) sites (Wilcoxon Rank Sum test).
The LAMAC 2.0 program was used to obtain a maximum likelihood estimate of the exponential growth rate (g) of PCV2 separately for the rep and cap genes. The estimated values of g were 463.2 for rep and 101.0 for cap. Both values supported the hypothesis of positive population growth, but the very high value for rep was likely due the strong purifying selection on this gene, violating the assumption of neutrality made by this method (Kuhner 2006).
4. Discussion
Analysis of nucleotide sequence diversity within six species of circovirus showed stronger purifying selection at nonsynonymous sites in the rep gene than on those in the cap gene (Table 1), consistent with the finding Olvera et al. (2007) for PCV2. There was evidence that two intergenic regions are also conserved because nucleotide diversity in these regions was significantly lower than that at synonymous sites in the cap gene (Table 3). Surprisingly, in all six species, synonymous nucleotide diversity in the rep gene was significantly lower than that in the cap gene (Table 1), suggesting functional constraint even at synonymous sites in rep. In all six species, third codon positions in rep differed from those in cap in having strongly negative AT-skew, indicating a skew toward T at sites having A or T (Table 2). This strongly biased nucleotide usage is evidently one factor associated with reduced nucleotide diversity at synonymous sites in rep.
In addition, in the case of PCV1, it is known that two distinct transcripts (rep and rep′) are produced from the rep coding region. The rep′ transcript shares the same reading frame with rep in its 5′ region; a portion of the gene (the “intron”) is spliced out of the rep′ transcript; and the 3′ region of rep′ overlaps part of the 3′ region of rep but is read in a different reading frame (Mankertz and Hillenbrand 2001). Synonymous nucleotide diversity was significantly reduced in the intron region and 3′ region of rep in PCV1 and in the corresponding regions of PCV2 (Table 1). Reduced synonymous nucleotide diversity in the portion of rep where there are overlapping reading frames is consistent with other data showing reduced synonymous substitution in portions of viral genomes that encode proteins in more than one reading frame (Hughes and Hughes 2005; Mizokami et al. 1997). This pattern presumably occurs because synonymous substitutions in one reading frame are likely to be nonsynonymous in the other reading frame and thus often subject to purifying selection (Hughes and Hughes 2005).
In the intron region of rep, on the other hand, the reduced synonymous polymorphism in PCV1 and PCV2 is associated with an unusually strongly negative AT-skew in that region. The strongly negative AT-skew in the intron region may have functional importance. Evidence of low population frequencies of non-ancestral nucleotides at synonymous sites in both the 3′ and intron regions of rep in PCV2 (Figure 4B) is consistent with the hypothesis that these sites are subject to ongoing purifying selection and thus to functional constraint.
Of the six virus species examined, four species showed evidence of ongoing purifying selection at nonsynonymous polymorphic sites in the rep gene, indicating the presence of slightly deleterious nonsynonymous variants in these populations. The rep gene of PCV2 was unique, however, in showing a strong excess of rare nonsynonymous polymorphisms. That an excess of rare nonsynonymous polymorphisms is seen in the rep gene of PCV2, but not in the cap gene of the same virus species, is consistent with the observation that purifying selection in general is stronger on rep than on cap. Moreover, the excess of rare nonsynonymous polymorphisms suggests a prolonged population bottleneck in PCV2, allowing slightly deleterious mutations to accumulate, followed by a population expansion during which selection to remove these variants has increased in effectiveness (Hughes et al. 2003). Such a population history is consistent with the epidemiological evidence of a recent worldwide spread of PCV2 from an unknown source (Meehan et al. 1998).
Nucleotide sequence differences fixed in the ancestor of PCV2 presumably include those responsible for its unique characteristics, including pathogenesis. These may include changes in splice donor and acceptor sites causing differences in the production of alternative minor transcripts from rep (Cheung 2003a). Amino acid sequence differences may also contribute to differences in biological properties, although experimental evidence will be needed to test this hypothesis. Our reconstruction of ancestral rep and cap coding sequences identified a number of sites at which amino acid sequence changes occurred in the ancestor of PCV2 and remained conserved in the latter virus. Our results indicated that sites in rep where nonsynonymous changes occurred in the ancestor of PCV2 were particularly likely to be conserved in the PCV2 population. This in turn suggests that substitutions in rep unique to PCV2 and conserved in the PCV2 population may be plausible candidate sites to account for the distinctive properties of this virus.
It is hard to understand how the occurrence of PMWS in the host might confer a fitness advantage on PCV2. Thus, the pathogenic character of PCV2 may have arisen not as a result of positive Darwinian selection but as a result of the chance fixation of effectively neutral mutations (Nei 2007). The present analysis, by showing the signature of a bottlenecked population history in the case of PCV2, lends credence to this hypothesis. Indeed, many emergent viruses have properties that are unlikely to have been positively selected but rather represent the fortuitous occurrence of traits that happen to cause pathogenesis in a new host. Human immunodeficiency virus-1 (HIV-1) provides an example of a virus recently transferred from a host in which it was non-pathogenic to a host in which it is highly pathogenic (Korber et al. 2000). Thus, emergent viruses represent important model systems for testing predictions regarding the role of non-Darwinian mechanisms in phenotypic evolution (Nei 2007).
Supplementary Material
Acknowledgments
This research was supported by grant GM43940 from the National Institutes of Health to A.L.H. H.P. was supported by the Kent State University Research Council and Ohio Board of Regents Research Challenge Grant.
Footnotes
Publisher's Disclaimer: This is a PDF file of an unedited manuscript that has been accepted for publication. As a service to our customers we are providing this early version of the manuscript. The manuscript will undergo copyediting, typesetting, and review of the resulting proof before it is published in its final citable form. Please note that during the production process errors may be discovered which could affect the content, and all legal disclaimers that apply to the journal pertain.
References
- Allan GM, Ellis JA. Porcine circoviruses: a review. J Vet Diagn Invest. 2000;12:3–14. doi: 10.1177/104063870001200102. [DOI] [PubMed] [Google Scholar]
- Allen TM, O’Connor DH, Jing P, Dzuris JL, Mothé BR, Vogel TU, Dunphy E, Liebl ME, Emerson C, Wilson N, Kunstman KJ, Wang X, Allison DB, Hughes AL, Desrosiers RC, Altman JD, Wolinsky SM, Sette A, Watkins DI. Tat-specific CTL select for SIV escape variants during resolution of primary viremia. Nature. 2000;407:386–390. doi: 10.1038/35030124. [DOI] [PubMed] [Google Scholar]
- Brown RJ, Tarr AW, McClure P, Juttla VS, Tagiuri N, Irving WL, Ball JK. Cross-genotype characterization of genetic diversity and molecular adaptation in hepatitis C virus envelope glycoprotein genes. J Gen Virol. 2007;88:458–469. doi: 10.1099/vir.0.82357-0. [DOI] [PubMed] [Google Scholar]
- Cheung AK. Comparative analysis of the transcriptional patterns of pathogenic and nonpathogenic porcine circoviruses. Virology. 2003a;310:41–49. doi: 10.1016/s0042-6822(03)00096-5. [DOI] [PubMed] [Google Scholar]
- Cheung AK. Transcriptional analysis of porcine circovirus type 2. Virology. 2003b;305:168–180. doi: 10.1006/viro.2002.1733. [DOI] [PubMed] [Google Scholar]
- Cheung AK. The essential and nonessential transcription units for viral protein synthesis and DNA replication of porcine circovirus type 2. Virology. 2003c;313:452–459. doi: 10.1016/s0042-6822(03)00373-8. [DOI] [PubMed] [Google Scholar]
- Dunn OJ. Multiple comparisons using rank sums. Technometrics. 1964;6:241–252. [Google Scholar]
- Evans DT, O’Connor DH, Jing P, Dzuris JL, Sidney J, da Silva J, Allen TM, Horton H, Venham JE, Rudersdorf RA, Vogel T, Pauza CD, Bontrop RE, DeMars R, Sette A, Hughes AL, Watkins DI. Virus-specific cytotoxic T-lymphocyte responses select for amino-acid variation in simian immunodeficiency virus Env and Nef. Nature Med. 1999;5:1270–1276. doi: 10.1038/15224. [DOI] [PubMed] [Google Scholar]
- Felsenstein J. Confidence limits on phylogenies: an approach using the bootstrap. Evolution. 1985;39:783–791. doi: 10.1111/j.1558-5646.1985.tb00420.x. [DOI] [PubMed] [Google Scholar]
- Fitch WM, Leiter JM, Li X, Palese P. Positive Darwinian evolution in human influenza A viruses. Proc Natl Acad Sci USA. 88:4270–4274. doi: 10.1073/pnas.88.10.4270. [DOI] [PMC free article] [PubMed] [Google Scholar]
- Haydon DT, Samuel AR, Knowles NJ. The generation and persistence of genetic variation in foot-and-mouth disease virus. Preventive Vet Med. 2001;51:111–124. doi: 10.1016/s0167-5877(01)00210-0. [DOI] [PubMed] [Google Scholar]
- Heath L, Martin DP, Warburton L, Perrin M, Horsfield W, Kingsley C, Rybicki EP, Williamson A-L. Evidence of unique genotypes of Beak and Feather Disease Virus in Southern Africa. J Virol. 2004;78:9277–9284. doi: 10.1128/JVI.78.17.9277-9284.2004. [DOI] [PMC free article] [PubMed] [Google Scholar]
- Huelsenbeck JP, Ronquist F. MRBAYES: Bayesian inference of phylogenetic trees. Bioinformatics. 2001;17:754–755. doi: 10.1093/bioinformatics/17.8.754. [DOI] [PubMed] [Google Scholar]
- Hughes AL. Adaptive Evolution of Genes and Genomes. New York: Oxford University Press; 1999. [Google Scholar]
- Hughes AL. Birth-and-death evolution of protein-coding regions and concerted evolution of non-coding regions in multi-component genomes of nanoviruses. Mol Phyl Evol. 2004;30:287–294. doi: 10.1016/s1055-7903(03)00189-1. [DOI] [PubMed] [Google Scholar]
- Hughes AL. Evidence for abundant slightly deleterious polymorphisms in bacterial populations. Genetics. 2005;169:533–538. doi: 10.1534/genetics.104.036939. [DOI] [PMC free article] [PubMed] [Google Scholar]
- Hughes AL. Micro-scale signature of purifying selection in Marburg Virus genomes. Gene. 2007a;392:266–272. doi: 10.1016/j.gene.2006.12.038. [DOI] [PubMed] [Google Scholar]
- Hughes AL, French JO. Homologous recombination and the pattern of nucleotide substitution in Ehrlichia ruminantium. Gene. 2007;387:31–37. doi: 10.1016/j.gene.2006.08.003. [DOI] [PubMed] [Google Scholar]
- Hughes AL, Hughes MA. Patterns of nucleotide difference in overlapping and non-overlapping reading frames of papillomavirus genomes. Virus Research. 2005;113:81–88. doi: 10.1016/j.virusres.2005.03.030. [DOI] [PubMed] [Google Scholar]
- Hughes AL, Hughes MA. Coding sequence polymorphism in avian mitochondrial genomes reflects population histories. Mol Ecol. 2007;16:1369–1376. doi: 10.1111/j.1365-294X.2007.03242.x. [DOI] [PubMed] [Google Scholar]
- Hughes AL, Packer B, Welch R, Bergen AW, Chanock SJ, Yeager M. Widespread purifying selection at polymorphic sites in human protein-coding loci. Proc Natl Acad Sci USA. 2003;100:15754–15757. doi: 10.1073/pnas.2536718100. [DOI] [PMC free article] [PubMed] [Google Scholar]
- Hughes AL, Piontkivska H, Krebs KC, O’Connor DH, Watkins DI. Within-host evolution of CD8+-TL epitopes encoded by overlapping and non-overlapping reading frames of simian immunodeficiency virus. Bioinformatics. 2005;21(Suppl 3):iii39–iii44. doi: 10.1093/bioinformatics/bti1203. [DOI] [PubMed] [Google Scholar]
- Hughes AL, Friedman R, Glenn NL. The future of data analysis in evolutionary genomics. Curr Genomics. 2006;7:227–234. [Google Scholar]
- Hughes AL, Hughes MA, Friedman R. Variable intensity of purifying selection on cytotoxic T-lymphocyte epitopes in hepatitis C virus. Virus Research. 2007;123:147–153. doi: 10.1016/j.virusres.2006.08.012. [DOI] [PubMed] [Google Scholar]
- Jerzak G, Bernard KA, Kramer LD, Ebel GD. Genetic variation in West Nile virus from naturally infected mosquitos and birds suggests quasispecies structure and strong purifying selection. J Gen Virol. 2005;86:2175–2183. doi: 10.1099/vir.0.81015-0. [DOI] [PMC free article] [PubMed] [Google Scholar]
- Jukes TH, Cantor CR. Evolution of protein molecules. In: Munro HN, editor. Mammalian Protein Metabolism. Academic Press; New York: 1969. pp. 21–132. [Google Scholar]
- Kimura M. Preponderance of synonymous changes as evidence for the neutral theory of molecular evolution. Nature. 1977;267:275–276. doi: 10.1038/267275a0. [DOI] [PubMed] [Google Scholar]
- Korber B, Muldoon M, Theiler J, Gao F, Gupta R, Lapedes A, Hahn BH, Wolinsky S, Bhattacharya T. Timing the ancestor of the HIV-1 pandemic strains. Science. 2000;288:1789–1796. doi: 10.1126/science.288.5472.1789. [DOI] [PubMed] [Google Scholar]
- Kuhner M. LAMARC 2.0: maximum likelihood and Bayesian estimation of population parameters. Bioinformatics. 2006;22:768–770. doi: 10.1093/bioinformatics/btk051. [DOI] [PubMed] [Google Scholar]
- Kumar S, Tamura K, Nei M. MEGA3: integrated software for Molecular Evolutionary Genetics Analysis and sequence alignment. Brief Bioinf. 2004;5:150–163. doi: 10.1093/bib/5.2.150. [DOI] [PubMed] [Google Scholar]
- Mankertz A, Hillenbrand B. Replication of procine circovirus type 1 requires two proteins encoded by the viral rep gene. Virology. 2001;279:429–438. doi: 10.1006/viro.2000.0730. [DOI] [PubMed] [Google Scholar]
- Meehan BM, McNeilly F, Todd D, Kennedy S, Jewhurst VA, Ellis JA, Hassard LE, Clark EG, Haines DM, Allan GM. Characterization of novel circovirus DNAs associated with wasting syndromes in pigs. J Gen Virol. 1998;79:2171–2179. doi: 10.1099/0022-1317-79-9-2171. [DOI] [PubMed] [Google Scholar]
- Mizokami M, Orito E, Ohba K, Ikeo K, Lau JY, Jojobori T. Constrained evolution with respect to gene overlap of hepatitis B virus. J Mol Evol. 1997;44:S83–S90. doi: 10.1007/pl00000061. [DOI] [PubMed] [Google Scholar]
- Moore CB, John M, James IR, Christiansen FT, Witt CS, Mallal SA. Evidence of HIV-1 adaptation to HLA-restricted immune responses at a population level. Science. 2002;296:1439–1443. doi: 10.1126/science.1069660. [DOI] [PubMed] [Google Scholar]
- Nei M. Genetic polymorphism and the role of mutation in evolution. In: Nei M, Koehn RK, editors. Evolution of Genes and Proteins. Sinauer; Sunderland MA: 1983. pp. 165–190. [Google Scholar]
- Nei M. Molecular Evolutionary Genetics. Columbia University Press; New York: 1987. [Google Scholar]
- Nei M. The new mutation hypothesis of phenotypic evolution. Proc Natl Acad Sci USA. 2007;104:12235–12242. doi: 10.1073/pnas.0703349104. [DOI] [PMC free article] [PubMed] [Google Scholar]
- Niagaro FD, Forsthoefel AN, Lawther RP, Kamalanathan L, Ritchie BW, Latimer KS, Lukert PD. Beak and feather disease virus and porcine circovirus genomes: intermediates between the geminiviruses and plant circoviruses. Arch Virol. 1998;143:1723–1744. doi: 10.1007/s007050050412. [DOI] [PubMed] [Google Scholar]
- Ohta T. Slightly deleterious mutant substitutions in evolution. Nature. 1973;246:96–98. doi: 10.1038/246096a0. [DOI] [PubMed] [Google Scholar]
- Ohta T. Role of very slightly deleterious mutations in molecular evolution and polymorphism. Theor Pop Biol. 1976;10:254–275. doi: 10.1016/0040-5809(76)90019-8. [DOI] [PubMed] [Google Scholar]
- Ohta T. Near-neutrality in evolution of genes and gene regulation. Proc Natl Acad Sci USA. 2002;99:16134–16137. doi: 10.1073/pnas.252626899. [DOI] [PMC free article] [PubMed] [Google Scholar]
- Olvera A, Cortey M, Segalés J. Molecular evolution of porcine circovirus type 2 genomes: phylogeny and clonality. Virology. 2007;357:175–185. doi: 10.1016/j.virol.2006.07.047. [DOI] [PubMed] [Google Scholar]
- Pybus OG, Rambaut A, Belshaw R, Freckleton RP, Drummond AJ, Holmes EC. Phylogenetic evidence for deleterious mutation load in RNA viruses and its contribution to viral evolution. Mol Biol Evol. 2007;24:845–852. doi: 10.1093/molbev/msm001. [DOI] [PubMed] [Google Scholar]
- Ramos-Onsins SE, Rozas J. Statistical properties of new neutrality tests against population growth. Mol Biol Evol. 2002;19:2092–2100. doi: 10.1093/oxfordjournals.molbev.a004034. [DOI] [PubMed] [Google Scholar]
- Rand DM, Kann LM. Excess amino acid polymorphism in mitochondrial DNA: contrasts among genes from Drosophila, mice, and humans. Mol Biol Evol. 1996;13:735–748. doi: 10.1093/oxfordjournals.molbev.a025634. [DOI] [PubMed] [Google Scholar]
- Rodriguez F, Oliver JF, Marí A, Medina JR. The general stochastic model of nucleotide substitution. J Theor Biol. 1990;142:485–501. doi: 10.1016/s0022-5193(05)80104-3. [DOI] [PubMed] [Google Scholar]
- Saitou N, Nei M. Polymorphism and evolution of influenza A virus genes. Mol Biol Evol. 1986;3:57–74. doi: 10.1093/oxfordjournals.molbev.a040381. [DOI] [PubMed] [Google Scholar]
- Saitou N, Nei M. The neighbor-joining method: a new method for reconstructing phylogenetic trees. Mol Biol Evol. 1987;4:406–425. doi: 10.1093/oxfordjournals.molbev.a040454. [DOI] [PubMed] [Google Scholar]
- Schaeffer SW. Molecular population genetics of sequence length diversity in the Adh region of Drosophila pseudoobscura. Genet Res. 2002;80:163–175. doi: 10.1017/s0016672302005955. [DOI] [PubMed] [Google Scholar]
- Seibert SA, Howell CY, Hughes MK, Hughes AL. Natural selection on the gag, pol, and env genes of human immunodeficiency virus 1 (HIV-1) Mol Biol Evol. 1995;12:803–813. doi: 10.1093/oxfordjournals.molbev.a040257. [DOI] [PubMed] [Google Scholar]
- Slobod KS, Bonsignori M, Brown SA, Zhan X, Stambas J, Hurwitz JL. HIV vaccines: brief review and discussion of future directions. Expert Rev Vaccines. 2005;4:305–313. doi: 10.1586/14760584.4.3.305. [DOI] [PubMed] [Google Scholar]
- Storgaard T, Oleksiewicz Bøtner A. Examination of the selective pressures on a live PRRS vaccine virus. Arch Virol. 1999;144:2389–2401. doi: 10.1007/s007050050652. [DOI] [PubMed] [Google Scholar]
- Suzuki Y, Nei M. False-positive selection identified by ML-based methods: examples from the Sig1 gene of the diatom Thalassiosira weissflogii and the tax gene of a human T-cell lymphotropic virus. Mol Biol Evol. 2004;21:914–921. doi: 10.1093/molbev/msh098. [DOI] [PubMed] [Google Scholar]
- Tajima F. Statistical methods to test for nucleotide mutation hypothesis by DNA polymorphism. Genetics. 1989;123:585–595. doi: 10.1093/genetics/123.3.585. [DOI] [PMC free article] [PubMed] [Google Scholar]
- Thompson JD, Gibson TJ, Plewniak F, Jeanmougin F, Diggins DG. The CLUSTAL X windows interface: flexible strategies for multiple sequence alignment aided by quality analysis tools. Nucleic Acids Res. 1997;25:4876–4882. doi: 10.1093/nar/25.24.4876. [DOI] [PMC free article] [PubMed] [Google Scholar]
Associated Data
This section collects any data citations, data availability statements, or supplementary materials included in this article.