Abstract
Growing evidence suggests that uninjured afferents may play an important role in neuropathic pain following nerve injury. The excitability of nociceptive neurons in the L4 spinal nerve appears to be enhanced following an injury to the adjacent L5 spinal nerve. In this study, we investigated whether the action-potential conduction properties of unlesioned, unmyelinated fibers are also altered. A teased-fiber technique was used to record from single C fibers from the L4 spinal nerve of the rat in vitro. Repeated electrical stimulation of the tibial nerve was used to investigate activity-dependent slowing of conduction velocity. Twin pulse stimulation at a 50 ms interpulse interval allowed investigation of supranormal conduction velocity. Blinded experiments were performed 8–10 days after sham surgery and after an L5 spinal nerve ligation (L5 SNL). Activity-dependent slowing revealed two populations of C fibers, a “nociceptor” population with a large degree of activity-dependent slowing and a “non-nociceptor” population with a smaller degree of activity-dependent slowing. Both populations showed enhanced activity-dependent slowing of conduction velocity and enhanced supranormal conduction velocities in lesioned animals compared to sham animals. Activity-dependent slowing was also enhanced after an L5 SNL in the mouse. These alterations in conduction velocity may reflect changes in expression of ion channels responsible for the membrane excitability. These data provide additional evidence that a nerve injury leads to persistent alterations in the properties of adjacent uninjured, unmyelinated fibers.
Keywords: Neuropathic pain, Nerve injury, Neuropathy, Wallerian degeneration, Unmyelinated cutaneous afferent, Single nerve fiber recording
1. Introduction
The mechanisms underlying neuropathic pain remain incompletely understood. The changes that occur in injured nerve fibers have been well documented (Devor, 2005). Growing evidence suggests that the properties of uninjured afferents are also significantly altered following an adjacent nerve injury (Ringkamp and Meyer, 2006).
A useful model for investigating the roles of injured and uninjured afferents in neuropathic pain is the spinal nerve ligation (SNL) model (Kim and Chung, 1992), because the injury can be restricted to one spinal nerve (e.g., L5) leaving the other spinal nerves uninjured. After an L5 SNL, unmyelinated, nociceptive afferents in the uninjured L4 spinal nerve develop spontaneous activity (Wu et al., 2001; Djouhri et al., 2006). In addition, the cutaneous terminals of the uninjured nociceptors become responsive to adrenergic agents (Sato and Perl, 1991; Ali et al., 1999) and are sensitized to mechanical and heat stimuli (Shim et al., 2005). Furthermore, various molecules associated with nociception are upregulated in uninjured DRG neurons after a peripheral nerve injury (Ma and Bisby, 1998; Fukuoka et al., 2001, 2002; Hudson et al., 2001; Tsuzuki et al., 2001).
One explanation for a change in the excitability of uninjured afferents could be a change in the properties of voltage-gated sodium channels. For example, the C fiber compound action potential in the uninjured fibers of the sciatic nerve is more resistant to tetrodotoxin after an L5 spinal nerve injury; this is presumably due to the increase in expression of Nav1.8 in the sciatic nerve (Gold et al., 2003). Consistent with this explanation is the observation that attenuating the expression of Nav1.8 with antisense oligodeoxynucleotides prevented the redistribution of Nav1.8 into the sciatic nerve and reversed neuropathic pain (Lai et al., 2002).
Another conductive property that appears to be altered following nerve injury is activity-dependent slowing of conduction (i.e., the decrease in conduction velocity with repetitive stimulation). Activity-dependent slowing is altered in unmyelinated fibers in patients with erythromelagia (Ørstavik et al., 2003) and with diabetic neuropathy (H.O. Handwerker, personal communication) and in myelinated fibers in an animal model of neuropathic pain (Shin et al., 1997; Won et al., 1997). Unmyelinated afferents also can exhibit supranormal conduction in response to twin pulse stimuli of short (e.g., 50 ms) interstimulus intervals (Weidner et al., 2002; Bostock et al., 2003) where the conduction velocity of the second action potential is greater than that of the first. Whether supranormal conduction is altered after nerve injury is not known.
In this study, we investigated whether the conduction properties of uninjured, unmyelinated fibers in the L4 spinal nerve of the rat are altered following an L5 spinal nerve lesion. We found that activity-dependent slowing of conduction and supranormal conduction were significantly enhanced. These results provide additional evidence that the excitability of uninjured afferents is altered following a nerve injury.
2. Methods
2.1. Experimental animals
Forty-one male Sprague–Dawley rats (200–250 g) and six C57BL6 mice (25–30 g) were studied. Animals were placed in plastic cages with sawdust bedding and housed in a climate-controlled room under a 14/10 h light/dark cycle. The Johns Hopkins University Animal Care and Use Committee approved the experimental protocol.
2.2. Surgical procedures for producing the neuropathic pain model
Animals were randomly assigned to two different surgical groups: ligation and transection of L5 spinal nerve or sham. Two different time point groups were studied: postoperative day 8–10 or postoperative day 30.
Deep anesthesia was induced with 3% isoflurane and maintained at 2%. An incision was made above the lumbar spine, and the left transverse process of L6 vertebra was exposed. Removal of the L6 process exposed the ventral ramus of spinal nerves L4 and L5. The L5 mixed spinal nerve, just distal to the branching off of the dorsal primary ramus, was isolated, tightly ligated with 6-0 silk suture, and cut approximately 1 mm distal to the suture. For the sham surgery, the L5 ventral ramus was exposed but not ligated.
In subsequent electrophysiological experiments, the experimenters were blinded as to the treatment group of the animals to prevent bias. The individual anesthetizing the animals and harvesting the nerve for electrophysiological recordings was not involved in data collection. Once the nerve was harvested, the L5 ventral ramus was removed to ensure blinding of the experimenters. Typically, two recording experiments were done per week; one with the nerve from a sham-operated animal, and one with the nerve from the L5 SNL animal.
2.3. Surgical procedures for sympathectomy
In two rats, a sympathectomy was performed one week before the SNL surgery. Using an abdominal approach, the internal organs and fat tissue were retracted to approach the aorta, the vena cava, and the left psoas major muscle. Under a microscope, the left paravertebral sympathetic trunk, including the sympathetic chain to the right side, was visualized by gently retracting the psoas major muscle and resected from levels L2 to L6.
2.4. Electrophysiological procedures
Electrophysiological recordings from uninjured fibers in the L4 spinal nerve were performed either 8–10 days or 30 days following surgery. Only unmyelinated fibers with a conduction velocity less than 2 m s−1 (i.e., C fibers) were studied. An in vitro electrophysiological set-up was used to record single C-fiber activity from the L4 spinal nerve. Rats were deeply anesthetized with pentobarbital (50 mg/kg, i.p.), and sacrificed by cardiac puncture and subsequent perfusion with cold saline. The L4 spinal nerve in continuity with the tibial nerve was harvested, and placed in an organ bath. The nerve was bathed with synthetic interstitial fluid (SIF) consisting of (in mM) 107.7 NaCl, 3.48 KCl, 0.69 MgSO4, 26.2 NaHCO3, 1.67 NaH2PO4, 1.53 CaCl2, 9.64 sodium gluconate, 5.5 glucose, and 7.6 sucrose. The reservoir of SIF was continuously bubbled with a 95% O2–5% CO2 mixture to obtain a pH of 7.4. A roller pump (Gilson, model M312) was used to control the flow of SIF at a rate of 750 ml/h from the reservoir through a heat exchanger to the perfusion chamber. The heat exchanger was used to raise the temperature of the SIF to 33 °C.
The proximal end of the L4 spinal nerve was passed through a hole into a separate, mineral-oil-filled recording chamber. The nerve was placed on a platform, and the hole was sealed with petroleum jelly. The epineurium and perineurium were removed from the nerve, and small filaments were teased apart from the nerve. A small filament was placed on a silver electrode for extracellular recording.
The neural signal was differentially amplified, filtered, and digitized at a rate of 25 kHz. A real-time computer-based data acquisition and processing system (DAPSYS; Brian Turnquist, Johns Hopkins University) provided multiple window discriminators for real-time sorting of different action potential (AP) waveforms (for details, go to http://www.dapsys.net). In addition, all waveforms passing a selectable threshold level were saved for post hoc analysis. The recorded responses were time-indexed relative to stimulus delivery by the stimulus control software.
2.5. Determination of C-fiber threshold
The number of C-fiber waveforms observed at the recording electrode was determined in response to electrical stimulation of the tibial nerve (one pulse every 4 s). The stimulus strength was gradually increased, and each new C-fiber waveform was counted. For a given C fiber, the electrical threshold and latency at threshold were determined. In some cases, the latency decreased when the stimulus intensity increased. For these fibers, we determined the stimulus level at which the latency no longer decreased. All experiments were conducted at 50% above this threshold current.
2.6. Electrical stimulation
After determining the electrical threshold, we waited for 6 min before starting the stimulation protocol. We then stimulated the tibial nerve at 50% above threshold with 60 twin pulses for a total of 120 pulses (Fig. 1B). The interstimulus interval for the twin pulses was 50 ms. The twin pulses were delivered every 2 s. Only fibers that were entrained to the electrical stimulus were included in the analysis. We defined entrainment as at least 110 action potentials in response to the 120 stimuli in the train. Two minutes after completion of the train, an additional stimulus was delivered in order to investigate recovery. This time point was chosen because the time constant for recovery was expected to be around 1–2 min (Serra et al., 2004). Additional time points were not investigated, because this would require repeated presentations of the conditioning stimuli.
Fig. 1.
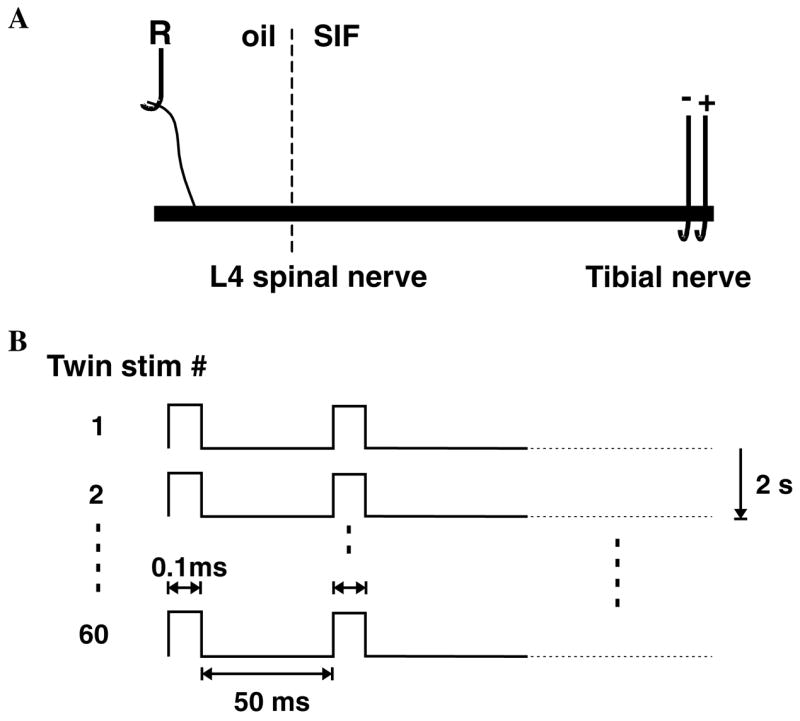
Experimental paradigm. (A) In vitro preparation. The L4 spinal nerve in continuity with the tibial nerve was excised and placed into a two chamber in vitro bath. In one oil-filled chamber, a small filament of the L4 spinal nerve was placed on a silver electrode for extracellular recording of action potential activity in single C fibers. In the other SIF perfused chamber, a suction electrode was applied to the distal end of the tibial nerve. (B) Stimulation protocol. Electrical stimulation consisted of twin pulses with an interstimulus interval of 50 ms that were applied every 2 s for a total of 60 twin pulses in the train. The latency of the electrically evoked action potential was used to measure how the conduction velocity varied with repeated stimulation.
2.7. Statistical analysis
We used parametric and non-parametric analyses where appropriate. Data are presented as means ± SEM. For comparison of two surgical groups (i.e., lesion or sham) Student’s t tests and χ2 tests were used.
3. Results
Electrophysiological experiments were performed on 41 rats. Thirty-one animals were studied 8–10 days postoperatively, while 10 were studied on postoperative day 30. Teased fiber recordings were performed from C fibers of the L4 spinal nerve in response to electrical stimulation of the tibial nerve. For the postoperative day 8–10 group, recordings were made from 404 C fibers; 156 C fibers from lesioned animals and 248 C fibers from sham-operated animals. For the postoperative day 30 group, recordings were made from 135 C fibers; 73 C fibers from lesioned animals and 62 C fibers from sham-operated animals. The mean conduction velocities of the sham (0.62 ± 0.01 m s−1) and lesioned (0.63 ± 0.01 m s−1) animals did not differ. The proportion of fibers that did not become entrained to the stimulation sequence was not different between the lesioned animals (19%) and the sham operated animals (25%).
3.1. Parameters to assess the activity-dependent conduction properties of C fibers
To investigate activity-dependent changes in the conduction properties of C fibers recorded from the L4 spinal nerve, we electrically stimulated the tibial nerve with a fixed pattern of electrical pulses (Fig. 1). This stimulation pattern allowed us to investigate the activity-dependent slowing phenomenon that occurs with repeated electrical stimuli as well as the supranormal conduction (or “speeding” of conduction) that can occur at short (e.g., 50 ms) stimulus intervals.
In response to the twin electrical pulses, two action potentials are initiated. For reasons of clarity, we call the first action potential (AP) the leading AP, and the second AP the trailing AP. We assigned this nomenclature regardless of the fact that during an ongoing trial the leading AP of a twin pulse may follow the trailing AP of the previous twin pulse.
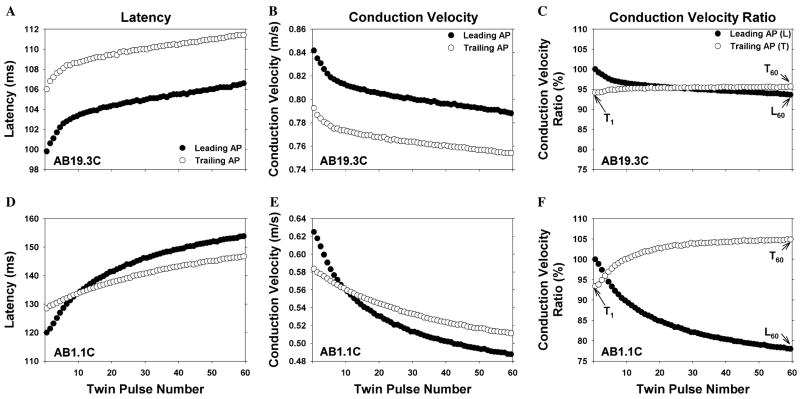
The responses of two different C fibers to this electrical stimulation protocol are illustrated in Fig. 2. Each row corresponds to a different C fiber. The left-hand column illustrates the measured AP latencies for each AP in the trial. The middle column shows the same data expressed as conduction velocity (i.e., conduction distance divided by latency). The right-hand column illustrates conduction velocity ratios that were computed for each fiber (to be described below); these ratios produced a normalization of the data that facilitated comparisons across fibers.
Fig. 2.
Changes in conduction velocity during repeated electrical stimulation. Each row corresponds to a different C fiber. The left column is a plot of action potential latency as a function of twin pulse number, the middle column is the same data converted to conduction velocity, and the right column is the same data normalized by the conduction velocity of the first action potential (see text for normalization procedure). The data obtained from the leading action potential (filled circle) and trailing action potential (open circle) for the twin pulse stimulus are plotted separately. For each fiber, the conduction velocity decreased during the stimulus train, but the degree of this activity-dependent slowing varied (note the different scales for each fiber). In addition, the pattern of changes in the conduction velocity for the trailing AP relative to the leading AP was different for each of these fibers. For comparison across fibers, the three values illustrated in C were computed for each fiber. L60 is the conduction velocity of the last leading AP divided by the conduction velocity of first leading AP. T1 is the conduction velocity of the first trailing AP divided by the conduction velocity of first leading AP. T60 is the conduction velocity of the last trailing AP divided by the conduction velocity of the last leading AP.
All fibers in this study exhibited activity-dependent slowing of conduction; the conduction velocity of the last leading AP was always less than the conduction velocity of the first leading AP (filled symbols). However, the amount of activity-dependent slowing varied greatly. For these two examples, the fiber in the bottom row showed much more activity-dependent slowing than the fiber in the top row. These patterns also differed in how the conduction in the trailing AP (open symbols) compared to the conduction in the leading AP (filled symbols). For the first fiber (top row), the conduction velocity of the trailing AP was always slower than that of the leading AP. For the second fiber (bottom row), the conduction velocity of the trailing AP was initially slower than the conduction velocity of the leading AP, but became faster than the conduction velocity of the leading AP by the end of the trial. This increase in conduction velocity at short interstimulus intervals is often referred to as supranormal conduction or speeding. The conduction velocity of the trailing AP is greater than that of the leading AP, but not greater than the CV of the very first AP (so there is a speeding of conduction relative to the immediately preceding AP, but not an absolute speeding of conduction).
To investigate activity-dependent slowing of conduction, we determined how the conduction velocity of the leading AP changed from the first to the last twin pulse. To compare across fibers, we normalized the data by computing the relative conduction velocity of the leading AP for each twin pulse, which we defined as conduction velocity of the leading AP for a given twin pulse divided by the conduction velocity of the leading AP for the 1st twin pulse. We designated this normalized conduction velocity for the leading AP with the symbol L. An L less than 100% indicates a slowing of conduction.
| (1) |
where cvL,n is the conduction velocity of the leading AP of the nth twin pulse, n is the twin pulse number (range: 1–60), and cvL,1 = conduction velocity of the leading AP of the 1st twin pulse.
To investigate whether a speeding of conduction velocity occurs between the trailing AP and the leading AP within twin pulses, we computed the relative conduction velocity of the trailing AP which, for a given twin pulse, is defined as the conduction velocity of the trailing AP divided by the conduction velocity of its leading AP and is designated by the symbol T. A T greater than 100% indicates that the trailing AP has a faster conduction velocity than its leading AP (i.e., speeding of conduction).
| (2) |
where cvT,n is the conduction velocity of the trailing AP of the nth twin pulse.
A plot of the L and T functions for each of the fibers is shown in the right column of Fig. 2. Since L and T are normalized data for each fiber, they can be used for comparisons across fibers. We used three parameters to characterize the activity-dependent changes in conduction velocity. As a measure of “activity-dependent slowing,” we computed L for the 60th twin pulse (L60). To quantify a possible supranormal conduction that might exist or develop during the trial, we determined the relative conduction velocity of the first and last trailing AP (i.e., T1 and T60). These measures are illustrated in Fig. 2C. In the following text, ”relative conduction velocity” is called “rCV” in order to keep the text simple.
3.2. Activity-dependent conduction velocity changes reveal two distinct populations of fibers
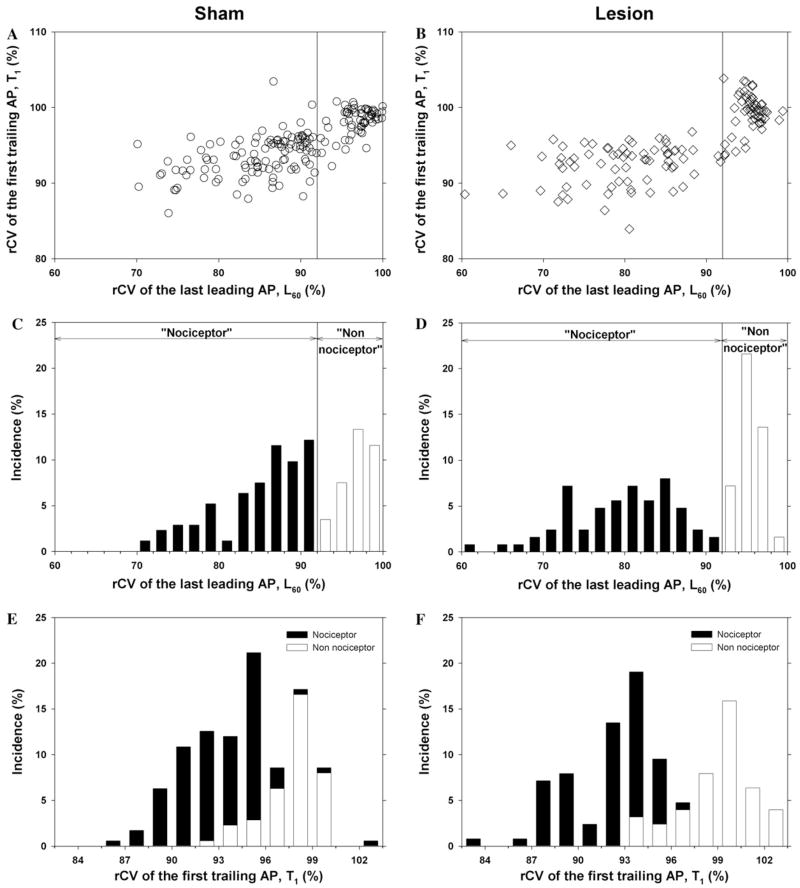
A scatter plot of the rCV of the first trailing AP (T1) versus the rCV of the last leading AP (L60) for all of the fibers from the sham rats at 8–10 days after surgery is shown in Fig. 3A. Two distinct clusters are apparent. One cluster is in the upper right portion of the figure. Fibers in this cluster show little activity-dependent slowing; the conduction velocity of the last leading AP is between 92% and 100% of the conduction velocity of the first leading AP (i.e., L60 ≥ 92%). For many fibers in this cluster, the conduction velocity of the trailing AP in the first twin pulse is faster than the conduction velocity of the leading AP (i.e., T1 ≥ 100%). The other cluster is in the left portion of Fig. 3A. Fibers in this cluster show a substantial decrease in conduction at the end of the trial; they have pronounced activity-dependent slowing (i.e., L60 ≤ 92%). In addition, the conduction velocity of the trailing AP for the first twin pulse stimulus is usually less than the conduction velocity of the leading AP (i.e., T1 ≤ 100%). These clusters are perhaps more apparent in the scatter plot for all of the fibers from the lesioned rats at 8–10 days after surgery (Fig. 3B).
Fig. 3.
Conduction velocity parameters reveal two populations of C fibers. The left column corresponds to data obtained in sham-operated animals and the right column corresponds to data obtained 8–10 days after an L5 SNL. (A and B) Scatter plots of the rCV of the first trailing AP (T1) versus the rCV of the last leading AP (L60). Each dot is a different fiber. Two populations are apparent and can be separated by a vertical line drawn at 92%. The cluster to the right of the line has less activity-dependent slowing of the leading AP than the cluster to the left. Since nociceptors are thought to have more activity-dependent slowing than other classes of fibers, we have labeled the left cluster as the “nociceptor” cluster and the right cluster as the “non-nociceptor” cluster. (C and D) Histograms of the rCV of the last leading AP (L60) for the sham and lesioned animals. The bimodal appearance with a minimum at 92% of these histograms is consistent with the presence of two distinct populations. The histogram for the lesioned animals (D) is shifted to the left and broadened compared to the histogram for the sham animals (C). Thus, the fibers from the lesioned animals appear to have more activity-dependent slowing than those from the sham animals. (E and F) Histograms of rCV of the first trailing AP for the sham and lesioned animals. For the sham animals, the distributions for the “nociceptor” (open bars) and “non-nociceptor” (filled bars) populations are slightly overlapping. For the lesioned animals, the “non-nociceptor” distribution shifts to the right, and the “nociceptor” distribution shifts to the left.
Histograms of the rCV of the last leading AP (L60) and the first trailing AP (T1) for the sham and lesioned animals are shown in Figs. 3C–F. The bimodal appearance of these histograms is consistent with the presence of two distinct populations. Other investigators have reported that different classes of unmyelinated nerve fibers in the rat exhibit different amounts of activity-dependent slowing; low levels of activity-dependent slowing are associated with sympathetics, mechanoreceptors, and cold fibers, whereas high levels of activity-dependent slowing are associated with nociceptors (Raymond et al., 1990; Gee et al., 1996). Based on these studies, we have used activity-dependent slowing to separate our data into two populations. Fibers with pronounced activity-dependent slowing (L60 ≤ 92%) are in the presumed “nociceptor” population; fibers with little activity-dependent slowing (L60 ≥ 92%) are in the presumed “non-nociceptor” population. For the two examples in Fig. 2, the fiber in the top row is from the “non-nociceptor” population, and the fiber in the bottom row is from the “nociceptor” population.
3.3. Nerve lesion leads to changes in conduction properties of uninjured afferents
Eight to ten days following an L5 spinal nerve injury, the conduction properties in uninjured fibers of the L4 spinal nerve had changed. Inspection of the scatter plot in Fig. 3B (and histogram in Fig. 3D) reveals that the cluster for the “nociceptor” population appears to have moved to the left and broadened in comparison to Fig. 3A (and Fig. 3C). As indicated in Fig. 4A, the total population of fibers showed enhanced activity-dependent slowing. This enhanced activity-dependent slowing after the lesion was seen in both populations. The average L60 in the “nociceptor” population decreased significantly from 84.8 ± 0.5% in the control animals to 79.6 ± 0.8% in the lesioned animals (p ≤ 0.001). Thus, the actual amount of slowing increased from 15.2% to 20.4% (or by a factor of about 1.3). Similarly, the average L60 in the “non-nociceptor” population decreased from 97.1 ± 0.3% to 95.5 ± 0.2% (p ≤ 0.001), and the amount of slowing increased from 2.9% to 4.5% (or by a factor of about 1.5).
Fig. 4.
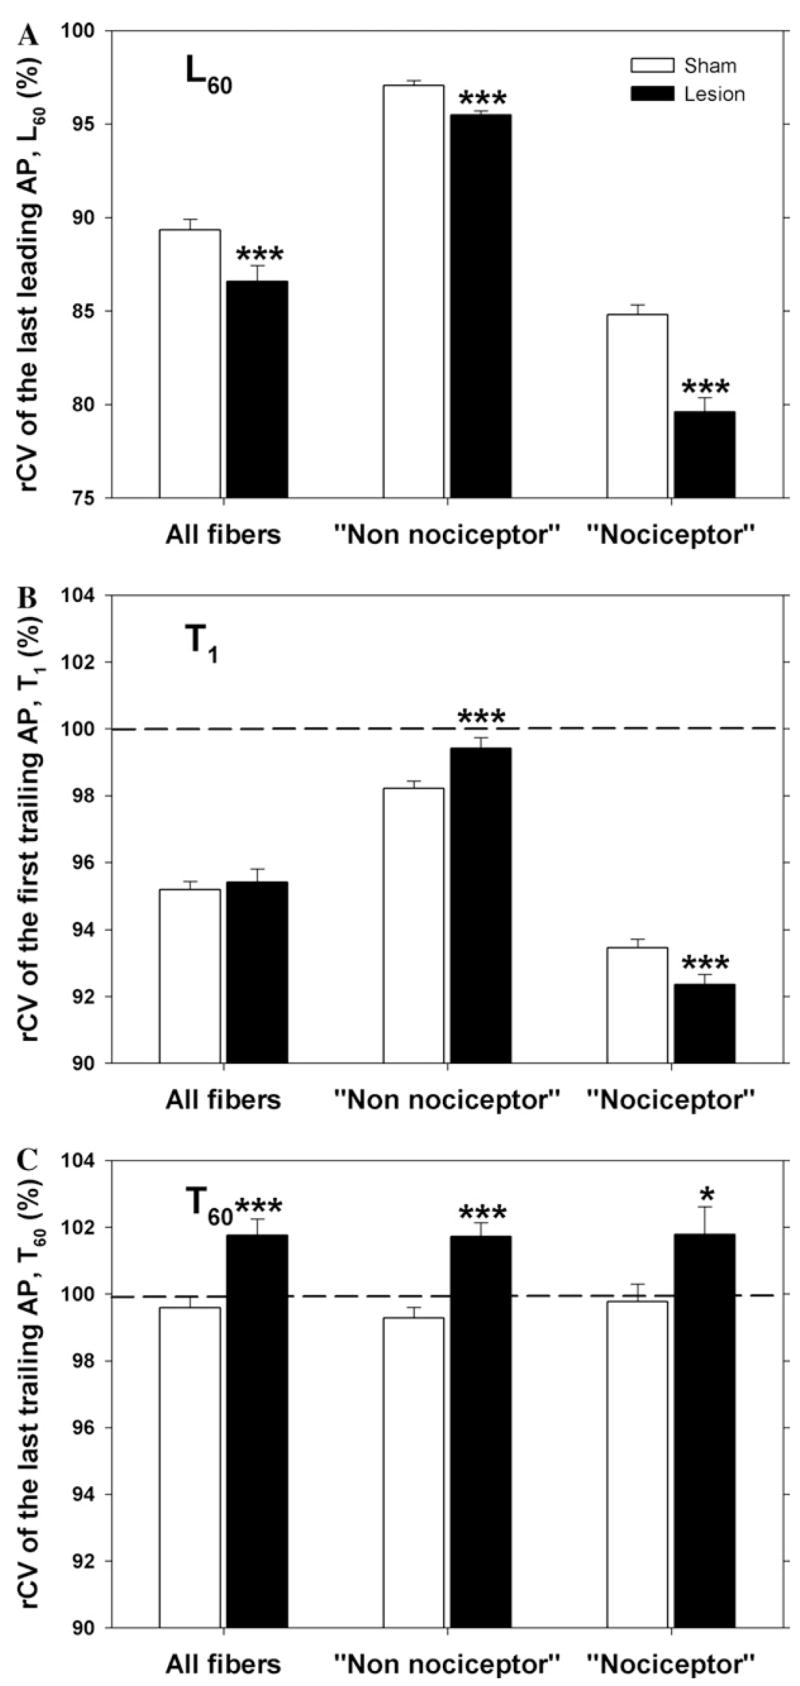
Conduction velocity properties of uninjured C fibers of the L4 spinal nerve are changed after L5 spinal nerve injury. (A) Activity-dependent slowing is enhanced after the lesion. The rCV of the last leading AP (L60) is significantly lower in the lesioned animals for both the “nociceptor” and the “non-nociceptor” population. (B) The rCV of the first trailing AP (T1) in the lesioned animals is significantly greater in the “non-nociceptor” population but significantly lower in the “nociceptor” population. (C) The rCV of the last trailing AP (T60) is significantly greater in the lesioned animals for both the “nociceptor” and the “non-nociceptor” population. All data taken from animals 8–10 days after sham or SNL surgery. (***p < 0.001; *p < 0.05; lesioned versus sham).
As indicated in Fig. 4B, the rCV of the first trailing AP (T1) did not change significantly after the lesion for the total population of fibers. This is because the changes in the two populations were in opposite directions. The average T1 increased significantly in the “non-nociceptor” population (from 98.2 ± 0.2% to 99.4 ± 0.3%, p ≤ 0.005) but decreased significantly in the “nociceptor” population (from 93.5 ± 0.3% to 92.4 ± 0.3%, p ≤ 0.01).
The relative conduction velocity of the trailing AP increased during the train stimulation for the two examples in Fig. 2. This was also true for the population of fibers in both lesioned and sham animals. This can be seen by comparing Figs. 4B and C, where it is apparent that T60 is greater than T1 for lesioned and sham animals. However, the rCV of the last trailing AP (T60) increased after the lesion (Fig. 4C). The average T60 increased significantly in both the “nociceptor” population (from 99.8 ± 0.5% to 101.8 ± 0.8%, p ≤ 0.05) and the “non-nociceptor” population (from 99.3 ± 0.3% to 101.7 ± 0.4%, p ≤ 0.001).
Thus, uninjured fibers originating from the L4 spinal nerve show marked changes in conduction properties after injury to the adjacent L5 spinal nerve. There is enhanced activity-dependent slowing (L60) and enhanced speeding (T60) at the end of the trial in both the “nociceptor” and “non-nociceptor” population. There is enhanced initial speeding (T1) in the “non-nociceptor” population but decreased initial speeding in the nociceptor population.
Similar results were observed in data collected from animals 30 days after sham surgery or an L5 SNL. The “nociceptor” population showed enhanced activity-dependent slowing. The L60 was significantly lower in lesioned (77.9 ± 1.0%, n = 73) than in sham operated animals (83.7 ± 1.1%, n = 62, p ≤ 0.001).
3.4. Weak correlation between activity-dependent slowing and conduction velocity
The conduction velocities for the fibers from the sham operated and L5 spinal nerve lesioned animals were similarly distributed (Fig. 5A), suggesting that the lesion did not affect the conduction velocity in the absence of neural activity. A scatter plot of the rCV of the last leading AP (L60) versus conduction velocity (Fig. 5B and C) reveals that the amount of activity-dependent slowing that occurred in the nociceptor population was weakly correlated with the conduction velocity. This was true for both the sham group (Fig. 5B) and the lesion group (Fig. 5C). Thus, slower conducting axons showed more activity-dependent slowing, as previously described in human (Weidner et al., 1999).
Fig. 5.
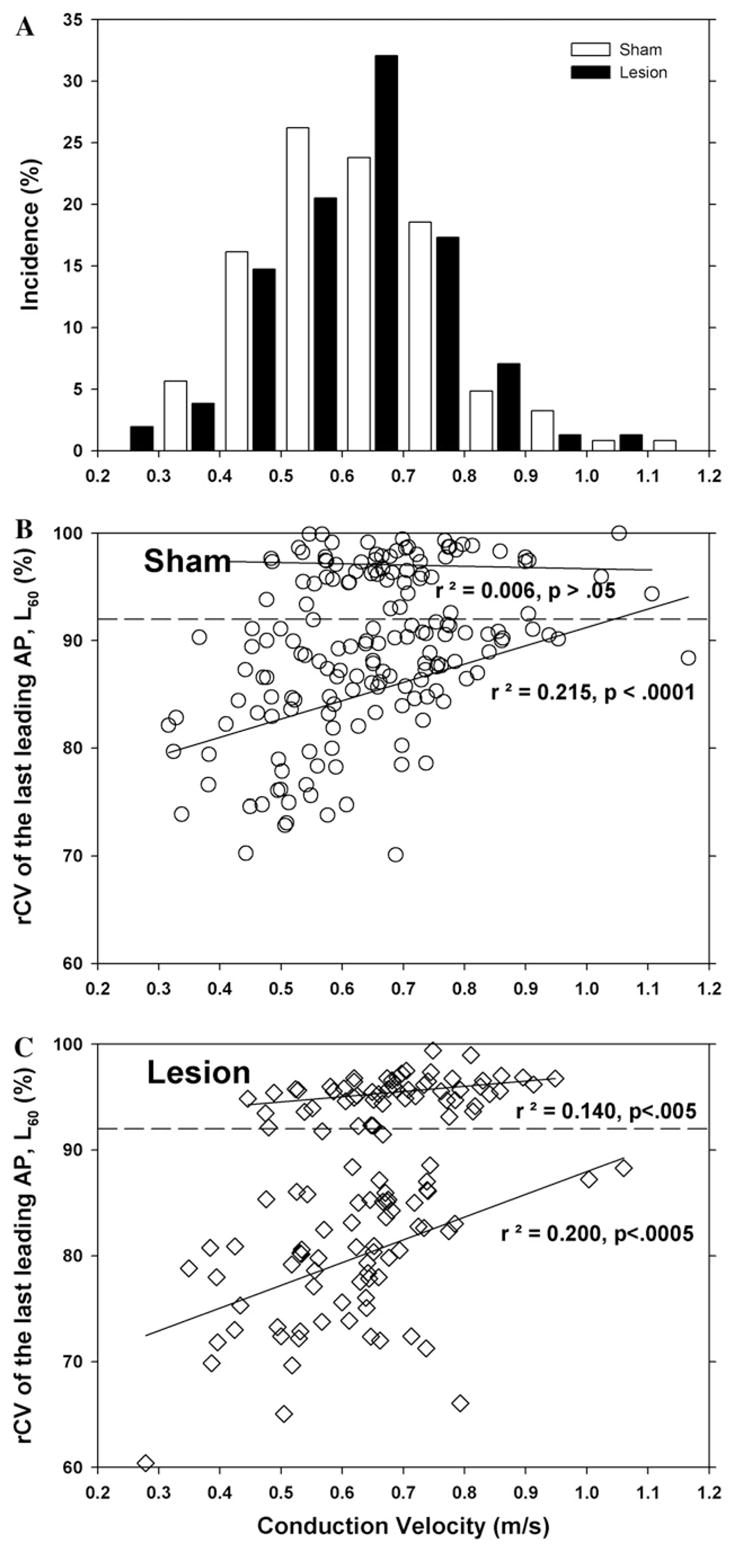
Activity-dependent slowing is weakly correlated with conduction velocity. (A) Conduction velocity distribution. The initial conduction velocities of the fibers from the sham (open bars) and nerve lesioned (filled bars) animals were not significantly different. (B and C) Scatter plots of rCV of the last leading AP (L60) as a function of conduction velocity for the sham and lesioned animals. For the “nociceptor” population, the amount of activity-dependent slowing increased as the conduction velocity decreased. There was no correlation for the non-nociceptor population. All data for fibers from rats at 8–10 days after sham surgery (B) and L5 spinal nerve lesion (C).
3.5. rCV of last trailing AP is correlated with rCV of last leading AP
From the scatter plots in Fig. 3A and B, it is apparent that the rCV of the first trailing AP (T1) is not correlated with the rCV of the last leading AP (L60). Additional scatter plots were used to determine whether the rCV of the last trailing AP (T60) was correlated with the rCV of the last leading AP (L60) (Fig. 6). For the “non-nociceptor” population, there was no correlation. In contrast, for the “nociceptor” population, the rCV of the last trailing AP (T60) was weakly correlated with the rCV of the last leading AP (L60). This was true for nerve lesioned and sham operated animals.
Fig. 6.
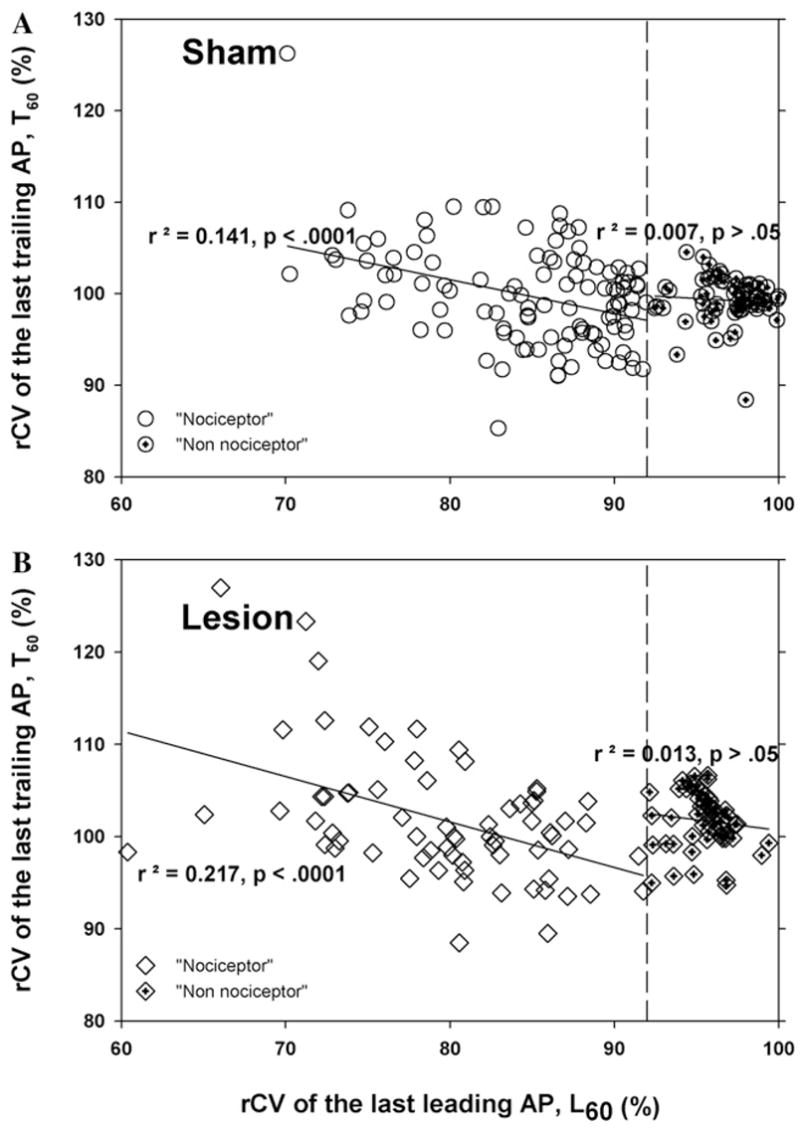
Supranormal conduction in the nociceptive population is weakly correlated with the amount of activity-dependent slowing. A scatter plot of the rCV of the last trailing AP (T60) versus the rCV of the last leading AP (L60) for all of the fibers from the rats at 8–10 days after surgery (A. sham group; B, lesion group). For the “nociceptor” population, there was a weak correlation between T60 and L60. In contrast, there was no correlation for the “non-nociceptor” population.
3.6. Time course for recovery
As a measure of how fast the conduction velocity recovered from the slowing induced by the train of stimuli, we measured the conduction latency two minutes after completion of the stimulus train. As a first order approximation, the recovery time constant was computed assuming a single exponential decay according to the following equation:
| (3) |
where LR(t) is the latency to the recovery test pulse as a function of time after completion of the stimulus train, and τ is the time constant for recovery.
This equation was evaluated at t = 2 min. As shown in Fig. 7, the recovery time constant for the nociceptor fibers in the lesioned animals (93 ± 6 s, n = 59) was not significantly different from the fibers in the sham animals (112 ± 10 s, n = 87, p > 0.5). Data were not computed for the non-nociceptor population because many fibers had a very small amount of slowing, leading to a large noise in the calculation.
Fig. 7.
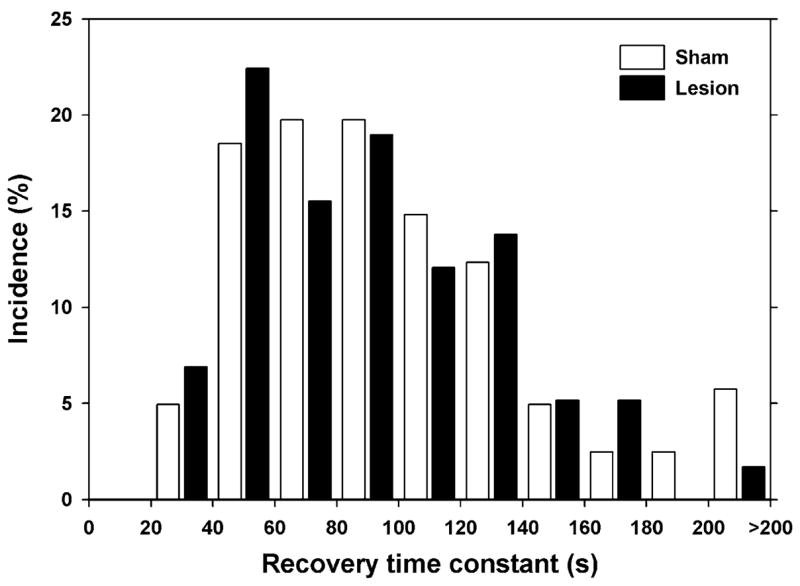
Time constant for recovery from activity-dependent slowing is not changed by lesion. Recovery time was computed based on latency measurements made 2 min after completion of the stimulus train.
3.7. Sympathectomy decreases the number of fibers in the “non-nociceptor” population
A sympathectomy was performed on two animals one week before the L5 spinal nerve injury. Eight to ten days after the SNL, electrophysiological recordings were made from uninjured C fibers in the L4 spinal nerve. As expected, the proportion of fibers in the “non-nociceptor” group was significantly lower in the sympathectomized animals (SNL: 55/125 versus SNL plus sympathectomy: 2/18, p ≤ 0.01, χ2).
3.8. Nerve lesion in mice produces similar changes in conductive properties
Since genetic manipulations could be made in mice to investigate the mechanisms of this enhanced activity-dependent slowing, we investigated whether the conductive properties of uninjured nerve fibers were altered in mice 8–10 days following an L5 spinal nerve ligation or sham surgery. Scatter plots of the rCV of the first trailing AP versus the rCV of the last leading AP for the sham and lesioned animals are shown in Figs. 8A and B. As with the rats, the mice showed significantly more activity-dependent slowing after the lesion; the L60 decreased significantly (sham: 94.9 ± 0.8%; lesioned: 89.0 ± 1.8%, p < 0.005; Fig. 8C). As with rats, there also appeared to be two clusters in the scatter plots, but for mice the dividing point was at a value of 95% for the rCV of the last leading AP. The “nociceptor” population in mice also exhibited a significantly enhanced activity-dependent slowing after the lesion.
Fig. 8.
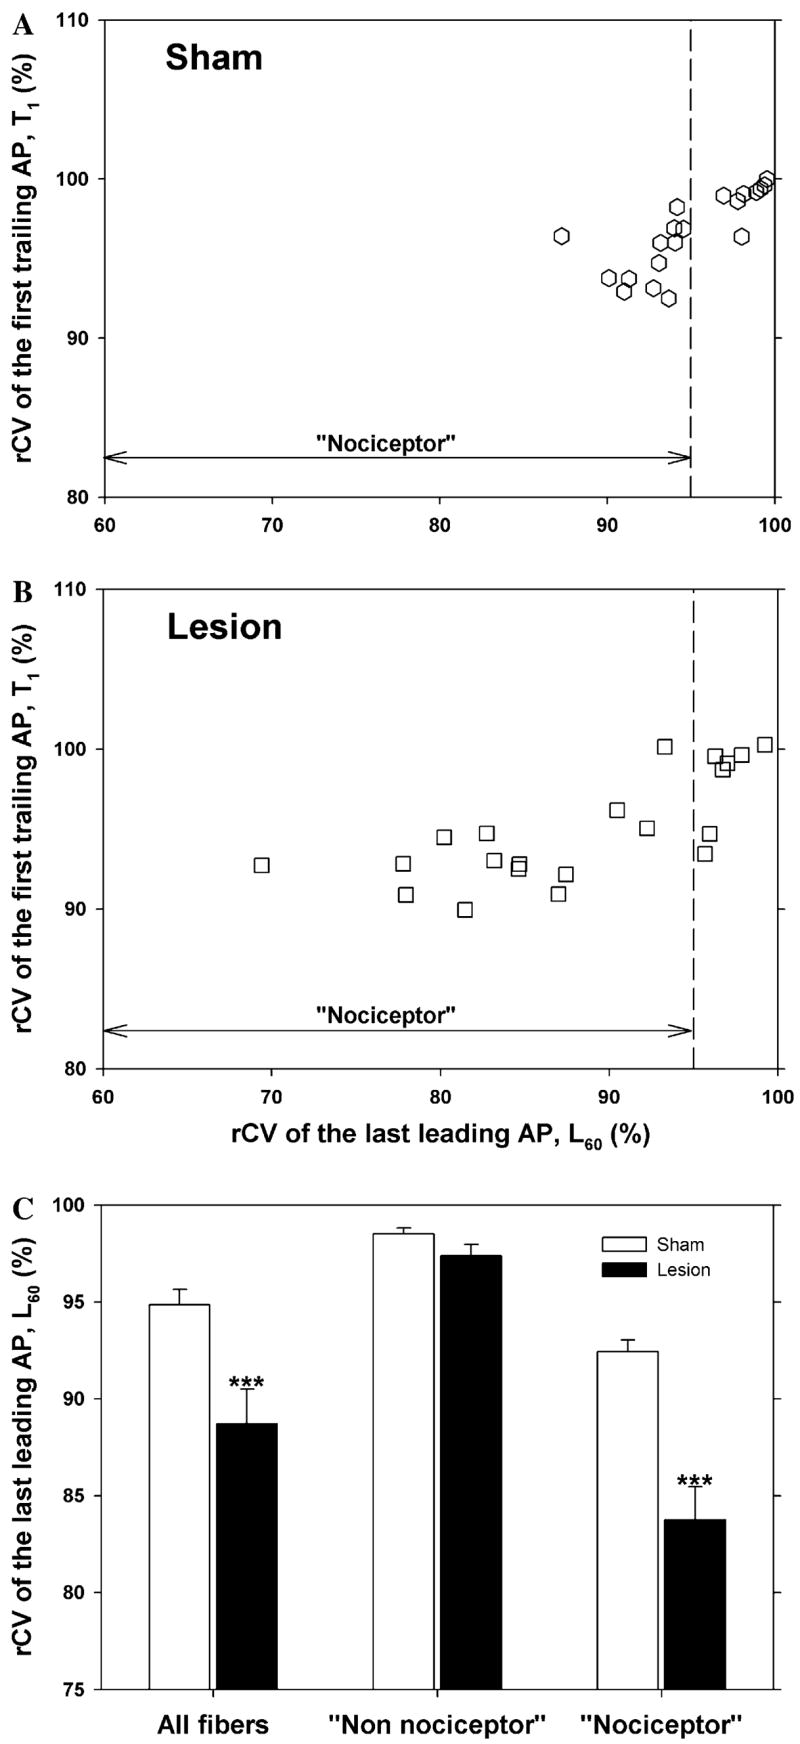
An L5 SNL lesion in mouse leads to enhanced activity-dependent slowing of uninjured C fibers in the L4 spinal nerve. (A and B) Scatter plots of the rCV of the first trailing AP (T1) versus the rCV of the last leading AP (L60). Format similar to Fig. 3. Two populations are apparent and can be separated by a vertical line drawn at 95%. (C) The rCV of the last leading AP (L60) is significantly lower in the lesioned animals for the “nociceptor” population (***p < 0.001; lesioned versus sham).
4. Discussion
This is the first time that nerve-injury induced changes of activity-dependent conductive properties of uninjured C fibers have been investigated. We found that activity-dependent slowing of conduction was significantly enhanced in uninjured fibers in the L4 spinal nerve after an L5 spinal nerve lesion compared to sham surgery. This alteration in conduction may reflect changes in expression of ion channels responsible for the membrane excitability.
4.1. Two populations of fibers based on activity-dependent slowing
Previous investigators have noted that nociceptive C fibers have significantly greater slowing than cold fibers, mechano-receptors, and sympathetic efferents (Thalhammer et al., 1994; Gee et al., 1996; Serra et al., 1999). All fibers in our study exhibited activity-dependent slowing of conduction. A histogram of activity-dependent slowing at the end of the trial revealed two distinct populations of fibers. One group exhibited a large amount of slowing, with conduction velocities at the end of the trial less than 92% of the initial conduction velocities; we presumed that this population corresponded to the nociceptors. The other group showed significantly less slowing, with conduction velocities at the end of the trial ranging from 92% to 100% of the initial conduction velocities; we presumed that this population corresponded to the cold fibers, mechanoreceptors, and sympathetics. Our finding that a sympathectomy significantly reduced the proportion of fibers in this low activity-dependent slowing group is consistent with this presumption. Activity-dependent slowing has also been found to differ between mechanically insensitive (MIA) and mechanically sensitive (MSA) C-fiber afferents in human nerves (Weidner et al., 1999). Two distinct sub-groups within our nociceptor group were not apparent. This could mean that: (1) MIAs are rare in rat (Lynn, 1991), (2) activity-dependent slowing does not differ between MIAs and MSAs in rat, and/or (3) the difference in activity-dependent slowing between MIAs and MSAs occurs mainly in the distal, cutaneous arbors of the nerve which were excluded in our in vitro preparation.
4.2. Enhanced activity-dependent slowing of uninjured C fibers after a nerve injury
We show that uninjured C fibers in the L4 spinal nerve exhibit increased activity-dependent slowing following an L5 spinal nerve injury in the rat relative to sham treated controls. The increased slowing was apparent in both the nociceptor and non-nociceptor C-fiber population. Increased activity-dependent slowing in injured (but not uninjured) myelinated fibers following an SNL was previously reported in a rat model of neuropathy (Shin et al., 1997; Won et al., 1997). Since the L5 SNL procedure can produce upregulation of activating transcription factor 3 (ATF3), a neuronal injury marker, and other injury markers (e.g. NPY, galanin) in neighboring L4 DRG neurons (Shortland et al., 2006), the changes in activity-dependent slowing that we observed could be due to an unintentional damage of L4 neurons. We believe that this is unlikely, however, since we compared nerve lesioned animals with sham operated animals, and the unintentional damage to L4 neurons is similar in L5 lesioned and sham operated animals (Shortland et al., 2006).
Several mechanisms may be involved in enhancing activity-dependent slowing in uninjured C fibers. Activity-dependent slowing is thought to be due to prolonged hyperpolarization induced by the electrogenic Na+/K+ pump (Rang and Ritchie, 1968). This pump is driven by intracellular sodium concentration. Thus, the enhanced slowing after a lesion could be due to an alteration in sodium channel kinetics that lead to enhanced intracellular sodium at the end of an action potential or due to an alteration in the pump itself. Our observation that the time constant for recovery from slowing was not changed would argue against an alteration in the pumping mechanism. In mammalian myelinated axons, the late hyperpolarising after-potential appears to be due to activation of slow K+ channels (Baker et al., 1987).
Activity-dependent slowing may also be related to the Ih current, since blockade of Ih with cesium or ZD7288 leads to enhanced activity-dependent slowing (Grafe et al., 1997; Takigawa et al., 1998). A decrease in Ih has been inferred in patients with diabetic neuropathy (Horn et al., 1996) and in an animal model of diabetic neuropathy (Yang et al., 2001). Our observed increase in activity-dependent slowing would be consistent with a decrease in the Ih current. In contrast, Chaplan et al. (2003) found that Ih was increased in injured neurons and that administration of ZD7288 reversed neuropathic pain behavior.
Another possible explanation for the increased activity-dependent slowing is that the milieu surrounding the axons has changed. For example, Remak bundles in the peripheral nerve are partially denervated by an L5 SNL (B.B. Murinson, personal communication). The ability of the partially denervated Schwann cells to buffer extracellular ionic activity produced by the surviving axons may be altered. This would not explain the opposing effects on rCV of the first trailing AP between nociceptors and non-nociceptors (Fig. 4B).
We currently do not know which of these mechanisms underlies the increased slowing in uninjured C fibers. However, since enhanced slowing was also observed in mouse, future studies in genetically manipulated mice can be pursued to examine underlying mechanisms.
4.3. Enhanced supernormal conduction
In normal nerves, supranormal conduction can be observed in C fibers at short (e.g., 50 ms) interstimulus intervals. Strong evidence suggests that this supranormality is due to a depolarizing charge on the neural membrane which decays with a time constant associated with the membrane capacitance/resistance (Weidner et al., 2002; Bostock et al., 2003). The amount of supranormality has been shown to increase as activity-dependent slowing increases (Weidner et al., 2002). Therefore, it is not surprising that we found enhanced supranormal conduction after the lesion since there is enhanced activity-dependent slowing. However, the supranormal conduction was only weakly correlated with the activity-dependent slowing (Fig. 6). This suggests that other mechanisms may play a role in the development of the enhanced supranormal conduction that is observed after a lesion.
One possibility is that the magnitude of the depolarizing charge is enhanced. This could happen if the properties of the voltage-activated sodium and/or potassium channels have changed. A potential candidate is the Nav1.8 channel, since the expression of Nav1.8 in the peripheral nerve has been shown to increase after an L5 SNL (Lai et al., 2002; Gold et al., 2003). In addition to the increased supranormal conduction, an enhanced sodium current could increase the activity of the sodium potassium pump which would in turn lead to hyperpolarization and an increase in activity-dependent slowing. Increased supranormal conduction and activity-dependent slowing may therefore both reflect hyperexcitability.
4.4. Role of conduction velocity changes in neuropathic pain
One might expect that enhanced slowing of conduction would be associated with a decrease in membrane excitability. If so, what role does it have in the enhanced responsiveness of nociceptor terminals and the development of spontaneous activity? Doan et al. (2004) showed that elimination of Ih increases excitability of the peripheral terminals of myelinated fibers; this was presumably due to an increase in the input resistance of the membrane which would produce a larger depolarization for a given depolarization current. If the enhanced slowing observed in the uninjured afferents is due to a decrease in Ih, the enhanced slowing could be a sign of enhanced excitability of the receptor terminals. The enhanced supranormal conduction could result in an increase in the instantaneous frequency of a burst discharge when it reaches the spinal cord. Since the release of certain neuropeptides is frequency dependent (Lever et al., 2001), this could lead to an augmentation of the post-synaptic response. It may be that the enhanced slowing does not lead to a behavioral phenotype. Regardless, the observation that uninjured afferents show more slowing than injured afferents adds to the body of evidence indicating that changes occur in uninjured nerves following a nerve injury.
Acknowledgments
We thank Drs. Lisa Johanek and Beth Murinson for helpful comments throughout this project. We greatly appreciate the assistance of Ms. Sylvia Horasek. This research was supported by the Johns Hopkins Blaustein Pain Research Fund and the National Institutes of Health (NS 41269, NS 14447).
References
- Ali Z, Ringkamp M, Hartke TV, Chien HF, Flavahan NA, Campbell JN, et al. Uninjured C-fiber nociceptors develop spontaneous activity and alpha adrenergic sensitivity following L6 spinal nerve ligation in the monkey. J Neurophysiol. 1999;81:455–66. doi: 10.1152/jn.1999.81.2.455. [DOI] [PubMed] [Google Scholar]
- Baker M, Bostock H, Grafe P, Martius P. Function and distribution of three types of rectifying channel in rat spinal root myelinated axons. J Physiol. 1987;383:45–67. doi: 10.1113/jphysiol.1987.sp016395. [DOI] [PMC free article] [PubMed] [Google Scholar]
- Bostock H, Campero M, Serra J, Ochoa J. Velocity recovery cycles of C fibres innervating human skin. J Physiol. 2003;553:649–63. doi: 10.1113/jphysiol.2003.046342. [DOI] [PMC free article] [PubMed] [Google Scholar]
- Chaplan SR, Guo HQ, Lee DH, Luo L, Liu C, Kuei C, et al. Neuronal hyperpolarization-activated pacemaker channels drive neuropathic pain. J Neurosci. 2003;23:1169–78. doi: 10.1523/JNEUROSCI.23-04-01169.2003. [DOI] [PMC free article] [PubMed] [Google Scholar]
- Devor M. Response of nerves to injury in relation to neuropathic pain. In: McMahon MKS, editor. Wall & Melzack’s Textbook of Pain. London: Elsevier; 2005. pp. 905–27. [Google Scholar]
- Djouhri L, Koutsikou S, Fang X, McMullan S, Lawson SN. Spontaneous pain, both neuropathic and inflammatory, is related to frequency of spontaneous firing in intact C-fiber nociceptors. J Neurosci. 2006;26:1281–92. doi: 10.1523/JNEUROSCI.3388-05.2006. [DOI] [PMC free article] [PubMed] [Google Scholar]
- Doan TN, Stephans K, Ramirez AN, Glazebrook PA, Andresen MC, Kunze DL. Differential distribution and function of hyperpolarization-activated channels in sensory neurons and mechanosensitive fibers. J Neurosci. 2004;24:3335–43. doi: 10.1523/JNEUROSCI.5156-03.2004. [DOI] [PMC free article] [PubMed] [Google Scholar]
- Fukuoka T, Kondo E, Dai Y, Hashimoto N, Noguchi K. Brain-derived neurotrophic factor increases in the uninjured dorsal root ganglion neurons in selective spinal nerve ligation model. J Neurosci. 2001;21:4891–900. doi: 10.1523/JNEUROSCI.21-13-04891.2001. [DOI] [PMC free article] [PubMed] [Google Scholar]
- Fukuoka T, Tokunaga A, Tachibana T, Dai Y, Yamanaka H, Noguchi K. VR1, but not P2X3, increases in the spared L4 DRG in rats with L5 spinal nerve ligation. Pain. 2002;99:111–20. doi: 10.1016/s0304-3959(02)00067-2. [DOI] [PubMed] [Google Scholar]
- Gee MD, Lynn B, Cotsell B. Activity-dependent slowing of conduction velocity provides a method for identifying different functional classes of C-fibre in the rat saphenous nerve. Neuroscience. 1996;73:667–75. doi: 10.1016/0306-4522(96)00070-x. [DOI] [PubMed] [Google Scholar]
- Gold MS, Weinreich D, Kim CS, Wang R, Treanor J, Porreca F, et al. Redistribution of Na(V)1.8 in uninjured axons enables neuropathic pain. J Neurosci. 2003;23:158–66. doi: 10.1523/JNEUROSCI.23-01-00158.2003. [DOI] [PMC free article] [PubMed] [Google Scholar]
- Grafe P, Quasthoff S, Grosskreutz J, Alzheimer C. Function of the hyperpolarization-activated inward rectification in nonmyelinated peripheral rat and human axons. J Neurophysiol. 1997;77:421–6. doi: 10.1152/jn.1997.77.1.421. [DOI] [PubMed] [Google Scholar]
- Horn S, Quasthoff S, Grafe P, Bostock H, Renner R, Schrank B. Abnormal axonal inward rectification in diabetic neuropathy. Muscle Nerve. 1996;19:1268–75. doi: 10.1002/mus.880191002. [DOI] [PubMed] [Google Scholar]
- Hudson LJ, Bevan S, Wotherspoon G, Gentry C, Fox A, Winter J. VR1 protein expression increases in undamaged DRG neurons after partial nerve injury. Eur J Neurosci. 2001;13:2105–14. doi: 10.1046/j.0953-816x.2001.01591.x. [DOI] [PubMed] [Google Scholar]
- Kim SH, Chung JM. An experimental model for peripheral neuropathy produced by segmental spinal nerve ligation in the rat. Pain. 1992;50:355–63. doi: 10.1016/0304-3959(92)90041-9. [DOI] [PubMed] [Google Scholar]
- Lai J, Gold MS, Kim CS, Bian D, Ossipov MH, Hunter JC, et al. Inhibition of neuropathic pain by decreased expression of the tetrodotoxin-resistant sodium channel, NaV1.8. Pain. 2002;95:143–52. doi: 10.1016/s0304-3959(01)00391-8. [DOI] [PubMed] [Google Scholar]
- Lever IJ, Bradbury EJ, Cunningham JR, Adelson DW, Jones MG, McMahon SB, et al. Brain-derived neurotrophic factor is released in the dorsal horn by distinctive patterns of afferent fiber stimulation. J Neurosci. 2001;21:4469–77. doi: 10.1523/JNEUROSCI.21-12-04469.2001. [DOI] [PMC free article] [PubMed] [Google Scholar]
- Lynn B. ’Silent’ nociceptors in the skin [letter; comment] Trends Neurosci. 1991;14:95. doi: 10.1016/0166-2236(91)90067-5. [DOI] [PubMed] [Google Scholar]
- Ma W, Bisby MA. Increase of preprotachykinin mRNA and substance P immunoreactivity in spared dorsal root ganglion neurons following partial sciatic nerve injury. Eur J Neurosci. 1998;10:2388–99. doi: 10.1046/j.1460-9568.1998.00249.x. [DOI] [PubMed] [Google Scholar]
- Ørstavik K, Weidner C, Schmidt R, Schmelz M, Hilliges M, Jørum E, et al. Pathological C-fibres in patients with a chronic painful condition. Brain. 2003;126:567–78. doi: 10.1093/brain/awg060. [DOI] [PubMed] [Google Scholar]
- Rang HP, Ritchie JM. On the electrogenic sodium pump in mammalian non-myelinated nerve fibres and its activation by various external cations. J Physiol. 1968;196:183–221. doi: 10.1113/jphysiol.1968.sp008502. [DOI] [PMC free article] [PubMed] [Google Scholar]
- Raymond SA, Thalhammer JG, Popitz-Bergez F, Strichartz GR. Changes in axonal impulse conduction correlate with sensory modality in primary afferent fibers in the rat. Brain Res. 1990;526:318–21. doi: 10.1016/0006-8993(90)91239-d. [DOI] [PubMed] [Google Scholar]
- Ringkamp M, Meyer RA. Does peripheral sensitization of primary afferents play a role in neuropathic pain?. In: Campbell JN, Basbuam AI, Dray A, Dubner R, Dworkin RH, Sang CN, editors. Emerging strategies for the treatment of neuropathic pain: an interdisciplinary colloquium; IASP press. 2006. [Google Scholar]
- Sato J, Perl ER. Adrenergic excitation of cutaneous pain receptors induced by peripheral nerve injury. Science. 1991;251:1608–10. doi: 10.1126/science.2011742. [DOI] [PubMed] [Google Scholar]
- Serra J, Campero M, Bostock H, Ochoa J. Two types of C nociceptor in human skin and their behavior in areas of capsaicin-induced secondary hyperalgesia. J Neurophysiol. 2004 doi: 10.1152/jn.00565.2003. [DOI] [PubMed] [Google Scholar]
- Serra J, Campero M, Ochoa J, Bostock H. Activity-dependent slowing of conduction differentiates functional subtypes of C fibres innervating human skin [see comments] J Physiol (Lond) 1999;515(Pt 3):799–811. doi: 10.1111/j.1469-7793.1999.799ab.x. [DOI] [PMC free article] [PubMed] [Google Scholar]
- Shim B, Kim DW, Kim BH, Nam TS, Leem JW, Chung JM. Mechanical and heat sensitization of cutaneous nociceptors in rats with experimental peripheral neuropathy. Neuroscience. 2005;132:193–201. doi: 10.1016/j.neuroscience.2004.12.036. [DOI] [PubMed] [Google Scholar]
- Shin H-C, Oh S-J, Jung S-C, Choi Y-R, Won C-K, Leem J-W. Activity-dependent conduction latency changes in Aδ fibers of neuropathic rats. Neuroreport. 1997;8:2813–6. doi: 10.1097/00001756-199708180-00032. [DOI] [PubMed] [Google Scholar]
- Shortland PJ, Baytug B, Krzyzanowska A, McMahon SB, Priestley JV, Averill S. ATF3 expression in L4 dorsal root ganglion neurons after L5 spinal nerve transection. Eur J Neurosci. 2006;23:365–73. doi: 10.1111/j.1460-9568.2005.04568.x. [DOI] [PubMed] [Google Scholar]
- Takigawa T, Alzheimer C, Quasthoff S, Grafe P. A specific blocker reveals the presence and function of the hyperpolarization-activated cation current IH in peripheral mammalian nerve fibres. Neuroscience. 1998;82:631–4. doi: 10.1016/s0306-4522(97)00383-7. [DOI] [PubMed] [Google Scholar]
- Thalhammer JG, Raymond SA, Popitz-Bergez FA, Strichartz GR. Modality-dependent modulation of conduction by impulse activity in functionally characterized single cutaneous afferents in the rat. Somatosens Mot Res. 1994;11:243–57. doi: 10.3109/08990229409051392. [DOI] [PubMed] [Google Scholar]
- Tsuzuki K, Kondo E, Fukuoka T, Yi D, Tsujino H, Sakagami M, et al. Differential regulation of P2X(3) mRNA expression by peripheral nerve injury in intact and injured neurons in the rat sensory ganglia. Pain. 2001;91:351–60. doi: 10.1016/S0304-3959(00)00456-5. [DOI] [PubMed] [Google Scholar]
- Weidner C, Schmelz M, Schmidt R, Hammarberg B, Ørstavik MH, Torebjörk HE, et al. Neural signal processing: the underestimated contribution of peripheral human C-fibers. J Neurosci. 2002;22:6704–12. doi: 10.1523/JNEUROSCI.22-15-06704.2002. [DOI] [PMC free article] [PubMed] [Google Scholar]
- Weidner C, Schmelz M, Schmidt R, Hansson B, Handwerker HO, Torebjork HE. Functional attributes discriminating mechano-insensitive and mechano-responsive C nociceptors in human skin. J Neurosci. 1999;19:10184–90. doi: 10.1523/JNEUROSCI.19-22-10184.1999. [DOI] [PMC free article] [PubMed] [Google Scholar]
- Won C-K, Oh S-J, Jung S-C, Choi Y-R, Kim Y-I, Leem JW, et al. Activity-dependent conduction velocity changes of Aβ fibers in a rat model of neuropathy. Neuroreport. 1997;8:3201–5. doi: 10.1097/00001756-199710200-00004. [DOI] [PubMed] [Google Scholar]
- Wu G, Ringkamp M, Hartke TV, Murinson BB, Campbell JN, Griffin JW, et al. Early onset of spontaneous activity in uninjured C-fiber nociceptors after injury to neighboring nerve fibers. J Neurosci. 2001;21:RC140. doi: 10.1523/JNEUROSCI.21-08-j0002.2001. [DOI] [PMC free article] [PubMed] [Google Scholar]
- Yang Q, Kaji R, Takagi T, Kohara N, Murase N, Yamada Y, et al. Abnormal axonal inward rectifier in streptozocin-induced experimental diabetic neuropathy. Brain. 2001;124:1149–55. doi: 10.1093/brain/124.6.1149. [DOI] [PubMed] [Google Scholar]


