Abstract
Visual perception of an object depends on the discontinuity between the object and its background, which can be defined by a variety of visual features, such as luminance, colour and motion. While human object perception is largely cue invariant, the extent to which neural mechanisms in the primary visual cortex contribute to cue-invariant perception has not been examined extensively. Here we report that many V1 neurons in the awake monkey are sensitive to the stimulus discontinuity between their classical receptive field (CRF) and non-classical receptive field (nCRF) regardless of the visual feature that defines the discontinuity. The magnitude of this sensitivity is strongly dependent on the strength of nCRF suppression of the cell. These properties of V1 neurons may contribute significantly to cue-invariant object perception.
How do we perceptually segregate an object from its background? First, the object must be different from the background in some stimulus parameters. In most cases, it is the difference rather than the actual values of the parameters that plays a key role in perceptual segregation. For example, to detect a moving object, the visual system assesses the relative motion between the object and the surround rather than the absolute speed of the image across the retina. Physiologically, a recent study (Cao & Schiller, 2003) has shown that most V1 neurons exhibit higher responses to relative motion stimuli than to homogeneous field motion. This indicates that V1 neurons are sensitive to the relative motion velocity, which may contribute to the perception of relative motion signals.
Second, perceptual segregation can be achieved using a variety of features (e.g. luminance, texture and motion), giving rise to cue-invariant perception. Cue-invariant response properties have been found in a number of visual areas both in cats (Hammond & MacKay, 1977; Redies et al. 1986; Leventhal et al. 1998; Mareschal & Baker, 1998; Khayat et al. 2000; Tanaka & Ohzawa, 2006; Zhan & Baker, 2006) and in monkeys (Albright, 1992; Sary et al. 1993; Zipser et al. 1996; Chaudhuri & Albright, 1997; Marcar et al. 2000; Ramsden et al. 2001; Bourne et al. 2002; Liu et al. 2004; Mysore et al. 2006). Recent studies have shown that some V1 neurons can signal the spatial discontinuity in visual stimuli defined by orientation (Sillito et al. 1995) or velocity (Cao & Schiller, 2003). However, whether a given V1 neuron can signal discontinuities defined by multiple visual features is still unknown. Clarification of this issue is important for understanding the neural basis for cue-invariant perceptual segregation.
In the present study, we examined whether centre–surround discontinuity detection in primate V1 is cue invariant. We found that many neurons are sensitive to the discontinuity between the CRF and nCRF stimuli regardless of the underlying visual cue. The magnitude of this effect is directly related to the strength of nCRF suppression of each neuron.
Methods
Behavioural training and surgery
Experiments were performed on four macaque monkeys (Macaca mulatta) (two female and two male) weighing 4.5–5.5 kg. The monkeys were purchased from colonies maintained by the Chinese Academy of Sciences (Qiandao Lake Animal Experiment Research Centre and Suzhou Animal Experiment Research Centre). All experiments were approved by the Animal Care and Use Committee of the Institute of Neuroscience and performed in accordance with the National Institutes of Health guidelines. The monkey sat in a restraining chair. Juice was given as a reward for performing the task. The animal was trained to fixate at a small white spot (0.2 degree visual angles (deg) in diameter) located at the centre of a monitor placed 70 cm from the eyes. When the monkey pressed a lever, a trial began with the fixation point appearing. After a variable delay of 0.5–5 s, the spot changed colour to light yellow and the lever had to be released within 500 ms for the monkey to receive a juice reward. Once the monkey learned the task, a head-restraining implant and a stainless steel recording chamber overlying areas V1 and V2 were surgically attached to the skull. Animals were first sedated with ketamine hydrochloride (5–20 mg kg−1i.m.) and injected subcutaneously with atropine sulphate (0.04 mg kg−1), and then deeply anaesthetized with sodium pentobarbital (30 mg kg−1i.v.). Once a stable plane of anaesthesia was achieved (judged by lack of corneal response and loss of the withdrawal reflex to toe pinch), surgery was conducted under aseptic conditions. Analgesics (buprenorphine, 10 μg kg−1 every 12 h for 2 days post-operatively and then as needed) and antibiotics (gentamycin, 5 mg kg−1 1 h prior to start of surgery followed by 5 mg kg−1 every 12 h for 7 days following surgery) were administered to control post-surgical pain and infection. The experiment began 2 weeks after the preparatory surgery. For the current study, each monkey was recorded from for 6–24 months. At the end of the experiment, one monkey was killed with an overdose of sodium pentobarbital (100 mg kg−1) and the others were retained for further studies. A remote, infrared eye tracker (Eyelink II, resolution 0.01 deg) was used to monitor the eye movements during post-operative training and throughout the experiments (mono-optically, see Fig. 7). During fixation trials, eye position was sampled at 500 Hz.
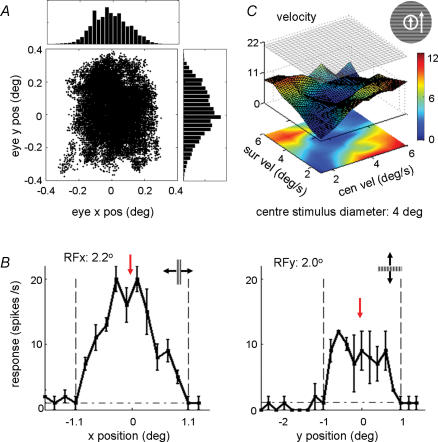
Figure 7. Centre–surround discontinuity sensitivity with large centre stimulus patch.
A, the distribution of the eye positions during visual stimulation. The fixation window is 0.8 deg. The upper and right panels are the histograms of the x and y eye positions, respectively. B, definition of the CRF, measured by the responses to a small rectangular strip (typically, 1 deg × 0.1 deg) at different positions. Horizontal dashed/dotted line represents spontaneous firing rate. Vertical dashed lines indicate CRF borders, and red arrow indicates CRF centre. C, surface–contour plots showing the responses of the cell to stimuli with centre–surround velocity discontinuity. The CRF size of this cell is 2.2 deg × 2.0 deg; the centre grating size is 4 deg. The difference in response between the diagonal and off-diagonal regions is statistically significant (P < 0.001, Mann–Whitney U test).
Recordings
Activity from single neurons or clusters of neurons was recorded extracellularly with glass-coated tungsten electrodes prepared according to the method published in a previous paper (Li et al. 1995). The electrode was inserted through the intact dura with a hydraulic microdrive mounted on the chamber. Responses were recorded from V1 neurons whose CRFs were at eccentricities of 2–6 deg. Nerve impulses, after being converted to standard pulses by a window discriminator, were fed into a computer, along with eye position data for real-time monitoring and analysis. Both the behavioural and physiological data were processed using software written in our laboratory. A fixation window (1 deg) was set and centred on the fixation position, so that deviations of the eye position from the fixation point resulted in cancellation of the trial. To confirm that the recording sites were in V1, the CRF positions of the neurons in each penetration were tracked to ensure that the location of microelectrode penetrations followed the orderly retinotopic mapping of the visual field onto V1, and in one of the monkeys the recording sites were confirmed histologically. Recording depth was determined with reference to the reading on the electrode manipulator and the response properties characteristic of layer 4 cells (high spontaneous firing rates, synchronized with light on and off). When more than one neuron was recorded simultaneously, the spikes from different neurons were differentiated on the basis of both amplitude and slope of the spike waveform.
Visual stimuli
A computer (Pentium 4, 2400) with a graphics card (Gforce 4200 Ti) was used to generate visual stimuli (frame rate, 85 Hz). The screen was 40 cm × 30 cm (33 deg × 25 deg). This visual stimulator could generate multiple patches of sinusoidal grating stimuli of various sizes, spatial frequencies, orientations, velocities, colours and contrasts. The stimulus patterns (Fig. 1) consisted of two concentric patches of gratings with a mean luminance of 10 cd m−2 (except for the experiment with centre–surround luminance discontinuity) and a contrast of 0.95 (except for the experiment with contrast discontinuity). In experiments testing colour discontinuity, the luminance among different colours was set to be the same using a luminance meter (Minolta LS-100). In most experiments, the small patch was set to have the same size and location as the CRF of the recorded neuron and the large concentric annulus was always 10 deg in diameter. By varying one of the visual features (luminance, contrast, colour, orientation, spatial frequency or velocity) in a randomized, interleaved sequence, various types of discontinuity were introduced between the CRF and nCRF. Note, when one feature was varied, other features were identical for both centre and surround stimuli, at the preferred value of the cell. To eliminate the potential effect of luminance border, we also used random dots to stimulate the centre and surround regions in some experiments (Fig. 9). The random dot display consisted of white dots (size: one pixel of the screen, luminance: 76 cd m−2) scattered on a dark background (luminance: 7.7 cd m−2). Dot density was 30%. All the dots within each region moved at the same velocity.
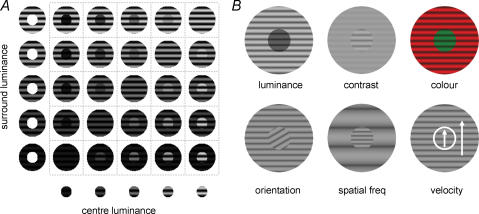
Figure 1. Schematic depiction of visual stimuli in the experiments.
A, a set of visual stimuli with centre–surround discontinuity defined by the luminance cue. Each stimulus pattern consisted of two grating patches, a centre grating (x-axis) and a surround annular grating (y-axis). The centre of the patches was set at the centre of the CRF. In each experiment, the set of centre–surround combinations were presented in a pseudo-random sequence. B, six visual cues used to introduce centre–surround discontinuity: luminance (from 100 to 102 cd m−2, step 100.2 cd m−2 in logarithmic scale), contrast (from 10 to 90%, step 10%), colour (red, yellow, green, cyan, blue, purple), orientation (from 0 to 330 deg, step 30 deg), spatial frequency (from 0.2 to 3.2 cycles deg−1, step 0.3 cycles deg−1) and moving velocity (from 1.5 to 6 deg s−1, step 0.5 deg s−1). Note that, when one feature was used to introduce the discontinuity, the other features were held at the optimal value of the cell in both the centre and surround patches.
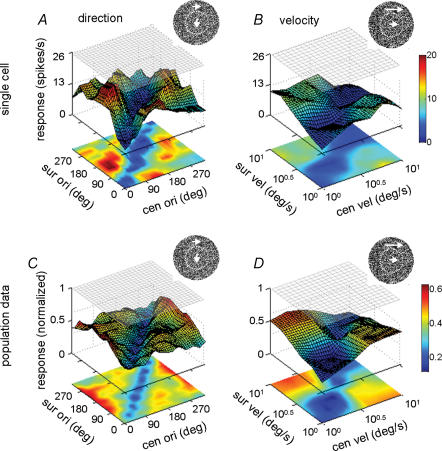
Figure 9. Surface–contour plots showing the responses of V1 cells to the centre–surround discontinuity defined by random dots.
A and B, response of a single V1 cell as a function of centre–surround discontinuity in moving direction (A, from 0 deg to 330 deg, step 30 deg) and velocity (B, from 100 to 101 deg s−1, step 100.2 deg s−1). The difference in response between the diagonal regions and off-diagonal regions is statistically significant in both A and B (P < 0.001, Mann–Whitney U test). C and D, same as A and B, respectively, except that the results were averaged from 16 cells with strong surround suppression (suppression index > 0.5). The difference in response between the diagonal and off-diagonal regions is statistically significant in both C and D (P < 0.001, Mann–Whitney U test).
Data analysis
Data collection was synchronized with the stimulus presentation. To quantify the neuronal responses, we computed the mean firing rate over the entire period of the stimulus presentation (2–3 cycles of drifting gratings, 500–1000 ms), but the results were similar if the period immediately following stimulus onset (50–100 ms) was excluded. For each stimulus configuration, the responses in 5–20 repeats were averaged. We excluded cells with mean firing rates < 5 spikes s−1.
Suppression index (SI)
The strength of nCRF suppression was quantified by the suppression index, defined as:
where Rff represents the response to full-field (10 deg × 10 deg) grating stimulation, Rcentre represents the response to centre grating stimulation alone, and Rspt represents the spontaneous discharge rate. The orientation and spatiotemporal frequency of the drifting grating (mean luminance, 10 cd m−2; contrast, 95%) were set at the optimum for the cell. For neurons exhibiting a suppressive surround effect, the suppression index is greater than 0.
Discontinuity sensitivity index (DSI)
To quantify the sensitivity of each cell to stimulus discontinuity, we measured the discontinuity sensitivity index (DSI), defined as:
where Rsame represents the mean response when centre and surround stimuli are the same (along the diagonal of each two-dimensional function shown in Fig. 2), and Rdiff, represents the mean response to all off-diagonal stimuli. To ensure that DSI and SI are estimated from non-overlapping data, we excluded the responses used in SI estimation from the estimation of DSI (e.g. to measure luminance DSI, we excluded the data with centre luminance at 10 cd m−2 and computed Rsame and Rdiff from the remaining data).
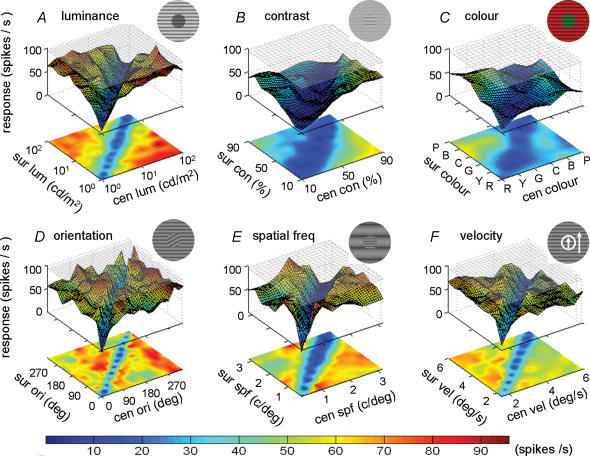
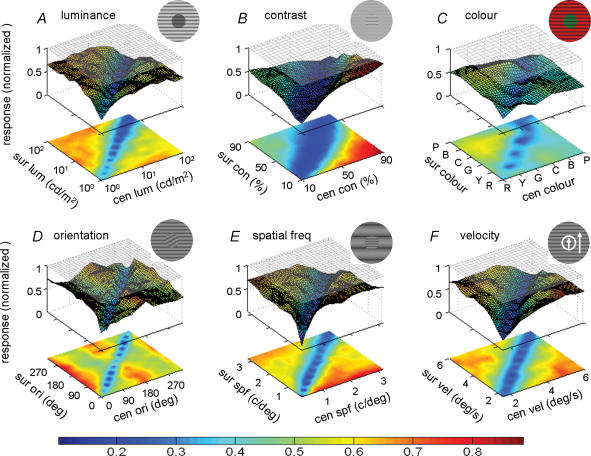
Figure 2. Surface–contour plots showing the responses of an individual V1 cell to stimuli with centre–surround discontinuities defined by six visual features: luminance, contrast, colour, orientation, spatial frequency and moving velocity.
Shown in each plot A–F are the responses after subtracting the spontaneous firing rate. Magnitude of the response for each combination is shown by the height (z-axis) of the surface and colour of the contour. Colour scale bar shows response magnitude. The difference in response between the diagonal and off-diagonal regions was statistically significant in all six cases (P < 0.001, Mann–Whitney U test). The response of this cell to optimal stimulus in the CRF alone was shown by the grey plane near the top (drifting grating at preferred orientation and spatiotemporal frequency).
Determination of the CRF
The procedure was identical to that described in a previous paper (Li & Li, 1994). Briefly, to locate the centre of CRF, a small rectangular drifting gating patch (typically 0.1 deg × 1 deg, 2–3 cycles, 500–1000 ms at each position) was presented at successive positions along axes perpendicular or parallel to the optimal orientation of the cell (see Fig. 7B). The peak of the response profile along the length and width axes was defined as the centre of the CRF, and the borders of the CRF were defined as the positions where the responses were at the spontaneous level.
Detection of microsaccade
We detected microsaccades with a previously developed algorithm (Martinez-Conde et al. 2000, 2002, 2006). Eye position was continually recorded at 500 Hz using Eyelink II, and eye-position data were resampled offline from 500 Hz to 1 kHz using linear interpolation in order to apply the published microsaccade-detecting algorithm (developed for a 1 kHz search coil system). We computed the change in x and y eye positions at each millisecond by subtracting the digitized measurement of eye position for each millisecond from the value of the previous millisecond. This amounted to taking the time derivative position dx and dy for each millisecond. Microsaccades were then detected based on dx and dy as described in the previous studies (Martinez-Conde et al. 2000, 2002, 2006).
Results
We analysed 161 units (76 single, 85 multiunits) in V1 of four awake monkeys. Since the results of simple and complex cells were similar, we combined them in most of the data analyses (except in Fig. 6). To examine the detection of centre–surround discontinuity by V1 neurons, for each visual feature dimension we systematically varied the stimulus parameters for the centre (circular) and the surround (annulus) (Fig. 1A). Six types of visual feature dimensions were examined, including luminance, contrast, colour, orientation, spatial frequency and motion velocity (Fig. 1B). In the first set of experiments, we used sinusoidal gratings in both the centre and the surround. To eliminate the potential effect of luminance borders, we also used random dots to stimulate the centre and surround regions in later experiments (Fig. 9).
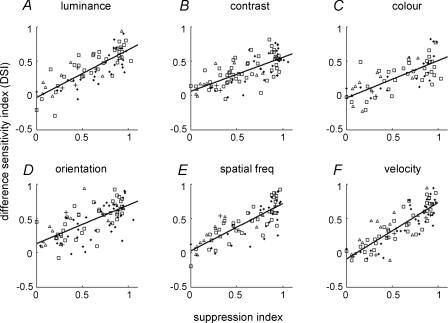
Figure 6. Relationship between the discontinuity sensitivity and the strength of surround suppression.
Each point represents data from one cell. A–F, discontinuities defined by six visual features: luminance (n = 77), contrast (n = 93), colour (n = 66), orientation (n = 93), spatial frequency (n = 83) and moving velocity (n = 91). Single unit data are represented by □ (complex cells) and ▵ (simple cells). Multi-unit data are represented by filled dots (complex cells) and crosses (simple cells). The straight lines show linear regression of the data points. Significant correlation was found in all six cases (P < 0.01). The correlation coefficients were: CClum = 0.80; CCcon = 0.72; CCcol = 0.66; CCori = 0.70; CCspf = 0.80; CCvel = 0.84.
Cue-invariant sensitivity of V1 neurons to centre–surround discontinuity
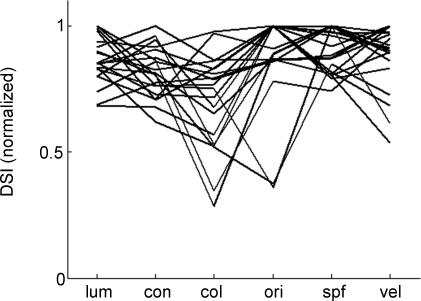
Figure 2 shows the result from a neuron exhibiting strong suppressive nCRF. This neuron exhibited vigorous responses to all stimuli with different centre and surround luminance, and weak responses to stimuli with the same luminance (diagonal, Fig. 2A). The difference in the responses between the diagonal and off-diagonal conditions was significant (P < 0.001, Mann–Whitney U test). Similar results were also found when the discontinuity was defined by other visual features (Fig. 2B–F). This indicates that the same neuron can detect the discontinuity between the centre and surround based on multiple cues. Figure 3 shows the results of the same stimulus manipulations as in Fig. 2, but the responses were based on the average responses of 20 cells (single unit recordings, tested with all six features) with strong surround suppression (suppression index > 0.5, see Methods). These cells showed strong differences in the responses between the diagonal and off-diagonal conditions for all six features. To further examine the cue invariance of these cells in their sensitivity to stimulus discontinuity, we computed the discontinuity sensitivity index (DSI, see Methods) for each visual feature and normalized the six DSI indices by the largest DSI of each cell. As shown in Fig. 4, most DSIs are larger than 60% of the maximum. Similar results were also found for the multiunit recordings (see online Supplemental material, Fig. 1). These results indicate that for cells with strong surround suppression, the sensitivity to stimulus discontinuity is largely cue invariant.
Figure 3. The average responses of 20 V1 neurons with strong surround suppression to stimuli with centre–surround discontinuities defined by six visual features.
The format is identical to that in Fig. 2. After subtracting the spontaneous firing rate, the responses of each cell were normalized by the response to optimal stimulus in the CRF alone before being averaged across cells. For D, the different cells were aligned by their optimal orientation before averaging. The difference in response between the diagonal and off-diagonal regions was statistically significant in all cases (P < 0.001, Mann–Whitney U test).
Figure 4. Discontinuity sensitivity index (DSI) of the 20 V1 cells with strong surround suppression (Fig. 3).
The DSIs (lum, luminance; con, contrast; col, colour; ori, orientation; spf, special frequency; vel, velocity) are normalized by the highest DSI of each cell. Each line represents data from one cell.
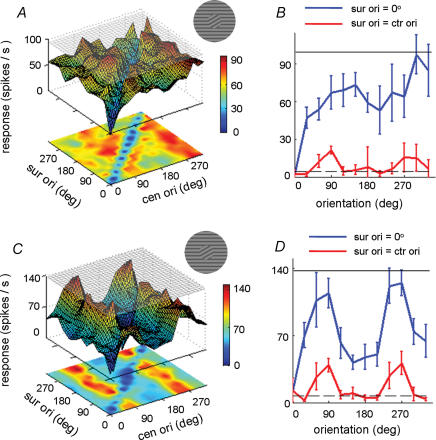
We also examined whether the sensitivity of the cell to the centre–surround discontinuity depends on its feature selectivity, especially its orientation selectivity, within the CRF. The cell shown in Fig. 2 was only weakly tuned to orientation (preferred orientation 280 deg), since the response as a function of centre orientation given a fixed surround orientation was quite flat except for the dip in the curve when centre and surround orientations are the same (Fig. 5A and B). However, the cell shown in Fig. 5C and D, which exhibited strong orientation selectivity (preferred orientation 75 deg), was also sensitive to the centre–surround orientation discontinuity. The effect of surround orientation on the tuning to centre orientation is consistent with a previous finding (Sillito et al. 1995), and the difference in the responses between the diagonal and off-diagonal conditions was significant (P < 0.001, Mann–Whitney U test). Over the population, sensitivity to centre–surround orientation discontinuity was observed for both strongly and weakly tuned cells.
Figure 5. Orientation tuning and centre–surround discontinuity sensitivity.
A, surface–contour plots showing the responses of a V1 cell with weak orientation tuning within the CRF (the same cell as shown in Fig. 2, preferred orientation: 280 deg). The format is identical to that in Fig. 2. The difference in response between the diagonal and off-diagonal regions is statistically significant (P < 0.001, Mann–Whitney U test). B, tuning of the cell (A) to centre orientation when surround orientation was fixed at 0 deg (blue line) and when surround orientation is the same as the centre (red line). Dashed line shows spontaneous responses. The black line in the top shows cell responses to preferred centre stimulus alone. C and D, similar to A and B, but for a cell sharply tuned to orientation (preferred orientation in CRF: 75 deg).
Relationship between discontinuity sensitivity and strength of surround suppression
Previous studies have shown that the responses of V1 neurons to stimuli in the CRF can be influenced by the stimuli in the nCRF (Blakemore & Tobin, 1972; Maffei & Fiorentini, 1976; Nelson & Frost, 1978; Allman et al. 1985; Gilbert & Wiesel, 1990; Knierim & van Essen, 1992; DeAngelis et al. 1994; Levitt & Lund, 1997; Sengpiel et al. 1997; Lamme et al. 1998; Bringuier et al. 1999; Kapadia et al. 1999; Nothdurft et al. 1999; Sceniak et al. 1999; Anderson et al. 2001; Jones et al. 2001; Rossi et al. 2001; Ozeki et al. 2004; Chen et al. 2005; Webb et al. 2005). This influence can be facilitatory or inhibitory. In our experiment, the great majority of cells were suppressed by the surround if both centre and surround were stimulated by gratings at the preferred orientation and spatiotemporal frequency (measured with the centre stimulus alone). The centre–surround discontinuity sensitivity of the V1 neurons appears to be directly related to the strength of nCRF suppression.
To quantify this relationship, we analysed the relationship between DSI and the suppression index (SI, see Methods) for various visual features. As shown in Fig. 6, there is a significant correlation between DSI and SI for all six visual features (P < 0.01). Thus, neuronal sensitivity to the centre–surround discontinuity defined by various visual features is strongly correlated with the strength of nCRF suppression, suggesting a causal relationship between them.
Luminance border effect
For most of the stimuli used in the above experiments (Fig. 1B), there exists a luminance edge at the border between the centre and surround gratings. The higher responses to the off-diagonal stimulus configurations could be evoked by the luminance edge, if the edge falls into the CRF. Although in our experiments the centre patch covers the entire CRF, the luminance borders may occasionally fall into the CRF due to microsaccade (Fig. 7A). In Fig. 7A, the standard deviations of the eye position were 0.11 deg and 0.14 deg for horizontal and vertical directions, respectively. For most neurons the fixation window was 0.8 deg, and the standard deviations of eye position across all units studied in our experiment were 0.09 ± 0.02 deg (mean ±s.d.) and 0.15 ± 0.05 deg for the horizontal and vertical directions, respectively.
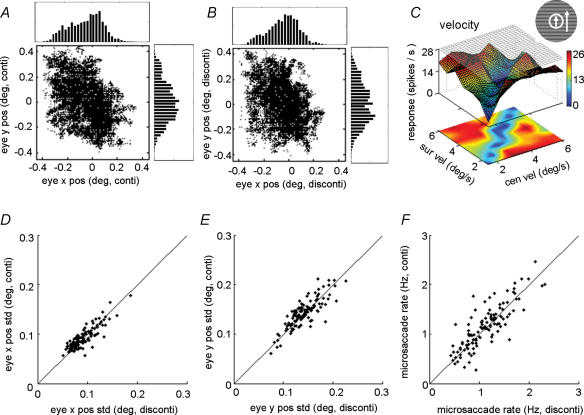
However, eye movement is unlikely to account for our observations, for several reasons. First, the microsaccade similarly affects our measurement of the CRF border (Fig. 7B), causing an over-estimation of the CRF size. More importantly, even when we used centre patches considerably larger than the CRF, such that the luminance edge should never fall into the CRF, the sensitivity to centre–surround discontinuity was still observed. Figure 7 shows a cell with CRF size of 2.2 deg × 2.0 deg (Fig. 7B). When we used a centre stimulus size of 4 deg, we still observed significant difference between the responses in the diagonal and off-diagonal regions (Fig. 7C, P < 0.01, Mann–Whitney U test). Among the 14 neurons tested with large centre stimuli, six cells were almost completely suppressed and thus could not be used to examine the sensitivity to centre–surround discontinuity. The remaining eight cells showed significant sensitivity to the centre–surround discontinuity (P < 0.01, Mann–Whitney U test; DSI of each cell was the average DSI across different features; the mean DSI of the eight cells was 0.41 ± 0.16 (mean ±s.d.)). Second, as shown in the last section, the discontinuity sensitivity depends strongly on the strength of nCRF suppression. This is inconsistent with the possibility that the discontinuity sensitivity is caused primarily by the luminance edge falling into the CRF. To further exclude the possibility that the frequency of microsaccades per se depends on the centre–surround discontinuity, we compared the eye position distributions (Fig. 8A–E) and the rates of microsaccades (see Methods, Fig. 8F) between trials with and without centre–surround discontinuity. We found them to be quite similar, indicating that the response sensitivity to centre–surround discontinuity could not be attributed to the difference in microsaccades.
Figure 8. Distributions of eye position for stimulus trials with and without centre–surround discontinuity.
A, B and C, the distributions of eye positions in trials without (A) and with (B) discontinuity, obtained while recording from a cell showing high sensitivity to discontinuity (C). The fixation window was 0.9 deg. The upper and right panels are the histograms of the x and y eye positions, respectively. The standard deviations of the eye position distributions were 0.131 deg (A) and 0.133 deg (B) for horizontal direction and 0.153 deg (A) and 0.152 deg (B) for vertical direction. D and E, comparison of standard deviation of eye position distributions in trials with and without centre–surround discontinuity. F, comparison of frequency of microsaccades.
Finally, to further exclude the confounding effect of the luminance edge in the observed sensitivity to centre–surround discontinuity, we recorded the responses of V1 cells to the discontinuity defined by the relative moving direction or speed of random dots. In this case, there is no luminance edge at the RF border. As shown in Fig. 9, we found that V1 neurons responded more strongly to the stimulus configurations off the diagonal than along the diagonal, for both direction (Fig. 9A) and velocity (Fig. 9B) features (P < 0.01, Mann–Whitney U test). The average responses of 16 cells with strong surround suppression (SI > 0.5, all single units, among a total of 31 cells tested) are shown in Fig. 9C and D. These data indicate that V1 cells can signal the centre–surround discontinuity in the absence of luminance edges.
Discussion
In the present study, we found that V1 neurons in awake monkeys are sensitive to the discontinuity between the centre and surround stimuli regardless of the visual features that define the discontinuity. The degree of this sensitivity is strongly dependent on the strength of nCRF suppression.
Recent studies have shown that V1 neurons can signal stimulus discontinuity between CRF and surround. Sillito et al. (1995) reported that some V1 neurons can detect orientation discontinuity, as these neurons respond to any combination of centre–surround orientations as long as the two orientations are not identical. Cao & Schiller (2003) found that most V1 neurons showed higher responses to stimuli with relative motion than with homogeneous field motion. In the current study, we found that some neurons in V1 can also signal the discontinuity defined by other visual features (including luminance, contrast, colour and special frequency).
The ability of humans to perceive objects is largely cue invariant (Rivest et al. 1997). Physiologically, cue-invariant response properties have been reported for cells in higher cortical areas such as middle temporal cortex (Albright, 1992), medial superior temporal cortex (Geesaman & Anderson, 1996) and inferior temporal cortex (Sary et al. 1993). For example, Sary et al. (1993) reported that many cells in IT can recognize the same shape regardless of whether it is defined by luminance, texture, or motion. In recent years, some groups reported that cells in early cortical areas (Zipser et al. 1996; Leventhal et al. 1998) including V1 can also extract information in feature-invariant fashion. Zipser et al. (1996) found that most of the V1 neurons show robust contextual modulation when diverse visual features define a textured figure centred on their CRF. Compared to their study, which used fixed centre stimuli and only two surround stimuli (same as or different from the centre), in the current study, we varied both the centre and surround stimuli systematically. This allowed us to demonstrate that many cells in V1 code the centre–surround discontinuity rather than the stimulus parameters per se.
In some of the stimuli used in the present study (Fig. 1B, lower row), there is not only the orientation–spatial-frequency–velocity discontinuity but also a spatial phase discontinuity between the centre and surround gratings. A recent study by Xu et al. (2005) showed that some V1 neurons in the awake monkey are sensitive to spatial phase discontinuity, although DeAngelis et al. (1994) found that most cells in V1 of anaesthetized cat were not sensitive to the relative centre–surround phase. In principle, the responses we have observed (Fig. 3, lower row) could simply reflect the cortical sensitivity to the relative spatial phase (Xu et al. 2005). However, spatial phase sensitivity cannot account for the observation that cortical cells are also sensitive to the discontinuity defined by the direction and velocity of random dots (Fig. 9). In fact, spatial phase is just another visual feature, and the dependence of the response to the relative spatial phase represents another type of centre–surround discontinuity sensitivity.
We found that the degree of discontinuity sensitivity was strongly dependent on the strength of nCRF suppression. However, the surround suppression may be different among different feature dimensions, especially for colour. Solomon et al. (2004) found that in V1 the surround suppression evoked by isoluminant gratings was less than that evoked by achromatic gratings. In agreement with their study, we found that the DSI for colour is the lowest for many cells (Fig. 4).
Webb et al. (2005) found that responses to an optimally configured grating confined to the CRF were strongly suppressed by annular surrounding gratings drifting at a wide range of temporal and spatial frequencies. This is different from our finding on the response sensitivity to temporal or spatial frequency discontinuity. A potential reason for this discrepancy is that Webb et al. used the anaesthetized monkey while we used the awake monkey. There is evidence that both the degree of surround suppression and the proportion of cells showing strong surround suppression were larger in the awake animals (Jones et al. 2000, 2001; Akasaki et al. 2002). Since the degree of the discontinuity sensitivity was strongly dependent on the strength of surround suppression, it is likely to be different between awake and anaesthetized animals.
In conclusion, we found that many V1 neurons are able to exploit and integrate multiple cues in order to signal the regional discontinuity of visual scenes, which may provide the prerequisite for more complex processing at higher-order cortical areas.
Acknowledgments
We thank Dr Yang Dan for comments on the manuscript and Mrs X. Z. Xu for technical assistance. This work was supported by the Natural Science Foundation of China (90208006), the Major State Basic Research Program of China (2007CB311001), the State Kay Laboratory of Brain and Cognitive Science, Institute of Biophysics, Chinese Academy of Sciences.
Supplementary material
Online supplemental material for this paper can be accessed at:
http://jp.physoc.org/cgi/content/full/jphysiol.2007.130294/DC1
and
http://www.blackwell-synergy.com/doi/suppl/10.1113/jphysiol.2007.130294
References
- Akasaki T, Sato H, Yoshimura Y, Ozeki H, Shimegi S. Suppressive effects of receptive field surround on neuronal activity in the cat primary visual cortex. Neurosci Res. 2002;43:207–220. doi: 10.1016/s0168-0102(02)00038-x. [DOI] [PubMed] [Google Scholar]
- Albright TD. Form-cue invariant motion processing in primate visual cortex. Science. 1992;255:1141–1143. doi: 10.1126/science.1546317. [DOI] [PubMed] [Google Scholar]
- Allman J, Miezin F, McGuinness E. Stimulus specific responses from beyond the classical receptive field: neurophysiological mechanisms for local-global comparisons in visual neurons. Annu Rev Neurosci. 1985;8:407–430. doi: 10.1146/annurev.ne.08.030185.002203. [DOI] [PubMed] [Google Scholar]
- Anderson JS, Lampl I, Gillespie DC, Ferster D. Membrane potential and conductance changes underlying length tuning of cells in cat primary visual cortex. J Neurosci. 2001;21:2104–2112. doi: 10.1523/JNEUROSCI.21-06-02104.2001. [DOI] [PMC free article] [PubMed] [Google Scholar]
- Blakemore C, Tobin EA. Lateral inhibition between orientation detectors in the cat's visual cortex. Exp Brain Res. 1972;15:439–440. doi: 10.1007/BF00234129. [DOI] [PubMed] [Google Scholar]
- Bourne JA, Tweedale R, Rosa MG. Physiological responses of New World monkey V1 neurons to stimuli defined by coherent motion. Cereb Cortex. 2002;12:1132–1145. doi: 10.1093/cercor/12.11.1132. [DOI] [PubMed] [Google Scholar]
- Bringuier V, Chavane F, Glaeser L, Fregnac Y. Horizontal propagation of visual activity in the synaptic integration field of area 17 neurons. Science. 1999;283:695–699. doi: 10.1126/science.283.5402.695. [DOI] [PubMed] [Google Scholar]
- Cao A, Schiller PH. Neural responses to relative speed in the primary visual cortex of rhesus monkey. Vis Neurosci. 2003;20:77–84. doi: 10.1017/s0952523803201085. [DOI] [PubMed] [Google Scholar]
- Chaudhuri A, Albright TD. Neuronal responses to edges defined by luminance vs. temporal texture in macaque area V1. Vis Neurosci. 1997;14:949–962. doi: 10.1017/s0952523800011664. [DOI] [PubMed] [Google Scholar]
- Chen G, Dan Y, Li CY. Stimulation of non-classical receptive field enhances orientation selectivity in the cat. J Physiol. 2005;564:233–243. doi: 10.1113/jphysiol.2004.080051. [DOI] [PMC free article] [PubMed] [Google Scholar]
- DeAngelis GC, Freeman RD, Ohzawa I. Length and width tuning of neurons in the cat's primary visual cortex. J Neurophysiol. 1994;71:347–374. doi: 10.1152/jn.1994.71.1.347. [DOI] [PubMed] [Google Scholar]
- Geesaman BJ, Anderson RA. The analysis of complex motion patterns by form/cue invariant MSTd neurons. J Neurosci. 1996;16:4716–4732. doi: 10.1523/JNEUROSCI.16-15-04716.1996. [DOI] [PMC free article] [PubMed] [Google Scholar]
- Gilbert CD, Wiesel TN. The influence of contextual stimuli on the orientation selectivity of cells in primary visual cortex of the cat. Vision Res. 1990;30:1689–1701. doi: 10.1016/0042-6989(90)90153-c. [DOI] [PubMed] [Google Scholar]
- Hammond P, MacKay DM. Differential responsiveness of simple and complex cells in cat striate cortex to visual texture. Exp Brain Res. 1977;30:275–296. doi: 10.1007/BF00237256. [DOI] [PubMed] [Google Scholar]
- Jones HE, Andolina IM, Oakely NM, Murphy PC, Sillito AM. Spatial summation in lateral geniculate nucleus and visual cortex. Exp Brain Res. 2000;135:279–284. doi: 10.1007/s002210000574. [DOI] [PubMed] [Google Scholar]
- Jones HE, Grieve KL, Wang W, Sillito AM. Surround suppression in primate V1. J Neurophysiol. 2001;86:2011–2028. doi: 10.1152/jn.2001.86.4.2011. [DOI] [PubMed] [Google Scholar]
- Kapadia MK, Westheimer G, Gilbert CD. Dynamics of spatial summation in primary visual cortex of alert monkeys. Proc Natl Acad Sci U S A. 1999;96:12073–12078. doi: 10.1073/pnas.96.21.12073. [DOI] [PMC free article] [PubMed] [Google Scholar]
- Khayat PS, Saint-Amour D, Molotchnikoff S, Lepore F, Guillemot JP. Cellular response to texture and form defined by motion in area 19 of the cat. Eur J Neurosci. 2000;12:1727–1738. doi: 10.1046/j.1460-9568.2000.00046.x. [DOI] [PubMed] [Google Scholar]
- Knierim JJ, van Essen DC. Neuronal responses to static texture patterns in area V1 of the alert macaque monkey. J Neurophysiol. 1992;67:961–980. doi: 10.1152/jn.1992.67.4.961. [DOI] [PubMed] [Google Scholar]
- Lamme VA, Zipser K, Spekreijse H. Figure-ground activity in primary visual cortex is suppressed by anesthesia. Proc Natl Acad Sci U S A. 1998;95:3263–3268. doi: 10.1073/pnas.95.6.3263. [DOI] [PMC free article] [PubMed] [Google Scholar]
- Leventhal AG, Wang Y, Schmolesky MT, Zhou Y. Neural correlates of boundary perception. Vis Neurosci. 1998;15:1107–1118. doi: 10.1017/s0952523898156110. [DOI] [PubMed] [Google Scholar]
- Levitt JB, Lund JS. Contrast dependence of contextual effects in primate visual cortex. Nature. 1997;387:73–76. doi: 10.1038/387073a0. [DOI] [PubMed] [Google Scholar]
- Li CY, Li W. Extensive integration field beyond the classical receptive field of cat's striate cortical neurons – classification and tuning properties. Vision Res. 1994;34:2337–2355. doi: 10.1016/0042-6989(94)90280-1. [DOI] [PubMed] [Google Scholar]
- Li CY, Xu XZ, Tigwell D. A simple and comprehensive method for the construction, repair and recycling of single and double tungsten microelectrodes. J Neurosci Meth. 1995;57:217–220. doi: 10.1016/0165-0270(94)00151-6. [DOI] [PubMed] [Google Scholar]
- Liu Y, Vogels R, Orban GA. Convergence of depth from texture and depth from disparity in macaque inferior temporal cortex. J Neurosci. 2004;24:3795–3800. doi: 10.1523/JNEUROSCI.0150-04.2004. [DOI] [PMC free article] [PubMed] [Google Scholar]
- Maffei L, Fiorentini A. The unresponsive regions of visual cortical receptive fields. Vision Res. 1976;16:1131–1139. doi: 10.1016/0042-6989(76)90253-4. [DOI] [PubMed] [Google Scholar]
- Marcar VL, Raiguel SE, Xiao D, Orban GA. Processing of kinetically defined boundaries in areas V1 and V2 of the macaque monkey. J Neurophysiol. 2000;84:2786–2798. doi: 10.1152/jn.2000.84.6.2786. [DOI] [PubMed] [Google Scholar]
- Mareschal I, Baker CL., Jr A cortical locus for the processing of contrast-defined contours. Nat Neurosci. 1998;1:150–154. doi: 10.1038/401. [DOI] [PubMed] [Google Scholar]
- Martinez-Conde S, Macknik SL, Hubel DH. Microsaccadic eye movements and firing of single cells in the striate cortex of macaque monkeys. Nat Neurosci. 2000;3:251–258. doi: 10.1038/72961. [DOI] [PubMed] [Google Scholar]
- Martinez-Conde S, Macknik SL, Hubel DH. The function of bursts of spikes during visual fixation in the awake primate lateral geniculate nucleus and primary visual cortex. Proc Natl Acad Sci U S A. 2002;99:13920–13925. doi: 10.1073/pnas.212500599. [DOI] [PMC free article] [PubMed] [Google Scholar]
- Martinez-Conde S, Macknik SL, Troncoso XG, Dyar TA. Microsaccades counteract visual fading during fixation. Neuron. 2006;49:297–305. doi: 10.1016/j.neuron.2005.11.033. [DOI] [PubMed] [Google Scholar]
- Mysore SG, Vogels R, Raiguel SE, Orban GA. Processing of kinetic boundaries in macaque V4. J Neurophysiol. 2006;95:1864–1880. doi: 10.1152/jn.00627.2005. [DOI] [PubMed] [Google Scholar]
- Nelson JI, Frost BJ. Orientation-selective inhibition from beyond the classic visual receptive field. Brain Res. 1978;139:359–365. doi: 10.1016/0006-8993(78)90937-x. [DOI] [PubMed] [Google Scholar]
- Nothdurft HC, Gallant JL, Van Essen DC. Response modulation by texture surround in primate area V1: correlates of ‘popout’ under anesthesia. Vis Neurosci. 1999;16:15–34. doi: 10.1017/s0952523899156189. [DOI] [PubMed] [Google Scholar]
- Ozeki H, Sadakane O, Akasaki T, Naito T, Shimegi S, Sato H. Relationship between excitation and inhibition underlying size tuning and contextual response modulation in the cat primary visual cortex. J Neurosci. 2004;24:1428–1438. doi: 10.1523/JNEUROSCI.3852-03.2004. [DOI] [PMC free article] [PubMed] [Google Scholar]
- Ramsden BM, Hung CP, Roe AW. Real and illusory contour processing in area V1 of the primate: a cortical balancing act. Cereb Cortex. 2001;11:648–665. doi: 10.1093/cercor/11.7.648. [DOI] [PubMed] [Google Scholar]
- Redies C, Crook JM, Creutzfeldt OD. Neuronal responses to borders with and without luminance gradients in cat visual cortex and dorsal lateral geniculate nucleus. Exp Brain Res. 1986;61:469–481. doi: 10.1007/BF00237572. [DOI] [PubMed] [Google Scholar]
- Rivest J, Boutet I, Intriligator J. Perceptual learning of orientation discrimination by more than one attribute. Vision Res. 1997;37:273–281. doi: 10.1016/s0042-6989(96)00168-x. [DOI] [PubMed] [Google Scholar]
- Rossi AF, Desimone R, Ungerleider LG. Contextual modulation in primary visual cortex of macaques. J Neurosci. 2001;21:1698–1709. doi: 10.1523/JNEUROSCI.21-05-01698.2001. [DOI] [PMC free article] [PubMed] [Google Scholar]
- Sary G, Vogels R, Orban GA. Cue-invariant shape selectivity of macaque inferior temporal neurons. Science. 1993;260:995–997. doi: 10.1126/science.8493538. [DOI] [PubMed] [Google Scholar]
- Sceniak MP, Ringach DL, Hawken MJ, Shapley R. Contrast's effect on spatial summation by macaque V1 neurons. Nat Neurosci. 1999;2:733–739. doi: 10.1038/11197. [DOI] [PubMed] [Google Scholar]
- Sengpiel F, Sen A, Blakemore C. Characteristics of surround inhibition in cat area 17. Exp Brain Res. 1997;116:216–228. doi: 10.1007/pl00005751. [DOI] [PubMed] [Google Scholar]
- Sillito AM, Grieve KL, Jones HE, Cudeiro J, Davis J. Visual cortical mechanisms detecting focal orientation discontinuities. Nature. 1995;378:492–496. doi: 10.1038/378492a0. [DOI] [PubMed] [Google Scholar]
- Solomon SG, Peirce JW, Lennie P. The impact of suppressive surrounds on chromatic properties of cortical neurons. J Neurosci. 2004;24:148–160. doi: 10.1523/JNEUROSCI.3036-03.2004. [DOI] [PMC free article] [PubMed] [Google Scholar]
- Tanaka H, Ohzawa I. Neural basis for stereopsis from second-order contrast cues. J Neurosci. 2006;26:4370–4382. doi: 10.1523/JNEUROSCI.4379-05.2006. [DOI] [PMC free article] [PubMed] [Google Scholar]
- Webb BS, Dhruv NT, Solomon SG, Tailby C, Lennie P. Early and late mechanisms of surround suppression in striate cortex of macaque. J Neurosci. 2005;25:11666–11675. doi: 10.1523/JNEUROSCI.3414-05.2005. [DOI] [PMC free article] [PubMed] [Google Scholar]
- Xu WF, Shen ZM, Li CY. Spatial phase sensitivity of V1 neurons in alert monkey. Cereb Cortex. 2005;15:1697–1702. doi: 10.1093/cercor/bhi046. [DOI] [PubMed] [Google Scholar]
- Zhan CA, Baker CL., Jr Boundary cue invariance in cortical orientation maps. Cereb Cortex. 2006;16:896–906. doi: 10.1093/cercor/bhj033. [DOI] [PubMed] [Google Scholar]
- Zipser K, Lamme VA, Schiller PH. Contextual modulation in primary visual cortex. J Neurosci. 1996;16:7376–7389. doi: 10.1523/JNEUROSCI.16-22-07376.1996. [DOI] [PMC free article] [PubMed] [Google Scholar]
Associated Data
This section collects any data citations, data availability statements, or supplementary materials included in this article.


