Abstract
The stimulation of cardiac tissue in the recovery phase has significant importance in relation to reentry induction. In the theoretical experiment proposed by Winfree, termed the ‘pinwheel' experiment, a point stimulus (S2) is applied in the wake of a freely propagating planar wave (S1). Reentry induced from this S1–S2 pinwheel protocol has been observed experimentally in heart preparations. However, in these experiments, which focused on activation outcomes, only mapping of extracellular voltages has been conducted. The lack of transmembrane potential (Vm) distribution data makes it impossible to analyse the underlying stimulation mechanisms which precede the reentry induction. In this work we sought to elucidate the stimulation mechanisms throughout the heart cycle using the pinwheel protocol. We examined the cardiac tissue responses during and immediately after cathodal stimulation in the refractory wake of a propagating planar wave. The voltage-sensitive dye di-4-ANEPPS was utilized to measure Vm directly from quasi two-dimensional preparations of cryoablated Langendorff-perfused rabbit hearts. Four stimulation mechanisms were observed that depended on the Vm magnitude during S2 cathodal stimulation. Make stimulation always occurred during diastolic stimulation. When stimulation was at the beginning of the relative refractory period (RRP), transitional make–break stimulation was detected. During the RRP the excitation was due to the break mechanism. While approaching the effective refractory period (ERP), the tissue response is characterized by a damped wave mediated response. These four stimulation mechanisms were observed in all hearts whether the S1 planar wave propagation was parallel or perpendicular to the fibre direction. This study is the first examination of Vm and the stimulation mechanisms throughout the cardiac cycle using the pinwheel protocol, and the results have implications in the development and improvement of pacing protocols for artificial cardiostimulators.
In accordance with bidomain theory the regions of positive and negative polarizations, termed virtual electrodes, play a key role in cardiac tissue stimulation (Plonsey & Barr, 1984; Roth & Wikswo, 1986; Sepulveda et al. 1989; Trayanova & Henriquez, 1991; Henriquez, 1993). The significant difference in the anisotropic electrical conductivities of the intracellular and extracellular spaces in cardiac tissue is responsible for the observed cardiac tissue polarization (Plonsey & Barr, 1984; Sepulveda & Wikswo, 1987; Wikswo, 1995). In an earlier study Cranefield et al. (1957) examined diastolic stimulation of cardiac tissue with a bipolar electrode and found that excitation starts at the cathodal end of the electrode at the onset of the stimulus, signifying make stimulation. For stimulation in the relative refractory period they found excitation began at the anodal end of the electrode after stimulus termination, indicating break stimulation. Dekker (1970) showed four modes for heart stimulation: cathodal make, cathodal break, anodal make and anodal break. Much later these stimulation mechanisms were described in terms of interaction between the regions of positive polarization or virtual cathodes (VC) and regions of negative polarization or virtual anodes (VA) during stimulation in rest and in refractory tissue (Wikswo, 1994; Roth, 1995).
During cathodal stimulation the central dog-bone shaped VC is aligned transverse to the fibre direction, while two adjacent VAs are aligned along the fibre direction. If stimulation is anodal, the central dog-bone shaped VA is located transversely and two flanked VCs are located along the fibre direction. When the stimulation mechanism is make, activation occurs with stimulus onset either at the central VC during cathodal stimulation or at the two VCs along the fibre direction during anodal stimulation. When the break mechanism of stimulation takes place, activation happens after stimulus termination at the two VAs or at the one central VA for cathodal and anodal stimulations, respectively (Wikswo et al. 1995; Knisley, 1995; Neunlist & Tung, 1995; Wikswo, 1995). The activation and inactivation gating of sodium channels control which mechanism occurs. For instance elevation of extracellular potassium, which increases sodium channel inactivation, can modify excitability and change the stimulation mechanism from make to break (Sidorov et al. 2003b).
Stimulation in the wake of a propagating excitation wave is an important tool to study reentry induction. Winfree was the first to propose the ‘pinwheel’ stimulation protocol in which a point stimulus of appropriate strength is applied in the wake of propagating planar wave at the ‘critical phase’ (Winfree, 1983, 1987). As a result, two critical points appear at the intersection of the ‘critical phase’ and critical depolarization. These points are the sites of wavebreak origination and anchoring of two reentrant counterclockwise spiral waves (Winfree, 1989) which can underlie sustained arrhythmias. Incorporation of the bidomain theory and the pinwheel stimulation protocol linked the polarization patterns, stimulation mechanisms and reentry induction (Roth, 1998; Lindblom et al. 2000; Sambelashvili & Efimov, 2002). There have been extensive experimental studies dedicated to the verification of the critical point hypothesis (Chen et al. 1988; Shibata et al. 1988a, b; Frazier et al. 1989; Gotoh et al. 1997). However in those investigations extracellular multielectrode mapping was utilized, which does not allow mapping of the potential distribution during and immediately after the stimulus because of artifacts from the electric shock in the recordings.
Because of the lack of experimental examination of the stimulation mechanism and the role of the virtual electrodes in the pinwheel experiment with a well defined fibre orientation, we aimed to measure Vm in a quasi two-dimensional tissue preparation using voltage-sensitive dyes. To minimize the effects of electroporation on the results we tested cathodal stimuli of moderate intensity (about 13 × threshold). We believe that the stimulation mechanisms described in this study are also relevant to those of stronger stimuli that result in sustained reentry.
A gradient of refractoriness was generated by an S1 planar wave propagating either parallel or perpendicular to the fibre direction, and an S2 testing cathodal point stimulus was delivered at different times in the S1 repolarization phase. The advantage of using a two-dimensional preparation was a less complex fibre geometry and tissue response to electrical stimulation, allowing accurate and reliable analyses of the stimulation mechanisms.
Methods
Experimental preparation
All experiments were performed according to protocols approved by the Vanderbilt Institutional Animal Care and Use Committee.
Fourteen New Zealand White rabbits of either sex weighing 2–3 kg were first preanaesthetized by intramuscular injection of 50 mg kg−1 ketamine, then heparinized (500 units), and thereafter anaesthetized by 60 mg kg−1 sodium pentobarbital via a left ear vein. When the animal failed to respond to the paw pinch and eye reflex tests, its chest was opened by means of radical medial thoracotomy; the heart was quickly excised and mounted on a Langendorff apparatus for retrograde perfusion through the aorta with oxygenated (95% O2–5% CO2) modified Tyrode solution of the following composition (mm): 133 NaCl, 4 KCl, 2 CaCl2, 1 MgCl2, 1.5 NaH2PO4, 20 NaHCO3 and 10 glucose (Sidorov et al. 2005).
To obtain a quasi two-dimensional layer of left ventricular epicardium we used a standard cryoablation procedure (Allessie et al. 1989; Brugada et al. 1990). A cryoprobe of 10 mm diameter was positioned in the left ventricle (LV) cavity through the left atrium, and the heart was then immersed in a bath containing perfusion fluid at 30°C. The cryoprobe was filled with liquid nitrogen (−192°C), and retrograde perfusion was temporarily interrupted. After 5 min of liquid nitrogen exposure the perfusion was restored, the probe was removed, and the heart was removed from the bath. To evaluate the cryoprocedure, the heart was stained with a buffered 2,3,5-triphenyltetrazolium chloride solution (Sigma-Aldrich, St Louis, MO, USA) at the end of each experiment. This compound reacts with dehydrogenase enzymes forming a formazan pigment of bright red colour (Nachlas & Shnitka, 1963). No staining occurs where the myocardium has lost dehydrogenase activity. After cutting the ventricle in sections parallel to the atrial-ventricular ring, the surviving epicardial layer appears as a thin red rim. In our experiments, the thickness of the viable tissue around the S2 stimulation electrode was below 0.5 mm.
Following the cryoablation procedure, the heart was stained with di-4-ANEPPS (Invitrogen Co, Carlsbad, CA, USA) stock solution (0.5 mg ml−1 dimethyl sulfoxide) administered via a bubble trap above the aorta. Diacetyl monoxime (BDM, Sigma-Aldrich) was added to the perfusion solution (15 mm) to block muscle contraction. The pH and temperature were kept at 7.4 ± 0.05 and 37°± 0.5°C, respectively. The perfusion pressure was adjusted to 50 mmHg. During the experiments the hearts were suspended in air.
Optical setup
In all experiments the anterior LV was mapped. The fluorescence was excited by laser light of 532 nm (Verdi, Coherent, Santa Clara, CA, USA). The emitted light passed through a cutoff filter (no. 25 Red, 607 nm, Tiffen, Hauppauge, NY, USA) and was imaged with a CCD camera (Model CA D1-0128T, Dalsa, Waterloo, ON, Canada) with spatial and temporal resolution of 128 ×128 pixels and 490 frames s−1, respectively. Custom-developed data acquisition software using LabVIEW (National Instruments, Austin, TX, USA) and MATLAB were used to record and analyse the data.
Stimulation protocol
The electrical stimuli were provided by computer-controlled constant current sources (Bloom Associates, Narberth, PA, USA). Continuous pacing at a cycle length of 300 ms was provided via a bipolar platinum electrode (0.25 mm wire diameter) with an intertip distance of 1 mm. The bipolar electrode was placed on the right ventricle close to septum, 8–9 mm from the unipolar testing electrode. The stimulation pulse amplitude was slightly above threshold with a duration of 4 ms. To initiate a plane wave and accomplish the pinwheel stimulation protocol we used a linear wire electrode (S1), orientated either perpendicular or longitudinal to the fibres. This electrode was located at the bottom or right side of the imaged area. The S1 stimulus was 1.5 times threshold and 2 ms in duration. The S2 point electrode (0.25 mm platinum wire) was positioned centrally in the imaged area. The mean value of threshold current for the cathodal point stimulation was 0.15 ± 0.07 mA (n = 14). We examined cathodal S2 stimuli of 10 ms duration and 2 mA magnitude. This value is about of 13 times the threshold. During each experiment the S1–S2 interval was progressively shortened in 2–10 ms steps starting at 250 ms down to ERP, when S2 no longer resulted in a propagating wave.
Data analysis and statistics
The conduction velocity along and transverse to the fibre direction was determined using the time–space plot method as the slope of the tangent to the wave front (Sidorov et al. 2003b). Activation maps were reconstructed using the (dV/dt)max criterion to find the activation times. To illustrate the net Vm response to S2, the previous S1 response was subtracted from the tissue response. This potential distribution was designated as ΔVm (Sidorov et al. 2005).
All data were filtered with a spatial 5 × 5 Gaussian filter and a 3-point mean temporal filter. Voltage calibration was accomplished according to our previously published microelectrode measurement data: the resting membrane potential is −85 mV, and the action potential amplitude is 112 mV (Sidorov et al. 2003b). Group data were statistically analysed and presented as means ±s.d. Differences were considered statistically significant for P < 0.05.
Results
S1 planar wave propagates along the fibre direction
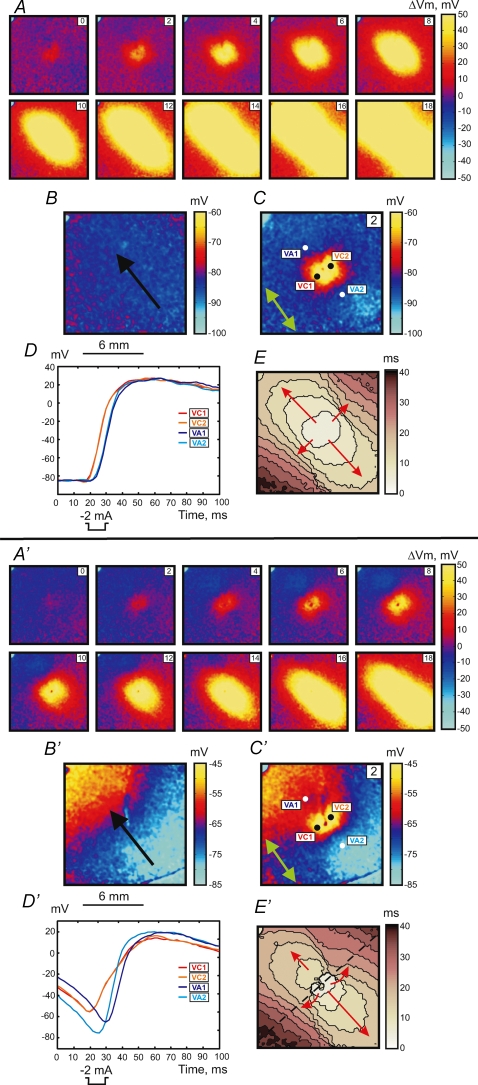
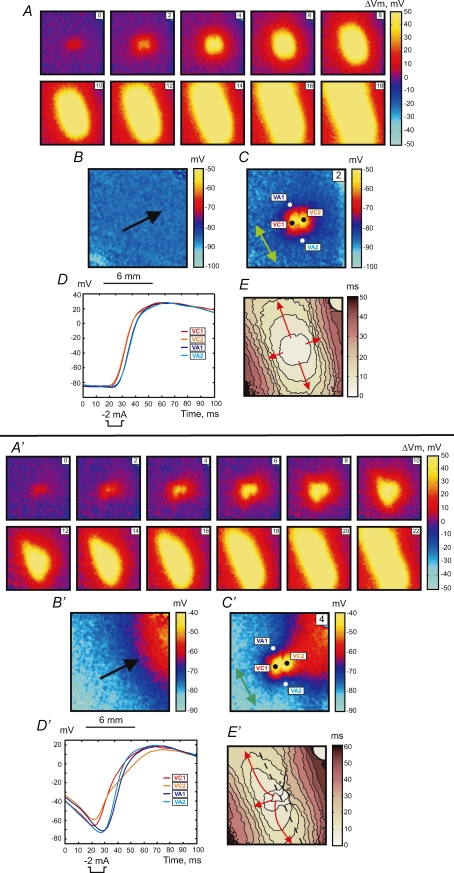
Figure 1 illustrates two stimulation mechanisms: make (upper panel, A–E) and transitional make-break stimulation (lower panel, A′–E′). The S1 planar wave propagates along the fibre direction from the lower right to upper left corner (black arrow in Fig. 1B and B′). The S2 cathodal stimulus was applied via a centrally located unipolar electrode at S1–S2 intervals of 300 ms (A–E) and 195 ms (A′–E′).
Figure 1.
Upper panel (A–E), make response to S2 stimulus of 2 mA in amplitude and 10 ms in duration at a coupling interval of 300 ms for S1 propagation along the fibre direction S1 planar wave propagation is from the lower right to upper left. A, images of ΔVm distribution as a function of time. The numbers in the upper right represent the time in ms since the onset of S2 point stimulation at the centre of the image. The size of the image is 12 mm × 12 mm. B, Vm distribution during S1 repolarization corresponding to the timing of the Vm image during S2 in C. The black arrow shows the direction of S1 planar wave propagation. C, image of Vm distribution 2 ms after the beginning of S2. The green arrow shows the fibre direction (FD). D, four representative traces recorded in the VC (red) and VA (blue) areas. The pixel locations for these traces are indicated with white and black dots in C. E, activation map. The scale shows elapsed time since S2 onset; isochrones are drawn every 4 ms. Lower panel (A′–E′), intermediate make–break response to the stimulus at an S1–S2 coupling interval of 195 ms. S2 has the same parameters as in the upper panel. A′, images of ΔVm distribution as a function of time. B′, image of Vm distribution during S1 repolarization. C′, image of Vm distribution 2 ms after the beginning of S2. D′, four representative traces recorded in the VC (red) and VA (blue) areas. E′, activation map with 4 ms isochrones. The blue spot in the upper left corner is an artifact from an LED used to indicate stimulus timing.
Stimulation using the 300 ms coupling interval reveals a reflective symmetrical depolarization and activation patterns typical for make stimulation in diastole (Plonsey & Barr, 1984; Wikswo et al. 1995; Roth, 1992). When the S1–S2 interval is shortened to stimulate at the end of the RRP (S1–S2 interval of 195 ms), the tissue response becomes asymmetrical. The black dashed line in Fig. 1E′ crosses the centre of the image perpendicular to the fibre direction and divides the whole image into two parts. The lower right portion demonstrates the activation pattern, which resembles that illustrated in the upper panel in Fig. 1E, whereas the upper left portion of the image reveals origination of stimulation in VA1 (Fig. 1E′). The delays between S2 onset and VA1 and VA2 activations are 16.6 ± 0.5 ms and 13.8 ± 0.3 ms, respectively. The values of the delay were calculated by averaging 121 pixels corresponding to 1 mm2 for each VA region. To illustrate the Vm distribution due to S1 planar wave at the time of S2 stimulation, the corresponding frame from the previous S1 wave undisturbed by S2 was acquired and is presented in Fig. 1B and B′. There is a Vm gradient in the lower panel when the S1–S2 coupling interval is 195 ms, and no Vm gradient exists in the upper panel under an S1–S2 coupling interval of 300 ms because the tissue is completely recovered.
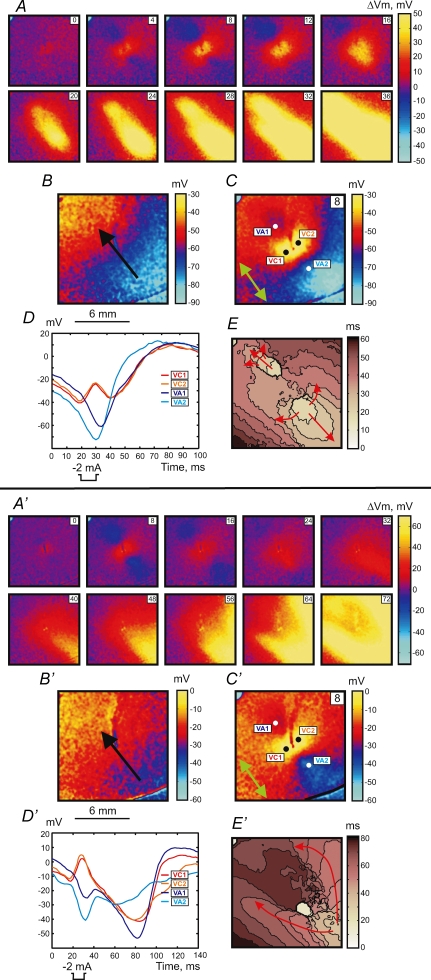
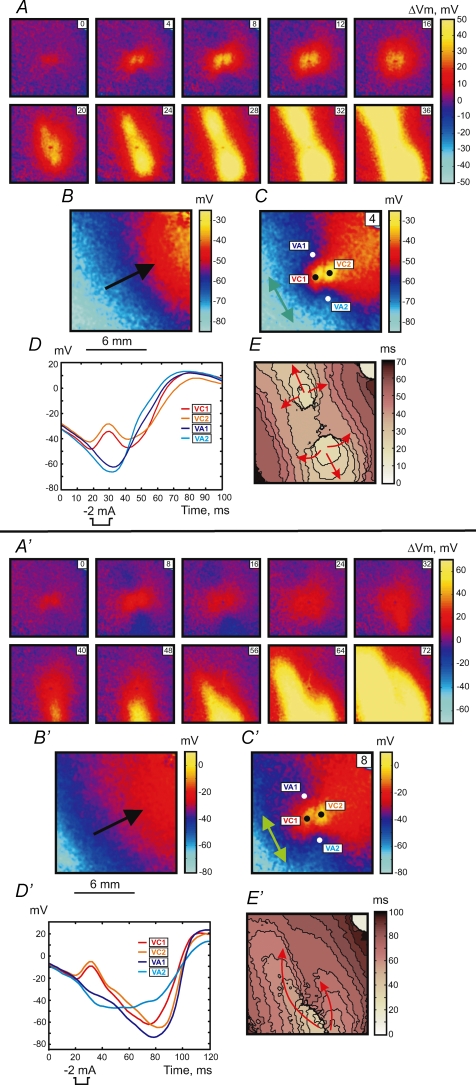
Stimulation during the RRP occurred by the break mechanism. The upper panel in Fig. 2 shows the example of break stimulation at an S1–S2 interval of 188 ms. After S2 termination the charge diffuses from the central VC to adjacent VAs and excites the tissue. This mechanism of excitation is clearly seen in the images of ΔVm distribution (Fig. 2A) and in the map of activation (Fig. 2E). The optical action potentials also indicate the origination of wave propagation from the VA areas (Fig. 2D). The 4 and 8 ms images of ΔVm demonstrate the asymmetry between VA1 and VA2 polarizations caused by nonlinear properties of the cardiac cell membrane during the action potential (Goldman & Morad, 1977). The values of ΔVm at VA1 and VA2 at the end of S2 averaged over an area of 1 mm2 were −6.5 ± 2.0 mV and −2.9 ± 1.7 mV, respectively. However, due to the gradient of S1 repolarization which is easily seen in Fig. 2B, the actual value of Vm is more negative for the VA2 region. These numbers are −56.3 ± 1.8 mV and −74.4 ± 1.8 mV for VA1 and VA2, respectively.
Figure 2.
Upper panel (A–E), break response to S2 stimulation at a coupling interval of 188 ms for S1 propagation along the fibre direction The S2 amplitude and duration are the same as in Fig. 1. Lower panel (A′–E′), DW mediated response to the stimulus at an S1–S2 coupling interval of 158 ms. The isochrones (E and E′) are drawn every 5 ms. For a detailed description see the legend to Fig. 1.
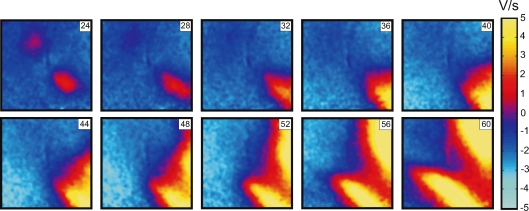
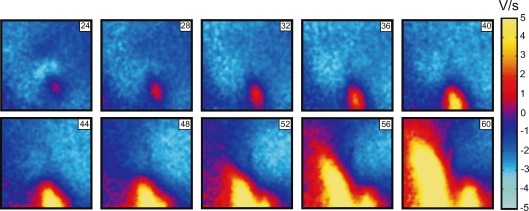
When S2 was delivered close to the ERP at an S1–S2 interval of 158 ms, charge diffusion from the central VC fails to induce excitation at either VA1 or VA2 (Fig. 2 lower panel). However a damped wave (DW) initiates at VA2 and propagates towards the lower right corner of the image (Fig. 2A′, 32 ms through 48 ms frames). During propagation the DW increases in amplitude, reaching 5 mV after a 60 ms delay since the beginning of S2 at a distance of 7 mm from the S2 electrode location. Thereafter, a newly generated full-amplitude excitation wave spreads backward around the central refractory area (Fig. 2A′, 56 ms through 72 ms frames). To better illustrate the DW dynamics, the data between 24 ms and 60 ms after S2 onset are presented separately as dVm/dt maps in Fig. 3. The origination of the S2 response distant to the stimulation site is also evident in the activation map (Fig. 2E′). The optical traces represented in Fig. 2D′ indicate that no excitation was initiated at the VA regions immediately after S2 termination. We observed similar stimulation patterns in seven separate experiments.
Figure 3.
A series of dV/dt images showing DW dynamics induced by S2 application at an S1–S2 coupling interval of 188 ms The numbers in the upper right indicate the time elapsed since S2 onset.
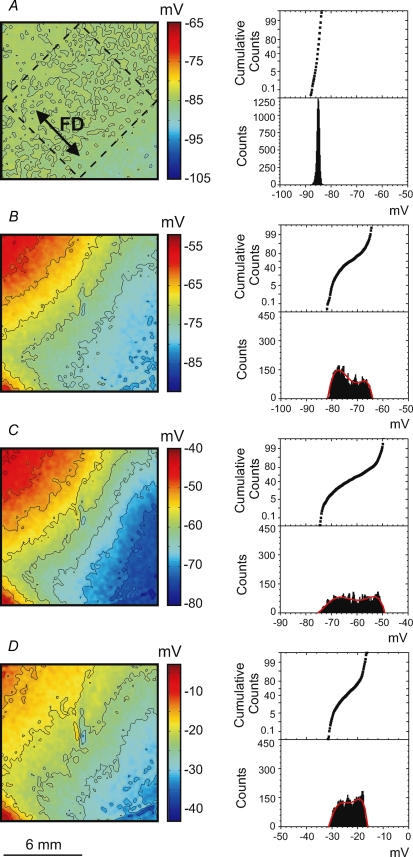
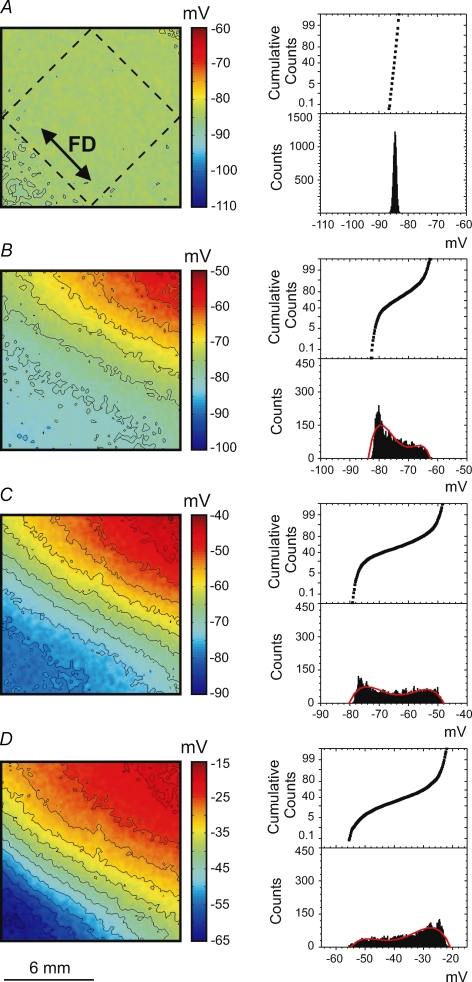
Vm at the time of S2 application is an important determinant of which particular stimulation mechanism occurs. Figure 4 shows four Vm maps that correspond to the four stimulation mechanisms described above. The maps illustrate Vm distribution at the time of S2 termination. To exclude S2 polarization from the analysis, we took the corresponding Vm images from the previous S1 planar wave, which was undisturbed by S2. Every image represents the averaged data obtained from seven separate experiments. To demonstrate the degree of Vm dispersion, histograms and cumulative sum graphs were constructed (Fig. 4, right columns) for the Vm values within the dashed square region (Fig. 4A) that is aligned with S1 repolarization. The homogeneous Vm distribution during diastole in Fig. 4A results in the make stimulation mechanism as shown in the upper panel of Fig. 1. When the Vm gradient appears at the end of RRP (Fig. 4B), make–break stimulation occurs (Fig. 1, lower panel). The polynomial fitting curve for the corresponding histogram in Fig. 4B contains two local maxima. The location of the first maximum at −77 mV suggests that a considerable portion of tissue can be excited directly by make stimulation. The second maximum located at −68 mV assumes the necessity of hyperpolarization for the sodium channels to recover from the inactivation and indicates break as the dominating mechanism of stimulation. Figure 4C shows a high density of isopotential lines indicating that a large Vm gradient correlates with break stimulation (Fig. 2, upper panel). The corresponding histogram is broad and shifted to more positive Vm in comparison with that for make–break stimulation in Fig. 4B. When stimulation occurs close to the ERP (Fig. 4D), the Vm gradient is smaller than in the previous case (Fig. 4C). Both the Vm image and histogram in Fig. 4D demonstrate that Vm ranges between −30 and −15 mV. At such levels of Vm the calcium channels are activated and might dominate in the cardiac tissue response, and therefore stimulation is mediated by a DW (Fig. 2, lower panel).
Figure 4.
Images (left column) and histograms (right column) of the Vm distribution caused by the S1 wave at the time point corresponding to the end of the S2 pulse for make (A), make–break (B), break (C) and DW (D) when the S1 planar wave propagates along the fibre direction To exclude S2 polarization, the corresponding Vm images from the previous S1 planar waves were taken. The related stimulation mechanisms are illustrated in Figs 1 and 2. Every Vm image and related histogram represents the average of 7 images acquired in separate experiments. The isopotential lines are spaced at 4 mV. To create each histogram, the data inside the rhombus located centrally in the images (as shown in A) were used. The red colour in bottom left corner is due to residual S1 repolarization.
S1 planar wave propagates transverse to the fibre direction
Figures 5 and 6 illustrate the stimulation mechanisms when the S1 planar wave propagates transverse to the fibre direction from the lower left to upper right corner of the images (black arrows in Fig. 5B, B′, 6B and 6B′). Make stimulation with an elliptical wave front originating from the central VC was observed during stimulation in resting tissue (Fig. 5, upper panel) using an S1–S2 interval of 300 ms. When S2 approaches the RRP the response exhibits a more complex pattern. The lower panel in Fig. 5 demonstrates the transitional make–break response to S2 stimulation delivered at an S1–S2 interval of 218 ms. Both the ΔVm distributions (Fig. 5A′) and the activation map (Fig. 5E′) show an asymmetrical pattern. The black dashed line drawn along the fibre direction in Fig. 5E′ divides the image into two portions. In the lower left portion, excitation occurs by the make mechanism, whereas in the upper portion the VC fails to excite the adjacent tissue transverse to the fibre direction. The stimulation occurs towards the upper right with a delay of about 26 ms after S2 onset. The VC2 trace in Fig. 5D′ displays a decrease in slope and delay in excitation after termination of S2. Similar to Fig. 1B no Vm gradient exists for the 300 ms S1–S2 coupling interval in Fig. 5B. However, when stimulation is at the end of RRP, the Vm gradient is transverse to the fibre direction (Fig. 5B′).
Figure 5.
Upper panel (A–E), make response to S2 stimulation during diastole at an S1–S2 coupling interval of 300 ms for S1 propagation transverse to the fibre direction The S1 planar wave spreads from the lower left to the upper right. For the detailed description, refer to the legend for Fig. 1. Isochrones in E are drawn every 4 ms. Lower panel (A′–E′), intermediate make–break response to the stimulus at a S1–S2 coupling interval of 218 ms. Isochrones in E′ are drawn every 5 ms.
Figure 6.
Upper panel (A–E), break response to S2 stimulation at a coupling interval of 214 ms for S1 propagation transverse to the fibre direction. Lower panel (A′–E′), DW mediated response at coupling interval of 182 ms The time resolution for isochrone maps in panels E and E′ is 5 ms. For a detailed description see the legend to Fig. 1.
Break stimulation was detected during stimulation in RRP. The upper panel in Fig. 6 shows tissue stimulation when the S1–S2 interval is 214 ms. Excitation originates from the VA1 and VA2 regions after S2 cessation. Vm at the VA1 and VA2 at the end of S2 is −66.7 ± 1.6 mV and −72.5 ± 1.9 mV (121 pixels corresponding to 1 mm2), respectively. If S2 is applied at shorter coupling intervals early in the RRP, excitation does not occur at the VAs as would be expected according to the break stimulation mechanism. In this case the tissue excitation was mediated by a DW. The lower panel in Fig. 6 illustrates the tissue response at a coupling interval of 182 ms. After S2 termination the DW initiates and propagates downward from the central region of the image beginning with the 24 ms frame (Fig. 6A′ and D′). The full-amplitude response develops at the lower part of the mapping area and achieves 5 mV after 33 ms (with 57 ms delay since S2 onset). Figure 7 displays the DW dynamics in terms of dVm/dt for time points between 24 and 60 ms after S2 onset. The newly generated wave front moves around the line of conduction block and spreads towards the upper right corner (Fig. 6E′). These four stimulation modes were observed in every rabbit heart (n = 7).
Figure 7.
A series of dV/dt images showing DW dynamics induced by S2 application at an S1–S2 coupling interval of 182 ms when S1 spreads transverse to the fibre direction
Figure 8 demonstrates the average Vm distributions at the end of S2. The four Vm images correspond to the four stimulation mechanisms described in the two previous paragraphs, when an S1 planar wave spreads transverse to the fibre direction. Akin to Fig. 4, we display in Fig. 8 the distributions of the S1 repolarization undisturbed by S2. The corresponding Vm images were taken from the preceding S1 planar wave prior to applying the S2 pulse. Because the conduction velocity transverse to the fibre direction (22.1 ± 3.9, n = 7) is slower than along the fibre direction (54.1 ± 3.6, n = 7), the Vm gradient during repolarization is larger in Fig. 8 than in Fig. 4. During stimulation in diastole, there is no Vm gradient and the tissue is excited by make stimulation (Fig. 8A). Similar to S1 stimulation along the fibre direction (Fig. 4B), the make–break response for the transverse S1 stimulation is observed when approximately half of the imaged tissue is recovered and the other half of the tissue has a Vm gradient due to the S1-induced gradient in repolarization (Fig. 8B). The related histogram displays a maximum at −80 mV. When stimulation is initiated by break, the histogram demonstrates a variation of Vm between −79 and −48 mV (Fig. 8C). It should be noted that because of the VAs located approximately along the isopotential lines (Fig. 6C), the difference between the levels of hyperpolarization at VA1 and VA2 (5.8 mV) is less than when VAs are located transversely to the isopotential lines (18.1 mV). As a result, the break response in Fig. 6 is more symmetrical than in Fig. 2. Figure 8D illustrates the Vm distribution related to a DW mediated response (Fig. 6, lower panel). The histogram exhibits a shift of Vm to more positive values in comparison with our results for the break stimulation. Curve fitting reveals a maximum at −27 mV.
Figure 8.
The images of Vm distribution (left column) and the Vm histograms (right column) caused by the S1 wave at the time point corresponding to the end of the S2 pulse related to four different stimulation mechanisms when the S1 planar wave propagates transverse to the fibre direction A, make stimulation; B, intermediate make–break stimulation; C, break stimulation; D, DW mediated stimulation. For a detailed description, refer to the legend to Fig. 4.
Discussion
In previous experimental studies investigating the critical point hypothesis (Winfree, 1983, 1987), extracellular multielectrode mapping systems were utilized (Chen et al. 1988; Shibata et al. 1988a, b; Frazier et al. 1989). In those investigations, due to stimulation artifacts and the lack of high resolution Vm distribution maps, it was impossible to analyse the mechanisms of stimulation during different phases of the preceding S1 repolarization tail. Therefore we aspired to elucidate the stimulation mechanisms in the pinwheel experiment using optical mapping of Vm in cryoablated two-dimensional preparations of the rabbit heart with well defined fibre geometry. We tested moderate cathodal stimulation of about 13 times threshold for point S2 with S1-induced repolarization gradients either parallel or perpendicular to the fibre direction. We identified four different mechanisms of cardiac tissue excitation depending on the distribution of Vm values during S2 application. These are make, transitional make–break, break, and damped wave mediated excitation.
Our results are in a good agreement with the theoretical predictions of Lindblom et al. (2000) where make, make–break and break excitation were described. However, there are some differences. Because we did not seek to examine a broad range of S2 current intensities to investigate vulnerability, we did not observe reentry resulting from break stimulation. For instance, in experimental conditions similar to ours, Lin et al. (1999) used a point stimulation S1–S2 protocol to induce quatrefoil reentry using a cathodal S2 stimulus of 20 mA. Another of our observations was that for short S1–S2 coupling intervals, we experimentally detected excitation mediated by a DW followed by one cycle of reentry.
Earlier investigations of excitability demonstrated that if S2 is delivered during the RRP it can induce a graded response, which depends on the strength of stimulation and the S1–S2 interval (Hoffman et al. 1951, 1957; Kao & Hoffman, 1958; Skale et al. 1985). This response can either be local or can induce a DW with weakened amplitude and velocity (Kao & Hoffman, 1958; Gray et al. 2001; Trayanova et al. 2003; Sidorov et al. 2003a; Evans & Gray, 2004). There is evidence that a local graded response can prolong refractoriness and create heterogeneous excitability, thereby facilitating reentry induction (Chen et al. 1988; Shibata et al. 1988a, b; Knisley et al. 1992). Gotoh et al. (1997) using microelectrodes together with an extracellular mapping system, found that the propagation of a graded response can control figure-of-eight reentry initiation in the pinwheel experiment. However the shock artifact prevented any data recording during and immediately after S2 stimulation. In addition Gotoh et al. applied S2 via a bipolar electrode, which produces complex polarization patterns depending on both interelectrode distance and the position of the stimulating dipole with respect to the fibre direction (Sepulveda & Wikswo, 1994).
The response mediated by a propagating DW described in our study is consistent with data obtained by Gotoh et al. (1997). The DW was initiated at a VA after S2 termination and slowly propagated downstream toward more recovered tissue until it developed into a normal full-amplitude response. It should be noted that no sharp transition from break to DW mediated response exists. As the S1–S2 interval shortens and approaches refractoriness, the origin of the full-amplitude response moves from the VA region towards the boundary of our imaged area. In particular, during S1 propagation along the fibre direction the relatively longer coupling intervals correlated with a lower amplitude DW that originated at VA1 and propagated over a longer distance through more refractory tissue than a DW generated at VA2. Under shorter S1–S2 intervals a DW propagated from VA1 for a shorter distance; the amplitude of the DW declined and became unable to induce full-amplitude excitation. During the same time due to increased refractoriness, the opposite DW spreads for a longer distance with increasing delay between S2 and appearance of a full-amplitude response. When S1 propagates transverse to the fibre direction, the S2 stimulation creates VAs that occur almost perpendicularly to the recovery gradient. Hence one would expect that the tissue response will be mediated by both DWs with similar dynamics. However, when S2 is delivered close to refractoriness we always observed excitation mediated by one DW. The DW from VA2 mediated the response in six analysed experiments and in one experiment the DW originating at VA1 was responsible for stimulation of the tissue.
One explanation could be the mismatch between the position of repolarization front and the location of VAs when the repolarization isocontours are tilted relative to the fibre direction. This leads to a dissimilar degree of hyperpolarization at VA1 and VA2 and results in different DW dynamics. Another reason could be non-uniform cryoablation of the myocardium. Although we controlled the thickness of the surviving surface layer in every experiment, the small variation over the preparation could be sufficient to cause differences in the activation dynamics.
Both the Vm gradient and fibre direction affect DW propagation. The direction of DW propagation coincides with the fibre direction during S1 propagation along the fibre direction. When S1 propagation is transverse to the fibre direction, the DW propagates in a direction that is between the Vm gradient and the fibre direction. The repolarization gradient played a major role in make–break stimulation. The Vm gradient in Figs 4B and 8B comprises approximately half of the image. In this phase of the action potential the hyperpolarization is too weak to elicit the break response, yet the elevation of Vm towards the repolarization tail of the S1 planar wave impedes propagation in this direction and facilitates a break mechanism. The opposite part of the image shows an almost flat voltage distribution close to resting Vm levels that support make stimulation. The effect of the Vm gradient on break excitation was more prominent when an S1 planar wave propagated along the fibre direction, leading to an asymmetric S2 stimulation pattern, than during transverse propagation of an S1 wave, when the levels of VA1 and VA2 polarizations were similar.
Emphasis should be placed on the differences between the S1–S2 point stimulation protocol wherein the geometry of S1 recovery is symmetrical and the S1–S2 pinwheel stimulation protocol in which the S1 planar wave creates asymmetric recovery. In the latter case both the polarization patterns and activation outcomes change depending on the orientation of the fibre direction with respect to the direction of S1 repolarization.
In conclusion, this work is the first experimental investigation of the role of virtual electrode polarization in stimulation during the pinwheel protocol. Elucidating the stimulation mechanisms during the repolarization phase is of particular importance for advancement of stimulation protocols used in implantable pacemakers and cardioverter-defibrillators.
Limitations
The electromechanical uncoupler BDM was used to reduce motion artifacts during the optical measurements. The side-effect of the BDM is species dependent. In the rabbit heart adding 20 mm of BDM causes slowing conduction velocity and flattening of the restitution curve (Banville & Gray, 2002). The effect on the action potential duration is controversial. Banville & Gray (2002) as well as Cheng et al. (2004) reported shortening of AP duration at the 90% level of recovery whereas Kettlewell et al. (2004) observed insignificant changes.
Previously we investigated the effect of BDM on the strength–interval curve and found that BDM does not change such typical strength–interval curve characteristics as falloff, plateau and dip that are related with the different mechanisms of stimulation (Sidorov et al. 2005).
Acknowledgments
This work was supported by the National Institutes of Health (RO1-HL58241) and the American Heart Association (0635037 N).
References
- Allessie MA, Schalij MJ, Kirchhof CJ, Boersma L, Huybers M, Hollen J. Experimental electrophysiology and arrhythmogenicity. Anisotropy and ventricular tachycardia. Eur Heart J. 1989;10(Suppl. E):2–8. doi: 10.1093/eurheartj/10.suppl_e.2. [DOI] [PubMed] [Google Scholar]
- Banville I, Gray RA. Effect of action potential duration and conduction velocity restitution and their spatial dispersion on alternans and the stability of arrhythmias. J Cardiovasc Electrophysiol. 2002;13:1141–1149. doi: 10.1046/j.1540-8167.2002.01141.x. [DOI] [PubMed] [Google Scholar]
- Brugada J, Boersma L, Kirchhof C, Brugada P, Havenith M, Wellens HJ, Allessie MA. Double-wave reentry as a mechanism of acceleration of ventricular tachycardia. Circulation. 1990;81:1633–1643. doi: 10.1161/01.cir.81.5.1633. [DOI] [PubMed] [Google Scholar]
- Chen PS, Wolf PD, Dixon EG, Danieley ND, Frazier DW, Smith WM, Ideker RE. Mechanism of ventricular vulnerability to single premature stimuli in open-chest dogs. Circ Res. 1988;62:1191–1209. doi: 10.1161/01.res.62.6.1191. [DOI] [PubMed] [Google Scholar]
- Cheng Y, Li L, Nikolski V, Wallick DW, Efimov IR. Shock-induced arrhythmogenesis is enhanced by 2,3-butanedione monoxime compared with cytochalasin D. Am J Physiol Heart Circ Physiol. 2004;286:H310–H318. doi: 10.1152/ajpheart.00092.2003. [DOI] [PubMed] [Google Scholar]
- Cranefield PF, Hoffman BF, Siebens AA. Anodal excitation of cardiac muscle. Am J Physiol. 1957;190:383–390. doi: 10.1152/ajplegacy.1957.190.2.383. [DOI] [PubMed] [Google Scholar]
- Dekker E. Direct current make and break thresholds for pacemaker electrodes on the canine ventricle. Circ Res. 1970;27:811–823. doi: 10.1161/01.res.27.5.811. [DOI] [PubMed] [Google Scholar]
- Evans FG, Gray RA. Shock-induced epicardial and endocardial virtual electrodes leading to ventricular fibrillation via reentry, graded responses, and transmural activation. J Cardiovasc Electrophysiol. 2004;15:79–87. doi: 10.1046/j.1540-8167.2004.03312.x. [DOI] [PubMed] [Google Scholar]
- Frazier DW, Wolf PD, Wharton JM, Tang AS, Smith WM, Ideker RE. Stimulus-induced critical point. Mechanism for electrical initiation of reentry in normal canine myocardium. J Clin Invest. 1989;83:1039–1052. doi: 10.1172/JCI113945. [DOI] [PMC free article] [PubMed] [Google Scholar]
- Goldman Y, Morad M. Ionic membrane conductance during the time course of the cardiac action potential. J Physiol. 1977;268:655–695. doi: 10.1113/jphysiol.1977.sp011876. [DOI] [PMC free article] [PubMed] [Google Scholar]
- Gotoh M, Uchida T, Mandel WJ, Fishbein MC, Chen PS, Karagueuzian HS. Cellular graded responses and ventricular vulnerability to reentry by a premature stimulus in isolated canine ventricle. Circulation. 1997;95:2141–2154. doi: 10.1161/01.cir.95.8.2141. [DOI] [PubMed] [Google Scholar]
- Gray RA, Huelsing DJ, Aguel F, Trayanova NA. Effect of strength and timing of transmembrane current pulses on isolated ventricular myocytes. J Cardiovasc Electrophysiol. 2001;12:1129–1137. doi: 10.1046/j.1540-8167.2001.01129.x. [DOI] [PubMed] [Google Scholar]
- Henriquez CS. Simulating the electrical behavior of cardiac tissue using the bidomain model. Crit Rev Biomed Eng. 1993;21:1–77. [PubMed] [Google Scholar]
- Hoffman BF, Gorin EF, Wax FS, Siebens AA, Brooks CM. Vulnerability to fibrillation and the ventricular-excitability curve. Am J Physiol. 1951;167:88–94. doi: 10.1152/ajplegacy.1951.167.1.88. [DOI] [PubMed] [Google Scholar]
- Hoffman BF, Kao CY, Suckling EE. Refractoriness in cardiac muscle. Am J Physiol. 1957;190:473–482. doi: 10.1152/ajplegacy.1957.190.3.473. [DOI] [PubMed] [Google Scholar]
- Kao CY, Hoffman BF. Graded and decremental response in heart muscle fibers. Am J Physiol. 1958;194:187–196. doi: 10.1152/ajplegacy.1958.194.1.187. [DOI] [PubMed] [Google Scholar]
- Kettlewell S, Walker NL, Cobbe SM, Burton FL, Smith GL. The electrophysiological and mechanical effects of 2,3-butane-dione monoxime and cytochalasin-D in the Langendorff perfused rabbit heart. Exp Physiol. 2004;89:163–172. doi: 10.1113/expphysiol.2003.026732. [DOI] [PubMed] [Google Scholar]
- Knisley SB. Transmembrane voltage changes during unipolar stimulation of rabbit ventricle. Circ Res. 1995;77:1229–1239. doi: 10.1161/01.res.77.6.1229. [DOI] [PubMed] [Google Scholar]
- Knisley SB, Smith WM, Ideker RE. Effect of field stimulation on cellular repolarization in rabbit myocardium. Implications for reentry induction. Circ Res. 1992;70:707–715. doi: 10.1161/01.res.70.4.707. [DOI] [PubMed] [Google Scholar]
- Lin SF, Roth BJ, Wikswo JP., Jr Quatrefoil reentry in myocardium: an optical imaging study of the induction mechanism. J Cardiovasc Electrophysiol. 1999;10:574–586. doi: 10.1111/j.1540-8167.1999.tb00715.x. [DOI] [PubMed] [Google Scholar]
- Lindblom AE, Roth BJ, Trayanova NA. Role of virtual electrodes in arrhythmogenesis: pinwheel experiment revisited. J Cardiovasc Electrophysiol. 2000;11:274–285. doi: 10.1111/j.1540-8167.2000.tb01796.x. [DOI] [PubMed] [Google Scholar]
- Nachlas MM, Shnitka TK. Macroscopic identification of early myocardial infarcts by alterations in dehydrogenase activity. Am J Pathol. 1963;42:379–405. [PMC free article] [PubMed] [Google Scholar]
- Neunlist M, Tung L. Spatial distribution of cardiac transmembrane potentials around an extracellular electrode: dependence on fiber orientation. Biophys J. 1995;68:2310–2322. doi: 10.1016/S0006-3495(95)80413-3. [DOI] [PMC free article] [PubMed] [Google Scholar]
- Plonsey R, Barr RC. Current flow patterns in two-dimensional anisotropic bisyncytia with normal and extreme conductivities. Biophys J. 1984;45:557–571. doi: 10.1016/S0006-3495(84)84193-4. [DOI] [PMC free article] [PubMed] [Google Scholar]
- Roth BJ. How the anisotropy of the intracellular and extracellular conductivities influences stimulation of cardiac muscle. J Math Biol. 1992;30:633–646. [PubMed] [Google Scholar]
- Roth BJ. A mathematical model of make and break electrical stimulation of cardiac tissue by a unipolar anode or cathode. IEEE Trans Biomed Eng. 1995;42:1174–1184. doi: 10.1109/10.476124. [DOI] [PubMed] [Google Scholar]
- Roth BJ. The pinwheel experiment revisited. J Theor Biol. 1998;190:389–393. doi: 10.1006/jtbi.1997.0565. [DOI] [PubMed] [Google Scholar]
- Roth BJ, Wikswo JP., Jr A bidomain model for the extracellular potential and magnetic field of cardiac tissue. IEEE Trans Biomed Eng. 1986;33:467–469. doi: 10.1109/TBME.1986.325804. [DOI] [PubMed] [Google Scholar]
- Sambelashvili A, Efimov IR. The pinwheel experiment re-revisited. J Theor Biol. 2002;214:147–153. doi: 10.1006/jtbi.2001.2456. [DOI] [PubMed] [Google Scholar]
- Sepulveda NG, Roth BJ, Wikswo JP., Jr Current injection into a two-dimensional anisotropic bidomain. Biophys J. 1989;55:987–999. doi: 10.1016/S0006-3495(89)82897-8. [DOI] [PMC free article] [PubMed] [Google Scholar]
- Sepulveda NG, Wikswo JP., Jr Electric and magnetic fields from two-dimensional anisotropic bisyncytia. Biophys J. 1987;51:557–568. doi: 10.1016/S0006-3495(87)83381-7. [DOI] [PMC free article] [PubMed] [Google Scholar]
- Sepulveda NG, Wikswo JP., Jr Bipolar stimulation of cardiac tissue using an anisotropic bidomain model. J Cardiovasc Electrophysiol. 1994;5:258–267. doi: 10.1111/j.1540-8167.1994.tb01162.x. [DOI] [PubMed] [Google Scholar]
- Shibata N, Chen PS, Dixon EG, Wolf PD, Danieley ND, Smith WM, Ideker RE. Epicardial activation after unsuccessful defibrillation shocks in dogs. Am J Physiol Heart Circ Physiol. 1988a;255:H902–H909. doi: 10.1152/ajpheart.1988.255.4.H902. [DOI] [PubMed] [Google Scholar]
- Shibata N, Chen PS, Dixon EG, Wolf PD, Danieley ND, Smith WM, Ideker RE. Influence of shock strength and timing on induction of ventricular arrhythmias in dogs. Am J Physiol Heart Circ Physiol. 1988b;255:H891–H901. doi: 10.1152/ajpheart.1988.255.4.H891. [DOI] [PubMed] [Google Scholar]
- Sidorov VY, Aliev RR, Woods MC, Baudenbacher F, Baudenbacher P, Wikswo JP. Spatiotemporal dynamics of damped propagation in excitable cardiac tissue. Phys Rev Lett. 2003a;91:208104. doi: 10.1103/PhysRevLett.91.208104. [DOI] [PubMed] [Google Scholar]
- Sidorov VY, Woods MC, Baudenbacher P, Baudenbacher F. Examination of stimulation mechanism and strength-interval curve in cardiac tissue. Am J Physiol Heart Circ Physiol. 2005;289:H2602–H2615. doi: 10.1152/ajpheart.00968.2004. [DOI] [PubMed] [Google Scholar]
- Sidorov VY, Woods MC, Wikswo JP. Effects of elevated extracellular potassium on the stimulation mechanism of diastolic cardiac tissue. Biophys J. 2003b;84:3470–3479. doi: 10.1016/S0006-3495(03)70067-8. [DOI] [PMC free article] [PubMed] [Google Scholar]
- Skale BT, Kallok MJ, Prystowsky EN, Gill RM, Zipes DP. Inhibition of premature ventricular extrastimuli by subthreshold conditioning stimuli. J Am Coll Cardiol. 1985;6:133–140. doi: 10.1016/s0735-1097(85)80264-3. [DOI] [PubMed] [Google Scholar]
- Trayanova NA, Gray RA, Bourn DW, Eason JC. Virtual electrode-induced positive and negative graded responses: new insights into fibrillation induction and defibrillation. J Cardiovasc Electrophysiol. 2003;14:756–763. doi: 10.1046/j.1540-8167.2003.03042.x. [DOI] [PubMed] [Google Scholar]
- Trayanova NA, Henriquez CS. Modification of a cylindrical bidomain model for cardiac tissue. Math Biosci. 1991;104:59–72. doi: 10.1016/0025-5564(91)90030-m. [DOI] [PubMed] [Google Scholar]
- Wikswo JP., Jr The complexities of cardiac cables: virtual electrode effects. Biophys J. 1994;66:551–553. doi: 10.1016/s0006-3495(94)80832-x. [DOI] [PMC free article] [PubMed] [Google Scholar]
- Wikswo JP., Jr . Tissue anisotropy, the cardiac bidomain and the virtual cathode effect. In: Zipes D, Jalife J, editors. Cardiac Electrophysiology: From Cell to Bedside. Philadelphia: Saunders; 1995. pp. 348–361. [Google Scholar]
- Wikswo JP, Jr, Lin SF, Abbas RA. Virtual electrodes in cardiac tissue: a common mechanism for anodal and cathodal stimulation. Biophys J. 1995;69:2195–2210. doi: 10.1016/S0006-3495(95)80115-3. [DOI] [PMC free article] [PubMed] [Google Scholar]
- Winfree AT. Sudden cardiac death: a problem in topology. Sci Am. 1983;248:144–161. doi: 10.1038/scientificamerican0583-144. [DOI] [PubMed] [Google Scholar]
- Winfree AT. When Time Breaks Down: The Three-Dimensional Dynamics of Electrochemical Waves and Cardiac Arrhythmias. Princeton: Princeton University Press; 1987. [Google Scholar]
- Winfree AT. Electrical instability in cardiac muscle: phase singularities and rotors. J Theor Biol. 1989;138:353–405. doi: 10.1016/s0022-5193(89)80200-0. [DOI] [PubMed] [Google Scholar]


