

Abstract
We used the whole-cell recording technique to examine the effect of extracellular Zn2+ on macroscopic currents due to Kv1.5 channels expressed in the human embryonic kidney cell line HEK293.
Fits of a Boltzmann function to tail current amplitudes showed that 1 mm Zn2+ shifted the half-activation voltage from -10.2 ± 0.4 to 21.1 ± 0.7 mV and the slope factor increased from 6.8 ± 0.4 to 9.4 ± 0.7 mV. The maximum conductance in 1 mm Zn2+ and with 3.5 mm K+o was 33 ± 7 % of the control value.
In physiological saline the apparent KD for the Zn2+ block was 650 ± 24 μm and was voltage independent. A Hill coefficient of 1.0 ± 0.03 implied that block is mediated by the occupation of a single binding site.
Increasing the external concentration of K+ ([K+]o) inhibited the block by Zn2+. Estimates of the apparent KD of the Zn2+ block in 0, 5 and 135 mm K+ were 69, 650 and 2100 μm, respectively. External Cs+ relieved the Zn2+ block but was less effective than K+. Changing [K+]o did not affect the Zn2+-induced gating shift.
A model of allosteric inhibition fitted to the relationship between the block by Zn2+ and the block relief by external K+ gave KD estimates of ≈70 μm for Zn2+ and ≈500 μm for K+.
We propose that the gating shift and the block caused by Zn2+ are mediated by two distinct sites and that the blocking site is located in the external mouth of the pore.
Changing the extracellular concentration of divalent cations can have dramatic effects on the behaviour of electrically excitable membranes as illustrated by the lowering or raising of the threshold for cell firing caused by hypo- or hypercalcaemia, respectively (Frankenhaeuser & Hodgkin, 1957). Voltage-clamp analyses have shown that the divalent cation-induced change of excitability can be linked to a shift of the voltage dependence of channel gating. For example, an elevation of the external concentration of Ca2+ ([Ca2+]o) produces a depolarizing shift of the midpoint (V1/2) of the activation curves of both voltage-gated Na+ and K+ channels of the squid giant axon (Hille et al. 1975; Hahin & Campbell, 1983). Decreasing [Ca2+]o produces the converse effect.
This Ca2+-induced shift of V1/2, which is also known as the gating shift, has been attributed at least in part to charge screening, a process in which negative surface charges on or near the ion channel are partially neutralized so that the electric field sensed by the channel is altered. Zn2+ and Cd2+ can cause a gating shift at concentrations as much as two orders of magnitude lower than those required with Ca2+. This higher potency of Zn2+ and Cd2+ cannot be accounted for solely by simple surface charge screening which predicts that all divalent ion species would equally shift V1/2 and therefore it has been proposed that selective binding also occurs.
Zn2+ and Cd2+ can also cause channel block but the blocking potency varies between channel types. For example, whereas cardiac voltage-gated Na+ channels are blocked by micromolar concentrations of Cd2+ or Zn2+, millimolar levels are needed to block voltage-gated Na+ channels of skeletal muscle and brain (Backx et al. 1992). Likewise, voltage-gated K+ (Kv) channels show considerable variability in their sensitivity to Zn2+ or Cd2+ block. In the squid giant axon 40 mm Zn2+ caused approximately a 20 % reduction of the steady-state K+ current (Gilly & Armstrong, 1982; Spires & Begenisich, 1992). In myelinated fibres of Xenopus, 3.4 mm Zn2+ decreased the K+ permeability by ≈10 % (Arhem, 1980) while 0.1 mm Zn2+ reduced the maximum K+ conductance of frog skeletal muscle by ≈60 % (Stanfield, 1975). More recent work with cloned Kv channels has shown that Kv1.2 and Kv2.1 channels are relatively insensitive to Zn2+ block (De Biasi et al. 1993; Poling et al. 1996) whereas 500 μm Zn2+ causes a ≈70 % inhibition of Kv3.1 currents (Poling et al. 1996).
We have studied the effect of Zn2+ on the ionic currents carried by Kv1.5 channels expressed in HEK293 cells. Kv1.5 channels underlie the ultrarapid delayed rectifier current of cardiac and smooth muscle (Fedida et al. 1993; Overturf et al. 1994). Aside from confirming the gate-shifting effect of external Zn2+, we have found that Zn2+ also causes a concentration-dependent and voltage-independent block. We propose that the blocking action, which is relieved in a concentration-dependent manner by external K+, arises from the binding of Zn2+ in the external mouth of the Kv1.5 channel pore.
METHODS
Cell preparation
Kv1.5 channels were studied in a human embryonic kidney cell line (HEK293) as we have reported previously (Wang et al. 2000). Cells were passaged by using trypsin-EDTA and were maintained in minimum essential medium (MEM), 10 % fetal bovine serum, penicillin-streptomycin and 0.5 mg ml−1 geneticin at 37 °C in 5 % CO2 in air. All tissue culture supplies were obtained from Canadian Life Technologies (Burlington, ON, Canada).
Signal recording and analysis
Glass coverslips to which the cells had adhered were removed from the incubator prior to an experiment and placed in a saline-filled recording chamber mounted on the stage of an inverted phase contrast microscope. Test solutions were applied by switching the solution inflow to the chamber. Whole-cell voltage-clamp recording and data analysis were performed using an Axopatch 200A amplifier and pCLAMP 6 software (Axon Instruments, Foster City, CA, USA). The reference electrode consisted of a Ag-AgCl pellet placed directly in the bath or connected indirectly via a 150 mm NaCl-containing agar bridge. Patch electrodes fabricated from thin-walled borosilicate glass (World Precision Instruments, FL, USA) had a resistance, after fire-polishing, of 1-3 MΩ. Capacitance compensation and series resistance compensation (70-80 %) were used. Data were filtered at 3-10 kHz (-3 dB) and sampled at 5-6 times the -3 dB frequency. Voltages are expressed without any compensation for liquid junction potentials (< 5 mV). The holding potential was -80 mV and the stimulus frequency was 0.1 Hz. Results are expressed as the mean ± standard error of the mean.
To quantify the blocking effect of Zn2+, tail currents recorded at -50 or -40 mV were measured 300-600 μs after the voltage step and normalized with respect to the maximum control tail current. Normalized tail currents were then plotted against the pre-pulse voltage and fitted to a single Boltzmann function:
| (1) |
where Y is the normalized tail current, gmax,Zn/gmax is the ratio of the maximum conductance in Zn2+ to that in control medium, or equally the proportion of gmax, V1/2 is the half-activation potential or mid-point of the activation curve, V is the voltage during the pre-pulse and s is the slope factor, which reflects the steepness of the voltage dependence. This same approach in which block is assessed from activation curves has been used by others to quantify the block by divalent cations (e.g. Favre et al. 1995) and has the advantage of avoiding complications due to the gating shift. Concentration-response data were fitted to the Hill equation:
| (2) |
where Y is the proportion of gmax, KD is the dissociation constant and H is the Hill coefficient, which reflects the number of binding sites.
Models of competitive and allosteric (non-competitive) inhibition
If Zn2+ and K+ compete for binding at the same site, then the relationship between the proportion of gmax (gmax,Zn/gmax) and [Zn2+] is:
 |
(3) |
where K'Zn, the apparent dissociation constant, is defined as:
| (4) |
where KZn is the dissociation constant for Zn2+ in 0 mm K+o and KK is the dissociation constant for the binding of K+. With allosteric (non-competitive) inhibition it is assumed that the binding sites for Zn2+ and K+ are separate and that there is a reciprocal negative interaction between the binding sites. The scheme for allosteric inhibition is:
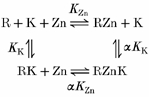 |
where R represents the channel and α is the factor by which the binding of K+ or Zn2+ increases KZn and KK, respectively (i.e. K+ binding decreases the affinity of Zn2+ at its binding site and vice versa). From algebraic expressions for the binding reactions it can be shown that the relationship between the proportion of gmax and [Zn2+] is:
 |
(5) |
where K′′Zn, the apparent equilibrium dissociation constant for Zn2+, is:
 |
(6) |
This model makes no explicit assumptions about the kinetics or state dependence of binding at either site and the outcome is the same if the binding scheme is made non-cyclical by precluding one of the binding/unbinding reactions, e.g. by the constraint that K+ association or dissociation occurs only if the Zn2+ site is not occupied.
Recording solutions
The standard bath solution contained (mm): 135 NaCl, 5 KCl, 10 Hepes, 2 CaCl2, 1 MgCl2 and 10 glucose. The pH was adjusted to 7.4 with NaOH. Where its effects on the block by Zn2+ were examined, the K+ concentration was increased by equimolar exchange of KCl for NaCl or vice versa in the case of the K+-free bath solution. Na+- and K+- free bath solution was prepared by substituting N-methyl-d-glucamine (NMDG+) for NaCl and KCl and by titrating to pH 7.4 with HCl. For the 3.5 mm Cs+-containing solutions, CsCl replaced KCl; for higher Cs+ concentrations CsCl replaced KCl and was then substituted as needed for NaCl. The patch pipette solution typically contained 135 KCl, 5 EGTA, 10 Hepes, 1 MgCl2, 4 Na2ATP and 0.1 GTP at a pH of 7.2. All chemicals were obtained from Sigma Aldrich Chemical Co. (Mississauga, ON, Canada).
Zn2+-containing solutions were prepared by the addition, without osmotic compensation, of ZnCl2 from a 1.0 or 0.1 m acidified stock solution. The pH of test solutions was not altered by the addition of ZnCl2. Zn2+ reacts with hydroxyl ions to form Zn(OH)2, a sparingly soluble salt. The solubility product (KSP) for the reaction is approximately 4.5 × 10⁻¹⁷ (Latimer, 1952) but the salt or electrolyte effect (Morris, 1974) causes the apparent KSP to increase as the ionic strength of the solution is increased. If the salt effect is ignored, then at pH 7.4 ([OH−]= 10−6.6) the maximum achievable concentration of Zn2+ would be roughly 0.7 mm (4.5 × 10−17=[Zn2+][OH−]2). With the ionic strength of our solutions the solubility limit of Zn2+ was near 5 mm and this was the highest concentration used. To test the actions of 1 mm Cd2+, CdCl2 was added directly from a 1 m stock solution to K+-free bath solution; for 5 mm Cd2+, CdCl2 was substituted on an isosmotic basis for NaCl in the K+-free bath solution. Solubility is much less of a problem with Cd2+ since the KSP for Cd(OH)2 is ≈5.3 × 10⁻¹⁵. Although Cd2+, unlike Zn2+, binds to Hepes, at the concentration used in the external solution less than 10 % is bound (Cherny & DeCoursey, 1999) and we made no correction for this binding.
RESULTS
Effects of Zn2+ on Kv1.5 gating and conductance
Figure 1 illustrates the effects of 1 mm Zn2+ on Kv1.5 currents. Shown superimposed in Fig. 1A are typical control currents evoked in standard bath solution from a holding potential of -80 mV. The voltage protocol consisted of a series of 100 ms depolarizing pre-pulses going from -60 to 80 mV in 10 mV increments. Each depolarizing pulse was immediately followed by a step to -40 mV for 50 ms to record the tail current. After switching to the Zn2+-containing medium (Fig. 1B), the pulse currents showed a prominent slowing of the activation kinetics and there was also a modest acceleration of the deactivation kinetics. This is shown in Fig. 1C where the control and treated responses evoked at 50 mV are shown superimposed before (upper traces) and after normalization (lower traces). In seven cells, the deactivation time constant, estimated by single exponential fits to the tail current recorded at -40 mV, decreased from 10.7 ± 1.4 to 6.9 ± 0.7 ms. Details of the Zn2+-induced changes of the activation kinetics are given below (Fig. 3). The effects of Zn2+ on the activation and deactivation kinetics are provisionally attributed to the gate-shifting effect of Zn2+, as described by others (Gilly & Armstrong, 1982). This paper focuses on the reduction of the amplitudes of pulse and tail currents evident in Fig. 1B, which is referred to as current block. Complete reversal of all of the effects of Zn2+ was observed after returning to Zn2+-free medium (not shown).
Figure 1. Zn2+ effects on the Kv1.5 activation curve and activation-deactivation kinetics.
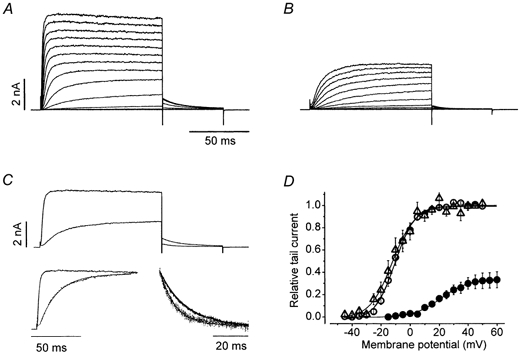
In addition to a gate-shifting effect, 1 mm external Zn2+ causes a reversible reduction of Kv1.5 currents. Shown in A and B are the control and treated current traces, respectively, taken from the same cell. Pulse currents were evoked by a series of 100 ms step commands from -60 to 80 mV in 10 mV increments. Immediately following each pulse command the voltage was stepped to -40 mV for 50 ms to record the tail current. For this and all other figures the holding potential was -80 mV. Zn2+ reduced both pulse and tail currents. Zn2+-induced slowing of the activation time course and acceleration of the deactivation kinetics are shown in C where the responses at 50 mV in A and B have been superimposed (upper trace). In the lower trace the pulse and tail currents in Zn2+ have been normalized. The activation time course which was fitted to a single exponential, which is overlaid on the current response, had a time constant that increased from 1.76 ms in the control medium to 16.9 ms in Zn2+. The time constant of the exponential fitted to the tail current at -40 mV decreased from 15.1 ms in control to 9.1 ms in Zn2+. All of these effects were completely reversible. Shown in D is the activation curve obtained by plotting the peak of the tail current, normalized with respect to the control responses, against the pulse voltage. The continuous line represents the best fit to a single Boltzmann function of the control (○), treated (•) and recovery (△) data obtained from 10 cells. Fitted values for the half-activation voltage (V1/2) and the slope factor (s) were, respectively, -10.2 and 6.8 mV (○), 21.1 and 9.4 mV (•) and -12.1 and 7.7 mV (△). In 1 mm Zn2+ and with 3.5 mm K+o, the maximum conductance (gmax,Zn) was 0.33 ± 0.07 of the control maximum conductance (gmax).
Figure 3. Increasing [K+]o reduces the blocking effect of Zn2+.
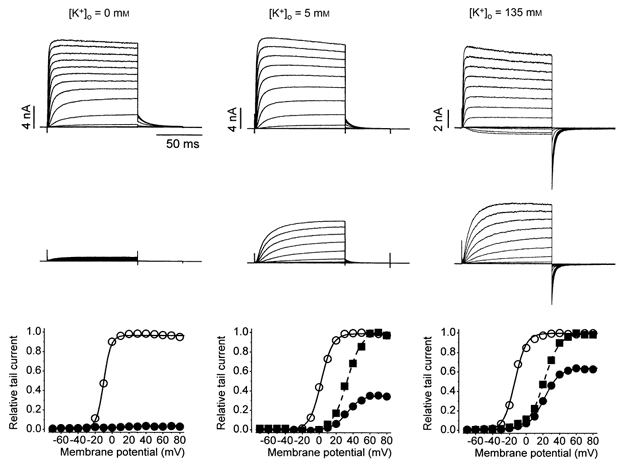
Each column, representing a different cell, shows the control currents (top row), the currents in 1 mm Zn2+ (middle row) and, except for Zn2+ in 0 mm K+, the corresponding activation curves (bottom row) showing the control curve (○) and the Zn2+ data normalized with respect to the control gmax (•) or to the fitted gmax,Zn (▪). The proportion of gmax with 1 mm Zn2+ in 0, 5 and 135 mm K+o was 0.03, 0.35 and 0.64, respectively. In 5 mm K+oV1/2 shifted by 30 mV and s increased from 6.9 to 8.7 mV; in 135 mm K+o, V1/2 shifted by 33 mV and s increased from 6.6 to 9.5 mV. The similarity of the shifts of the V1/2 in 5 and 135 mm K+o suggest that increasing [K+]o does not alter the gate-shifting action of Zn2+. Note also that increasing [K+]o partly reverses the effect of Zn2+ to slow the rate of current activation.
Comparison of the control and treated activation curves (Fig. 1D), derived as described in Methods, shows that in 1 mm Zn2+ the V1/2 shifted from -10.2 ± 0.4 to 21.1 ± 0.7 mV and s increased from 6.8 ± 0.4 to 9.4 ± 0.7 mV in control and treated responses, respectively. With the 100 ms pulses used, currents at voltages near the foot of the activation curve did not reach steady state and, consequently, the value for s is slightly underestimated, more so in the presence of Zn2+. With 1 mm Zn2+ the proportion of gmax was 0.33 ± 0.07. Evidence is presented below (Fig. 4) to show that the gating shift occurs independently of the reduction of gmax.
Figure 4. Increasing [K+]o causes a rightward shift of the concentration dependence of the Zn2+ block but does not affect the gating shift.

A, the relationship between the block of Kv1.5, represented by the proportion of gmax, and the Zn2+ concentration obtained in 0 (▪), 5 (•) and 135 mm (▴) K+. [K+]o was decreased by replacement by Na+ and increased by substitution for Na+ in the standard bath medium. The continuous lines represent the best fit of the data to the Hill equation. The KD and H values were 69 μm and 0.89 in 0 mm K+o, 650 μm and 1.0 in 5 mm K+o, and 2100 μm and 0.84 in 135 mm K+o. With K+- and Na+-free bath medium (135 mm NMDG+ solution) the best fit to the data (▿ and the dashed line) was obtained with KD= 56 μm and H= 1.07. The similarity to the curve obtained in medium containing 135 mm Na+ (0 mm K+o) implies that Na+ has little or no block-relieving effect. B, fits of the concentration dependence of the shift of V1/2 gave KD values of 130 ± 10, 115 ± 14 and 163 ± 30 μm, respectively, in 0 (▪), 5 (•) and 135 mm (▴) K+o.
Concentration and voltage dependence of the Zn2+ block
We next examined the concentration dependence of the actions of Zn2+ using the same voltage-clamp protocol outlined for Fig. 1. Isochronal tail current measurements normalized with respect to the control responses (Fig. 2A) or to the fitted maximum (Fig. 2B) are from a representative cell exposed to 0, 50, 200, 1000 and 5000 μm Zn2+. It illustrates that block as well as the gating shift, reflected as a shift of V1/2 and an increase of s, are concentration dependent. In Fig. 2C the concentration dependence of the block measured in identical experiments with 15 cells has been fitted to the Hill equation. The Zn2+ concentration producing half-maximal block, represented by the KD value, was estimated by a least-squares fitting routine to be 650 ± 24 μm. The best fit of 1.0 ± 0.03 for H suggests that the occupation of a single binding site accounts for the block by Zn2+. The concentration dependence of the gating shift is considered below (Fig. 4B).
Figure 2. The Zn2+-induced block and the shift of V1/2? are concentration dependent.
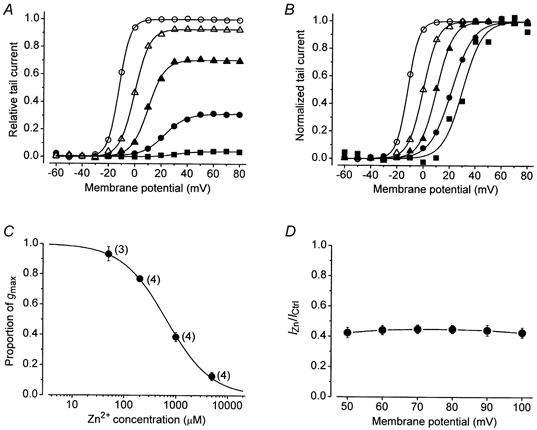
A, activation curves, derived as for Fig. 1D, showing the effect of 0 (○), 50 (△), 200 (▴), 1000 (•) and 5000 μm (▪) of Zn2+ in standard bath solution containing 5 mm K+. B, the activation curves in A after normalizing each curve to its fitted maximum. From left to right the V1/2 was -11.9, -0.1, 10.1, 22.2 and 31.4 mV and s was 4.2, 5.6, 6.2, 8.1 and 7.7 mV. C, a fit of the Hill equation to the proportion of gmax in the 50, 200, 1000 and 5000 μm of Zn2+ in medium containing 5 mm of K+ gave estimates of 650 ± 24 μm and 1.0 ± 0.03 for the equilibrium dissociation constant (KD) and the Hill coefficient (H), respectively. The number in parentheses beside each data point indicates the number of cells tested. D, in 5 cells the steady-state current at the end of 100 ms pulse commands was normalized with respect to the corresponding control current amplitude and plotted against the pulse voltage. The current ratio (IZn/ICtrl) is virtually the same at each voltage and indicates that the Zn2+ binding site does not sense the membrane electric field.
One possible explanation for the reduction of gmax is a block of the open pore by Zn2+, and if the blocking site is significantly within the electric field of the membrane, then the reduction of gmax would be expected to show voltage dependence. Membrane voltage can affect open channel block both indirectly, by affecting the open probability (Po), and directly, by affecting the on and off rate constants of the binding reaction. Our approach to determining the voltage dependence of the Zn2+ block was to take the ratio of the steady-state pulse currents evoked at potentials between 50 and 100 mV in control and 1 mm Zn2+-containing solutions (IZn/ICtrl). We reasoned that in this voltage range the Po was maximal and that any change of IZn/ICtrl would reflect the effect of voltage on the blocking reaction. Figure 2D, which shows the outcome of five such experiments, is consistent with Zn2+ block having little or no voltage dependence.
Increasing [K+]o relieves the Zn2+ block
From the voltage independence of the block we inferred that if the binding site for Zn2+ was in the pore then it must lie in the external pore mouth. As such, the block might be expected to be affected by permeant ions such as occurs, for example, with the relief by external Na+ of the tetrodotoxin (TTX) block of voltage-gated Na+ channels (Moczydlowski et al. 1984). Illustrated in Fig. 3 is the outcome of representative experiments in three different cells in which K+ was replaced by or substituted for Na+ in standard bath solution to examine the effect of 0, 5 and 135 mm K+o on the block by 1 mm Zn2+. The top row of each column shows the control responses. A K+ equilibrium potential (EK) near 0 mV accounts for the fact that some of the pulse currents and all of the tail currents (at -50 mV) in 135 mm K+ are inward. The middle row of Fig. 3 shows the responses recorded in Zn2+. In nominally 0 mm K+ and with 1 mm Zn2+, the pulse and tail current amplitude were less than 5 % of those in control solution. In 5 mm K+o there was substantially less block and still more block relief is evident in 135 mm K+o. The absence of inward pulse currents in 135 mm K+ is attributed to the gating shift since the EK was not affected by Zn2+ (data not shown). Tail currents in 0 mm K+o were very small and because fitting to a Boltzmann function gave large standard errors the reduction of gmax was taken as the ratio of the control and treated tail currents following a 100 ms pulse to 60 mV. Fits to a Boltzmann function of the tail currents in 5 and 135 mm K+o (bottom row of Fig. 3) confirmed that K+o relieved the Zn2+ block and also suggested that the gate-shifting effect of Zn2+ was unaltered (see figure legend for the values of V1/2 and s, and the proportion of gmax).
It also appears by inspection of the current traces of Fig. 3 that increasing K+o partially reverses the Zn2+-induced slowing of the activation kinetics. To obtain an estimate of the rate of activation, a single exponential function was fitted to the latter phase of the activation process beginning at approximately 10 % of the maximal current and ending at the maximal current. Currents evoked at 50 mV were studied to minimize changes of the activation kinetics due to the gating shift. With 0 mm K+o the control time constant (τCtrl) was 1.4 ± 0.1 ms and the ratio of the time constants in 1 mm Zn2+ and control medium (τZn/τCtrl) was 14.9 ± 0.6 n = 6. With 5 mm K+oτCtrl was 1.6 ± 0.1 ms and τZn/τCtrl was 10.6 ± 0.4 n = 7; in 135 mm K+o, τCtrl was 1.5 ± 0.1 ms and τZn/τCtrl decreased to 7.6 ± 1.6 n = 5. This confirms that increasing [K+]o partially reverses the action of Zn2+ to slow activation kinetics.
To better characterize the effect of [K+]o on the blocking and gate-shifting effects of Zn2+, we extended the approach described for Fig. 3 over a range of Zn2+ concentrations (10-5000 μm) and in K+o concentrations of 0 (nominal), 5 or 135 mm. As for Fig. 3, normalized peak tail current versus V curves were fitted to a Boltzmann function. The proportion of gmax, representing the block by Zn2+, and the shift of V1/2, representing the gating shift, were plotted against the Zn2+ concentration in Fig. 4A and B, respectively. Figure 4A shows that increasing [K+]o caused a roughly parallel, rightward shift of the concentration-response curve with the rightward shift caused by changing from 0 to 5 mm K+ being much larger than that when going from 5 to 135 mm K+ (and see below). Fits of the Hill equation to the concentration dependence of the Zn2+ block in 0 (filled squares), 5 mm (filled circles) and 135 mm (filled triangles) K+ gave estimates for the KD of 69, 650 and 2100 μm, respectively. Changing [K+]o did not significantly affect the value of H (not shown).
Except when the external and internal solutions are nominally K+ free (Wang et al. 2000), Kv1.5 channels have a very low Na+ permeability. Consequently, if block relief is related to ionic permeability, then Na+ would be expected to have little or no block-relieving effect. To directly address this issue we assessed the Zn2+ block in external saline containing only NMDG+ as the monovalent cation species. The best fit to the concentration-response data obtained in this 135 mm NMDG+ saline (inverted open triangle and dashed line of Fig. 4A) gave a KD of 56 μm and a value of 1.07 for H. Because there is little difference between results obtained with either 135 mm Na+o or 135 mm NMDG+o it appears that Na+ does not inhibit Zn2+ binding. Consequently, the effect of changing the Na+:K+ ratio on the Zn2+ block is due to the change of K+.
On the basis of the limited data presented in Fig. 3 it was suggested that changing [K+]o had no effect on the gate-shifting effect of Zn2+. This is confirmed in the graph of Fig. 4B where the curves relating the change of V1/2 against the concentration of Zn2+ for 0 (filled squares), 5 mm (filled circles) and 135 mm (filled triangles) K+ are nearly superimposed. The shift of V1/2 in 0 mm K+ (135 mm Na+) is limited to points at 10, 50 and 200 μm since the tail currents at higher concentrations were too small to be unambiguously analysed. The concentration of Zn2+ producing a half-maximal shift of V1/2 was, on average, 140 μm (see figure legend for fitted values).
Higher concentrations of Cd2+ mimic the effects of Zn2+
Cd2+ often replicates the effects of Zn2+ with either greater or lesser efficacy. To compare its efficacy for the block of Kv1.5, Cd2+ was tested at 1 and 5 mm in 140 mm Na+ (0 mm K+o) saline. In 1 mm Cd2+ the proportion of gmax was 0.59 ± 0.01 n = 5 and in 5 mm Cd2+ it was 0.13 ± 0.019 n = 6. V1/2 shifted by 18.9 ± 0.8 and 24.2 ± 1.5 mV in 1 and 5 mm Cd2+, respectively, and s changed from 5.8 ± 0.4 to 7.7 ± 0.3 mV in 1 mm and from 5.2 ± 0.6 to 6.9 ± 0.3 mV in 5 mm Cd2+. By comparison, with 1 mm Zn2+, in 0 mm K+o the proportion of gmax was 0.08 ± 0.01 n = 9; an accurate measurement of V1/2 and s was not possible.
Relief of the Zn2+ block by K+o is modelled by allosteric inhibition
Having obtained evidence for a relief by K+o of the block by Zn2+ we next addressed the question of the nature of this interaction between Zn2+ and K+. With competitive inhibition (see Methods) increasing the [K+]o would cause a (non-saturating) parallel rightward shift of the concentration-response curve. In 0 mm K+o the fitted value for KZn is 69 μm and in 5 mm K+o the K'Zn is 650 μm (Fig. 4A). With the latter values for KZn and K'Zn the KK is calculated using eqn (4) to be 600 μm. If there is a competitive interaction between Zn2+ and K+ then using a value of 69 μm for KZn and 600 μm for KK, the predicted value for K'Zn in 135 mm K+o is ≈16 mm. However, the best fit of the data in 135 mm K+o in Fig. 4A to the Hill equation gives a value for K'Zn of 2.1 mm, nearly an order of magnitude smaller. In short, a simple competitive interaction between K+ and Zn2+ predicts a shift of the concentration-response curve with 135 mm K+o that is much larger than that actually obtained (cf. Fig. 5B).
Figure 5. The block-relieving effect of K+o is better fitted by a model of allosteric inhibition.

A, data showing the proportion of gmax with 200 μm (▴) or 1000 μm (•) Zn2+ in 0, 1, 3.5, 5, 10, 20, 80, 135 or 140 mm K+o. With 200 μm Zn2+ the continuous line represents the solution to eqn (5) with KZn= 82 μm, KK= 340 μm and α= 15; with 1000 μm Zn2+ the corresponding values were 77 μm, 570 μm and 25. When external Cs+ was used (□) with 1000 μm Zn2+, the best fit was obtained with KZn= 63 μm, KCs= 2900 μm and α= 38. Note the much poorer fit (dashed lines) of the data to a competitive inhibition model (eqn (3)). B, a comparison of the fits of the concentration-response data of Fig. 4A to an allosteric or a competitive inhibition model. With the allosteric inhibition model (continuous lines), a good fit, by eye, to the data recorded in 135 mm K+o (▴) is obtained by using the values fitted to the data recorded in 0 (▪) and 5 mm (•) K+o (KZn= 69 μm, KK= 413 μm and α= 31). In contrast, with the same approach (KZn= 69 μm and KK= 590 μm) the competitive inhibition model (dashed lines) substantially overestimates the shift of the curve in 135 mm K+o.
With allosteric (non-competitive) inhibition, raising [K+]o will, as with the model of competitive inhibition, cause a parallel rightward shift of the concentration-response curve. However, the two models diverge as [K+]o/KK increases. Thus, in contrast to competitive antagonism where the rightward shift increases in proportion to [K+]o/KK, with allosteric inhibition the effect of K+o saturates when [K+]o >> KK and K'Zn=αKZn (eqn (6)).
We tested the applicability of the two forms of inhibition to the block-relieving effect of K+o in two ways. First, the relationship between [K+]o and the block with 200 μm and 1 mm Zn2+ was examined. Data taken from Fig. 4A and from other experiments using additional concentrations of K+o are shown in Fig. 5A. With 200 μm Zn2+ (filled triangles, Fig. 5A) the block was measured in 0, 1, 5, 20, 80 and 135 mm K+o. For 1 mm Zn2+ (filled circles, Fig. 5A) [K+]o was 0, 1, 3.5, 5, 10, 20, 80, 135 or 140 mm. Continuous lines representing the best fit of the data in 200 μm Zn2+ to the model for allosteric inhibition (eqn (5)) were obtained with values for KZn, KK and α of 82 μm, 340 μm and 15, respectively; the corresponding best fit values in 1 mm Zn2+ were comparable at 77 μm, 570 μm and 25. A much poorer fit to the data was obtained when a model of competitive inhibition was used (eqn (3) and dashed lines of Fig. 5A).
Included in Fig. 5A are the effects of external Cs+ (open squares) at 3.5, 20 and 135 mm, on the block by 1 mm Zn2+. With 135 mm Cs+o it was necessary to estimate the reduction of gmax by fitting the I-V relation for the pulse currents, since the voltage at which tail currents were normally measured (-50 or -40 mV) was close to the reversal potential. Although Cs+o much less effectively inhibited the blocking action of Zn2+, the concentration dependence of the block relief was again much better fitted by assuming allosteric inhibition. The best-fit values for KZn, KCs and α were 63 μm, 2900 μm and 38, respectively.
As a second test of the two models, in Fig. 5B the fit of the concentration-response data of Fig. 4A for the Zn2+ block in 0 mm (filled squares), 5 mm (filled circles) and 135 mm (filled triangles) to the competitive inhibition model (dashed lines) and the allosteric model (continuous lines) is compared. The approach was, first, to obtain KZn for both models (69 μm) from the fit to the 0 mm K+o data. Next, KK for the competitive model (590 μm) and the KK and α for the allosteric model (413 μm and 31) were obtained from the fits to the data in 5 mm K+o. Finally, using those fitted values the expected response in 135 mm K+o was calculated. The outcome supports the conclusion from Fig. 5A that the data are better fitted by a model of allosteric inhibition.
DISCUSSION
External Zn2+ has two major and separable effects on K+ currents through Kv1.5 channels expressed in HEK293 cells. One of these, the gating shift, is well known and has been previously described for many types of voltage-gated channels, including Kv1.5 channels (Harrison et al. 1993). Screening of fixed surface charges probably does not account for the Zn2+-induced gating shift. For example, we have found in related studies that a 5 mm concentration of Sr2+, which has been proposed to act solely by charge screening in cloned Kv channels (Elinder et al. 1996), causes only a 4.2 ± 0.3 mV n = 8 depolarizing shift of the Kv1.5 activation curve. The Sr2+-induced shift of V1/2 is not correlated with either a change of s or a reduction of gmax. Since roughly the same gating shift is produced by only 10 μm Zn2+, which is inconsistent with a charge screening model (see Introduction), specific binding probably accounts for a substantial proportion of the Zn2+-induced gating shift. A simple explanation is that the binding of Zn2+ to an unidentified site on the channel surface changes the bias on the voltage sensor such that the closed state is stabilized and larger depolarizations are needed to promote channel opening.
The main focus of this paper is on the action of Zn2+ in causing a concentration-dependent reduction of gmax, an effect which we also refer to as block. Zn2+ block could be explained by a physical occlusion of the pore (occlusion block), a decrease of the number of channels available to open, a decrease of the channel open probability (Po) or a decrease of the single channel conductance due to an induced change of the pore conformation. In voltage-gated Na+ channels, probably the best studied example of Zn2+ block, the decline of macroscopic currents has been traced at the single channel level to a fast, voltage-dependent block largely attributed to occlusion of the pore. In the most sensitive Na+ channel isoform, that in cardiac myocytes, the Zn2+ binding site has a KD of 67 μm at 0 mV and is located at an electrical distance (δ) of ≈0.25 from the outside (Ravindran et al. 1991). Without single channel data we cannot be certain of the basis for the block by Zn2+ of Kv1.5 currents but several of its features constrain the choice of possible models. As with Zn2+ block of the delayed rectifier current of the squid giant axon (Gilly & Armstrong, 1982), of Kv2.1 I369H channels (De Biasi et al. 1993) and of inwardly rectifying K+ channels (Coulter et al. 1995), the block of Kv1.5 by Zn2+ is voltage independent. This, together with a Hill coefficient near 1 for the concentration dependence of the block, implies that there is a single Zn2+ binding site in the outer vestibule of the pore or elsewhere on the channel surface. The Zn2+ block is also inhibited by extracellular K+, as is the case with the Zn2+ block in Kv2.1 I369H (De Biasi et al. 1993). This might reflect an interaction between Zn2+ and K+ via separate binding sites either on the channel surface or in the outer pore mouth.
If the binding site mediating the block relief by K+ is in the pore mouth then outward-going K+ might populate that site, as is the case with the C-type inactivation site near the outer mouth of the Shaker pore (Baukrowitz & Yellen, 1995). However, it appears that K+ efflux has no, or at most a minor, effect on the Zn2+ block in Kv1.5 since there is significant block relief when changing from 0 to 1 mm K+o. A possible explanation for the lack of a block-relieving effect of internal permeating ions is a rapid equilibration between the bath solution and the external binding site such that the occupancy of the site is solely a function of [K+]o. Interestingly, our estimates of ≈0.5 mm for the KD of the K+ binding site mediating the block relief is very near that of 0.75 mm estimated by Harris et al. (1998) for the external lock-in site in Shaker B channels. Additionally, both the block-relief site and the external lock-in site exhibit a low affinity for Na+.
Cs+o also has a block-relieving effect although it is 5- to 6-fold less effective than K+, as estimated from the KD obtained from the fit of the concentration-response data to the allosteric inhibition model (Fig. 5A). The actions of other ions on the Zn2+ block have not yet been examined but this relatively weaker block-relieving effect of external Cs+, together with the apparent lack of block relief by Na+o, indicates that the ‘efficacy sequence’ for block relief of K+ > Cs+ >> Na+ parallels the selectivity sequence for permeation.
An alternative to an occlusion block model is one in which Zn2+ binds on the channel surface and induces a conformational change. For example, in batrachotoxin-modified Na+ channels, Schild et al. (1991) have proposed that channel block reflects the induction by Zn2+ of a state having ≈12 % of the conductance of the normal open channel at -50 mV (Schild & Moczydlowski, 1991). Although such a model can also account for the inhibition by permeant ions of the channel block (Prod'hom et al. 1989), it is not readily applicable to the reduction of Kv1.5 currents by Zn2+. First, in 0 mm K+o Zn2+ can virtually eliminate the current, which is contrary to a non-zero plateau level in the concentration-response relationship predicted by a subconductance state model (Favre et al. 1995). Second, there is no evidence in single channel recordings of a subconductance state in Kv1.5 channels (Fedida et al. 1993), which is a prerequisite of a model involving an induced conformational change.
From the fits obtained for the data of Fig. 5 it seems more likely that allosteric inhibition explains the effect of K+o and Cs+o on the Zn2+ block. However, the basis for α, the negative cooperativity factor, is uncertain. If Zn2+ blocks by occlusion, then K+ binding could affect Zn2+ binding by inducing a change of the topology of the channel mouth so that Zn2+ binding becomes less favourable. This is analogous to the proposed effect of K+o on the block of Kv2.1 channels by TEA+ (Ikeda & Korn, 1995) except that in that situation increasing [K+]oenhances the block of the external mouth of the pore by TEA+. A second possibility is that bound K+ acts by electrostatic repulsion to decrease the affinity of the Zn2+ binding site by increasing the off-rate and/or decreasing the on-rate. If a purely electrostatic effect accounts for the inhibition by K+ of the Zn2+ block then with the approach used by Schild & Moczydlowski (1991), the change of the KD for the Zn2+ site from 69 μm to 2.1 mm observed when going from 0 to 135 mm K+ (Fig. 4A) suggests that the distance between the Zn2+- and the K+-binding site would be roughly 3 Å, less if binding partially neutralizes the charges on the ions.
Aside from its effect on the Zn2+ block, raising [K+]o partly reverses the effect of Zn2+ in slowing the rate of Kv1.5 current activation (Fig. 3), as has been reported in studies of Kv2.1 I369H (De Biasi et al. 1993). Surprisingly, the faster activation rate in the higher [K+]o is not associated with a leftward shift of the g-V relationship. This apparent separation of the effects on the activation kinetics and the shift of V1/2 is of interest and requires further study. However, it is worth noting that in Kv3.1, where current block is associated with a slowing of the activation kinetics, Zn2+ also causes no significant shift of V1/2 (Poling et al. 1996).
Conclusion
The fact that the KD for the gating shift in normal physiological saline is roughly 5-fold lower than the KD for block (Fig. 4), as well as the observation that the KD for the gating shift is unaffected by changes of [K+]o, compels the suggestion that the blocking and gate-shifting sites are separate. Indeed, the expression in some Kv channels of only the gate-shifting site might account for examples where a substantial gating shift (produced by Zn2+ concentrations too low to be explained by fixed surface charge screening) occurs with little evidence of block (Arhem, 1980; Gilly & Armstrong, 1982; Poling et al. 1996). Conversely, the expression of only the blocking site might explain the occurrences of substantial Zn2+ block with little or no gating shift (Poling et al. 1996; Paquette et al. 1998). A simpler model in which the block and the gating shift are produced by the occupation of a single site, possibly in the channel pore, as has been proposed to account for the effects of Ca2+ on voltage-gated Na+ channels of the squid giant axon (Armstrong, 1999), is difficult to reconcile with the K+o dependence of the block and the K+o independence of the gating shift.
Acknowledgments
This work was supported by a grant to S.J.K. from the Natural Sciences and Engineering Research Council (NSERC) of Canada and by grants to D.F. from the Heart and Stroke Foundation (HSF) of British Columbia and Yukon and from the Canadian Institutes of Health Research (CIHR). S.Z. was in receipt of a Research Fellowship from the HSF of Canada. We thank Sandy Wang for her care and attention in preparing and maintaining cells.
References
- Arhem P. Effects of some heavy metal ions on the ionic currents of myelinated fibres from Xenopus laevis. Journal of Physiology. 1980;306:219–231. doi: 10.1113/jphysiol.1980.sp013393. [DOI] [PMC free article] [PubMed] [Google Scholar]
- Armstrong CM. Distinguishing surface effects of calcium ion from pore-occupancy effects in Na+ channels. Proceedings of the National Academy of Sciences of the USA. 1999;96:4158–4163. doi: 10.1073/pnas.96.7.4158. [DOI] [PMC free article] [PubMed] [Google Scholar]
- Backx PH, Yue DT, Lawrence JH, Marban E, Tomaselli GF. Molecular localization of an ion-binding site within the pore of mammalian sodium channels. Science. 1992;257:248–251. doi: 10.1126/science.1321496. [DOI] [PubMed] [Google Scholar]
- Baukrowitz T, Yellen G. Modulation of K+ current by frequency and external [K+]: A tale of two inactivation mechanisms. Neuron. 1995;15:951–960. doi: 10.1016/0896-6273(95)90185-x. [DOI] [PubMed] [Google Scholar]
- Cherny VV, Decoursey TE. pH-dependent inhibition of voltage-gated H+ currents in rat alveolar epithelial cells by Zn2+ and other divalent cations. Journal of General Physiology. 1999;114:819–838. doi: 10.1085/jgp.114.6.819. [DOI] [PMC free article] [PubMed] [Google Scholar]
- Coulter KL, Perier F, Radeke CM, Vandenberg CA. Identification and molecular localization of a pH-sensing domain for the inward rectifier potassium channel HIR. Neuron. 1995;15:1157–1168. doi: 10.1016/0896-6273(95)90103-5. [DOI] [PubMed] [Google Scholar]
- De Biasi M, Drewe JA, Kirsch GE, Brown AM. Histidine substitution identifies a surface position and confers Cs+ selectivity on a K+ pore. Biophysical Journal. 1993;65:1235–1242. doi: 10.1016/S0006-3495(93)81154-8. [DOI] [PMC free article] [PubMed] [Google Scholar]
- Elinder F, Madeja M, Arhem P. Surface charges of K channels - Effects of strontium on five cloned channels expressed in Xenopus oocytes. Journal of General Physiology. 1996;108:325–332. doi: 10.1085/jgp.108.4.325. [DOI] [PMC free article] [PubMed] [Google Scholar]
- Favre I, Moczydlowski E, Schild L. Specificity for block by saxitoxin and divalent cations at a residue which determines sensitivity of sodium channel subtypes to guanidinium toxins. Journal of General Physiology. 1995;106:203–229. doi: 10.1085/jgp.106.2.203. [DOI] [PMC free article] [PubMed] [Google Scholar]
- Fedida D, Wible B, Wang Z, Fermini B, Faust F, Nattel S, Brown AM. Identity of a novel delayed rectifier current from human heart with a cloned K+ channel current. Circulation Research. 1993;73:210–216. doi: 10.1161/01.res.73.1.210. [DOI] [PubMed] [Google Scholar]
- Frankenhaeuser B, Hodgkin AL. The action of calcium on the electrical properties of squid axons. Journal of Physiology. 1957;137:218–244. doi: 10.1113/jphysiol.1957.sp005808. [DOI] [PMC free article] [PubMed] [Google Scholar]
- Gilly WF, Armstrong CM. Divalent cations and the activation kinetics of potassium channels in squid giant axons. Journal of General Physiology. 1982;79:965–996. doi: 10.1085/jgp.79.6.965. [DOI] [PMC free article] [PubMed] [Google Scholar]
- Hahin R, Campbell DT. Simple shifts in the voltage dependence of sodium channel gating caused by divalent cations. Journal of General Physiology. 1983;82:785–805. doi: 10.1085/jgp.82.6.785. [DOI] [PMC free article] [PubMed] [Google Scholar]
- Harris RE, Larsson HP, Isacoff EY. A permanent ion binding site located between two gates of the Shaker K+ channel. Biophysical Journal. 1998;74:1808–1820. doi: 10.1016/s0006-3495(98)77891-9. [DOI] [PMC free article] [PubMed] [Google Scholar]
- Harrison NL, Radke HK, Tamkun MM, Lovinger DM. Modulation of gating of cloned rat and human K+ channels by micromolar Zn2+ Molecular Pharmacology. 1993;43:482–486. [PubMed] [Google Scholar]
- Hille B, Woodhull AM, Shapiro BI. Negative surface charge near sodium channels of nerve: divalent ions, monovalent ions, and pH. Philosophical Transactions of the Royal Society. 1975;270:301–318. doi: 10.1098/rstb.1975.0011. B. [DOI] [PubMed] [Google Scholar]
- Ikeda SR, Korn SJ. Influence of permeating ions on potassium channel block by external tetraethylammonium. Journal of Physiology. 1995;486:267–272. doi: 10.1113/jphysiol.1995.sp020809. [DOI] [PMC free article] [PubMed] [Google Scholar]
- Latimer WM. Oxidation Potentials. New York: Prentice Hall, Inc.; 1952. [Google Scholar]
- Moczydlowski E, Garber SS, Miller C. Batrachotoxin-activated Na+ channels in planar lipid bilayers. Competition of tetrodotoxin block by Na+ Journal of General Physiology. 1984;84:665–686. doi: 10.1085/jgp.84.5.665. [DOI] [PMC free article] [PubMed] [Google Scholar]
- Morris JG. A Biologist's Physical Chemistry. London: Edward Arnold (Publishers) Ltd; 1974. [Google Scholar]
- Overturf KE, Russell SN, Carl A, Vogalis F, Hart PJ, Hume JR, Sanders KM, Horowitz B. Cloning and characterization of a Kv1.5 delayed rectifier K+ channel from vascular and visceral smooth muscles. American Journal of Physiology. 1994;267:C1231–1238. doi: 10.1152/ajpcell.1994.267.5.C1231. [DOI] [PubMed] [Google Scholar]
- Paquette T, Clay JR, Ogbaghebriel A, Shrier A. Effects of divalent cations on the E-4031-sensitive repolarization current, IKr, in rabbit ventricular myocytes. Biophysical Journal. 1998;74:1278–1285. doi: 10.1016/S0006-3495(98)77841-5. [DOI] [PMC free article] [PubMed] [Google Scholar]
- Poling JS, Vicini S, Rogawski MA, Salem N., Jr Docosahexaenoic acid block of neuronal voltage-gated K+ channels: Subunit selective antagonism by zinc. Neuropharmacology. 1996;35:969–982. doi: 10.1016/0028-3908(96)00127-x. [DOI] [PubMed] [Google Scholar]
- Prod'hom B, Pietrobon D, Hess P. Interactions of protons with single open L-type calcium channels. Location of protonation site and dependence of proton-induced current fluctuations on concentration and species of permeant ion. Journal of General Physiology. 1989;94:23–42. doi: 10.1085/jgp.94.1.23. [DOI] [PMC free article] [PubMed] [Google Scholar]
- Ravindran A, Schild L, Moczydlowski E. Divalent cation selectivity for external block of voltage-dependent Na+ channels prolonged by batrachotoxin. Zn2+ induces discrete substates in cardiac Na+ channels. Journal of General Physiology. 1991;97:89–115. doi: 10.1085/jgp.97.1.89. [DOI] [PMC free article] [PubMed] [Google Scholar]
- Schild L, Moczydlowski E. Competitive binding interaction between Zn2+ and saxitoxin in cardiac Na+ channels. Evidence for a sulfhydryl group in the Zn2+/saxitoxin binding site. Biophysical Journal. 1991;59:523–537. doi: 10.1016/S0006-3495(91)82269-X. [DOI] [PMC free article] [PubMed] [Google Scholar]
- Schild L, Ravindran A, Moczydlowski E. Zn2+-induced subconductance events in cardiac Na+ channels prolonged by batrachotoxin. Current-voltage behavior and single-channel kinetics. Journal of General Physiology. 1991;97:117–142. doi: 10.1085/jgp.97.1.117. [DOI] [PMC free article] [PubMed] [Google Scholar]
- Spires S, Begenisich T. Chemical properties of the divalent cation binding site on potassium channels. Journal of General Physiology. 1992;100:181–193. doi: 10.1085/jgp.100.2.181. [DOI] [PMC free article] [PubMed] [Google Scholar]
- Stanfield PR. The effect of zinc ions on the gating of the delayed potassium conductance of frog sartorius muscle. Journal of Physiology. 1975;251:711–735. doi: 10.1113/jphysiol.1975.sp011118. [DOI] [PMC free article] [PubMed] [Google Scholar]
- Wang Z, Zhang X, Fedida D. Regulation of transient Na+ conductance by intra- and extracellular K+ in the human delayed rectifier K+ channel Kv1.5. Journal of Physiology. 2000;523:575–591. doi: 10.1111/j.1469-7793.2000.00575.x. [DOI] [PMC free article] [PubMed] [Google Scholar]