

Abstract
To confer their acute sensitivity to mechanical stimuli, hair cells employ Ca2+ ions to mediate sharp electrical tuning and neurotransmitter release. We examined the diversity and properties of voltage-gated Ca2+ channels in bullfrog saccular hair cells by means of perforated and cell-attached patch-clamp techniques. Whole-cell Ca2+ current records provided hints that hair cells express L-type as well as dihydropyridine-insensitive Ca2+ currents.
Single Ca2+ channel records confirmed the presence of L-type channels, and a distinct Ca2+ channel, which has sensitivity towards ω-conotoxin GVIA. Despite its sensitivity towards ω-conotoxin GVIA, the non-L-type channel cannot necessarily be considered as an N-type channel because of its distinct voltage-dependent gating properties.
Using 65 mm Ca2+ as the charge carrier, the L-type channels were recruited at about –40 mV and showed a single-channel conductance of 13 pS. Under similar recording conditions, the non-L-type channels were activated at ∼–60 mV and had a single-channel conductance of ∼16 pS.
The non-L-type channel exhibited at least two fast open time constants (τo = 0.2 and 5 ms). In contrast, the L-type channels showed long openings (τo =∼23 ms) that were enhanced by Bay K 8644, in addition to the brief openings (τo = 0.3 and 10 ms).
The number of functional channels observed in patches of similar sizes suggests that Ca2+ channels are expressed singly, in low-density clusters (2–15 channels) and in high-density clusters (20–80 channels). Co-localization of the two channel subtypes was observed in patches containing low-density clusters, but was rare in patches containing high-density clusters.
Finally, we confirmed the existence of two distinct Ca2+ channel subtypes by using immunoblot and immunohistochemical techniques.
The sacculus of the American bullfrog, Rana catesbeiana, is endowed with transfer functions such that within the frequency range (≈15-200 Hz) of seismic sensitivity, linear acceleration of the frog's body is translated into linear displacement of the stereociliary bundle of saccular hair cells (Hudspeth & Corey, 1977; Lewis et al. 1982). Displacement of the stereociliary bundle in the excitatory (positive) direction promotes the opening of mechanoelectrical transducer channels located at the tips of the stereocilia (Hudspeth, 1989; Denk et al. 1995; Lumpkin & Hudspeth, 1995). The depolarizing current that ensues from activation of the transducer channels then spreads along the basolateral membrane.
Equipped with voltage-gated Ca2+ and K+ currents, the ionic currents in the basolateral membrane sculpt the electrical phenotype of hair cells. The hair cells found in the sacculus of bullfrog and basilar papilla of reptiles and birds have electrical properties that match simple resonators (Crawford & Fettiplace, 1981; Fuchs et al. 1988; Hudspeth & Lewis 1988a,b), rendering the cells selective for stimuli at specific frequencies (Art & Fettiplace, 1987). Electrical tuning in hair cells of lower vertebrates is derived chiefly from the interplay between the activity of Ca2+-activated K+ currents, and voltage-gated K+ and voltage-gated Ca2+ currents (VGCCs; Lewis & Hudspeth, 1983; Fuchs et al. 1988; Fuchs & Evans, 1988; Fuchs, 1992; Art et al. 1993; Roberts et al. 1990; Armstrong & Roberts, 1998). The transmission of hair cell responses to afferent nerves at the presynaptic terminal is mediated by Ca2+ influx through VGCCs (Hudspeth, 1989; Fuchs, 1996). Moreover, Ca2+ channels may provide the conduit through which Ca2+ ions can be transported from the perilymphatic to the endolymphatic space (Yamoah et al. 1998). Thus, determination of the elementary properties of Ca2+ channels in hair cells is essential for understanding hair cell functions.
Only the coarse features of hair cell Ca2+ currents have been described previously. Recordings of whole-cell Ba2+ currents from isolated hair cells from the chick basilar papilla suggest that ≈60-70 % of inward Ba2+ current is dihydropyridine (DHP) sensitive (L-type), whereas the remaining 30-40 % is resistant to the known organic Ca2+ channel blockers (Fuchs et al. 1990; Zidanic & Fuchs, 1995). Similarly, 80-90 % of VGCCs in bullfrog saccular hair cells (Hudspeth & Lewis, 1988a) and a non-specific current, which was inferred to be current flowing through Ca2+ channels in turtle basilar papilla hair cells, are DHP sensitive (Art et al. 1993). The L-type channels in hair cells may have low sensitivity towards the DHP blockers, such that 10 μm nifedipine is insufficient to block the total current. Alternatively, the residual current after DHP antagonist application may belong to a distinct Ca2+ channel subtype. The expression of L-type Ca2+ channels in hair cells has been confirmed by the cloning of an α1D Ca2+ channel subunit from the basilar papilla of the chick (Kollmar et al. 1997a,b). In contrast to the L-type Ca2+ current in other systems (Fox et al. 1987; Tsien et al. 1988), the predominant VGCC in hair cells activates at low voltages (≈-40 mV) with a fast time constant (≈0.5 ms) and does not inactivate during moderate depolarization (Ohmori, 1984; Art & Fettiplace, 1987; Fuchs & Evans, 1988; Hudspeth & Lewis, 1988a; Lang & Correia, 1989; Fuchs et al. 1990; Roberts et al. 1990; Zidanic & Fuchs, 1995; Smotherman & Narins, 1999). Moreover, recent data from α1D knockout mice suggest that hair cells express both DHP-sensitive and -insensitive Ca2+ currents (Platzer et al. 2000). In addition, a previous report identified two types of VGCC in bullfrog saccular hair cells (Su et al. 1995). Nonetheless, a paucity of single-channel data from hair cells has hampered resolution of the identity of Ca2+ channels in these cells (Su et al. 1995).
An unequivocal differentiation of Ca2+ channels into specific subtypes can be achieved by direct assessment of the unitary channel properties. Using single-channel patch-clamp studies of the Ca2+ currents in bullfrog saccular hair cells, we report that these hair cells express L-type and DHP-insensitive (non-L-type) Ca2+ channels. Whereas the L-type currents were recruited at potentials positive to ≈-40 mV and showed single-channel conductance of ≈13 pS using 65 mm Ca2+ as the charge carrier, the non-L-type current was activated at ≈-60 mV and had a single-channel conductance of ≈16 pS. The non-L-type channels exhibited fast gating kinetics, which was distinct from the gating properties of the L-type channels. Expression of the two distinct channels varied from single to low- and high-density clusters. Co-localization of the two channel subtypes was also observed in patches containing low-density clusters, but was rare in high-density clusters. Finally, we confirmed the existence of two distinct Ca2+ channels in bullfrog saccular hair cells using immunoblot and immunohistochemical techniques. Some of these results have been presented in preliminary form (Rodriguez-Contreras & Yamoah, 1999).
METHODS
Hair cell preparation
Bullfrogs (Rana catesbeiana) were chilled at 4 °C and killed using the double pithing method (the protocol was approved by the University of California, Davis, Animal Research Services). Hair cells were freshly isolated from the sacculus of the bullfrog using standard procedures described earlier (Yamoah & Gillespie, 1996; Yamoah et al. 1998). Briefly, the saccular macula was dissected and the perilymphatic surface exposed to 4 mm EGTA for 10 min. The preparation was incubated for 20 min at room temperature in 50 μg ml−1 protease (Sigma) in low-Ca2+ frog saline containing (mm): 110 NaCl, 2 KCl, 3 d-glucose, 0.1 CaCl2 and 5 Hepes, adjusted to pH 7.4 with NaOH. After an additional incubation for 10 min in 1 mg ml−1 bovine serum albumin in low-Ca2+ saline, the otolithic membrane was removed and hair cells dissociated from the macula using an eyelash. Hair cells were allowed to settle on a concanavalin A-coated recording chamber. Dissociated cells were maintained in standard frog saline, which was similar in composition to the low-Ca2+ solution but included 4 mm CaCl2.
Electrophysiology
The standard configurations for cell-attached single-channel and perforated variant of the patch-clamp technique (Hamill et al. 1981) were used to record Ca2+ channel currents from hair cells isolated from the bullfrog sacculus. Patch pipettes were fabricated from borosilicate glass capillaries (World Precision Instruments, Sarasota, FL, USA) on a four-step horizontal Flaming-Brown microelectrode puller (Sutter Instrument Co., Novato, CA, USA) and coated with Sylgard 184 (Dow-Corning Corp., Midland, MI, USA) to within 100 μm of the tip and fire-polished before use. For single-channel recordings and measurement of patch capacitance, quartz electrodes pulled with a laser puller (P2000, Sutter Instrument Co.) were used. All chemicals were obtained from Sigma (St Louis, MO, USA), unless otherwise noted. Whole-cell Ca2+ currents were recorded using perforated-patch electrodes (resistances 2-4 MΩ) to minimize washout of intracellular molecules. The tips of the electrodes were filled with a solution containing 130 mm CsCl and 5 mm Hepes (pH 7.3 with CsOH). To gain electrical access to the cell, electrodes were backfilled with solution containing (mm): 130 CsCl, 1 CaCl2 and 5 Hepes with 200 μg ml−1 amphotericin (pH 7.3 with CsOH) (Korn et al. 1991). To ensure that recordings were in the perforated-patch mode instead of whole-cell mode, the backfilled solution of the patch electrode contained 1 mm Ca2+. A switch from the perforated-patch to whole-cell mode resulted in rapid cell death because of Ca2+ toxicity. Series resistance (5-10 MΩ) was compensated (nominally 60-80 %). Using the upper limit of the recorded whole-cell current (≈1000 pA), the voltage error resulting from the series resistance was less than 4 mV. Liquid-junction potentials (LJPs) were less than 2 mV. Whole-cell recordings with the total voltage error ≥ 5 mV were discarded. Ca2+ currents were amplified with an Axopatch 200B amplifier (Axon Instruments, Foster City, CA, USA). Current records were filtered at 2-5 kHz with a low pass Bessel filter and digitized at 10 kHz with a Digidata interface (Axon Instruments) controlled by custom-written software. Data were stored on a personal computer. All experiments were performed at room temperature (≈21 °C).
Recording solutions and drug application
For cell-attached recordings, patch electrodes were filled with a solution containing (mm): 20-65 Ca2+, Ba2+, or Sr2+, 25 tetraethylammonium chloride (TEACl), 5 4-aminopyridine (4-AP), 5 Hepes (pH 7.3 with TEAOH); N-methyl-d-glucamine replaced the divalent cation when the concentration was reduced from 65 to 20 mm. The composition of the bath solution was as follows (mm): 80 KCl, 25 TEACl, 5 4-AP, 5 Hepes (pH 7.3 with KOH). Using the bath solution and potassium acetate (1 m)-filled pipettes (≈70-100 MΩ), under current-clamp configuration, the membrane potential of hair cells was 2 ± 2 mV (n = 20). Thus, under cell-attached configuration, the command potential was similar to the potential sensed by the channels in the patch. Stock solutions of nimodipine and Bay K 8644 (Calbiochem, La Jolla, CA, USA) were dissolved in 100 % dimethyl sulfoxide (DMSO) and stored at -20 °C. The final concentration of DMSO in the recording bath solution was ≈0.001 %. A series of cell-attached single-channel recordings were conducted whereby nimodipine (5-10 μm) or (±)Bay K 8644 (5 μm) was reconstituted in the bath solution, after the control channel activity had been recorded. Outward K+ currents were blocked with TEACl, 4-AP, and caesium (Cs+) ions. Bath solutions contained (mm): 90 NaCl, 25 TEACl, 5 4-AP, 5 CaCl2, 3 glucose and 5 Hepes (pH 7.4). For whole-cell experiments, stock solutions were reconstituted and bath applied in the recording chamber to obtain a final concentration of 0.01-40 μm. The volume of the recording chamber was ≈600 μl and it took ≈20 s for the drugs to reach the chamber and ≈10 s to replace the bath solution. Therefore, recordings of the effects of the drugs were taken 60 s after the perfusion system had been turned on. In another set of cell-attached single-channel recordings, the DHPs were added to the pipette solution. No more than 10 μm nimodipine was used, since higher drug concentrations significantly reduced hair cell input resistance (i.e. from 0.3 ± 0.1 at baseline to 0.01 ± 0.01 GΩ in 20 μm nimodipine, n = 7; P < 0.01). The Ca2+ channel blockers (Calbiochem) ω-conotoxin GVIA (2-5 μm), ω-conotoxin MVIIC (2-5 μm), ω-agatoxin IVA (5 μm), and ω-grammotoxin-SIA (1 μm) were bath-applied for whole-cell and backfilled in the pipette solutions for cell-attached experiments. Using fluorescein isothiocyanate- dextran (molecular mass ≈4 kDa), we have performed control experiments, which show that toxins that were backfilled in the pipette solution required less than 5-7 min to diffuse to the membrane.
Data analysis
For whole-cell current amplitude at a given test potential, we measured the peak current using a peak detection routine in custom-written software to generate the current-voltage relationship. For single-channel recording, the amplitude histogram at a given test potential was generated and then fitted to a single Gaussian distribution using a Levenberg-Marquardt algorithm to obtain the mean and standard deviation. We performed leak subtraction using smooth templates generated from null traces. Leak-subtracted current recordings were idealized using a half-height criterion (Colquhoun & Sigworth, 1985). Idealized records were used to construct ensemble-averaged currents and open probability, and to generate histograms for the distributions of open and closed intervals. Single or multi-exponential probability density functions were fitted to all open and closed intervals. For patches containing less than 15 channels, the number of channels was estimated using the binomial theorem:
where N and Pn represent the number of functional channels and the open probability of individual channels, respectively (Colquhoun & Sigworth, 1985).
We estimated the number of functional channels in a cluster, using non-stationary fluctuation analysis, when N > 15. For a homogeneous population of statistically independent channels, the mean macroscopic current (I) is defined as: I(t) =Nipo(t). The macroscopic current variance is: σI(t)2 =Ni2po(t)[1 - po(t)], where σ2 is the variance, i is the single-channel current amplitude and po(t) represents the open probability of the channel (Begenisich & Stevens, 1975). Provided that I and σ2 are estimated for a range of open probabilities, i and N can be determined by a plot of mean current versus variance, fitted by the function: σI(I)2 =Ii - I2/N (Sigworth, 1980). The measured value of i was used to estimate the number of channels in a given patch (N). Using quartz glass electrodes, the capacitance of the pipette-patch assembly was measured as described by Sakmann & Neher (1985). The channel density was determined as N per patch capacitance and expressed as the number of channels per square micrometre, assuming a specific membrane capacitance of 10 mF m−2.
Analysis of data was performed using custom-written software and Microcal Origin (Northampton, MA, USA) programs. Where appropriate, pooled data were presented as means ±s.d. Significant differences between groups were tested using Student's t test.
Western blot
For Western blot analysis, we used homogenates from sheets of hair cells from the bullfrog sacculi. The saccular homogenate proteins were separated in 6 % SDS-polyacrylamide gels, transferred to polyvinylidene difluoride (PVDF) membranes and probed with primary antibodies. We used the following antibodies: (1) polyclonal anti-VGCC (anti-pan α1), which reacts with the α1 subunit from all VGCC subtypes, except the T-type channel, (2) polyclonal anti-α1D antibody, (3) polyclonal anti-α1B antibody, (4) polyclonal anti-α1A antibody, and (5) polyclonal anti-α1E antibody. All antibodies were obtained from Alomone Laboratories (Israel). After incubation with the primary antibodies for 2 h at room temperature, the membranes were washed thoroughly and stained with peroxidase-conjugated secondary antibodies (anti-rabbit IgG). The protein bands were detected by enhanced chemiluminescence (Kirkegaard & Perry Laboratories, Gaithersburg, MD, USA).
Immunocytochemistry
Isolated hair cells were fixed for 30 min with 0.5 % paraformaldehyde, washed and then permeabilized in 0.5 % Triton X-100 for 5 min. Cells were incubated for 1 h in a blocking solution containing frog saline, 1 % bovine serum albumin and 1 % horse serum, followed by 3-5 h incubation with Ca2+ channel antibodies (anti-pan α1, anti-α1B, and anti-α1D; Alomone Laboratories) at dilutions of 1:100 to 1:500. Cells were then incubated with secondary antibodies (donkey anti-rabbit antibody conjugated with fluorescein isothiocyanate (FITC)) for 2 h, washed and viewed with a Zeiss LSM 510 confocal microscope.
To determine the distribution of the non-L-type Ca2+ channels, we exploited the findings that the channel binds weakly with ω-conotoxin GVIA using direct immunofluorescence techniques. Fixed hair cells were incubated in rhodamine-conjugated ω-conotoxin GVIA (5-10 μm; Molecular Probes, Eugene, OR, USA) for 1 h, then washed and viewed using the appropriate optics with the confocal microscope. For double labelling with a primary antibody and ω-conotoxin-conjugated rhodamine, the cells were incubated further for 1 h, after treatment with the secondary antibody. Pre-absorption control experiments were performed using the respective antigenic peptides (over 3-fold excess antibody). We used 10 μmω-conotoxin for controls in the direct immunofluorescence experiments. Non-specific labelling of hair cell nuclei and intracellular structures as reported by Issa & Hudspeth (1994) quenched within 1 h. Thus, sections of images were captured 2 h after washout of the fluorochrome. For the non-L-type channels, positive labelling was scored as present when: (1) there was positive labelling with rhodamine-labelled conotoxin, as well as (2) positive labelling with anti-α1B antibody.
RESULTS
Whole-cell Ca2+ currents in hair cells consist of two distinct components
Outward K+ currents were blocked with external TEA and 4-AP and internal Cs+. Figure 1A and B shows representative traces of a family of Ca2+ currents and the corresponding current-voltage (I-V) relation generated by a series of voltage-clamped steps from holding potentials of -80 and -30 mV. The peak current occurred close to -10 mV. Nimodipine (10 μm) blocked a substantial fraction of the total membrane Ca2+ currents in all the saccular hair cells we studied. There is sufficient evidence to suggest that saccular hair cells with distinct somata shape may have distinct electrical phenotypes (Holt & Eatock, 1995; Chabbert, 1997). Therefore, we grouped the cells according to Chabbert, (1997). Cells with somatal length to apical diameter (LAD) ratio of 4-6, 6-8 and 9-12 correspond to central cylindrical (CCHCs), central flask-shaped (CFHCs) and peripheral elongated (PEHCs) hair cells, respectively. Of the 68 cells we studied, 26 (38 %) had a LAD ratio of 9-11 and showed a pharmacological profile as represented in Fig. 1 (current magnitude at a test potential of -10 mV was -529 ± 237 pA at baseline, and -153 ± 75 pA after 10 μm nimodipine). In 30 cells (44 %, LAD ratio of 6-8), the current magnitude at a test potential of -10 mV was -613 ± 180 pA at baseline and -97 ± 30 pA after application of 10 μm nimodipine. The remaining 12 cells (18 %) had a LAD ratio of 4-6 and the Ca2+ current magnitude at a test potential of -10 mV was -846 ± 195 pA at baseline and -31 ± 28 pA after 10 μm nimodipine. Although there was a trend towards a decrease in Ca2+ current magnitude in cells with increased LAD ratio (Fig. 1C) as suggested by Chabbert, (1997), the mean whole-cell Ca2+ current magnitude did not reveal major differences among different types of hair cells.
Figure 1. Whole-cell Ca2+ currents in hair cells consist of two components.
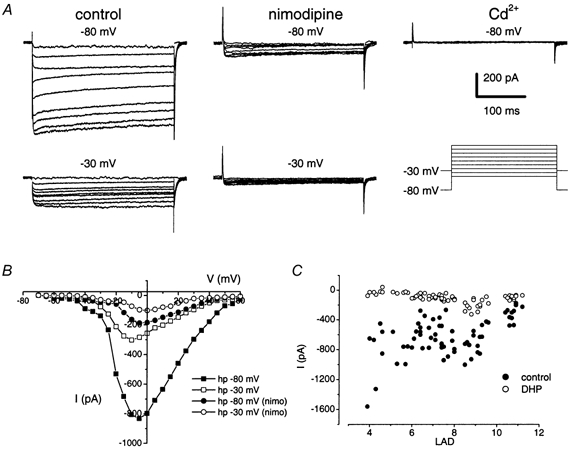
A, membrane Ca2+ currents recorded from hair cells in 5 mm Ca2+ were partially blocked by 10 μm nimodipine at holding potentials of both -80 and -30 mV. Whole-cell Ca2+ currents were recorded using perforated patches (pipettes were backfilled with internal solution containing 200 μm amphotericin). Outward K+ currents were blocked with bath solution containing TEA and 4-AP and internal solution containing Cs+ (see Methods). Inward Ca2+ currents were elicited using depolarizing test potentials (ΔV = 5 mV; see protocol in lower right panel). For clarity, not all of the current traces have been shown. After application of nimodipine (final concentration = 10 μm), the whole-cell Ca2+ current was reduced by ≈75 %. The residual current was blocked upon bath application of 0.2 mm Cd2+ (upper right panel).B, the corresponding current-voltage relations for control and after application of nimodipine (nimo) are shown at holding potentials (hp) of -30 and -80 mV. C, the nimodipine-sensitive current is the predominant Ca2+ current in hair cells. Shown is a scatter plot of Ca2+ current magnitude elicited using a test potential of -10 mV from a holding potential of -70 mV for control (•) and after application of 10 μm nimodipine (○) from 68 cells with different LAD ratios. The fraction of the nimodipine-insensitive current increased as the LAD ratio increased.
To cross-check any ambiguity of the effects of nimodipine that may arise from voltage-dependent block of the Ca2+ currents (Bean, 1984), we determined the sensitivity of the residual current to block by the DHP antagonist at depolarized holding potentials. The nimodipine-insensitive Ca2+ current persisted even at depolarized holding potentials (Fig. 1A, lower panel). Repeated activation of the Ca2+ current increased nimodipine blockage. However, a residual current remained (Fig. 2A). Since the half-blocking concentration of nimodipine was ≈40 nm (Fig. 2B), and Fig. 1 μm completely blocked the DHP-sensitive component of whole-cell current, we expected the 5-10 μm concentration routinely used in our experiments to block the whole-cell Ca2+ current completely, if bullfrog hair cell Ca2+ channels belong solely to the L-type class. High concentrations (> 20 μm) of nimodipine were not used to avoid a significant change in the passive membrane properties of hair cells (see Methods section).
Figure 2. Repetitive activation increased the nimodipine blockage of Ca2+ currents.
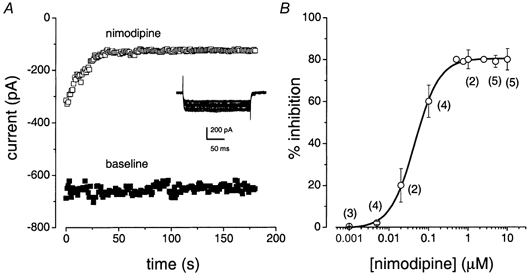
Ca2+ currents were elicited at a frequency of 1 Hz from a holding potential of -70 mV using a step potential of -10 mV. Using this protocol, the magnitude of the current showed neither activity-dependent enhancement nor reduction at baseline (▪). However, nimodipine (□) produced a tonic as well as a phasic reduction of the current magnitude. The remaining current (≈100 pA; ≈15 % of total current) is nimodipine insensitive. B, nimodipine block of the Ca2+ current is dose dependent. The percentage inhibition of the current is plotted against nimodipine concentration (μm). The continuous line represents a fit of the data to the logistic function: (A1 - A2)/(1 + (X/Xo)p) +A2, where A1 and A2 are the initial and final current amplitudes, respectively, X is the concentration of nimodipine, Xo is the half-blocking concentration and p is the Hill coefficient. Numbers in parentheses represent the number of cells. The half-blocking concentration of nimodipine was estimated to be 40 nm.
We next determined if the residual inward current had pharmacological properties that were consistent with Ca2+ currents by testing its sensitivity towards Cd2+, a known Ca2+ channel blocker (Hille, 1992). Cd2+ (0.2 mm) completely blocked the DHP-insensitive component (Fig. 1A, upper right panel). The residual current, after application of nimodipine (10 μm), was insensitive to ω-agatoxin IVA (5 μm; n = 5; data not shown). The effects of ω-conotoxin GVIA (5 μm) on whole-cell current were mixed. The toxin blocked the residual current in some cells (n = 5). In others (n = 4), the decrease in the current amplitude was modest and may be explained by current run-down (data not shown). To further cross-check these data, the effects of the toxin were tested directly using single-channel recordings (Fig. 9).
Figure 9. Differential sensitivity of the non-L- versus L-type Ca2+ channels to ω-conotoxin GVIA.
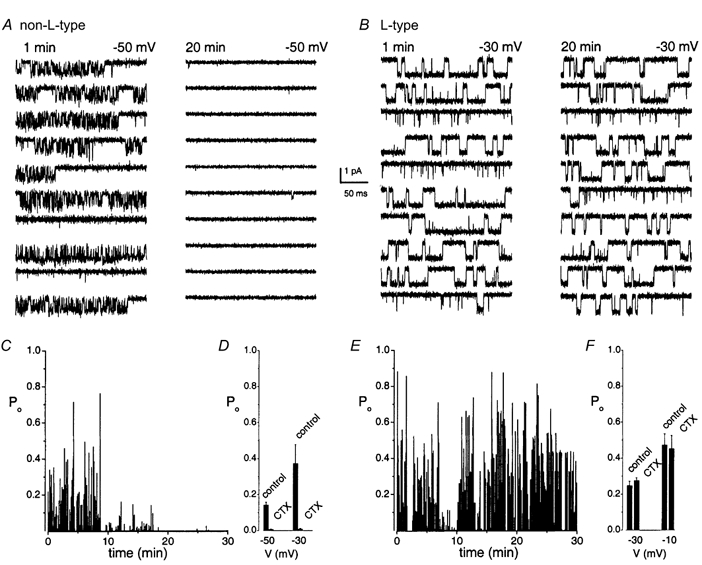
None of the known organic Ca2+ channel blockers was effective in blocking the non-L-type Ca2+ channel at the single-channel level, except ω-conotoxin GVIA, which significantly blocked the channel at reduced permeant ion concentrations. A, patch electrodes containing 20 mm Ba2+ were backfilled with 100 μmω-conotoxin GVIA. After the initial recording of channel activity (1-10 min), the Po of the non-L-type channel recorded at test potentials of -50 mV from a holding potential of -70 mV plummeted. B, same experiments as in A for L-type channels. Po of the L-type channels recorded at test potentials of -10 mV from a holding potential of -70 mV. There was no significant change in Po over time. C, diary of the Po of a non-L-type channel recorded with 100 μmω-conotoxin GVIA-diffused pipette solution. The Po of the channel decreased after 10 min of recordings. D, bar graph shows the Po of the non-L-type channel recorded at test potentials of -50 and -30 mV at baseline and after 20 min of recording. Po at -50 and -30 mV was 0.14 ± 0.02 and 0.37 ± 0.11, respectively, for control and significantly decreased to 0.005 ± 0.003 and 0.007 ± 0.004, respectively, after 20 min of recording (n = 5; P < 0.05). E, diary of the Po of an L-type channel recorded with at a test potential of -10 mV with 100 μmω-conotoxin GVIA in the pipette. F, in contrast to the non-L-type channel, the activity of the L-type channel remained unchanged as shown. Po at -30 and -10 mV was 0.25 ± 0.02 and 0.47 ± 0.06, respectively, for control and after 20 min of ω-conotoxin GVIA diffusion was 0.27 ± 0.02 and 0.45 ± 0.07, respectively (n = 5; P = not significant).
Pharmacology of single Ca2+ channels revealed two distinct Ca2+ channel subtypes
The channels that contribute to whole-cell currents can be best identified by examining single-channel data. Figure 3A shows single-channel Ba2+ currents (65 mm) obtained from a cell-attached patch. The ensemble-averaged currents were elicited from 100 consecutive sweeps of single-channel current using a step potential of -20 mV. Depolarization resulted in characteristic brief (mode 1) and long (mode 2) openings. The gating kinetics were similar to those of neuronal L-type channels (Hess et al. 1984; Fox et al. 1987). Accordingly, we found that the channel was sensitive to the DHP analogues. Bay K 8644, (5 μm) increased the open probability (Po) of the channel (Fig. 3C; Po at a test potential of -30 mV was 0.07 ± 0.09 and 0.2 ± 0.1 at baseline and after application of Bay K 8644, respectively; n = 205 patches). Bay K 8644 also induced a shift in the open time distribution towards mode 2 openings, a feature typical of L-type channels (Nowycky et al. 1985). In addition, the DHP antagonist nimodipine (5 μm) attenuated the activity of this channel (Fox et al. 1987; Fig. 3B and D; Po at a test potential of -30 mV was 0.10 ± 0.06 and 0.002 ± 0.0001 at baseline and after application of nimodipine, respectively; n = 107 patches). In addition, consistent with the whole-cell data, we have obtained records of a DHP-insensitive Ca2+ channel with gating and voltage-dependent properties, which differ from those of the L-type channels (Po at test potential of -30 mV was 0.08 ± 0.04 and 0.11 ± 0.06 at baseline and after application of nimodipine, respectively; n = 5). At step potentials positive to ≈-40 mV, the non-L-type channel undergoes fast gating properties that are distinct from the L-type channel (Fig. 4).
Figure 3. Effects of dihydropyridines on single-channel Ba2+ currents.
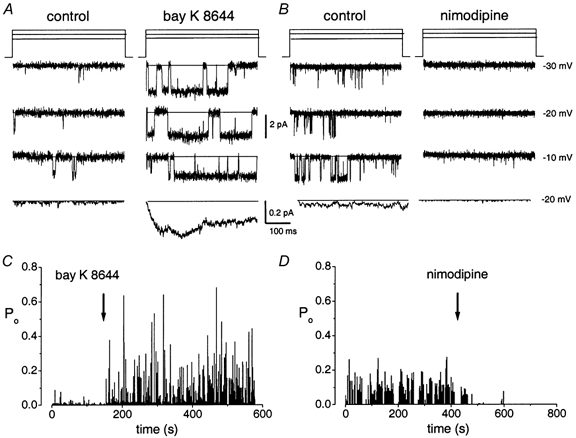
A, single-channel Ba2+ current traces were recorded in the cell-attached configuration using 65 mm Ba2+ as the charge carrier. The traces were generated with the rectangular pulse protocols shown in the upper panel from a holding potential of -70 mV to step potentials indicated to the right of the traces. Current traces were filtered at 2 kHz and digitized at 10 kHz. The continuous line indicates the closed level. The traces illustrate single-channel activity before and after bath application of the dihydropyridine agonist Bay K 8644. Bay K 8644 (5 μm) promotes long openings (mode 2). B, the dihydropyridine antagonist nimodipine decreased single-channel open probability (Po) as shown (note: the drug was applied to a control patch that showed frequent long openings). At a step potential of -30 mV, the Po in control was 0.10 ± 0.06, which was reduced to 0.0020 ± 0.0001, n = 107 after application of 5 μm nimodipine. Ensemble-averaged currents at a test potential of -20 mV were constructed from idealized current traces from 100 consecutive sweeps recorded both at baseline and after application of 5 μm Bay K 8644 or nimodipine and are shown below the single-channel current traces. C and D, a diary of the channel open probability (Po) during control and after application of Bay K 8644 or nimodipine (arrows) is shown. Whereas Bay K 8644 increased the Po of the L-type channel, nimodipine had the opposite effect.
Figure 4. Nimodipine-insensitive single Ba2+ currents in hair cells.
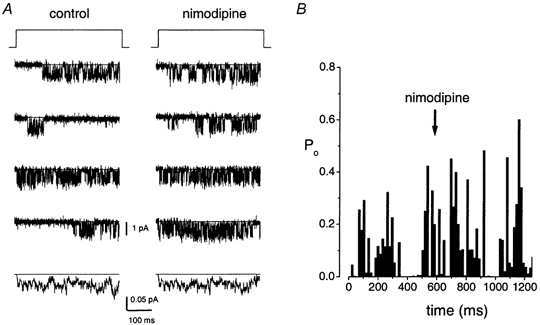
A, the nimodipine-insensitive current showed brief open and shut times that are different from the L-type channel kinetics. Four consecutive and ensemble-averaged current (100 consecutive traces) traces were recorded in the cell-attached configuration using a test potential of -30 mV from a holding potential of -70 mV. Closed levels are indicated with continuous lines. The traces were recorded using 65 mm Ba2+ as the charge carrier at 2 kHz and digitized at 10 kHz; nimodipine (10 μm) was bath-applied. To allow for diffusion of the applied drug, data were collected 3 min after the application of the drug. B, a diary of the Po is shown before and after application of 10 μm nimodipine (arrow). The mean Po before and after application of the drug was 0.05 and 0.06, respectively. Hence, nimodipine produced no change in the activity of the channel.
Voltage dependence of Ca2+ channels in hair cells
Shown in Fig. 5A and B are exemplary traces of the L-type currents and the steady-state voltage-dependent activation of the L-channels. The activation of the L-type channel has a steep voltage dependence and a fit to the Boltzmann function revealed a maximum slope factor (k) of 4.4 ± 1.4 mV (n = 7) and a half-activation voltage (V1/2) of -16 ± 11 mV (n = 7). Taking into consideration the surface charge effect imposed by 65 mm Ba2+ (Hagiwara & Takahashi, 1967), we expect that at physiological concentrations of Ca2+ (≈2 mm), the V1/2 of the L-type channel will be shifted by ≈20 mV in the hyperpolarized direction (Zamponi & Snutch, 1996). The steady state activation curve for the non-L-type channel showed a maximum slope factor of 3.1 ± 0.9 mV (n = 3) and a half-activation voltage (V1/2) of -53 ± 6 mV (n = 3; Fig. 5C). One additional feature of the L- and non-L-type channels was that even at positive test potentials, there were frequent blank sweeps that were clustered such that the maximum Po was invariably less than 1 (maximum Po for L-type channels was 0.4 ± 0.2, n = 7). Presumably, the channels exhibit multiple closed states, some of which may be absorbing (Imredy & Yue, 1994; Zei & Aldrich, 1998). The non-L-type channel remained relatively active at step potentials close to the resting potential of hair cells (-50 to -70 mV, Roberts et al. 1990; Holt & Eatock, 1995), even under conditions where the activation threshold of the channel was expected to be shifted to more positive potentials (65 mm of divalent cation; Fig. 5C). As depicted in Fig. 5D, the Po of the non-L-type channel was at least 20-fold higher than that of the L-type channels for potentials ranging from -65 mV to -50 mV. These data suggest that the predominant Ca2+ current at potentials close to the resting potential of hair cells is the non-L-type current.
Figure 5. Voltage dependence of single L- and non-L-type channels.
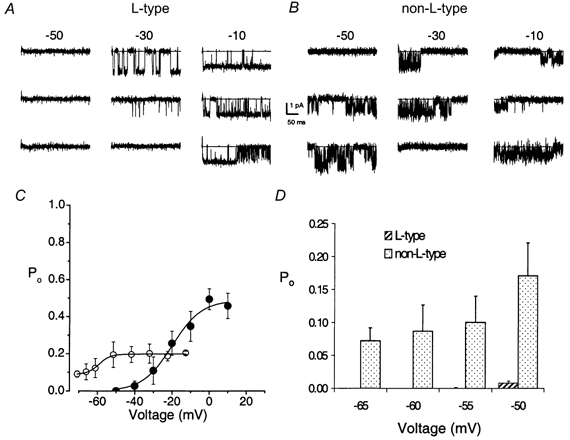
A, three consecutive sweeps of single-channel Ba2+ currents (65 mm) are shown for the step potentials indicated (in mV) from a holding potential of -70 mV. The illustrated records were sampled as in Fig. 4. The continuous line indicates the closed level. A and B represent cell-attached patches containing single L- and non-L-type channels, respectively. Whereas the L-type channel activated at step potentials positive to -40 mV, the non-L-type channel activated at potentials positive to -60 mV. C, Poversus voltage relation for L- and non-L-type channels. Po was obtained from 400 ms voltage steps ranging from -65 to 10 mV. Each symbol represents the mean Po (including null traces) calculated from 200 consecutive sweeps. Continuous lines represent a single Boltzmann fit to the data points. For the L-type channels (•), the half-activation voltage (V1/2) was -16 ± 11 mV, the slope was e-fold for 4.4 ± 1.4 mV and the maximum Po was 0.4 ± 0.2 (n = 7). For the non-L-type channel (○), V1/2 was -53 ± 6 mV, the slope was e-fold for 3.1 ± 0.9 mV and the maximum Po was 0.2 ± 0.2 (n = 3). D, a histogram showing the Po of single L- (hatched bars) and non-L-type channels (dotted bars) at test potentials ranging from -65 to -50 mV. Note that the Po values of the L-type channels from -65 to -55 mV were close to zero. The Po of the non-L-type channels is at least 20-fold higher than that of the L-type channels at these test potentials.
We examined the voltage dependence of the non-L-type channel by comparing the open probability of the channel at -55 mV with that following a priming voltage at 80 mV for 500 ms (a 20 ms gap was left between the priming voltage and test voltage to allow for deactivation of the channel; Fig. 6A). While the mean Po at -55 mV was 0.04 ± 0.02 (n = 5), the Po increased by at least 8-fold (0.3 ± 0.03; n = 5) after the priming positive voltage step (Fig. 6B). We further assessed the first latency distributions of the channel openings and observed changes in the time constants with respect to voltage (Table 1).
Figure 6. The non-L-type channel exhibits voltage-dependent potentiation.
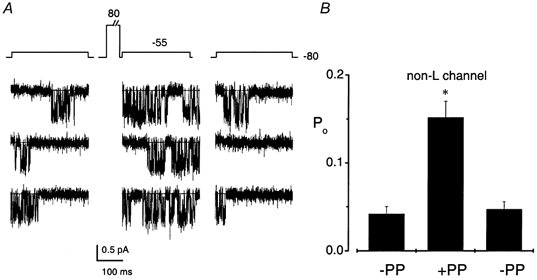
A, single-channel Ba2+ (65 mm) currents recorded in the cell-attached configuration and filtered at 2 kHz. The patch pipette contained 10 μm nimodipine to block L-type channels. Three consecutive sweeps are shown for the non-L-type channel elicited from a holding potential of -80 mV to a step potential of -55 mV (left panel). The channel was primed with a pre-pulse at 80 mV for 500 ms and then stepped to -55 mV (middle panel, a 20 ms gap allowed for deactivation of the channels before the test pulse was applied). The right panel shows three consecutive traces obtained using the same protocol described for the left panel but after the middle panel traces have been generated. As shown in B, the Po of the channel increased by at least 8-fold following the priming voltage (-PP, without priming voltage; +PP, with priming voltage). The mean Po at -55 mV was 0.04 ± 0.02; however, following an 80 mV pre-pulse, the mean Po increased to 0.3 ± 0.03 (n = 5).
Table 1.
Characteristics of the L− and non-L-type single-channel currents
| L-type | Non-L-type | |
|---|---|---|
| Conductance (pS) | ||
| Ba2+ | 27.5 ± 4.6(35) | 20.3 ± 2.0(31) |
| Sr2+ | 16.7 ± 1.0(3) | 19.2 ± 1.2(6) |
| Ca2+ | 13.1 ± 2.4(9) | 16.1 ± 2.6(8) |
| Open time (ms) | ||
| τ1 | 0.3 ± 0.1(5) | 0.2 ± 0.1(5) |
| τ2 | 9.7 ± 2.0(5) | 4.6 ± 1.3(5) |
| τ3 | 22.7 ± 5.8(5) | — |
| Closed time (ms) | ||
| τ1 | 1.5 ± 0.7(5) | 0.8 ± 0.1(5) |
| τ2 | 10.3 ± 3.8(5) | 5.3 ± 0.3(5) |
| τ3 | 56.6 ± 28.9(5) | — |
| First latency distribution (ms) | ||
| −30 mV | 6.2 ± 3.2(3) | 3.2 ± 1.9(3) |
| −20 mV | 4.8 ± 1.5(3) | 2.9 ± 0.6(3) |
| −10 mV | 3.3 ± 1.1(3) | 1.7 ± 1.2(3) |
Numbers in parentheses represent the number of channels. Conductance measured with 65 mM cation; open and closed times measured at −30 mV.
We next examined the unitary conductances of the two channels using Ba2+, Sr2+, or Ca2+ as the charge carriers. In Fig. 7A and C, we show the characteristic single-channel traces recorded from cell-attached patches using 65 mm Ba2+, Sr2+, or Ca2+ as charge carriers. The panels below the traces show the corresponding amplitude histograms obtained at a test potential of -30 mV. Illustrated in the right panels is the unitary current amplitude plotted against the test potentials for the DHP-sensitive and -insensitive Ca2+ channels (Fig. 7B and D). The slope conductance of the channels for the examples shown was ≈29, 18 and 14 pS for the L-type channel and 21, 19 and 16 pS for the DHP-insensitive channel with Ba2+, Sr2+ and Ca2+ as the charge carriers, respectively (Table 1).
Figure 7. Single-channel recordings using different permeant ions revealed that the L- and non-L-type Ca2+ channels have different single-channel conductances.
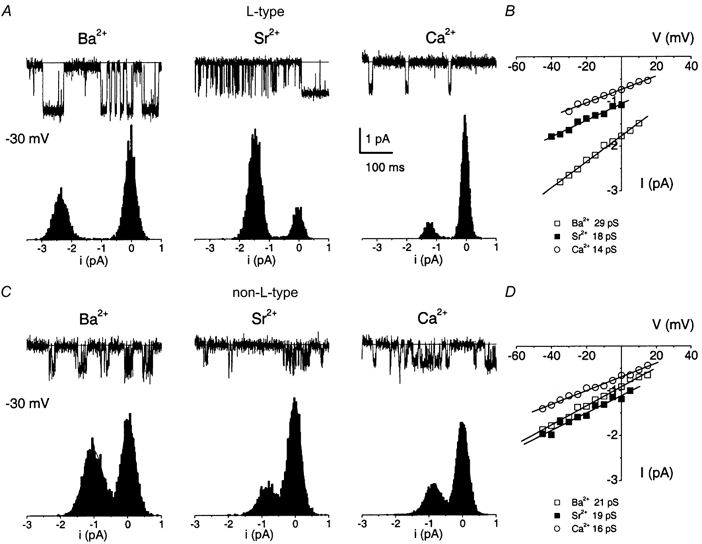
A, single-channel currents were recorded using a step potential of -30 mV from a holding potential of -70 mV using 65 mm Ba2+, Sr2+, or Ca2+ as charge carriers. The channel in each patch could be blocked after bath application of 5 μm nimodipine. The amplitude histograms are shown below the traces. The y-axis of the amplitude histograms represents the relative counts. B, single-channel conductance of the L-type channel was determined for the three permeant ions using linear least-square fits to the mean single-channel amplitudes at different test potentials. The conductance of the channel follows the sequence Ba2+ > Sr2+ > Ca2+. C, single-channel currents obtained in the cell-attached configuration with pipettes containing 65 mm Ba2+, Sr2+, or Ca2+ as charge carriers and 10 μm nimodipine to block L-type channels. The traces illustrated were generated from a holding potential of -70 mV to a step potential of -30 mV. The corresponding amplitude histograms are shown below the traces. D, single-channel conductances were determined for the nimodipine-insensitive channel as described in B.
Kinetic differences between the L-type and non-L-type Ca2+ channels
Recordings from patches containing single Ca2+ channels were used to study the kinetics of opening and closing. Figure 8A and E shows eight consecutive sweeps recorded from cell-attached patches containing L- and non-L-type channels, respectively. The open and closed time histograms of the L-type channel at a test potential of -30 mV were best fitted by the sum of three exponential functions with time constants of open (τo) and closed (τc) distributions as follows (ms): τ1o = 0.9, τ2o = 2.0, τ3o = 10.8, τ1c = 0.9, τ2c = 3.8, τ3c = 38.5 (Fig. 8B and C; see Table 1 for summary data). In contrast, the open time distribution of L-type channels in chick sensory neurones has been described with one time constant (≈1.2 ms). However, the closed time distribution of L-type channels in hair cells matches well with that in chick sensory neurones and cardiac myocytes (Hess et al. 1984; Fox et al. 1987). The open and closed time distribution of the non-L-type channels in hair cells is similar to single N-type Ca2+ channels from bullfrog sympathetic neurones (τo = 0.7-3.1 ms, τc = 0.3-18.9 ms; Lee & Elmslie, 1999). Moreover, the non-L-type channels have a faster first latency distribution than the L-type channels, thus providing additional evidence for the differences between the two channels (Fig. 8D and H).
Figure 8. Single-channel kinetics of the L- and non-L-type Ca2+ channel.
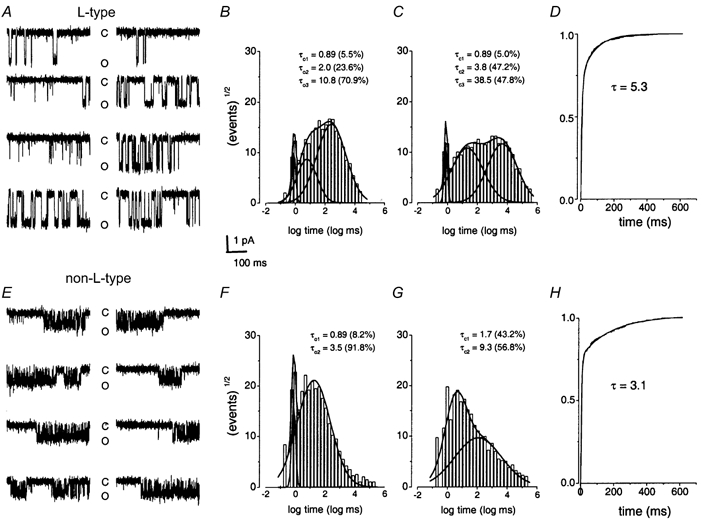
A, eight consecutive traces were recorded from a holding potential of -70 mV using a test potential of -30 mV in the cell-attached configuration. C and O denote the closed and open levels, respectively. Although the channel had not been treated with Bay K 8644, there appeared to be frequent long (mode 2) openings in this particular patch. B and C, dwell time histograms were binned logarithmically using 10 bins per decade and plotted with a square root transformation of the number of events (Sigworth & Sine, 1987). Characteristic open time (B) and closed time (C) distributions were fitted with three time constants. D, exponential fit to the normalized first latency histogram is shown. Time constants of the open and closed time distributions (τo, τc), and the first latency distribution (τ) are indicated (in ms). Numbers in parentheses represent the percentage of time in which the channel dwells in the different states. E-H, the corresponding data from the non-L-type channel. In contrast to the L-type channels, the open and closed time histograms were best fitted with two time constants. The cumulative first latency histograms for the non-L-type channels were relatively faster than those of the L-type channels (see Table 1).
Identity of the non-L-type channels
The 16 pS Ca2+ channel may belong to a pharmacologically distinct class of channels. To test this hypothesis, patch-electrodes were filled with toxin-free solutions and backfilled with known organic Ca2+ channel blockers as follows: ω-conotoxin GVIA, 2-5 μm; ω-conotoxin MVIIC, 2-5 μm; ω-agatoxin IVA, 5 μm; and ω-grammotoxin-SIA, 1 μm. Each toxin was tested in six to eight different patches. Single-channel currents carried by 65 mm Ca2+ were not blocked by any of these Ca2+ channel blockers. However, high concentrations of ω-conotoxin GVIA (100 μm) blocked single-channel current through a substantial number of non-L-type channels when divalent ion concentration was ≤ 20 mm. Figure 9A and B shows 10 consecutive single-channel current traces carried by 20 mm Ba2+ recorded 1 and 20 min after obtaining gigaohm seals. In 5 out of 8 patches, the probability of the non-L-type channels opening (Po) plummeted after 10-20 min of recording in ω-conotoxin GVIA-diffused patches (Fig. 9C and D); significant attenuation of Po was rarely seen in the control condition over the same period of recordings. Single-channel current remained stable until at least 30 min of recording. In contrast, ω-conotoxin GVIA had no effect on the L-type channel openings (Fig. 9B, E and F: n = 3). A previous study has shown that blockade of the N-type Ca2+ currents carried by high divalent cations (> 50 mm) required relatively high concentrations of ω-conotoxin GVIA (Boland et al. 1994). Apparently, divalent cations may compete with the ω-conotoxin GVIA binding site of the channel. Thus, high concentrations of Ba2+ or Ca2+ may decrease the toxin's affinity for the channel (Elmslie, 1997). Although the non-L-type channel appears to have several features which are distinct from any known Ca2+ channel, the channel has few characteristics that bear resemblance to the N-type channel (e.g. conductance and pharmacology; Nowycky et al. 1985).
Distribution and co-localization of hair cell Ca2+ channels
We investigated the distribution and density of Ca2+ channels by monitoring the cell type and the location of patch pipettes on the basolateral membrane and patch capacitance. Fine-tipped quartz pipettes were used to assess the channel density. The LAD ratios for 70 cells were determined for these experiments: 30 cells had a LAD ratio of ≈3, 30 had a LAD ratio of ≈6 and the remaining 10 had a LAD ratio of ≈10. By random sampling, we recorded L-type Ca2+ channels in 16 and 14 cells with LAD ratios of 3 and 6, respectively; we were also able to record the non-L-type currents in the remaining cells. Thus, the expression of the Ca2+ channel subtypes was not skewed towards these two groups of hair cells. However, in cells with a LAD ratio of ≈10, 7 out of 10 cells sampled contained the non-L-type channels.
In 288 patches, we monitored the location of the patch electrode at the basolateral membrane. In 151 patches, we recorded single-channel activity at the basal pole of the basolateral membrane: 28 (19 %) had no active Ca2+ channels, 15 (10 %) contained only one channel, 101 (67 %) had 2-15 channels and 7 (5 %) patches contained more than 20 channels. We recorded 137 patches at the apical half of the basolateral membrane: 35 (26 %) had no active channels, 39 (26 %) contained one channel, 61 (45 %) had 2-15 channels and 2 (2 %) patches had more than 20 channels. Therefore, there were no apparent differences in the distribution of the channels between the basal poles versus apical half of the basolateral membrane. Out of the 288 patches, we randomly measured the capacitance of membrane patches (35 ± 19 fF, n = 70; electrode resistance, 15-25 MΩ). We identified at least three types of channel distribution: single (< 1 channel μm−2), low-density clusters (≈10 channels μm−2) and high-density clusters (≈50 channels μm−2).
We next asked if the L-type and the non-L-type channels were co-localized. Figure 10A shows current traces of a multi-channel patch, which contained the two channel types. Co-localization of the two channel types was observed in 18 out of 288 (6 %) patches. To estimate the voltage dependence of the VGCCs, ramp protocols (at 2 V s−1) were applied to patches containing the two channel types (Fig. 10B). As shown in Fig. 10C, the ensemble-averaged ramp current-voltage relation in 65 mm Ba2+ revealed two consistent peaks at 5 and 20 mV. These peaks may correspond to the minor (≈-35 mV: see I-V curve Fig. 1B) and major (≈-10 mV) peaks, which were observed in the whole-cell current records using 5 mm Ca2+ as the charge carrier. Finally, we estimated the number of channels in multi-channel patches using the binomial theorem and non-stationary fluctuation analysis (Fig. 11). Because these analyses require that the channels in clusters belong to only one class of Ca2+ channel subtype, we employed the method in multi-channel patches that could be blocked completely by nimodipine. Figure 11A shows exemplar current traces of a multi-channel patch (patch capacitance was ≈12 fF) and the estimated number of channels in the patch was ≈76 (Fig. 11B). These results agree with previous studies (Roberts et al. 1990; Art et al. 1995) that reported that most hair cell Ca2+ channels are organized into discrete clusters of channels (≈20 clusters per cell). However, our study further demonstrates that the expression of Ca2+ channels in hair cells is not tailored towards clustering alone. Some channels are inserted randomly in the basolateral membrane (Fig. 11D and E). Thus, direct measurement of Ca2+ channel activity shows a heterogeneous distribution of the channels in the basolateral membrane.
Figure 10. Co-localization and peak activation of the L- and non-L-type channels.
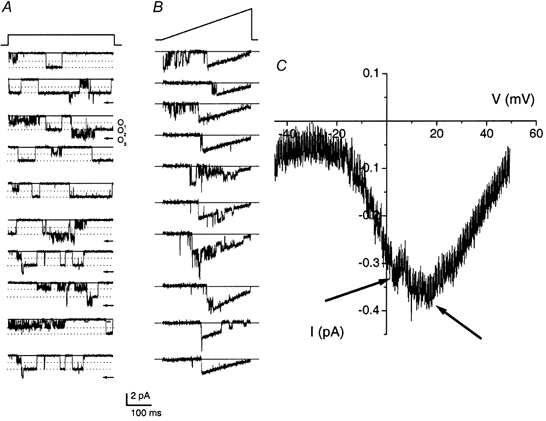
Ten consecutive sweeps of single-channel current traces recorded using 65 mm Ba2+ showing the presence of L- and non-L-type Ca2+ channels in the same patch. The patch was held at -70 mV and stepped to -30 mV. The continuous line indicates the closed level and level O1 represents open level of the non-L-type channel. Levels O2 (dotted line) and O3 (arrow) represent open levels of the L-type channel and simultaneous openings of the L- and non-L-type channels, respectively. B and C, current traces elicited with a voltage-ramp protocol and the ensemble-averaged ramp current-voltage relation, respectively. The gradient of the ramp protocol was set at 2 V s−1. Patches containing the non-L- and L-type channels revealed two consistent peaks at 5 and 20 mV. The peak current at 5 and 20 mV may correspond to the maximum current of the non-L- and L-type channels, respectively.
Figure 11. Clustered Ca2+ channels in the basolateral membrane of hair cells.
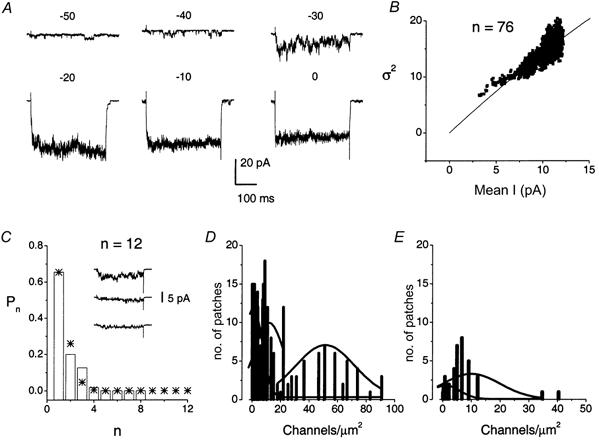
A, a cell-attached patch containing a cluster of channels was held at -70 mV and stepped to potentials indicated above the traces (in mV). Bath application of 5 μm nimodipine blocked all the channels in this patch (data not shown). B, we used non-stationary fluctuation analysis to determine the number of channels (N) in a cluster using the equation: σI(I)2 =Ii - I2/N, where σ2 and I are the variance and the mean macroscopic current, respectively. The single-channel current amplitude (i) of 1.2 pA was measured directly at the test potential of -10 mV to avoid an inherent underestimation of i associated with this method. The estimated number of channels in the patch was ≈76. Patch capacitance in this experiment was ≈12 fF. C, apart from channels in large clusters, there were patches that contained fewer channels. Using binomial analysis, the estimated number of channels in this particular patch was 12 and the patch capacitance was 15 fF. Shown in the inset are current traces from this patch elicited at a test potential of -30 mV from a holding potential of -70 mV. The asterisks represent the calculated value of Pn using the binomial theorem. D and E, summary data of channel density obtained from patches at the basal pole of hair cells (D), and upper one-half of the basolateral membrane (E). Three classes of Ca2+ channel densities were noted at the basal pole of hair cells: < 1, ≈10 and ≈50 channels μm−2. In contrast, only two classes of Ca2+ channels densities (< 1 and ≈10 channels μm−2) were identified in the upper one-half of the basolateral membrane.
Biochemical and immunohistochemical detection of α1D and α1B-like Ca2+ channel subunits in hair cells
To further examine the identity of the L-type and the non-L-type Ca2+ channels, tissue homogenates obtained from sheets of isolated hair cells from bullfrog sacculi were analysed by Western blotting using polyclonal antibodies that cross-react with the α1 subunit of the different Ca2+ channel subtypes (Fig. 12A). The following antibodies were used: anti-pan α1 (directed against the α1 subunit of all known Ca2+ channels, with the exception of the T-type Ca2+ channels), anti-α1A (P/Q-type), anti-α1B (N-type), anti-α1D (class D L-type) and anti-α1E (R-type) antibodies. The anti-pan α1 antibody detected bands at molecular masses of ≈205 and 120 kDa, while α1B and α1D antibodies each detected the 120 and 205 kDa bands, respectively. The 205 kDa band corresponds well to the molecular mass of Ca2+ channels (Singer et al. 1991; Shistik et al. 1995). Because the anti-pan α1 antibody also recognized the lower molecular mass band, and because the band was not detected when the antibody was pre-incubated in antigenic peptides (data not shown), the 120 kDa bands might have derived from the 205 kDa forms. The anti-α1A and -α1E antibodies did not detect any protein band that was reactive to the anti-pan α1 antibody. The results of these biochemical experiments suggest that hair cells express both α1B-like and α1D Ca2+ channel subtypes.
Figure 12. Detection and immunocytochemical localization of α1B and α1D Ca2+ channel subunits in hair cells using anti-α1B and anti-α1D antibodies.
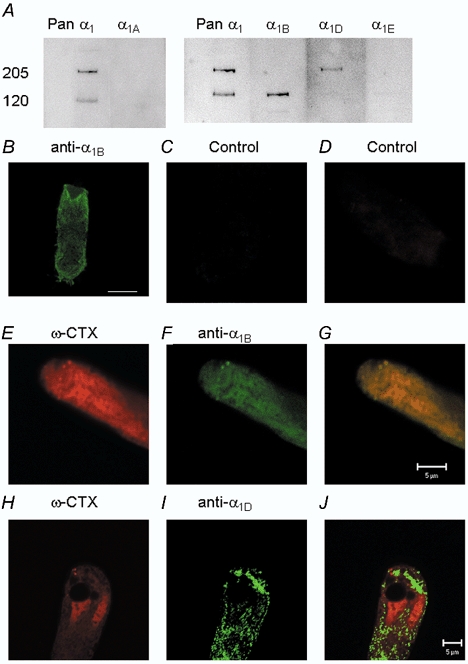
A, immunoblot detection, using anti-pan α1 antibody directed against voltage-gated Ca2+ channels (except T-type Ca2+ channels), revealed 205 and 120 kDa proteins in isolated sheets of hair cell homogenate. Anti-α1A and anti-α1E (P/Q- and R-type Ca2+ channels, respectively) antibodies failed to detect proteins that reacted positively with the pan α1 antibody. Whereas the 120 kDa protein was detected by anti-α1B antibody, the 205 kDa protein was detected by anti-α1D antibody. Each lane was loaded with 10 μg total protein. B, immunocytochemisty showing positive reactivity of anti-α1B antibody with membrane proteins at basal pole as well as apical aspects of the basolateral membrane. Note that there was no labelling in the hair bundles (scale bar = 10 μm). C, a control cell was pre-incubated with the antigenic peptide (5 μm) before application of anti-α1B antibody (see Methods) showing no positive staining. D, similarly, cells treated with 10 μmω-conotoxin GVIA show no positive staining with rhodamine-labelled ω-conotoxin GVIA. E, rhodamine-labelled ω-conotoxin GVIA shows positive reactivity with the membrane proteins in the basal pole of the basolateral membrane of hair cells (red). F, similar proteins were labelled with anti-α1B antibody, which was detected with fluorescein-conjugated secondary antibody (green). G, double-labelling of E and F, showing ‘hot spots’, which were detected by both rhodamine-labelled ω-conotoxin GVIA and anti-α1B antibody (shown as yellow). H, similar labelling of a hair cell with rhodamine-labelled ω-conotoxin GVIA is shown. Apart from the intensely labelled membrane protein, there was non-specific staining of the nucleus. I, plasma membrane of hair cells was labelled by anti-α1D antibody, which was detected with fluorescein-conjugated secondary antibody. The intense labelling at the basal pole of the basolateral membrane may reflect high-density Ca2+ channel clusters. J, co-localization of positively labelled membrane proteins with rhodamine-labelled ω-conotoxin GVIA and anti-α1D antibody was uncommon.
Because the sheets of hair cells used in the Western blot analysis also included supporting cells and remnants of afferent and efferent nerve terminals, we used immunofluorescence confocal microscopy methods to detect α1B and α1D in isolated hair cells. Positive labelling was observed in the basolateral but not the apical membrane (Fig. 12B). Positive labelling of the membrane was rare in control experiments in which isolated hair cells were pre-incubated with purified peptides (Fig. 12C and D). Co-localization of ‘hot spots’ by rhodamine-labelled ω-conotoxin GVIA and fluorescein-conjugated anti-α1B antibody suggested that hair cells express N-type-like Ca2+ channels (Fig. 12E-G). Using anti-α1D antibodies, we observed consistent positive labelling of the basolateral membrane (Fig. 12H-J), which was abolished when the antibody was pre-incubated with purified peptides (data not shown). Intense punctate labelling was detected on the entire basolateral membrane. However, there were frequent and striking ‘hot spots’ at the basal half of hair cells. Consistent with the physiological data, co-localization of rhodamine-labelled ω-conotoxin GVIA, and the fluorescein-conjugated anti-α1D antibodies was observed rarely.
DISCUSSION
This study investigated Ca2+ channel currents at both whole-cell and single-channel levels in isolated hair cells from the bullfrog sacculus. First, in agreement with a previous report, we have observed two types of Ca2+ channels in these cells (Su et al. 1995). Second, we provide biochemical evidence that these two types of channels correspond to α1D and α1B-like Ca2+ channel subtypes. Furthermore, our electrophysiological and pharmacological findings show not only that saccular hair cells express L-type channels but also that the second type of channel binds to ω-conotoxin GVIA.
Because the ω-conotoxin GVIA-sensitive channels are activated at voltages that match the resting membrane potentials of hair cells, we hypothesize that the activity of the channels may promote tonic neurotransmitter release whereas the L-type channels could trigger evoked neurotransmitter release. Moreover, the two channels may provide the conduit through which Ca2+ ions may be transported from the perilymphatic to the endolymphatic space via hair cells (Yamoah et al. 1998). Finally, we confirmed data from previous studies, which showed that hair cell Ca2+ channels are clustered (Roberts et al. 1990; Issa & Hudspeth, 1994). We have demonstrated in this study, however, that the distribution of the Ca2+ channels in bullfrog hair cells is mixed varying from solitary channels to low- and high-density clusters. Although the distribution of the two Ca2+ channel subtypes is heterogeneous and variable, it is not strewed randomly in the basolateral surface. Rather, we propose that the assembly of Ca2+ channels into clusters is site specific; a subpopulation of channels is consolidated into clusters at the basal pole where afferent synaptic terminals are rampant whereas others are distributed as solitary channels.
Bullfrog hair cells express L-type and non-L-type Ca2+ channels
Our results are in agreement with previous studies, which demonstrated that the L-type Ca2+ channel embodies the main channel in hair cells (Hudspeth & Lewis, 1988a; Robert et al. 1990; Art et al. 1993; Zidanic & Fuchs, 1995; Kollmar et al. 1997b; Martini et al. 2000). Consistent with previous reports, the L-type Ca2+ channels in hair cells have properties that are similar to L-type channels in other systems. These include high single-channel conductance (≈25-30 pS in 70-110 mm Ba2+), and sensitivity towards dihydropyridines (Nowycky et al. 1985; Fox et al. 1987; Art & Fettiplace, 1987; Roberts et al. 1990; Zidanic & Fuchs, 1995). Western blot and immunocytochemical experiments (Fig. 12) agree well with previous molecular biology studies, which identified the L-type channel in hair cells as α1D class (Kollmar et al. 1997b).
Ca2+ channels in hair cells constitute presynaptic channels. The L-type channels in hair cells are non-inactivating (Roberts et al. 1990; Zidanic & Fuchs, 1995; Armstrong & Roberts, 1998; Fig. 1; but see Martini et al. 2000), in contrast to L-type currents described in other systems (Fox et al. 1987; see Tsien et al. 1988). Typically, L- and N-type Ca2+ channels in neuronal somata inactivate with voltage (Tsien, 1988; Yamoah et al. 1994); however, previous studies have shown that some presynaptic Ca2+ channels belonging to these classes of channels are resistant to voltage-dependent inactivation (Augustine et al. 1985; Stanley & Goping, 1991). This raises the possibility that the properties of the synaptic Ca2+ channels may be shaped by their interaction with synaptic proteins (Bezprozvanny et al. 1995; Wiser et al. 1997; Sunderland et al. 2000). Although recent reports have shown that presynaptic N-type channels do exhibit voltage-dependent inactivation (Elmslie, 1997), the diversity of synaptic Ca2+ channel properties may include species-specific splice variants. To this end, it is conceivable that all hair cell Ca2+ channels belong to the same class of L-type channels, and that the association of synaptic proteins with the channels confers different gating properties when compared with extrasynaptic channels.
The non-L-type channels belong to a distinct class of Ca2+ channels. The channels are insensitive to the DHPs and bear some resemblance to N-type channels in frog sympathetic neurons (Elmslie et al. 1994; Elmslie, 1997; Lee & Elmslie, 1999). The sensitivity of the non-L-type channels towards ω-conotoxin GVIA is remarkably similar to that of N-channels in sympathetic neurons (Elmslie, 1997). Most telling is the non-L-type channel's conductance (18-20 pS in 65 mm Ba2+) and the gating (τo = 0.6-2.0 ms), which parallel those reported for the ω-conotoxin GVIA-sensitive channels (Elmslie, 1997). Moreover, the biochemical findings that hair cells express membrane proteins that cross-react with an antibody directed against the α1B-class Ca2+ channels strongly support the idea that the non-L-type channels may belong to the N-type Ca2+ channel subtypes. However, the properties of the non-L-type channels in hair cells do not fit exactly into the characteristics of N-type channels. For example, the non-L-type channels activate at ≈-50 mV as compared to the activation threshold (≈-20 mV) of the N-type channels (Nowycky et al. 1985; Elmslie, 1997).
Studies of vestibular hair cells have documented the expression and subcellular localization of α1B and α1D subunits (Lopez et al. 1999). The previous study strengthens the notion that the non-L-type channel described from bullfrog saccular hair cells matches that of N-type channels. However, the uncertainty of whether hair cells from analogous inner ear organs express similar α1 subunits remains. For example, using polymerase chain reaction analysis, Green et al. (1996) did not observe message for α1B in mouse cochlea. Moreover, Martini et al. (2000) have shown, using whole-cell recordings, the presence of at least three distinct components of the Ca2+ current, none of which was identified as N-type current, in mechanically isolated hair cells from the semicircular canals of wild frog (Rana esculenta). In bullfrog saccular hair cells, we found two but not three VGCCs. It is conceivable that the third VGCC was missed because of rundown as was reported by Martini et al. (2000). However, we expected the current, if present in saccular hair cells, to be resistant to rundown using the perforated variant of the whole-cell recording techniques. Furthermore, out of ≈1000 cell-attached patches that we have recorded so far, we have not observed a single Ca2+ channel that is distinct from the L- and non-L-type channels that we have described in this study. The presence of multiple Ca2+ channels in hair cells has been established but identification of the number of different channel subtypes remains uncertain.
Our biochemical data suggest that the non-L-type channels do not belong to the R-class subunit since α1E antibodies failed to react with saccular homogenate proteins. The use of a frog-specific Ca2+ channel antibody may provide a definitive test on the identity of channels expressed by bullfrog saccular hair cells. Ca2+ channels in hair cells from neighbouring organs of the inner ear may comprise different channel subtypes. Martini et al. (2000) investigated the crista ampullaris Ca2+ currents and it is possible that the sacculi and the ampullae may express distinct Ca2+ current subtypes. Whereas Martini et al. (2000) used mechanical dissociation methods, others, including our report, employed enzymatic treatment to isolate hair cells. It is conceivable that the R-type Ca2+ channels are prone to degradation by the enzyme treatment used in the present study. There are contradictory reports with regard to the effects of enzymatic treatment on Ca2+ currents. Chabbert, (1997) found no significant effects of enzymatic treatment on Ca2+ currents in saccular hair cells. The results are at variance with data from Armstrong & Roberts (1998) who reported that whole-cell Ca2+ currents in bullfrog saccular hair cells are altered by enzymatic treatment. Finally, the diversity of Ca2+ channel currents in the inner ear may be compounded further by splice variants of the α1 subunit of the channel (Kollmar et al. 1997a).
Voltage-dependent characteristics of hair cell Ca2+ channels
One consistent and significant finding from our study is that the non-L-type channel activates at potentials 30-40 mV more negative than do N-type channels from other systems (Fig. 5C, Nowycky et al. 1985; Fox et al. 1987; McClesky et al. 1987; Stanley, 1991; Elmslie et al. 1994). The L-type channels in hair cells have a similar negative voltage shift in their activation threshold (Roberts et al. 1990; Art et al. 1993; Zidanic & Fuchs, 1995) when compared to L-type channels in other preparations (Fox et al. 1987; Taylor, 1988). An attractive suggestion has been made by (Kollmar et al. 1997b), who predicted that splice variants in the α1D channel in the chick cochlea may suffice to confer the differences in voltage-dependent activation properties of the L-type currents in hair cells. More telling are recent reports that splice variants in auxiliary subunits of the α-subunit may further alter the kinetics of ion channels (Ramanathan et al. 1999). Studies of cloned Ca2+ channels in heterologous expression systems have shown that the activation voltage of L-type channels is tightly regulated by their auxiliary subunits (Perez-Garcia et al. 1995; Shistik et al. 1995). For example, co-expression of the α1C subunit with the β2A subunit produces a hyperpolarizing shift of the activation threshold by ≈20 mV as compared to α1C alone (Lacerda et al. 1991; Singer et al. 1991). Thus, it is reasonable to expect that the expression of different splice variants of both the α-subunits and their auxiliary subunits could produce the diverse voltage-dependent and kinetic properties of Ca2+ channels in hair cells. Although it is clear that characterization of hair cell Ca2+ channels remains incomplete, the present study confirms the presence of an L- and a non-L-type channel. This study also provides the first description of the detailed elementary kinetic properties and distribution of such channels. Our report further demonstrates and identifies the presence of the non-L-type channels. The use of single (oligo-) cell reverse transcription polymerase chain reaction (RT-PCR) and in situ hybridization methods may further refine our understanding of the properties and identity of the Ca2+ channels in hair cells (Glowatzki, 1997).
Implications for hair cell function
Ca2+ channels serve as conduits for Ca2+ influx into hair cells to mediate neurotransmitter release and activate K+ channels to confer electrical tuning. Previous reports have shown that Ca2+ channels are clustered and co-localized with Ca2+-activated K+ channels (BK channels) at presynaptic zones in both bullfrog and turtle hair cells (Issa & Hudspeth, 1994; Tucker & Fettiplace, 1995; Art et al. 1995). The close localization of VGCCs at neurotransmitter release sites enhances rapid transmitter release (Adler et al. 1991), but channel clustering is not a prerequisite (Stanley, 1991, 1993). Similarly, whereas the clustering of Ca2+ and BK channels may ensure rapid membrane potential changes and thus high frequency tuning, low-frequency hair cells may not require the clustering of the two channels. In fact, we have demonstrated that single Ca2+ channels are expressed by hair cells and previous studies have concurred that single BK channels do exist in hair cells (Art et al. 1995; Hudspeth & Lewis, 1998a).
How do we account for the solitary and low-density clustered channels in bullfrog saccular hair cells in the light of previous studies? Using non-stationary fluctuation analysis on data from whole-cell currents and giant macropatches, Roberts et al. (1990) estimated that saccular hair cells contain ≈1800 VGCCs per cell; a hair cell may express about 20 clusters, each of which contains ≈90 VGCCs at synaptic release sites (Issa & Hudspeth, 1994; Tucker & Fettiplace, 1995). To account for the solitary VGCC in hair cells, two issues were considered. First, because hair cells express more than one class of VGCC, the use of non-stationary fluctuation analysis to determine whole-cell Ca2+ channel numbers is tenuous and may underestimate the number of channels. Second, whole-cell Ca2+ channel numbers have been estimated previously using the assumption that the open probability was ≈1 at the peak activation voltage of the whole-cell current (0 mV; Roberts et al. 1990; Art et al. 1995; Zidanic & Fuchs, 1995; Martinez-Dunst et al. 1997). As shown in this study, if we consider that the maximum Po of single Ca2+ channels in hair cells is ≈0.4 ± 0.2 (n = 7), the previous estimation of hair cell Ca2+ channel numbers accounted for only a fraction (≈40 %) of the total channels. Furthermore, because the Po of the Ca2+ channels is low, caution should be made against over-interpretation of Ca2+ channel numbers using non-stationary fluctuation analysis. Direct measurement of hair cell single Ca2+ channels suggests that bullfrog saccular hair cells may contain as many as 4500 channels per cell. This value is comparable to the number of Ca2+ channels estimated for high frequency cells (> 500 Hz) in the chick using the formulation originally derived from studies of turtle hair cells (NCa = 2NKCa, NKCa = 3.75F0, where F0 is the tuning frequency, NKCa is the number of BKCa channels and NCa is the number of Ca2+ channels) (Wu & Fettiplace, 1996; Martinez-Dunst et al. 1997). Implicit in this formulation is that the Po of the Ca2+ channels is ≈1 at 0 mV, which is clearly an overestimation of hair cell channel activity. Thus, the use of Ca2+ channel numbers as an index for the estimation of the number of BK channels, the tuning frequency, and presynaptic release area of a hair cell can only be accurately assessed after determination of the functional Po of the Ca2+ channels (Art & Fettiplace, 1987; Wu & Fettiplace, 1996; Martinez-Dunst et al. 1997). Finally, a crucial determinant of the magnitude of hair cell Ca2+ currents may rely on the modulation of the channels (Ricci & Fettiplace, 1997).
The contributions of the L-type currents in triggering evoked neurotransmitter release in hair cells have been demonstrated previously (Parsons et al. 1994; Moser & Beutner, 2000). The present study demonstrates that Ca2+ channels in low- and high-density clusters occur in the range of 10-50 channels μm−2. The Ca2+ channel densities at the basal pole of hair cells bear a striking resemblance to the Ca2+ channel densities and distribution at the presynaptic terminal of the chick ciliary ganglion, assessed using atomic force microscopy (Haydon et al. 1994). The activation threshold (low-voltage) of the non-L-type channels poises the channel to be active at the baseline membrane potential of hair cells. Consequently, the non-L-type channel may play a significant role in controlling tonic neurotransmitter release. In addition, the non-L-type channels may provide the route through which steady-state Ca2+ may be transported from the perilymphatic to the endolymphatic space via hair cells (Yamoah et al. 1998).
Although the L-type channels are the predominant Ca2+ channels, their expression may be skewed such that the expression level of the channel is reduced in cells with a LAD ratio > 9. Hair cells with a high LAD ratio are located at the periphery of the sacculi and may not be fully mature cells (Chabbert, 1997). The developmental stage of these cells may reflect the low Ca2+ current density and the reduced levels of L-type current.
Acknowledgments
We thank Dr E. Marban who generously provided his electrophysiological set-up for the initial recordings and Dr P. Gillespie for his initial support. Dr N. Chiamvimonvat and Mrs Emma-Lou Cardell provided constructive comments on the manuscript. This work was supported by grants to E.N.Y. from the NIH (R01 DC03828), the Deafness Research Foundation and the American Otological Society. A.R.C. is a CONACyT/IIE/Fulbright fellow.
References
- Adler EM, Augustine G, Duffy S, Charlton M. Alien intracellular calcium chelators attenuate neurotransmitter release at the squid giant synapse. Journal of Neuroscience. 1991;11:1496–1507. doi: 10.1523/JNEUROSCI.11-06-01496.1991. [DOI] [PMC free article] [PubMed] [Google Scholar]
- Armstrong CE, Roberts WM. Electrical properties of frog saccular hair cells: distortion by enzymatic dissociation. Journal of Neuroscience. 1998;18:2962–2973. doi: 10.1523/JNEUROSCI.18-08-02962.1998. [DOI] [PMC free article] [PubMed] [Google Scholar]
- Art JJ, Fettiplace R. Variation of membrane properties in hair cells isolated from the turtle cochlea. Journal of Physiology. 1987;385:207–242. doi: 10.1113/jphysiol.1987.sp016492. [DOI] [PMC free article] [PubMed] [Google Scholar]
- Art JJ, Fettiplace R, Wu Y-C. The effects of low calcium on voltage-dependent conductances involved in tuning of turtle hair cells. Journal of Physiology. 1993;470:109–126. doi: 10.1113/jphysiol.1993.sp019850. [DOI] [PMC free article] [PubMed] [Google Scholar]
- Art JJ, Wu Y-C, Fettiplace R. The calcium-activated potassium channels of turtle hair cells. Journal of General Physiology. 1995;105:49–72. doi: 10.1085/jgp.105.1.49. [DOI] [PMC free article] [PubMed] [Google Scholar]
- Augustine GJ, Charlton MP, Smith SJ. Calcium entry into voltage-clamped presynaptic terminals of squid. Journal of Physiology. 1985;367:143–162. doi: 10.1113/jphysiol.1985.sp015818. [DOI] [PMC free article] [PubMed] [Google Scholar]
- Bean BP. Nitrendipine block of cardiac calcium channels: high-affinity binding to the inactivated state. Proceedings of the National Academy of Sciences of the USA. 1984;81:6388–6392. doi: 10.1073/pnas.81.20.6388. [DOI] [PMC free article] [PubMed] [Google Scholar]
- Begenisich T, Stevens CF. How many conductance states do potassium channels have? Biophysical Journal. 1975;15:843–856. doi: 10.1016/S0006-3495(75)85858-9. [DOI] [PMC free article] [PubMed] [Google Scholar]
- Boland LM, Morrill JA, Bean BP. ω-Conotoxin block of N-type calcium channels in frog and rat sympathetic neurones. Journal of Neuroscience. 1994;14:5011–5027. doi: 10.1523/JNEUROSCI.14-08-05011.1994. [DOI] [PMC free article] [PubMed] [Google Scholar]
- Chabbert CH. Heterogeneity of hair cells in the bullfrog sacculus. Pflügers Archiv. 1997;435:82–90. doi: 10.1007/s004240050486. [DOI] [PubMed] [Google Scholar]
- Colquhoun D, Sigworth FJ. Fitting and statistical analysis of single-channel records. In: Sakmann B, Neher E, editors. Single-Channel Recording. New York: Plenum Press; 1985. pp. 191–263. [Google Scholar]
- Crawford AC, Fettiplace R. An electrical tuning mechanism in turtle cochlear hair cells. Journal of Physiology. 1981;312:377–412. doi: 10.1113/jphysiol.1981.sp013634. [DOI] [PMC free article] [PubMed] [Google Scholar]
- Denk W, Holt JR, Shepherd GMG, Corey DP. Calcium imaging of single stereocilia in hair cells: localization of transduction channels at both ends of tip links. Neuron. 1995;15:1311–1321. doi: 10.1016/0896-6273(95)90010-1. [DOI] [PubMed] [Google Scholar]
- Elmslie KS. Identification of the single channels that underlie the N-type and L-type calcium currents in bullfrog sympathetic neurons. Journal of Neuroscience. 1997;17:2658–2668. doi: 10.1523/JNEUROSCI.17-08-02658.1997. [DOI] [PMC free article] [PubMed] [Google Scholar]
- Elmslie KS, Kammermeier PJ, Jones SW. Reevaluation of Ca2+ channel types and their modulation in bullfrog sympathetic neurons. Neuron. 1994;13:217–228. doi: 10.1016/0896-6273(94)90471-5. [DOI] [PubMed] [Google Scholar]
- Fox AP, Nowycky MC, Tsien RW. Kinetic and pharmacological properties distinguishing three types of calcium currents in chick sensory neurons. Journal of Physiology. 1987;394:149–172. doi: 10.1113/jphysiol.1987.sp016864. [DOI] [PMC free article] [PubMed] [Google Scholar]
- Fuchs PA. Ionic currents in cochlear hair cells. Progress in Neurobiology. 1992;39:493–505. doi: 10.1016/0301-0082(92)90003-w. [DOI] [PubMed] [Google Scholar]
- Fuchs PA. Synaptic transmission at vertebrate hair cells. Current Opinion in Neurobiology. 1996;6:514–519. doi: 10.1016/s0959-4388(96)80058-4. [DOI] [PubMed] [Google Scholar]
- Fuchs PA, Evans MG. Voltage oscillations and ionic conductances in hair cells isolated from the alligator cochlea. Journal of Comparative Physiology. 1988;164:151–163. doi: 10.1007/BF00603947. [DOI] [PubMed] [Google Scholar]
- Fuchs PA, Evans MG, Murrow BW. Calcium currents in hair cells isolated from the cochlea of the chick. Journal of Physiology. 1990;429:553–568. doi: 10.1113/jphysiol.1990.sp018272. [DOI] [PMC free article] [PubMed] [Google Scholar]
- Fuchs PA, Nagai T, Evans MG. Electrical tuning in hair cells isolated from the chick cochlea. Journal of Neuroscience. 1988;12:800–809. doi: 10.1523/JNEUROSCI.08-07-02460.1988. [DOI] [PMC free article] [PubMed] [Google Scholar]
- Glowatzki E. Analysis of gene expression in the organ of Corti revealed by single-cell RT-PCR. Audiology and Neurotology. 1997;2:71–78. doi: 10.1159/000259231. [DOI] [PubMed] [Google Scholar]
- Green GE, Khan KM, Beisel DW, Drescher MJ, Hartfield JS, Drescher DJ. Calcium channel subunits in mouse cochlea. Journal of Neurochemistry. 1996;67:37–45. doi: 10.1046/j.1471-4159.1996.67010037.x. [DOI] [PubMed] [Google Scholar]
- Hagiwara S, Takahashi K. Surface density of calcium ion and calcium spikes in the barnacle muscle fiber membrane. Journal of General Physiology. 1967;50:583–601. doi: 10.1085/jgp.50.3.583. [DOI] [PMC free article] [PubMed] [Google Scholar]
- Hamill OP, Marty A, Neher E, Sakmann B, Sigworth FJ. Improved patch-clamp techniques for high-resolution current recording from cells and cell-free membrane patches. Pflügers Archiv. 1981;391:85–100. doi: 10.1007/BF00656997. [DOI] [PubMed] [Google Scholar]
- Haydon PG, Henderson E, Stanley EF. Localization of individual calcium channels at the release face of a presynaptic nerve terminal. Neuron. 1994;13:1275–1280. doi: 10.1016/0896-6273(94)90414-6. [DOI] [PubMed] [Google Scholar]
- Hess P, Lansman JB, Tsien RW. Different modes of Ca2+ channel gating behaviour favoured by dihydropyridine Ca2+ agonists and antagonists. Nature. 1984;311:538–544. doi: 10.1038/311538a0. [DOI] [PubMed] [Google Scholar]
- Hille B. Ionic Channels of Excitable Membranes. 2. Sunderland, MA, USA: Sinauer Associates, Inc; 1992. [Google Scholar]
- Holt JR, Eatock RA. Inwardly rectifying currents of saccular hair cells from the leopard frog. Journal of Neurophysiology. 1995;73:1484–1502. doi: 10.1152/jn.1995.73.4.1484. [DOI] [PubMed] [Google Scholar]
- Hudspeth AJ. How the ear's works work. Nature. 1989;341:397–404. doi: 10.1038/341397a0. [DOI] [PubMed] [Google Scholar]
- Hudspeth AJ, Corey DP. Sensitivity, polarity and conductance change in the response of vertebrate hair cells to controlled mechanical stimuli. Proceedings of the National Academy of Sciences of the USA. 1977;76:1506–1509. doi: 10.1073/pnas.74.6.2407. [DOI] [PMC free article] [PubMed] [Google Scholar]
- Hudspeth AJ, Lewis RS. Kinetic analysis of voltage- and ion-dependent conductances in saccular hair cells of the bullfrog, Rana catesbeiana. Journal of Physiology. 1988a;400:237–274. doi: 10.1113/jphysiol.1988.sp017119. [DOI] [PMC free article] [PubMed] [Google Scholar]
- Hudspeth AJ, Lewis RS. A model for electrical resonance and frequency tuning in saccular hair cells of the bullfrog, Rana catesbeiana. Journal of Physiology. 1988b;400:275–297. doi: 10.1113/jphysiol.1988.sp017120. [DOI] [PMC free article] [PubMed] [Google Scholar]
- Issa N, Hudspeth AJ. Clustering of Ca2+ channels and Ca2+-activated K+ channels at fluorescently labeled presynaptic active zones of hair cells. Proceedings of the National Academy of Sciences of the USA. 1994;91:7578–7582. doi: 10.1073/pnas.91.16.7578. [DOI] [PMC free article] [PubMed] [Google Scholar]
- Imredy JP, Yue DP. Mechanisms of Ca2+-sensitive inactivation of L-type Ca channels. Neuron. 1994;12:1301–1318. doi: 10.1016/0896-6273(94)90446-4. [DOI] [PubMed] [Google Scholar]
- Kollmar R, Fak J, Montgomery LG, Hudspeth AJ. Predominance of the α1D subunit in L-type voltage-gated Ca2+ channels of hair cells in the chicken's cochlea. Proceedings of the National Academy of Sciences of the USA. 1997a;94:14883–14888. doi: 10.1073/pnas.94.26.14883. [DOI] [PMC free article] [PubMed] [Google Scholar]
- Kollmar R, Fak J, Montgomery LG, Hudspeth AJ. Hair cell-specific splicing of mRNA for the a1D subunit of voltage-gated Ca2+ channels in the chicken's cochlea. Proceedings of the National Academy of Sciences of the USA. 1997b;94:14889–14893. doi: 10.1073/pnas.94.26.14889. [DOI] [PMC free article] [PubMed] [Google Scholar]
- Korn SJ, Marty A, Connor JA, Horn R. Perforated patch recording. Methods in Neuroscience. 1991;4:264–373. [Google Scholar]
- Lacerda AE, Kim HS, Ruth P, Perez-Reyes E, Flockerzi V, Hofmann F, Birnbaumer L, Brown AM. Normalization of current kinetics by interaction between the α1 and β subunits of the skeletal muscle dihydropyridine-sensitive Ca2+ channel. Nature. 1991;252:527–530. doi: 10.1038/352527a0. [DOI] [PubMed] [Google Scholar]
- Lang D, Correia M. Studies of solitary semicircular canal hair cells in the adult pigeon. II. Voltage-dependent ionic conductances. Journal of Neurophysiology. 1989;62:935–945. doi: 10.1152/jn.1989.62.4.935. [DOI] [PubMed] [Google Scholar]
- Lee HK, Elmslie KS. Gating of single N-type calcium channels recorded from bullfrog sympathetic neurons. Journal of General Physiology. 1999;113:111–124. doi: 10.1085/jgp.113.1.111. [DOI] [PMC free article] [PubMed] [Google Scholar]
- Lewis ER, Baird RA, Leverenz EL, Koyama H. Inner ear: dye injection reveals peripheral origins of specific sensitivities. Science. 1982;215:1641–1643. doi: 10.1126/science.6978525. [DOI] [PubMed] [Google Scholar]
- Lewis RS, Hudspeth AJ. Voltage- and ion-dependent conductances in solitary vertebrate hair cells. Nature. 1983;304:538–541. doi: 10.1038/304538a0. [DOI] [PubMed] [Google Scholar]
- Lopez I, Ishiyama G, Ishiyama A, Jen JC, Liu F, Baloh RW. Differential subcellular immunolocalization of voltage-gated calcium channel α1 subunits in the chinchilla cristae ampullaris. Neuroscience. 1999;92:773–782. doi: 10.1016/s0306-4522(99)00005-6. [DOI] [PubMed] [Google Scholar]
- Lumpkin E, Hudspeth AJ. Detection of Ca2+ entry through mechanosensitive channels localizes the site of mechanoelectrical transduction in hair cells. Proceedings of the National Academy of Sciences of the USA. 1995;92:10297–10301. doi: 10.1073/pnas.92.22.10297. [DOI] [PMC free article] [PubMed] [Google Scholar]
- McClesky EW, Fox AP, Feldman DH, Cruz IJ, Olivera BM, Tsien RW. ω-Conotoxin: direct and persistent blockage of specific types of calcium channels in neurons but not muscle. Proceedings of the National Academy of Sciences of the USA. 1987;84:4327–4331. doi: 10.1073/pnas.84.12.4327. [DOI] [PMC free article] [PubMed] [Google Scholar]
- Martinez-Dunst C, Michaels RL, Fuchs PA. Release sites and calcium channels in hair cells of the chick's cochlea. Journal of Neuroscience. 1997;17:9133–9144. doi: 10.1523/JNEUROSCI.17-23-09133.1997. [DOI] [PMC free article] [PubMed] [Google Scholar]
- Martini M, Rossi ML, Rubbini G, Rispoli G. Calcium currents in hair cells from semicircular canals of the frog. Biophysical Journal. 2000;78:1240–1254. doi: 10.1016/S0006-3495(00)76681-1. [DOI] [PMC free article] [PubMed] [Google Scholar]
- Moser T, Beutner D. Kinetics of exocytosis and endocytosis at the cochlear inner hair cell afferent synapse of the mouse. Proceedings of the National Academy of Sciences of the USA. 2000;97:883–888. doi: 10.1073/pnas.97.2.883. [DOI] [PMC free article] [PubMed] [Google Scholar]
- Nowycky MC, Fox AP, Tsien RW. Three types of neuronal calcium channel with different calcium agonist sensitivity. Nature. 1985;316:440–443. doi: 10.1038/316440a0. [DOI] [PubMed] [Google Scholar]
- Ohmori H. Studies of ionic currents in the isolated vestibular hair cell of the chick. Journal of Physiology. 1984;350:561–581. doi: 10.1113/jphysiol.1984.sp015218. [DOI] [PMC free article] [PubMed] [Google Scholar]
- Parsons TD, Lenzi D, Almers W, Roberts WM. Calcium-triggered exocytosis and endocytosis in an isolated presynaptic cell: capacitance measurements in saccular hair cells. Neuron. 1994;13:875–883. doi: 10.1016/0896-6273(94)90253-4. [DOI] [PubMed] [Google Scholar]
- Perez-Garcia MT, Kamp TJ, Marban E. Functional properties of cardiac L-type calcium channels transiently express HEK293 cells: Roles of alpha 1 and beta subunits. Journal of General Physiology. 1995;105:289–305. doi: 10.1085/jgp.105.2.289. [DOI] [PMC free article] [PubMed] [Google Scholar]
- Platzer J, Engel J, Schrott-Fischer A, Stephan K, Bova S, Chen H, Zheng H, Striessnig J. Congenital deafness and sinoatrial node dysfunction in mice lacking class D L-type Ca2+ channels. Cell. 2000;102:89–97. doi: 10.1016/s0092-8674(00)00013-1. [DOI] [PubMed] [Google Scholar]
- Ramanathan K, Michael TH, Jiang G-J, Hiel H, Fuchs PA. A molecular mechanism for electrical tuning of cochlear hair cells. Science. 1999;283:215–217. doi: 10.1126/science.283.5399.215. [DOI] [PubMed] [Google Scholar]
- Ricci AJ, Fettiplace R. The effects of calcium buffering and cyclic AMP on mechanoelectrical transduction in turtle auditory hair cells. Journal of Physiology. 1997;501:111–124. doi: 10.1111/j.1469-7793.1997.111bo.x. [DOI] [PMC free article] [PubMed] [Google Scholar]
- Roberts MW, Jacobs AR, Hudspeth AJ. Colocalization of ion channels involved in frequency selectivity and synaptic transmission at presynaptic active zones of hair cells. Journal of Neuroscience. 1990;10:3664–3684. doi: 10.1523/JNEUROSCI.10-11-03664.1990. [DOI] [PMC free article] [PubMed] [Google Scholar]
- Rodriguez-Contreras A, Yamoah EN. Permeation properties of voltage-gated calcium channels in bullfrog saccular hair cells. Society for Neuroscience Abstracts. 1999;25:1668. [Google Scholar]
- Sakmann B, Neher B. Single-Channel Recording. New York: Plenum Press; 1985. pp. 37–51. chap. 2. [Google Scholar]
- Sigworth FJ. The conductance of sodium channels under conditions of reduced current at the node of Ranvier. Journal of Physiology. 1980;307:131–142. doi: 10.1113/jphysiol.1980.sp013427. [DOI] [PMC free article] [PubMed] [Google Scholar]
- Sigworth FJ, Sine FM. Data transformations for improved display and fitting of single-channel dwell time histograms. Biophysical Journal. 1987;52:1047–1054. doi: 10.1016/S0006-3495(87)83298-8. [DOI] [PMC free article] [PubMed] [Google Scholar]
- Shistik E, Ivanina T, Puri T, Hosey M, Dascal N. Journal of Physiology. Vol. 489. 1995. Ca2+ current enhancement by α2/δ and β subunits in Xenopus oocytes: contribution of changes in channel gating and α1 protein level; pp. 55–62. [DOI] [PMC free article] [PubMed] [Google Scholar]
- Singer D, Biel M, Lotan I, Flockerzi V, Hofmann F, Dascal N. The roles of the subunits in the function of the calcium channel. Science. 1991;253:1553–1557. doi: 10.1126/science.1716787. [DOI] [PubMed] [Google Scholar]
- Smotherman MS, Peter MN. The electrical properties of auditory hair cells in the frog amphibian papilla. Journal of Neuroscience. 1999;19:5275–5292. doi: 10.1523/JNEUROSCI.19-13-05275.1999. [DOI] [PMC free article] [PubMed] [Google Scholar]
- Stanley EF. Single calcium channels on a cholinergic presynaptic nerve terminal. Neuron. 1991;7:585–591. doi: 10.1016/0896-6273(91)90371-6. [DOI] [PubMed] [Google Scholar]
- Stanley EF. Single calcium channels and acetylcholine release at a presynaptic nerve terminal. Neuron. 1993;11:1007–1011. doi: 10.1016/0896-6273(93)90214-c. [DOI] [PubMed] [Google Scholar]
- Stanley EF, Goping G. Characterization of a calcium current in a vertebrate cholinergic presynaptic nerve terminal. Journal of Neuroscience. 1991;11:985–993. doi: 10.1523/JNEUROSCI.11-04-00985.1991. [DOI] [PMC free article] [PubMed] [Google Scholar]
- Su Z-L, Jiang SC, Gu R, Yang WP. Two types of calcium channels in bullfrog saccular hair cells. Hearing Research. 1995;87:62–68. doi: 10.1016/0378-5955(95)00079-j. [DOI] [PubMed] [Google Scholar]
- Sunderland WJ, Son Y-J, Miner JH, Sanes JR, Carlson SS. The presynaptic calcium channel is part of a transmembrane complex linking a synaptic laminin (α4β2γ1) with non-erythroid spectrin. Journal of Neuroscience. 2000;20:1009–1019. doi: 10.1523/JNEUROSCI.20-03-01009.2000. [DOI] [PMC free article] [PubMed] [Google Scholar]
- Taylor WR. Two-suction-electrode voltage-clamp analysis of the sustained calcium current in cat sensory neurones. Journal of Physiology. 1988;404:405–432. doi: 10.1113/jphysiol.1988.sp017423. [DOI] [PMC free article] [PubMed] [Google Scholar]
- Tsien RW, Lipscombe DD, Madison V, Bley KR, Fox AR. Multiple types of neuronal calcium channels and their selective modulation. Trends in Neurosciences. 1988;11:431–438. doi: 10.1016/0166-2236(88)90194-4. [DOI] [PubMed] [Google Scholar]
- Tucker T, Fettiplace R. Confocal imaging of calcium microdomains and calcium extrusion in turtle hair cells. Neuron. 1995;15:1323–1335. doi: 10.1016/0896-6273(95)90011-x. [DOI] [PubMed] [Google Scholar]
- Wiser O, Tobi D, Trus T, Atlas D. Synaptotagmin restores kinetic properties of a syntaxin-associated N-type voltage sensitive calcium channel. FEBS Letters. 1997;404:203–207. doi: 10.1016/s0014-5793(97)00130-0. [DOI] [PubMed] [Google Scholar]
- Wu Y-C, Fettiplace R. A developmental model for generating frequency maps in the reptilian and avian cochleas. Biophysical Journal. 1996;70:2557–2570. doi: 10.1016/S0006-3495(96)79827-2. [DOI] [PMC free article] [PubMed] [Google Scholar]
- Yamoah EN, Gillespie PG. Phosphate analogs block adaptation in hair cells by inhibiting adaptation-motor force production. Neuron. 1996;17:523–533. doi: 10.1016/s0896-6273(00)80184-1. [DOI] [PubMed] [Google Scholar]
- Yamoah EN, Kuzirian AM, Sanchez-Andres JV. Journal of Neurophysiology. Vol. 72. 1994. Calcium current and inactivation in identified neurons in Hermissenda crassicornis; pp. 2196–2208. [DOI] [PubMed] [Google Scholar]
- Yamoah EN, Lumpkin EA, Dumont RA, Smith PJS, Hudspeth AJ, Gillespie PG. Plasma membrane Ca2+-ATPase extrudes Ca2+ from hair cell stereocilia. Journal of Neuroscience. 1998;18:610–624. doi: 10.1523/JNEUROSCI.18-02-00610.1998. [DOI] [PMC free article] [PubMed] [Google Scholar]
- Zamponi GW, Snutch TP. Evidence for a specific site for modulation of calcium channel activation by external calcium ions. Pfügers Archiv. 1996;431:470–472. doi: 10.1007/BF02207290. [DOI] [PubMed] [Google Scholar]
- Zei PC, Aldrich RW. Voltage-dependent gating of single wild-type and S4 mutant KAT1 inward rectifier potassium channels. Journal of General Physiology. 1998;112:679–713. doi: 10.1085/jgp.112.6.679. [DOI] [PMC free article] [PubMed] [Google Scholar]
- Zidanic M, Fuchs PA. Kinetic analysis of barium currents in chick cochlear hair cells. Biophysical Journal. 1995;68:1323–1336. doi: 10.1016/S0006-3495(95)80305-X. [DOI] [PMC free article] [PubMed] [Google Scholar]