

Abstract
Natural evolution has produced efficient enzymes of enormous structural diversity. We imitated this natural process in the laboratory to augment the efficiency of an engineered chorismate mutase with low activity and an unusual hexameric topology. By applying two rounds of DNA shuffling and genetic selection, we obtained a 400-fold more efficient enzyme, containing three non-active-site mutations. Detailed biophysical characterization of the evolved variant suggests that it exists predominantly as a trimer in solution, but is otherwise similarly stable as the parent hexamer. The dramatic structural and functional effects achieved by a small number of seemingly innocuous substitutions highlights the utility of directed evolution for modifying protein–protein interactions to produce novel quaternary states with optimized activities.
Keywords: chorismate mutase, directed evolution, genetic selection, DNA shuffling, quaternary structure
A large fraction of proteins in living cells exist as symmetric assemblies of multiple subunits (Goodsell and Olson 2000). Oligomerization provides advantageous properties often not available to the monomer, such as increased stability, new intersubunit binding sites, cooperativity, and allosteric regulation. To understand the chemical and genetic basis for the evolutionary transition between monomers and oligomers, several studies have focused on altering the quaternary structure of existing proteins by either reducing or increasing the number of their subunits (Mossing and Sauer 1990; Green et al. 1995; Dickason and Huston 1996; MacBeath et al. 1998b,c).
In nature, infrequent but beneficial mutations are identified and propagated by genetic selection. This tool can also be exploited effectively in the laboratory to obtain novel protein oligomers starting from a diverse population of variants (Taylor et al. 2001a; Woycechowsky and Hilvert 2004). It is especially valuable in the case of enzymes, where structural changes are often poorly tolerated, and mutations that alter quaternary structure without causing a significant loss in catalytic activity are relatively rare.
We have successfully used genetic selection to alter the topology of homodimeric AroQ chorismate mutases (CMs)—domain-swapped enzymes that catalyze a key step in the biosynthesis of the aromatic amino acids tyrosine and phenylalanine. For example, by inserting a random hinge-loop of eight residues into the H1 helix of the thermostable mutase from Methanococcus jannaschii (MjCM) and selecting for functional variants by genetic complementation, we obtained a monomeric catalyst with near native activity (MacBeath et al. 1998c). The topologically redesigned monomer unexpectedly exhibits the properties of a molten globule (Vamvaca et al. 2004), but structural ordering seen upon ligand binding indicates that protein folding and catalysis can be efficiently coupled.
In related studies with a less stable mutase from Escherichia coli (EcCM), it was found that the sequence and length of the inserted loop profoundly influence enzyme quaternary structure (MacBeath et al. 1998b). Whereas hinge-loops containing four or seven amino acids afforded monomeric enzymes with marginal stability but near wild-type activity, no active clones were found with six residue segments. Insertion of five residues is also poorly tolerated by the AroQ scaffold, but two weakly active yet comparatively stable variants were isolated by the complementation assay. Characterization of the enzyme containing the insert Cys-Phe-Pro- Trp-Asp plus one spontaneous mutation (Ala16Glu) showed that it does not adopt a monomeric topology. Instead, it assembles as a hexamer. Oligomerization apparently stabilizes the protein against nonspecific aggregation and precipitation, but it also introduces structural perturbations that render it more than two orders of magnitude less active than wild-type EcCM.
Because of its unusual topology and low activity, we chose the hexamer, which we call hEcCM, as a starting point for directed evolution experiments. We have subjected it to two rounds of random mutagenesis and selection and report here the biophysical characterization of a highly active variant. Comparison of the evolved catalyst with the parent hexamer and with the original wild-type dimer sheds light on the evolution of protein–protein interfaces and their influence on biological function.
Results
Library construction and genetic selection
Mutations were introduced into the gene encoding hEcCM by DNA shuffling (Stemmer 1994). The gene was initially amplified from plasmid pET-L5-1-pATCH (MacBeath et al. 1998b) by PCR and then cleaved with DNase I to give a pool of overlapping DNA fragments of different sizes. These random fragments were purified and reassembled into full-length genes in a self-priming PCR-like reaction, and subsequently amplified by conventional PCR.
The gene pool obtained by DNA shuffling was subcloned into acceptor vector pKECMB-S2 (MacBeath et al. 1998b) and introduced directly into CM-deficient KA12/pKIMP-UAUC E. coli cells (Kast et al. 1996) for genetic selection. These cells are unable to grow on media lacking tyrosine and phenylalanine but regain prototrophy when supplied with a plasmid encoding an active CM. The resulting library (1.6×10⁷ members) was plated on either M9c plates (selective conditions) or on M9c plates supplemented with tyrosine and phenylalanine (nonselective conditions). The plates were incubated at 30°C and colonies counted after 3 d of growth (nonselective conditions) or after 7 and 10 d (selective conditions). Only a small fraction of the entire library (<0.1%) was able to complement the CM deficiency, and the size of the colonies varied significantly. The majority of the complementing clones grew at levels comparable to bacterial cells harboring the parent hEcCM.
Out of the ~16,000 library clones that complemented the CM deficiency, a subset of 77 clones displaying different growth phenotypes was isolated and sequenced (Table 1). The corresponding genes (303 bp) generally had zero to two nucleotide changes, corresponding to a mutation rate of 0.2% over the entire sequence. All observed mutations were transitions resulting from single nucleotide changes and were distributed over the entire gene. Some clones with mutations in the promoter region showed elevated growth rates due to creation of a new ribosomal binding site upstream of the start codon. More than 40% of the sequences with mutations in the coding region contained the nonconservative Thr87Ile substitution in the C-terminal helix. Like Thr87, the side chains of the other three most frequently observed mutations—Thr61Met, Arg44Cys, and His66Arg—also occupy solvent exposed positions on the surface of EcCM (Lee et al. 1995).
Table 1.
Sequence analysis of the first shuffling round
| Observed mutation | Amino acid substitution | Location in wild-type EcCM | Frequencya (%) |
| G103A | Glu30Lys | Helix 1–C | 5 |
| A123G | Silent (Gly) | Helix 1–C | 5 |
| C140T | Ser42Leu | Loop 1 | 5 |
| C145T | Arg44Cys | Loop 1 | 9 |
| G150A | Silent (Pro) | Loop 1 | 5 |
| C197T | Thr61Met | Helix 2 | 23 |
| A212G | His66Arg | Loop 2 | 9 |
| C275T | Thr87Ile | Helix 3 | 41 |
a Frequency of mutations in the coding region.
The DNA pool of all active CM variants from the first selection was subjected to reshuffling. Complementing clones from the second round library (2×10⁷ members) were found with a similar frequency and colony-size distribution as in the first round, but most grew significantly faster than cells containing the parent hEcCM gene. Of the 36 clones selected for analysis, 24 grew at wild-type (EcCM) levels. The mutation frequency in the second round of shuffling was comparable to the first round, and again all mutational changes were transitions, distributed over the entire sequence (Table 2). Several clones contained a double mutation in the codon for residue 15, converting the native Ser to Asp. Many first-round mutations were also observed in the second round, but all occurred in combination with additional mutations. Prominent examples include Thr87Ile and Ser42Leu, which were observed in >70% and>50% of the unique second-round sequences, respectively. In contrast to the first round of shuffling where no neutral mutations were found, several silent mutations were observed in second round clones (Table 2). In some cases, these mutations appear to optimize codon usage. For example, the T195C mutation converts the Ile-encoding AUU codon to AUC, which occurs five times more frequently in highly expressed E. coli genes (Sharp et al. 1988). Notably, one-third of the analyzed variants contain mutations only in the promoter region. In this case, the cells appear to respond to the selection pressure by increasing the intracellular concentration of the enzyme rather than its catalytic efficiency.
Table 2.
Sequence analysis of the second shuffling round
| Observed mutation | Amino acid substitution | Location in wild-type EcCMa | Frequencyb (%) |
| C8T | Ser3Leu | Unstructured | 9 |
| G10A | Glu4Lys | Unstructured | 9 |
| G34A | Glu13Lys | Helix 1–N | 9 |
| A43G, G44A | Ser15Asp | Helix 1–N | 36 |
| G44A | Ser15Asn | Helix 1–N | 9 |
| A93G | Silent (Ala) | Helix 1–C | 36 |
| G103A | Glu30Lys | Helix 1–C | 9 |
| G135A | Silent (Leu) | Helix 1–C | 9 |
| C140T | Ser42Leu | Loop 1 | 55 |
| G146T | Arg44Leu | Loop 1 | 18 |
| G150A | Silent (Pro) | Loop 1 | 27 |
| T164C | Silent (Asp) | Helix 2 | 9 |
| T195C | Silent (Ile) | Helix 2 | 9 |
| A212G | His66Arg | Loop 2 | 18 |
| C225T | Silent (Ala) | Helix 3 | 9 |
| C250T | Leu79Phe | Helix 3 | 9 |
| C255T | Silent (Ile) | Helix 3 | 9 |
| C275T | Thr87Ile | Helix 3 | 73 |
aSee Figure 7 ▶. Residues 1–4, which were not resolved in the X-ray crystal structure of EcCM (Lee et al. 1995), are not depicted.
bMutation frequency is given as a percentage of unique variants carrying each mutation.
Protein production and purification
To assess how the acquired mutations affect catalytic activity, representative clones from both shuffling rounds were overproduced. Wild-type EcCM and the parental hEcCM were prepared for comparison. The genes of the variants were subcloned into pET-22b-pATCH, a derivative of pET-22b (Novagen) that prevents translational read-through at the TGA stop codon and attaches a C-terminal (His)6-tag to the protein (MacBeath and Kast 1998). The resulting constructs were transformed into the CM-deficient E. coli strain KA13 (MacBeath and Kast 1998), and gene expression from the T7 promoter was induced with isopropyl-1- thio-β-D-galactopyranoside (IPTG). Yields of the individual (His)6-tagged proteins, which were isolated by affinity chromatography, varied significantly, possibly reflecting differences in stability. Selected catalysts were subsequently purified by preparative size-exclusion chromatography for detailed biophysical characterization. Due to to the low aromatic amino acid content of the mutases, protein concentrations were determined by the Bradford assay with bovine serum albumin (BSA) as the calibration standard, rather than by UV absorption. The purity of the protein samples was >98% as judged by SDS-polyacrylamide gel electrophoresis (PAGE) and Coomassie blue staining. The identity of each protein was confirmed by electrospray ionization mass spectrometry (ESI-MS).
Kinetic characterization
The specific activity of purified variants was determined by monitoring the disappearance of chorismate spectroscopically. Mutants from the first evolutionary cycle were generally less active than the starting hexamer, while most second round mutants exhibited somewhat improved activity (Table 3). The mutant displaying the highest enzymatic activity (R2–6) contains the most frequently observed first round mutation (Thr87Ile) plus substitutions at positions 15 (Ser15Asp) and 79 (Leu79Phe). Although all variants with increased activity have the Ser15Asp and Thr87Ile mutations in common, the Ser15- Asp/Thr87Ile double mutant (R2–16) itself is only 1.5 times more active than hEcCM (Table 3). These two substitutions may enhance production or stability of the enzyme, but additional changes are apparently necessary to achieve significant catalytic improvement. The enhanced activity of some triple mutants compared to single mutants demonstrates the favorable synergistic effect of multiple substitutions. The steady-state parameters of the most active variant (R2–6, referred to below as tEcCM) are summarized in Table 4 together with analogous data for hEcCM and wild-type EcCM. They show a 400-fold increase in kcat/Km for R2–6 relative to hEcCM.
Table 3.
Relative activity of evolved CM variants
| Varianta | Mutation(s) | Relative activityb |
| R1–2 | R44C, H66R | 0.5 |
| R1–17 | T61M | 0.5 |
| R1–35 | T87I | 1.3 |
| R1–39 | E29K | 0.6 |
| R1–78 | S42L | 0.8 |
| R2–6 | S15D, L79F, T87I | 10 |
| R2–7 | S15N, S42L, T87I | 3 |
| R2–9 | S42L, T87I | 0.3 |
| R2–12 | E4K, S15D, T87I | 3 |
| R2–14 | S42L, R44L, H66R | 1.2 |
| R2–26 | S47L, R44L, T87I | 1.4 |
| R2–16 | S15D, T87I | 1.5 |
| R2–30 | E35K, S42L, T87I | 0.5 |
| R2–32 | S3L, T87I | 0.7 |
aR1 and R2 stand for “round 1” and “round 2” variants. Kinetics were performed at 20°C in PBS (pH 7.5) using 400 nM enzyme and 100 μM chorismate. bThe activity of the parent hEcCM was set to 1.
Table 4.
Catalytic parameters for EcCM, hEcCM, and tEcCM
| Enzyme | kcat (sec−1) | Km (μM) | kcat /Km(M−1 sec−1) |
| EcCMa | 14 | 350 | 41,000 |
| hEcCMa | 0.15 | 2100 | 70 |
| tEcCM | 1.0 | 34 | 30,000 |
Catalytic parameters were determined at 20°C in PBS at pH 6.5. a For comparison, at pH 7.5, 20°C EcCM gave kcat=16 sec−1 and Km=290 μM, while hEcCM afforded kcat=0.16 sec−1 and Km=600 μM (MacBeath et al. 1998b).
Quaternary structure investigation
Analytical ultracentrifugation (AU) data for EcCM and hEcCM were previously shown to fit well to a single ideal species model with average molecular masses corresponding to a dimer and a hexamer, respectively (MacBeath et al. 1998b). In contrast, the sedimentation equilibrium data for the R2–6 variant fit better to a trimer–hexamer equilibrium model, with an average molecular mass of 38,700 g/mol for the trimer (calculated Mw=38,004 g/mol) and a Kd value of ~100 μM (Fig. 1A ▶).
Figure 1.

Investigation of CM quaternary structure by analytical ultracentrifugation and size exclusion chromatography. (A) Representative sedimentation equilibrium data for tEcCM (▴) were obtained with a 90 μM sample at 14,000 rpm (lower curve) and 16,000 rpm (upper curve). The gray lines correspond to the least-squares fit to a monomer–dimer equilibrium model system (fitted Mw=38,700 g/mol, Kd~100 μM); the corresponding residuals are shown at the top. (B) The quaternary structure of each enzyme was estimated by size exclusion chromatography using a calibration curve. The logarithm of the molecular weight (MW) of the standard proteins (○) and of the CMs—assuming a dimeric structure for EcCM (•), a hexameric structure for hEcCM (▪), and a trimeric structure for tEcCM (▴)—was plotted against their elution parameter Kav.
The oligomeric state of the R2–6 variant was also investigated by analytical size-exclusion chromatography (Fig. 1B ▶). Its apparent molecular weight was found to be 2.9 times the mass of the corresponding polypeptide (Mw=36,600 g/mol) in accord with the analytic ultracentrifugation data. Wild-type EcCM elutes as an elongated dimer from the same column (Mw=29,300 g/mol; calculated Mw=23,776 g/mol), as previously described (MacBeath et al. 1998d), whereas the molecular mass calculated for hEcCM based on its elution volume is lower than expected for a hexamer (Mw=62,400 g/mol; calculated Mw=75,564 g/mol), indicating a high packing density.
Together, these results show that the evolved variant is considerably smaller than the parent hexamer and predominantly trimeric at the concentrations used for the kinetic assays and other biophysical experiments. We consequently refer to it as tEcCM.
1H NMR spectroscopy
The 1H NMR spectrum of tEcCM displays less peak dispersion than wild-type EcCM but more than the hEcCM hexamer (Fig. 2 ▶). The data for EcCM are consistent with a well-defined tertiary structure, whereas the peak broadening observed in the 1H NMR spectra of the tEcCM trimer and hEcCM hexamer can be explained by the decreased tumbling rate of the larger complexes. The greater dispersion seen for tEcCM compared to hEcCM provides additional evidence for its lower oligomerization state, even at relatively high protein concentrations (200 μM).
Figure 2.

1H-NMR spectra of EcCM (A), hEcCM (B), and tEcCM (C). Spectra were obtained at 20°C with 200 μM protein in PBS (pH 6.5).
Circular dichroism spectroscopy
The far-UV circular dichroism (CD) spectrum of wildtype EcCM is typical for a highly α-helical protein, with two negative peaks of roughly equal intensity at 208 nm and 222 nm. In contrast, the spectrum of tEcCM, like that of hEcCM (MacBeath et al. 1998b), has a pronounced negative peak at 208 nm with a less intense shoulder from 215 to 222 nm (data not shown). Apparently, the trimer and hexamer have very similar secondary structures, but differ substantially from the wild-type dimer.
Near-UV CD spectroscopy provides information about the environment of aromatic groups and, hence, protein tertiary structure (Woody and Dunker 1996). Both tEcCM and hEcCM have a tryptophan residue in the engineered loop in addition to the tyrosine at position 72 and the phenylalanine at position 77 shared by all three proteins. tEcCM also has a unique phenylalanine at position 79, but the nearly identical near-UV CD spectra of the trimer and hexamer (Fig. 3A ▶) demonstrate that its contribution to the near-UV CD signature is negligible. The more dramatic differences compared to the wild-type dimer can be attributed to the tryptophan reporter group in the loop segment of the topologically remodeled proteins. The spectra show that this residue is conformationally restricted in both trimer and hexamer, and that its microenvironment is similar in the two complexes. Given its location in a surface loop, the hydrophobic tryptophan residue probably contributes to intersubunit interactions. Insofar as it does, the relevant subunit interface(s) in the trimer and hexamer would appear to be quite similar.
Figure 3.

Circular dichroism (CD) data of EcCM (○), hEcCM (□), and tEcCM (▴). (A) Near-UV CD spectra. Data were measured at 20°C with 200 μM protein in PBS (pH 6.5). Peaks occurring in the range 250–270 nm, 270–290 nm, and 280–300 nm are typically attributable to Phe, Tyr, and Trp residues, respectively (Woody and Dunker 1996). The wild-type EcCM contains one Phe and one Tyr (no Trp residues); hEcCM has two Phe, one Tyr, and one Trp; whereas tEcCM has three Phe, one Tyr, and one Trp. (B) Thermal denaturation curves. The protein samples (16 μM in PBS at pH 6.5) were heated from 20°C to 95°C.
Thermal denaturation experiments
Protein stability was assessed by thermal denaturation monitored by CD spectroscopy. All three CMs undergo cooperative but irreversible unfolding as temperature is increased (Fig. 3B ▶). At pH 6.5, tEcCM and hEcCM have similar transition temperatures (Tm~67°C). This value is lower than the Tm for EcCM (76°C) but higher than that of the monomeric mMjCM complexed with a transition state analog (55°C) (Vamvaca et al. 2004).
Fluorescence spectroscopy
The solvent accessibility of the single tryptophan in the hinge-loop of tEcCM and hEcCM was probed by selectively exciting it at 295 nm and recording fluorescence spectra (Royer 1995). The tryptophan fluorescence emission maximum for tEcCM (335 nm) is red-shifted compared to that of the analogous residue in hEcCM (325 nm) (Fig. 4A ▶), suggesting that this residue is in a more solvent accessible environment in the trimer. Because tryptophan fluorescence intensity for both proteins increases to the same absolute value upon denaturation (data not shown), the higher fluorescence intensity of tEcCM compared to hEcCM (Fig. 4A ▶) is also consistent with this view.
Figure 4.
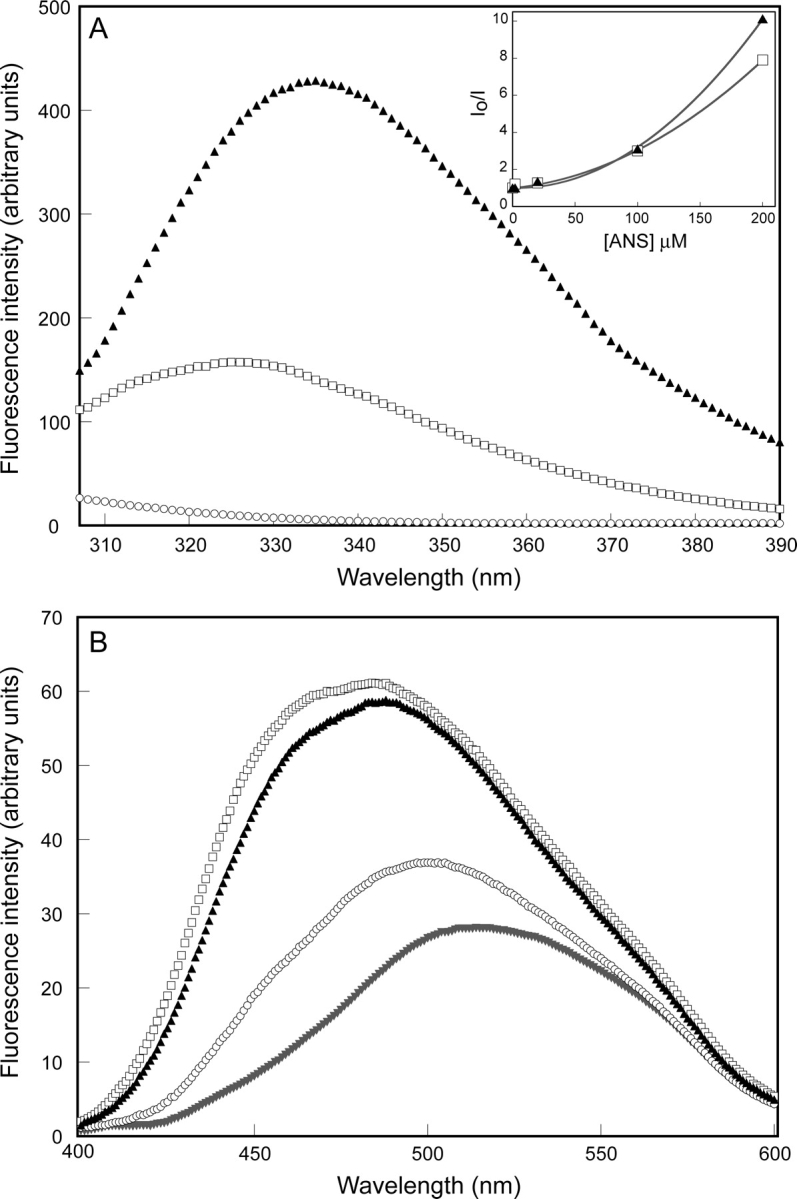
Fluorescence spectra of EcCM (○), hEcCM (□), and tEcCM (▴). (A) Trp fluorescence emission spectra. Data were obtained at 20°C with 2 μM protein in PBS (pH 6.5), using an excitation wavelength of 295 nm. EcCM displays no signal, since it is devoid of Trp residues. (Inset) The Stern-Volmer plots showing quenching of tryptophan fluorescence upon addition of ANS to tEcCM (▴) and hEcCM (□). ANS was added to a 2 μM CM sample to give final concentrations of 2 μM, 20 μM, 100 μM, and 200 μM. (B) Fluorescence emission spectra of the proteins in the presence of ANS and of ANS alone (▾). The final concentration of ANS and protein was 2 μM in PBS (pH 6.5); the excitation wavelength was 370 nm.
1-Anilinonaphthalene-8-sulfonate (ANS) is an environmentally sensitive fluorophore that is often used to probe hydrophobic sites on proteins (Stryer 1968). ANS appears to bind to the trimer and the hexamer, as judged by the significant increase in its fluorescence intensity and a characteristic blue shift (~30 nm) in its emission maximum (Fig. 4B ▶), but does not inhibit their activity. To test if ANS interacts with the engineered loop, tryptophan fluorescence was monitored for both mutants in the presence of ANS (Fig. 4A ▶, inset). The observed quenching of intrinsic protein fluorescence by resonance energy transfer indicates that the donor (Trp) and the acceptor (ANS) are close in space (Sirangelo et al. 2002). Because the Stern-Volmer plot is nonlinear with an upward curvature (Fig. 4A ▶, inset), both dynamic (collisional) and static (formation of an ANS–protein complex) quenching mechanisms are implicated (Lakowicz 1983).
Susceptibility to proteolysis
The influence of quaternary structure on proteolytic stability was assessed with trypsin. The three mutases were incubated with the protease, which specifically cleaves Arg-X or Lys-X peptide bonds, and protein digestion was monitored as a function of time. Aliquots from the reaction mixture were analyzed by SDS-PAGE after quenching the reaction by addition of Mg/SDS buffer and heating. As shown in Figure 5 ▶, the hEcCM hexamer is the most resistant to trypsin degradation, followed by the wild-type EcCM dimer; trimeric tEcCM is the most susceptible to proteolysis.
Figure 5.

Trypsin degradation monitored by SDS-PAGE for EcCM (A), hEcCM (B), and tEcCM (C).
Hydrogen/deuterium exchange
Isotopic exchange is commonly used to measure protein conformational mobility (Englander et al. 1997). Hydrogen/ deuterium (H/D) exchange was initiated by dilution of an aqueous protein solution into D2O. Aliquots were removed periodically after dilution, quenched by decreasing the pD and the temperature, and analyzed by ESI-MS (Smith et al. 1997). The evolved tEcCM appears to be more protected from H/D exchange (~5%) than the wild-type dimer and the parent hexamer (Fig. 6 ▶).
Figure 6.

H/D exchange behavior of EcCM (○), hEcCM (□), and tEcCM (▴), monitored by ESI-MS.
Discussion
We have successfully optimized a weakly active hexameric CM by directed evolution. Three non-active-site mutations (Ser15Asp, Leu79Phe, and Thr87Ile; Fig. 7 ▶) boosted the catalytic efficiency of the enzyme some 400- fold and simultaneously altered its quaternary structure from a hexameric to a trimeric state. The observed increase in the kcat/Km parameter from 70 M−1 sec−1 to 30,000 M−1 sec−1 is brought about by a sevenfold increase in kcat and a 60-fold decrease in Km (Table 4). For comparison, the trimer has an almost identical kcat/ Km value as the naturally occurring EcCM dimer measured under the same conditions (41,000 M−1 sec−1); its kcat and Km parameters are also within an order of magnitude of the wild-type values (Table 4).
Figure 7.
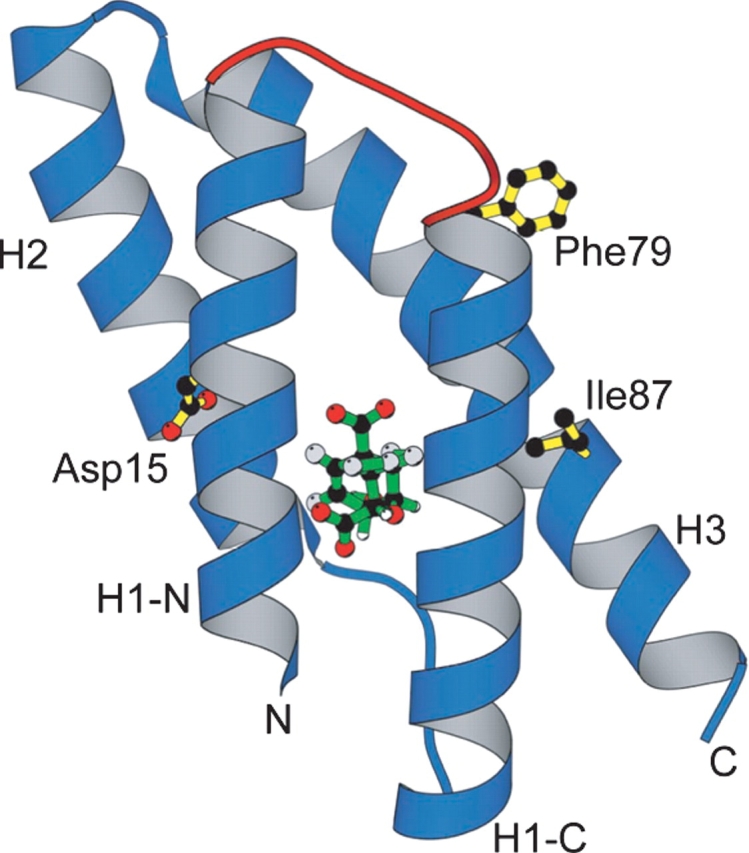
Hypothetical model of one tEcCM subunit complexed with a transition state analog (green) (Bartlett and Johnson 1985). The five-residue hinge-loop insert is shown in red, and the amino acid substitutions identified by directed evolution of hEcCM are shown in yellow. In the original EcCM dimer, residues 15 and 87 are fairly solvent-exposed, whereas residue 79 is buried and contributes stabilizing hydrophobic interactions at the subunit interface (Lee et al. 1995).
The detailed three-dimensional structure of the starting hexameric enzyme hEcCM is not known. Although a domain-swapped oligomer cannot be ruled out, the ease with which monomers are formed with diverse other hinge-loops (MacBeath et al. 1998b,c) suggests that insertion of the Cys-Phe-Pro-Trp-Asp sequence into the EcCM H1 helix could also give rise to monomeric subunits that, in this case, assemble as a stable hexamer. The hydrophobic nature of the insert, in combination with the apolar residues along the H3 helix that were exposed as a consequence of the redesign process (e.g., Tyr72, Leu76, Leu79), would be expected to favor formation of a stabilizing subunit interface. Association of the hinge-loops of separate monomers is supported by the fluorescence quenching data (Fig. 4A ▶, inset), which shows that small molecules like ANS can bind at the resulting apolar site, much like the binding of tryptophan and tyrosine at the intersubunit allosteric pocket of Saccharomyces cerevisiae CM (Sträter et al. 1997). The observation that the hexamer evolves into a more active trimer further suggests that hEcCM itself is probably organized as a dimer of trimers. Stacking of the trimeric units, perhaps as disks (Fig. 8 ▶), would sequester the tryptophan-containing hinge-loop from solvent, explaining the change in fluorescence intensities and the shift in emission maxima that accompany the change in quaternary state (Fig. 4A ▶). The large increase in accessible protein surface area associated with the hexamer-to-trimer transition could likewise account for the greater susceptibility of the latter to proteolysis (Fig. 5 ▶).
Figure 8.

Possible structural organization of the hinge-loop variants. (A) Monomeric subunit (cf. Fig. 7 ▶); (B) dimeric wild-type EcCM; (C) trimeric tEcCM; (D) hexameric hEcCM. The inserted hinge-loop is shown in green.
Isolated AroQ monomers are relatively unstable because the highly polar active site is located within the core of the four-helix-bundle domain (Lee et al. 1995). In the case of the L4 and L7 EcCM variants, this instability is manifest as nonspecific aggregation and precipitation (MacBeath et al. 1998b). Substitution of two exposed hydrophobic residues with charged amino acids minimized aggregation in mMjCM, a monomeric mutase derived from a thermostable EcCM homolog (MacBeath et al. 1998c), but the protein nevertheless exists as a molten globule in the absence of ligands (Vamvaca et al. 2004). In contrast, the individual subunits of hEcCM and tEcCM appear to adopt native-like folds as judged by a range of biophysical criteria, including cooperative thermal denaturation and wild-type-like H/D exchange. Moreover, both assemblies are well behaved in solution and substantially more stable (Tm~67°C) than mMjCM complexed with a high affinity inhibitor (Tm=55°C). Although hEcCM and tEcCM are not quite as stable as the domain-swapped wild-type EcCM homodimer (Tm=76°C), oligomerization appears to confer considerable robustness to the system.
How do the selected amino acid substitutions in hEcCM produce the observed changes in structure and function? Because the stabilities of hEcCM and tEcCM are similar, the loss of stabilizing intersubunit interactions that accompanies conversion of the hexamer to the trimer must be offset either by improving intrasubunit interactions or by strengthening the remaining intersubunit interactions in the trimer. The data support a role for both mechanisms. When mapped onto a model of the hypothetical monomer (Fig. 7 ▶), all three mutations are found near the surface of the protein. Two of the changes, Ser15Asp and Thr87Ile, probably improve intrasubunit packing, while the third, Leu79Phe, more likely makes both intra- and intersubunit contacts. Increased catalytic efficiency is the indirect outcome of these modifications.
In the EcCM structure, the side chain of Ser15 is hydrogen-bonded to the active-site residue Arg51 (Lee et al. 1995). An aspartate is found at this position in many natural CMs, including the thermostable MjCM (MacBeath et al. 1998d), and a strong preference for an aspartate was also noted in earlier selection experiments with binary-patterned AroQ libraries (Taylor et al. 2001b). Formation of a salt bridge between the selected aspartate and Arg51 may help to preorganize the binding pocket for substrate recognition and catalysis, explaining, for instance, why the Km value for the evolved trimer might be lower than that for wild-type EcCM (Table 4). The residue at position 87 may similarly influence the orientation of an adjacent catalytic residue, in this case Gln88, which stabilizes chorismate in the transition state through a hydrogen bond. In the EcCM structure, Thr87 also contributes to the H3–H1′ interface (Lee et al. 1995). Replacement of threonine with the more hydrophobic isoleucine would be expected to strengthen interactions between the two helices. In fact, many natural AroQ sequences have an apolar aliphatic residue at this site (MacBeath et al. 1998d). The tightening of the structure expected for both of these mutations could account for the reduced H/D exchange observed for tEcCM compared to hEcCM and EcCM.
Although the Ser15Asp and Thr87Ile mutations may stabilize the individual subunits of tEcCM, the Ser15Asp/ Thr87Ile double mutant elutes from the size exclusion column with the same retention time as hEcCM (data not shown), demonstrating that these substitutions alone are insufficient to produce the trimer. The additional replacement of leucine at position 79 with a larger phenyl-alanine is apparently decisive for the switch in quaternary structure. The side chain of residue 79 lies along the exposed hydrophobic face of the H3 helix, which was part of the original H3–H3′ interface in the parent EcCM homodimer. Together with the inserted hinge-loop, it probably contributes to the adhesive surface responsible for oligomerization. Although detailed structural studies are needed to clarify its precise role, Phe79 could improve intrasubunit packing by stabilizing the conformation of the spatially proximal hinge-loop, on the one hand, while providing more favorable intersubunit contacts, on the other. Both effects would be expected to stabilize the trimer relative to the hexamer, compensating for the reduced set of protein–protein interactions.
Addition of Leu79Phe to the Ser15Asp/Thr87Ile double mutant also provides a substantial jump in catalytic efficacy (Table 3). Although this residue is distant from the active site, mutation may cause subtle changes in residue alignment that are propagated through the protein to the active site, resulting in a pocket conformationally optimized for catalysis. Alternatively, the observed increase in efficiency may be directly linked to the change in quaternary structure. The AroQ active site is completely sequestered from solvent (Lee et al. 1995), and ligand binding necessarily requires substantial conformational changes in the protein. Protein–protein interactions in the hexamer may inhibit these rearrangements and thereby impair substrate binding. The simplified quaternary structure of the trimer might then facilitate catalysis simply by enhancing substrate access to the active site.
As this study shows, the transition between different oligomeric states, at least in the case of helical bundle proteins, can be induced by a small number of seemingly innocuous changes in primary sequence. Indeed, the family of AroQ mutases—including both natural dimers and the engineered monomers, trimers, and hexamers— constitutes an excellent system to explore the still poorly understood evolution of protein–protein interactions, since it allows simultaneous tuning of protein stability and biochemical activity via a sensitive complementation assay. In addition to further improvements in catalytic efficiency, additional rounds of mutagenesis and selection with these proteins may afford other novel topologies (Bittker et al. 2004) as well as new functional capabilities. Allosteric regulation by small molecules that bind at the evolved subunit interfaces represents one intriguing opportunity.
Materials and methods
E. coli strains
XL1-Blue (Stratagene) was used for general cloning and amplification purposes. Genetic complementation experiments were performed using the CM-deficient E. coli strain KA12/ pKIMP-UAUC (Kast et al. 1996). KA12 has the following genotype: Δ(srlR-recA)306:Tn10, Δ(pheA-tyrA-aroF), thi-1, endA-1, hsdR17, Δ(argF-lac)U169, supE44. The plasmid pKIMP-UAUC confers chloramphenicol resistance and provides genes encoding monofunctional forms of prephenate dehydrogenase and prephenate dehydratase from Erwinia herbicola and Pseudomonas aeruginosa, respectively. CMs were overproduced in E. coli strain KA13 (MacBeath and Kast 1998), which carries a chromosomally integrated, IPTG-inducible T7 RNA polymerase gene (Studier and Moffatt 1986).
DNA manipulations
All nucleic acid manipulations were performed according to standard procedures (Sambrook et al. 1989). Oligonucleotides were synthesized and purified by Microsynth. DNA sequencing was performed on an ABI prism 310 Genetic Analyzer (PE Applied Biosystems) using dye terminator nucleotides and chain termination chemistry (Sanger et al. 1977). DNA was prepared for sequencing using a QIAGEN Miniprep kit.
Plasmids
Plasmids pKECMT-W or pKECMB-W (MacBeath et al. 1998a) were used to compare the complementation efficiency of shuffled variants to wild-type EcCM. To eliminate any wild-type background from religated vector during library construction, shuffled gene products were introduced into plasmid pKECMB-S2 containing a “stuffer DNA” fragment that destroys the function of the CMgene (MacBeath et al. 1998b). For production of CM variants, NdeI–XhoI fragments of the corresponding genes were subcloned into the NdeI–XhoI fragment of the T7-promoter vector pET-22b-pATCH (MacBeath and Kast 1998).
DNA shuffling
The gene encoding hEcCM was PCR-amplified from plasmid pET-L5-1-pATCH (MacBeath et al. 1998b). A 50-μL PCR reaction contained 80 ng of template DNA, 50 pmol of each primer, 0.2 mM dNTPs, and 5 units of HotStarTaq DNA polymerase (QIAGEN). The 350-bp PCR fragment was then subjected to DNase I digestion (1.5 U/μL enzyme, ~30 ng/μL DNA, room temperature). After 10 min the reaction was quenched by addition of EDTA ([pH 8] 50 mM final concentration), and the DNase I digest fragments were subsequently purified on a 2%–3% agarose gel. The resulting smeared band containing <100-bp fragments was excised and purified using a QIAGEN gel extraction kit. The DNA fragments were concentrated by speed vacuum centrifugation and then recombined in a PCR-like reaction, without the addition of exogenous primers. The program involved 15 min of heating at 95°C, 25 PCR cycles (30 sec at 94°C, 30 sec at 35°C, and 30 sec at 72°C), and a final extension step (10 min at 72°C), before cooling to 4°C. A 50-μL reaction mixture consisted of HotStarTaq PCR buffer (QIAGEN), 0.2 mM dNTPs, 5 units of HotStarTaq DNA polymerase (QIAGEN), and DNA from the purified fragments. Without further purification, 10 μL of the reaction mixture was directly subjected to a PCR reaction to amplify the reassembled gene products (15 min at 95°C, 25 PCR cycles [1 min at 94°C, 1 min at 40°C, and 2 min at 72°C] and a final extension step [7 min at 72°C], before cooling to 4°C). In this case, the primers 01-pETL5S (GCTTCCTTTCGGGCTTTGTTA) and 02-Petl5S (GTTTAACTTTAAGAAGGAGATATAC) were used. A 50- μL PCR reaction mixture contained 1.25 μL of the reassembly PCR mixture, HotStarTaq buffer (QIAGEN), 50 pmol of each primer, 0.2 mM dNTPs, and 5 units of HotStarTaq DNA polymerase (QIAGEN). The purified 350-bp products were digested with XhoI and NdeI. The purified insert (303 bp) was ligated overnight (at 16°C) with XhoI/NdeI-cut vector pKECMB-S2 (2624 bp), yielding the plasmid-encoded “round 1” shuffling library. The “round 2” shuffling library was constructed by an analogous procedure. In this case, the initial amplification step prior to DNase I digestion was applied to the selected round 1 plasmid pools.
Selection experiments
Selection experiments were preformed using M9c medium at pH 7.0. It contained Na2HPO4 (6 mg/mL), KH2PO4 (3 mg/ mL), NH4Cl (1 mg/mL), NaCl (0.5 mg/mL), 0.2% (wt/vol) D-(+)-Glc, 1 mM MgSO4, 0.1 mM CaCl2, thiamin-HCl (5 μg/mL), 4-hydroxybenzoic acid (5 μg/mL), 4-aminobenzoic acid (5 μg/mL), 2,3-dihydroxybenzoic acid (1.6 μg/mL), L-Trp (20 μg/mL), sodium ampicillin (150 μg/mL), and chloramphenicol (30 μg/mL). For Petri dishes, 15 g of agar was added per liter. Where required, M9c was supplemented with L-Phe and L-Tyr at a final concentration of 20 μg/mL. The library plasmid pools were desalted on QIAquick PCR purification columns and electroporated into KA12/pKIMP-UAUC cells. Transformed cells were washed four times with M9c, suspended in M9c, and plated in duplicate both on plain M9c plates and on M9c plates supplemented with L-Phe and L-Tyr. In all cases, plates were incubated at 25°C or 30°C for 3–14 d. Colonies were counted and evaluated after 3 d (30°C) or 6 d (25°C) and then again after 7–14 d. For complementation tests with individual clones, well-isolated colonies were picked from either M9c plates or LB plates (supplemented with 150 μg/mL sodium ampicillin and 30 μg/mL chloramphenicol) and streaked on M9c plates to provide individual colonies.
Protein production and purification
EcCM, hEcCM, and tEcCM were produced with plasmids pET-EcCM-pATCH, pET-L5-1-pATCH (MacBeath et al. 1998b), and pET-R2–6-pATCH, respectively. The host strain for protein production was KA13. Cells from a single colony were grown in 500 mL of LB medium (supplemented with 150 μg/mL sodium ampicillin) at 37°C up to an OD600 of 1. The cultures were cooled to room temperature, and isopropyl- 1-thio-β-D-galactopyranoside (IPTG) was added to a final concentration of 0.25 mM. After 20 h of induction at room temperature, the cells were harvested (5000 rpm, 10 min, 4°C) and resuspended in 20 mL of PBS (10 mM phosphate, 160 mM NaCl [pH 6.5]) supplemented with lysozyme (1 mg/mL). Following cell lysis by sonication (0.75 cycles, amplitude 55), soluble material was separated from insoluble material by centrifugation (15,000 rpm, 30 min, 4°C) and sterilized through a 0.22-μm MILLEX GP filter. (His)6-tagged proteins were found primarily in the soluble fraction (supernatant) and purified by affinity chromatography on a matrix containing chelated Ni2+ ions. The supernatant was loaded onto a column packed with 6 mL of Ni-NTA agarose (QIAGEN) that had been pre-equilibrated with PBS containing 30 mM imidazole. The column was thoroughly washed with PBS containing 30 mM imidazole, and the bound protein was subsequently eluted with PBS containing 250 mM imidazole. The protein solutions were concentrated by ultrafiltration (Amicon centriprep centrifugal filter devices, 3000 MWCO). CMs were further purified by preparative size exclusion chromatography using a Superdex 75 (26/60) FPLC column (Pharmacia) with PBS (pH 6.5) as the running buffer. For the calibration curve aprotinin (6500 Da), cytochrome c (12,400 Da), ribonuclease A (13,700 Da), carbonic anhydrase (30,000 Da), ovalbumin (43,000 Da), and bovine serum albumin (67,000 Da) were used. The void volume, V0, and the total volume, Vt, of the column were determined by acetone (43 Da) and urease (480,000 Da) respectively. The elution parameter, Kav, was calculated by the equation Kav=(Ve−V0)/(Vt−V0), where Ve is the elution volume of the protein. Protein concentration was determined using the Coomassie Plus Protein Assay Reagent (Pierce) with BSA as the calibration standard. Analysis by ESI-MS confirmed the identity of each protein; the experimentally observed masses correlated well with the expected masses for EcCM (expected mass, 11,887.6 Da; observed, 11,879 Da), hEcCM (expected mass, 12,594.4 Da; observed, 12,587 Da), and tEcCM (expected mass, 12,668.5 Da; observed, 12,666 Da). Both tEcCM and hEcCM are prone to precipitate upon prolonged storage, particularly at high concentrations and low temperature. All experiments were therefore performed with freshly purified protein samples.
Kinetics
All kinetic measurements were performed at 20°C in PBS (pH 6.5) supplemented with 0.1 mg/mL bovine serum albumin (to stabilize hEcCM and tEcCM at low concentrations). Initial rates were determined by monitoring the disappearance of chorismate spectrophotometrically at 274 nm (ɛ 274 nm=2630 M−1 cm−1) or 310 nm (ɛ 310 nm=370 M−1 cm−1). All initial rates were corrected for the corresponding uncatalyzed reaction. Kinetic parameters kcat and Km were calculated from the initial rates as described (Görisch 1978), using 140 nM EcCM, 400 nM hEcCM, or 40 nM tEcCM.
Analytical ultracentrifugation
Sedimentation equilibrium was performed on a Beckman XL-A analytical ultracentrifuge equipped with an An60Ti rotor and photoelectric scanner. Freshly purified proteins were extensively dialyzed in PBS (pH 7). The dialysis buffer was used as a reference. Data were collected with 30 μM and 90 μM protein samples at 20°C from 10,000–22,000 rpm using double-sector charcoal-filled Epon centerpieces with quartz windows and fluorocarbon FC43 to provide a false bottom. Scans were performed at 280 nm under equilibrium conditions with a step size of 0.001 cm and 10 averages. Each data set was an average of at least three scans. Samples were allowed to equilibrate for appropriate periods of time and duplicate scans 4 h apart were overlaid to determine if equilibrium had been reached. The buffer density was measured at 20°C using a DSA48 density and sound analyzer (Anton Paar, Graz, Austria). The partial specific volume of each protein was calculated based on its amino acid composition using the program Sednterp (Laue et al. 1992). The data were analyzed by a nonlinear least-squares method using the program Ultrascan (University of Texas Health Science Center, San Antonio, TX, USA). The data were then fit to two classes of models. First, the data were fit to a single ideal species model using Equation 1:
 |
(1) |
where Ar is the absorbance at radius x, A0 is the absorbance at a reference radius x0 (the meniscus), M is the molecular weight of the single species, ν̄ is the partial specific volume of the protein, ρ is the density of the solvent, ωis the angular velocity of the rotor, R is the universal gas constant, T is the absolute temperature, and E is a baseline error correction factor. The data were then fit to a self-associating system of monomer to n-mer equilibria using Equation 2:
 |
(2) |
where Ka,n is the association constant for the formation of n-mer from monomers, and M is the monomeric molecular weight.
1H-NMR spectroscopy
1H-NMR spectra were acquired at 20°C using a 600-MHz Bruker NMR spectrometer (Bruker). The protein samples (200 μM) were in PBS (pH 6.5) containing 5% D2O.
Circular dichroism spectroscopy
Near and far-UV circular dichroism (CD) experiments were performed on an Aviv Circular Dichroism Spectropolarimeter, model 202. CD spectra were recorded at 20°C in PBS (pH 6.5), with 16 μM protein (d=0.2 cm) for far-UV CD and 200 μM protein (d=1.0 cm) for near-UV CD. Spectra were obtained by averaging five wavelength scans taken in 0.5-nm steps, with a signal averaging time of 2 sec and a bandwidth of 1 nm. Temperature denaturation curves were obtained by measuring the ellipticity of a 16 μMprotein solution at 222 nm (indicative of α-helical structure) as the samples were heated from 20°C to 95°C at 1°C temperature steps (15°C/h), using a Jasco J-715 Spectropolarimeter.
Fluorescence spectroscopy
All fluorescence experiments were performed at 20°C with a Hitachi Fluorescence F-4500 FL Spectrometer, using a 1×1-cm quartz cuvette. Spectra were obtained by averaging three wavelength scans with a signal averaging time of 2 sec, and an excitation and emission slit of 10 nm. The tryptophan fluorescence of a 2 μM protein sample was measured at 1-nm steps, using an excitation wavelength of 295 nm. ANS (2 μM) was excited at 370 nm, and fluorescence was monitored in the presence and absence of 2 μM protein. Tryptophan quenching (excitation wavelength 295 nm) was monitored by addition of ANS to a 2 μM protein sample at final concentrations of 2 μM, 20 μM, 100 μM, and 200 μM.
Proteolytic degradation
A trypsin solution (containing 0.2 mg/mL EDTA) from GIBCO was used. Protein degradation was initiated by addition of 100 μL of trypsin stock (0.5 mg/mL) to 100 μL of enzyme solution (100 μM). After appropriate periods of time, aliquots were removed and quenched by adding Mg/SDS buffer and heating (5 min, 95°C). The samples were analyzed by SDS-PAGE.
H/D exchange and mass spectrometry
Isotopic exchange was initiated at room temperature by a 20-fold dilution of a 25 μM aqueous protein solution into D2O. At appropriate times after dilution (10 sec–5 min), the exchange was quenched by decreasing the pD to 2.6 (by addition of an equal volume of acetonitrile containing 0.6% formic acid) and the temperature to 0°C. Deuterium incorporation into the proteins was quantified by a TSQ 7000 ESI-MS spectrometer (Finnigan).
Acknowledgments
We are grateful to Gabriel Mäder for carrying out preliminary experiments, Beat Vögeli for obtaining the NMR spectra, and Joris Beld for analytical ultracentrifugation studies. We thank Kenneth Woycechowsky for critical reading of the manuscript. This work was supported by the Schweizerischer National-fonds and the ETH Zurich.
Article published online ahead of print. Article and publication date are at http://www.proteinscience.org/cgi/doi/10.1110/ps.051431605.
References
- Bartlett, P.A. and Johnson, C.R. 1985. An inhibitor of chorismate mutase resembling the transition-state conformation. J. Am. Chem. Soc. 107 7792–7793. [Google Scholar]
- Bittker, J.A., Le, B.V., Liu, J.M., and Liu, D.R. 2004. Directed evolution of protein enzymes using nonhomologous random recombination. Proc. Natl. Acad. Sci. 101 7011–7016. [DOI] [PMC free article] [PubMed] [Google Scholar]
- Dickason, R.R. and Huston, D.P. 1996. Creation of a biologically active interleukin-5 monomer. Nature 379 652–655. [DOI] [PubMed] [Google Scholar]
- Englander, S.W., Mayne, L., Bai, Y., and Sosnick, T.R. 1997. Hydrogen exchange: The modern legacy of Linderstrøm-Lang. Protein Sci. 6 1101–1109. [DOI] [PMC free article] [PubMed] [Google Scholar]
- Goodsell, D.S. and Olson, A.J. 2000. Structural symmetry and protein function. Annu. Rev. Biophys. Biomol. Struct. 29 105–153. [DOI] [PubMed] [Google Scholar]
- Görisch, H. 1978. On the mechanism of the chorismate mutase reaction. Biochemistry 17 3700–3705. [DOI] [PubMed] [Google Scholar]
- Green, S.M., Gittis, A.G., Meeker, A.K., and Lattman, E.E. 1995. Onestep evolution of a dimer from a monomeric protein. Nat. Struct. Biol. 2 746–751. [DOI] [PubMed] [Google Scholar]
- Kast, P., Asif-Ullah, M., Jiang, N., and Hilvert, D. 1996. Exploring the active site of chorismate mutase by combinatorial mutagenesis and selection: The importance of electrostatic catalysis. Proc. Natl. Acad. Sci. 93 5043–5048. [DOI] [PMC free article] [PubMed] [Google Scholar]
- Lakowicz, J.R. 1983. Quenching of fluorescence. In Principles of fluorescence spectroscopy, pp. 260–271. Plenum Press, New York.
- Laue, T.M., Shah, B.D., Ridgeway, T.M., and Pelletier, S.L. 1992. Computer- aided interpretation of analytical sedimentation data for proteins. In Analytical ultracentrifugation in biochemistry and polymer science (eds. S.E. Harding et al.), pp. 90–125. Royal Society of Chemistry, Cambridge, UK.
- Lee, A.Y., Karplus, P.A., Ganem, B., and Clardy, J. 1995. Atomic structure of the buried catalytic pocket of Escherichia coli chorismate mutase. J. Am. Chem. Soc. 117 3627–3628. [Google Scholar]
- MacBeath, G. and Kast, P. 1998. UGA read-through artifacts: When popular gene expression systems need a pATCH. BioTechniques 24 789–794. [DOI] [PubMed] [Google Scholar]
- MacBeath, G., Kast, P., and Hilvert, D. 1998a. Exploring sequence constraints on an interhelical turn using in vivo selection for catalytic activity. Protein Sci. 7 325–335. [DOI] [PMC free article] [PubMed] [Google Scholar]
- ———. 1998b. Probing enzyme quaternary structure by combinatorial mutagenesis and selection. Protein Sci. 7 1757–1767. [DOI] [PMC free article] [PubMed] [Google Scholar]
- ———. 1998c. Redesigning enzyme topology by directed evolution. Science 279 1958–1961. [DOI] [PubMed] [Google Scholar]
- ———. 1998d. A small, thermostable, and monofunctional chorismate mutase from the archeon Methanococcus jannaschii. Biochemistry 37 10062–10073. [DOI] [PubMed] [Google Scholar]
- Mossing, M.C. and Sauer, R.T. 1990. Stable, monomeric variants of λ cro obtained by insertion of a designed β-hairpin sequence. Science 250 1712–1715. [DOI] [PubMed] [Google Scholar]
- Royer, C.A. 1995. Fluorescence spectroscopy. Methods Mol. Biol. 40 65–89. [DOI] [PubMed] [Google Scholar]
- Sambrook, J., Frisch, E.F., and Maniatis, T. 1989. Molecular cloning: A laboratory manual. Cold Spring Harbor Laboratory Press, Cold Spring Harbor, NY.
- Sanger, F., Nicklen, S., and Coulson, A.R. 1977. DNA sequencing with chain-terminating inhibitors. Proc. Natl. Acad. Sci. 74 5463–5467. [DOI] [PMC free article] [PubMed] [Google Scholar]
- Sirangelo, I., Malmo, C., Casillo, M., and Irace, G. 2002. Resolution of tryptophan-ANS fluorescence energy transfer in apomyoglobin by site-directed mutagenesis. Photochem. Photobiol. 76 381–384. [DOI] [PubMed] [Google Scholar]
- Smith, D.L., Deng, Y., and Zhang, Z. 1997. Probing the non-covalent structure of proteins by amide hydrogen exchange and mass spectrometry. J. Mass Spectrom. 32 135–146. [DOI] [PubMed] [Google Scholar]
- Stemmer, W.P.C. 1994. Rapid evolution of a protein in vitro by DNA shuffling. Nature 370 389–391. [DOI] [PubMed] [Google Scholar]
- Sträter, N., Schnappauf, G., Braus, G., and Lipscomb, W.N. 1997. Mechanisms of catalysis and allosteric regulation of yeast chorismate mutase from crystal structures. Structure 5 1437–1452. [DOI] [PubMed] [Google Scholar]
- Stryer, L. 1968. Fluorescence spectroscopy of proteins. Science 162 526–533. [DOI] [PubMed] [Google Scholar]
- Studier, F.W. and Moffatt, B.A. 1986. Use of bacteriophage T7 RNA polymerase to direct selective high-level expression of cloned genes. J. Mol. Biol. 189 113–130. [DOI] [PubMed] [Google Scholar]
- Taylor, S.V., Kast, P., and Hilvert, D. 2001a. Investigating and engineering enzymes by genetic selection. Angew. Chem. Int. Ed. 40 3311–3335. [DOI] [PubMed] [Google Scholar]
- Taylor, S.V.,Walter,K.U.,Kast, P., and Hilvert,D. 2001b. Searching sequence space for protein catalysts. Proc. Natl. Acad. Sci. 98 10596–10601. [DOI] [PMC free article] [PubMed] [Google Scholar]
- Vamvaca, K., Vögeli, B., Kast, P., Pervushin, K., and Hilvert, D. 2004. An enzymatic molten globule: Efficient coupling of folding and catalysis. Proc. Natl. Acad. Sci. 101 12860–12864. [DOI] [PMC free article] [PubMed] [Google Scholar]
- Woody, W.R. and Dunker, A.K. 1996. Aromatic and cystine side-chain circular dichroism in proteins. In Circular dichroism and the conformational analysis of biomolecules (ed. G.D. Fasman), pp. 109–157. Plenum Press, New York.
- Woycechowsky, K.J. and Hilvert, D. 2004. Deciphering enzymes: Genetic selection as a probe of structure and mechanism. Eur. J. Biochem. 271 1630–1637. [DOI] [PubMed] [Google Scholar]