Abstract
We develop coarse-grained, distance- and orientation-dependent statistical potentials from the growing protein structural databases. For protein structural classes (α, β, and α/β), a substantial number of backbone–backbone and backbone–side-chain contacts stabilize the native folds. By taking into account the importance of backbone interactions with a virtual backbone interaction center as the 21st anisotropic site, we construct a 21 × 21 interaction scheme. The new potentials are studied using spherical harmonics analysis (SHA) and a smooth, continuous version is constructed using spherical harmonic synthesis (SHS). Our approach has the following advantages: (1) The smooth, continuous form of the resulting potentials is more realistic and presents significant advantages for computational simulations, and (2) with SHS, the potential values can be computed efficiently for arbitrary coordinates, requiring only the knowledge of a few spherical harmonic coefficients. The performance of the new orientation-dependent potentials was tested using a standard database of decoy structures. The results show that the ability of the new orientation-dependent potentials to recognize native protein folds from a set of decoy structures is strongly enhanced by the inclusion of anisotropic backbone interaction centers. The anisotropic potentials can be used to develop realistic coarse-grained simulations of proteins, with direct applications to protein design, folding, and aggregation.
Keywords: side-chain packing, statistical coarse-grained potentials, harmonic analysis, Boltzmann device, protein-fold recognition
Development of low-resolution models for proteins is essential in protein structure prediction and protein design. To achieve this goal, we need an effective interaction potential. Starting with the seminal work of Tanaka and Scheraga (1976), there has been a growing interest in obtaining reasonably accurate force fields. The accelerated growth of structural data on thousands of proteins in the Protein Data Bank (PDB; Berman et al. 2000) has been a source for obtaining residue–residue interaction potentials (Miyazawa and Jernigan 1985, 1999b; Godzik et al. 1995; Bahar and Jernigan 1996; Lee et al. 1999). Tanaka and Scheraga (1976) proposed that the frequencies of side-chain pairing can be used to determine potential interaction parameters. Since then, with the exception of a few studies (Sippl 1990), most of the knowledge-based potentials have been obtained solely in terms of residue–residue contacts (Skolnick et al. 1997, 2000; Miyazawa and Jernigan 1999b; Tobi et al. 2000).
Sippl (1990) used a statistical method, known as the Boltzmann device, to obtain the distance-dependent mean force potentials. This method relies on the assumption that the known X-ray or NMR-resolved protein structures represent classical equilibrium states and, therefore, the distribution of distances between two side chains should correspond to the equilibrium Boltzmann distribution. Other structural parameters, such as dihedral angles, can also be used in this treatment. The statistical potentials developed using this approach and other methods (Tobi et al. 2000; Tobi and Elber 2000; Meller et al. 2002) have also focused only on extracting and analyzing probability density functions dependent solely on distance.
Previous studies have shown that the relative orientation and packing of side chains in proteins is an important determinant of the local (secondary structure) geometry as well as three-dimensional (tertiary structure) topology (Bahar and Jernigan 1996; Bagci et al. 2002a,b). By analyzing various families of protein structures, we had previously shown that certain orientational order parameters are prominent (Buchete et al. 2003). From a quantitative analysis of the statistical data on orientational distributions of side chains extracted from PDB structures, we determined orientation-dependent interactions. This approach is supported by the results of Bahar and Jernigan (1996), who proposed a backbone-dependent coordination system for studying the statistical distribution of residue–residue interactions in proteins. They showed that residue-specific coordination loci and packing characteristics can be extracted by statistical analysis of protein structures, and knowledge-based orientational potentials can be constructed. However, using the backbone-dependent coordination system employed by Bahar and Jernigan (1996), it is difficult to include variations in the sizes of side chains and their rotational degrees of freedom. These effects are important, especially for large side chains that have several probable rotameric states with respect to the backbone. Therefore, we use a coordination system based on side-chain local reference frames (LRFs, see Materials and Methods) that are backbone independent for most amino acids. On the basis of earlier estimations (Buchete et al. 2003) and on statistical corrections for data sparsity, we can also use smaller orientational bin sizes then used by Bahar and Jernigan (1996). In this study, we present a new method for extracting coarse-grained distance- and orientation-dependent residue–residue statistical potentials. We first show that in many protein structures, there is a substantial number of contacts between side chains and backbone. The near globularity of protein structures (i.e., they are nearly maximally compact) implies that such contacts should be prevalent. The necessity to include explicitly the backbone interactions is also supported by the results of previous statistical derivations of backbone potentials that used virtual bond and torsion angles (Bahar et al. 1997) and secondary structure information (Miyazawa and Jernigan 1999a). To capture the presence of the large number of side-chain backbone contacts in protein structures, we include an extra anisotropic backbone interaction center located at the peptide bond. Spherical harmonic analysis (SHA) and spherical harmonic synthesis (SHS) methods express the orientation-dependent potentials in a continuous manner for short-, medium-, and long-range interactions. Multiple decoy sets (Samudrala and Levitt 2000) are used to assess the effectiveness of these potentials in recognizing the native folded states. The results show that the newly derived orientation-dependent potentials for side chains and the protein backbone are successful in a vast majority of cases.
Results
The importance of side chain–backbone and backbone–backbone interactions
A major improvement of the potentials that are constructed, presented, and tested in this study is due to the inclusion of a virtual interaction center (Pep) located on the backbone in the middle of the peptide link (see Materials and Methods). In our previous study, we considered the inter-residue interactions (Buchete et al. 2003) using 20 × 20 side chain–side chain (SC–SC) orientation-dependent potentials. We were motivated to include explicitly the side chain–backbone (SC–BB) and backbone–backbone (BB–BB) interactions in a new 21 × 21 interaction scheme by the results of the structural analysis performed on the main protein classes.
These results, summarized in Table 1, show that backbone–backbone and backbone–side chain interactions represent substantial fractions of the total number of contacts for all the main classes of proteins, mainly-α, mainly-β, and α/β (Orengo et al. 1997; Pearl et al. 2000, 2003). The protein structures analyzed here are taken from the most recent CATH database (Pearl et al. 2003; http://www.biochem.ucl.ac.uk/bsm/cath_new). For short-range interactions (2.0 → 5.6 Å), the fraction of SC–BB contacts is more prevalent in structures with β-sheet topology (especially for |i − j| ≥4), but these contacts cannot be ignored even for α-helical proteins (see Table 1). Interestingly, as shown in Table 1, for medium- (5.6 → 9.2 Å) and long-range (9.2 → 12.8 Å) interactions, all of the three interaction types occur with similar frequencies, regardless of the protein architecture. This is an effect of the more uniform averaging at larger distances when orientational preferences are not that important. The results presented in Table 1 show that the backbone interaction centers play an important role in the stability of the secondary structures of proteins for all the protein classes. Thus, these interaction centers must be included in representing the coarse-grained potentials for low-resolution structure prediction, as well as for analyzing protein-folding pathways. This observation is in agreement with the previous study of Bahar and Jernigan (1997), where distance-dependent SC–SC, SC–BB, and BB–BB statistical interactions were investigated in globular proteins. In this study, the peptide (Pep) backbone moiety is treated as a 21st type of interaction center. By including Pep as an interaction site, we determine the parameters for the statistical potential using a 21 × 21 interaction scheme.
Table 1.
Fractions of side chain–side chain (SC–SC), side chain–backbone (SC–BB), and backbone–backbone (BB–BB) contacts calculated for the three most typical protein classes, namely α, β, and mixed α/β
| Short range 2.0 → 5.6 Å | Medium range 5.6 → 9.2 Å | Long range 9.2 → 12.8 Å | |||||||
| For |i − j| ≥3 | |||||||||
| SC–SC | SC–BB | BB–BB | SC–SC | SC–BB | BB–BB | SC–SC | SC–BB | BB–BB | |
| α: | 44.5% | 25.2% | 30.3% | 30.9% | 34.7% | 34.4% | 31.6% | 31.4% | 37.0% |
| α/β: | 38.9% | 26.0% | 35.1% | 31.2% | 34.2% | 34.6% | 32.4% | 32.3% | 35.3% |
| β: | 40.0% | 25.9% | 34.1% | 31.0% | 34.6% | 34.4% | 32.2% | 32.3% | 35.5% |
| For |i − j| ≥ 4 | |||||||||
| SC–SC | SC–BB | BB–BB | SC–SC | SC–BB | BB–BB | SC–SC | SC–BB | BB–BB | |
| α: | 61.4% | 25.9% | 12.7% | 30.0% | 34.7% | 35.3% | 31.3% | 31.1% | 37.6% |
| α/β: | 43.1% | 26.2% | 30.7% | 31.2% | 34.7% | 34.1% | 32.1% | 32.0% | 35.9% |
| β: | 40.6% | 25.9% | 33.5% | 31.6% | 35.5% | 32.9% | 31.9% | 32.0% | 36.1% |
The fractions of contacts were calculated both for interaction centers separated by at least three peptide bonds along the sequence (|i − j| ≥3) and by at least four (|i − j| ≥4).
Orientational probability density maps and results for applying the Boltzmann device
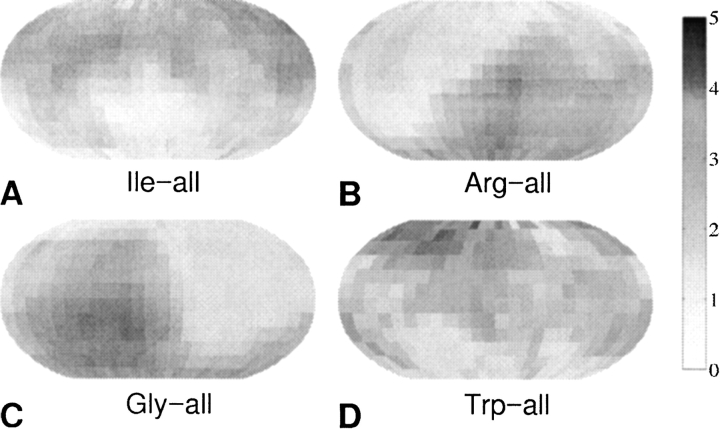
The orientational density maps were calculated by dividing the interaction range into three regions as described above. Figure 1 ▶ displays the probability density maps in the short range (2.0 → 5.6 Å) for the relative orientations of other side chains (denoted by the term “all”, and obtained by averaging data from all the amino acids types) with respect to Ile (Fig. 1A ▶), Arg (Fig. 1B ▶), Gly (Fig. 1C ▶), and Trp (Fig. 1D ▶). The grayscale mapping is directly proportional to the probabilities of finding another side chain at various orientations, as shown in the grayscale bar. Note that for Ile, one of the most hydrophobic residues, the highest probability of finding a neighboring residue is toward its north pole, which, according to our definitions of local reference frames (LRFs, see Materials and Methods), is situated away from the local backbone. This effect is a manifestation of the high statistical probability of finding Ile residues within the hydrophobic core of the protein structures. A related effect is noticeable for Arg, which is one of the most hydrophilic residues. There is a region of high interaction probability toward its south pole, which can be explained by the preference of Arg to be exposed to solvent. The orientational probability maps are also shown on the bottom of Figure 1 ▶ for Gly and Trp, and they present the same qualitative features that are expected when considering their size and hydropathic properties. Data for all the 21 × 21 possible types of relative residu–residue and residue–backbone orientations was collected and analyzed in this work.
Figure 1.
Examples of probability density maps for the relative residue–residue orientations in proteins for short range interactions (2.0→5.6 Å). The grayscale mapping is directly proportional to the probabilities of finding any other side chain at various orientations with respect to Ile (A), Arg (B), Gly (C), and Trp (D). The normalized probability values shown on the grayscale scale have units of 10−3.
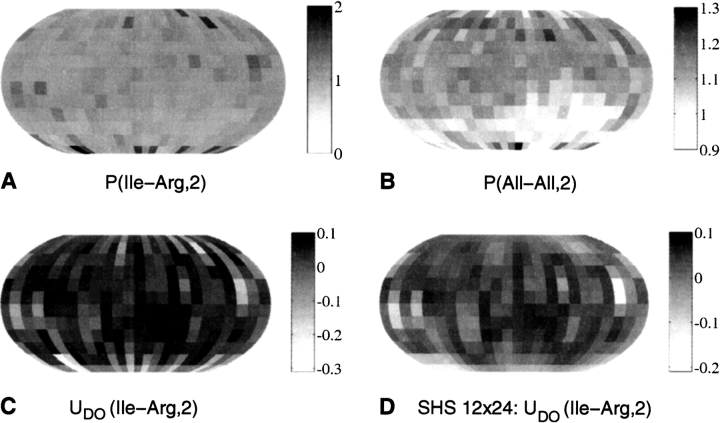
The orientational probability density maps were further used (see Materials and Methods) to construct the corresponding potentials. The values in the orientational probability density map for Arg residues around Ile (Fig. 2A ▶) are divided by the values of the reference map (Fig. 2A ▶) that is obtained by averaging over all the 20 side-chain types (see Materials and Methods). In this study, the reference average probabilities are not side chain-specific, but this is closer to the random mixing approximation of side chains. The negative logarithm of the result gives the statistical potential for the relative Ile–Arg orientations (Fig. 2C ▶) in units of kT. In this work, we derive orientation-dependent potentials for short- [i.e., rij ∈ (2 Å, 5.6 Å)], medium- [rij ∈ (5.6 Å, 9.2 Å)], and long-range interaction shells [rij ∈ (9.2 Å, 12.8 Å)]. The maps shown here correspond to the second shell of interactions (i.e., medium range).
Figure 2.
The Boltzmann device. Statistical potentials for the relative residue–residue orientations can be derived from probability density maps. The orientational probability density map (in units of 10−3) for Arg residues around Ile (A) and the reference map (B) corresponding to all of the side-chain types are used to build the statistical potential for the relative Ile–Arg orientations (C) in units of kT. These maps correspond to the second interaction shell [rij∈ (5.6 Å,9.2 Å)]. The smoothing effect of spherical harmonic synthesis (see Materials and Methods) is shown in D.
We used the same procedure to obtain the orientational potentials for all the types of SC–SC and SC–BB interactions.
The spherical harmonic analysis (SHA) of inter-residue orientational potentials
The statistical potentials derived using the Boltzmann device were further analyzed using SHA (see Materials and Methods). We adapted Spherepack routines (Adams and Swarztrauber 1997, 1999) to analyze the potential data, which was first constructed on a 12 × 24 equiangular grid on spherical domains corresponding to the three (i.e., short, middle, and long) interaction ranges.
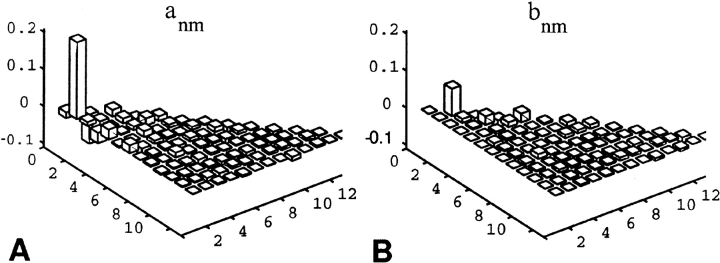
For example, in Figure 3 ▶ we show the amn and bmn coefficients (see eq. 10 in Materials and Methods) computed for long-range Ile–Arg interactions, up to order n = 13 (m ≤ n). The analysis of all 21 × 21 types of orientational potentials was performed and the amn and bmn coefficients were stored. Calculation of the expansion coefficients (amn and bmn; see eq. 10) is vital, because it permits rapid calculation of each specific orientational potential by spherical harmonic synthesis (SHS) for any value of the LRF orientational parameters θ and φ. Importantly, not many a and b coefficients have large amplitudes (see Fig. 3 ▶ for an example), suggesting that further filtering methods can be applied, and that efficient computational methods using the new smooth potentials resulting from SHS can be developed. The dominance of only a few expansion coefficients (Fig. 3 ▶) is consistent with our earlier finding (Buchete et al. 2003) that, in proteins with different architectures, only a few orientational order parameters are relevant.
Figure 3.
Example of spherical harmonic amn (A) and bmn (B) coefficients (m ≤ n ≤ 13) for Ile–Arg orientational statistical potentials. This is a typical situation for long-range interactions, in which only a few dominant eigenvalues exist. These values can be used in the spherical harmonics synthesis process for reconstructing smooth orientational potentials for all of the possible relative orientations, with high accuracy.
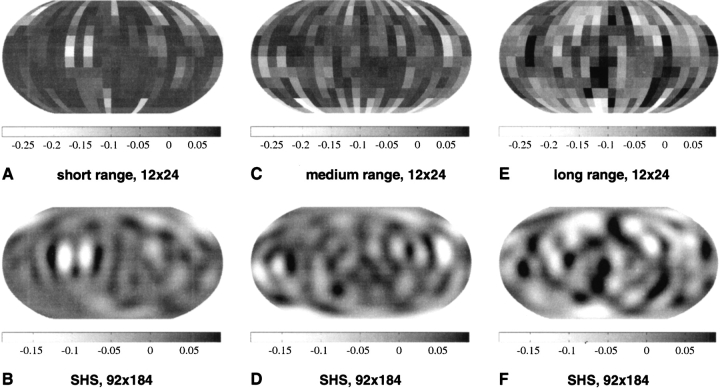
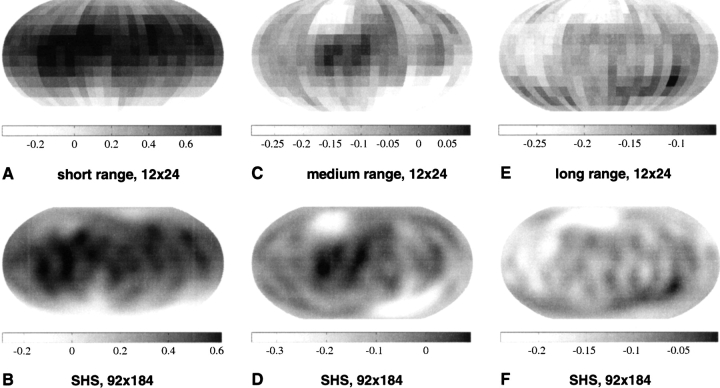
We show in Figure 4 ▶ the reconstructed Ile–Arg orientational potential using 12 × 24 equiangular bins (up) and a 92 × 184 grid (down), for short-range (left), middle-range (middle), and long-range (right) interactions. When comparing the SHS potential values reconstructed on the 92 × 184 grid to the original orientational potential values for Ile–Arg shown in Figure 4 ▶ (left), the smoothing effect of the SHA/SHS procedure is evident.
Figure 4.
The smooth Ile–Arg orientational potentials represented for short-range (top), middle-range (center), and long-range (bottom) interactions. The potential values, calculated originally for a 12 × 24 equiangular grid are shown in A, C, and E. The corresponding smooth potentials computed for a 92 × 184 grid using spherical harmonic synthesis are shown in B, D, and F. Dark regions correspond to attractive (i.e., negative) potentials, whereas white regions are positive, thus less likely to correspond to interaction loci.
The results of the same type of SHA/SHS process are shown in Figure 5 ▶ for the anisotropic virtual backbone interaction centers (Pep) located in the middle of the peptide bond (see Materials and Methods). The smooth Pep–Pep orientational potentials are represented for short-range (left), middle-range (middle), and long-range (right) interactions. The grayscale coding used in this figure is similar to the one used in Figure 4 ▶. From both Figures 4 ▶ and 5 ▶ we can see that, for each interaction range, there are specific anisotropic features of the orientation-dependent statistical potentials. Some of the attractive or repulsive angular regions are conserved from one interaction shell to the other, yet some present significant changes that could explain the specific features of residue–residue, residue–backbone, and backbone–backbone interactions.
Figure 5.
The smooth Pep–Pep orientational potentials represented for short-range (left), middle-range (center), and long-range (right) interactions. The potential values, calculated originally for a 12 × 24 equiangular grid are shown in A, C, and E. The corresponding smooth potentials computed for a 92 × 184 grid using spherical harmonic synthesis are shown in B, D, and F. Dark regions correspond to attractive (i.e., negative) potentials, whereas white regions are positive.
The three-dimensional contour maps (Fig. 6 ▶) of continuous and smooth reconstructed statistical potential fields illustrate the relative LRF orientation of the “virtual backbone interaction center” backbone particle (Pep). For the objects shown here, the grayscale is directly proportional to the amplitude of the potentials. The negative attractive potential values are indicated as dark angular regions. The presence of other Pep particles is favored at these orientations. The light-gray regions represent unfavorable and repulsive regions around Pep. This type of three-dimensional representation can be used to investigate all of the possible side chain–side chain, side chain–Pep, and Pep–Pep orientation-dependent statistical potential fields and their unique features.
Figure 6.

Three-dimensional representations of the statistical potential field for the smooth short-range (A), middle-range (B), and long-range (C) backbone–backbone interactions (Pep–Pep). The relative orientation of the Pep particle with respect to the orientation-dependent potential values is also shown. The dark, attractive regions responsible for hydrogen bonding are apparent for midrange interactions (B).
Effect of including explicitly the backbone interactions on the potentials
One of the main features of the SHA/SHS approach is that specific values of the orientational potentials can be calculated (reconstructed) from the amn and bmn coefficients for all values of the orientational parameters θ and φ. The smoothing effect of the SHA/SHS procedure, which eliminates the unrealistic discontinuities in the binned orientational potentials, can lead to information loss (Adams and Swarztrauber 1997, 1999). To assess the efficacy of the reconstructed orientational potentials, we performed tests for discriminating the native state from multiple decoy sets (Samudrala and Levitt 2000; Buchete et al. 2003). The results (see Figs. 8 ▶ ▶–10 ▶, below) were obtained for testing the ability of our statistical potentials to discriminate the native structure of a protein from a large set of multiple decoy structures from the database of Samudrala and Levitt (2000). These results are shown in terms of the values of the energy and root-mean-square distance (RMSD) Z scores (ZE and ZRMSD) that are defined next. The RMSD is calculated with respect to the Cα atoms. The Z score of a statistical quantity x (e.g., in our case E or RMSD) is
Figure 8.
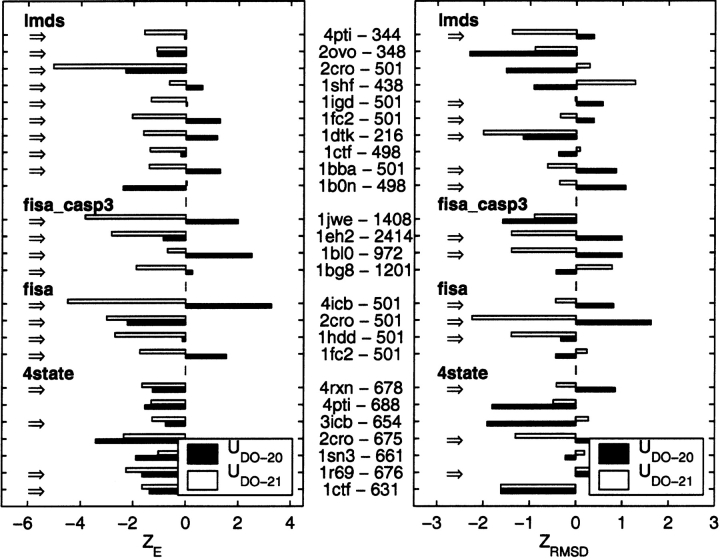
Results from decoy tests on the orientation-dependent potentials. The energy (ZE) and Cα RMSD Z scores (ZRMSD) calculated for multiple decoy sets (Park and Levitt 1996; Park et al. 1997; Simons et al. 1997; Samudrala and Levitt 2000; Keasar and Levitt 2003) lmds, fisa_casp3, fisa, and 4state are compared before (UDO–21) and after (UDO–21s) the SHA/SHS method is applied. The PDB code for each protein and the number of decoys in its corresponding set are shown in the middle. The dark bars correspond to UDO–21 and the white bars are for UDO–21s. The cases in which the UDO–21 potentials perform better in discriminating the native state from decoys are emphasized by the arrows on the left. For a majority of decoy sets (84% for ZE and 56% for ZRMSD), the performance is improved.
Figure 9.
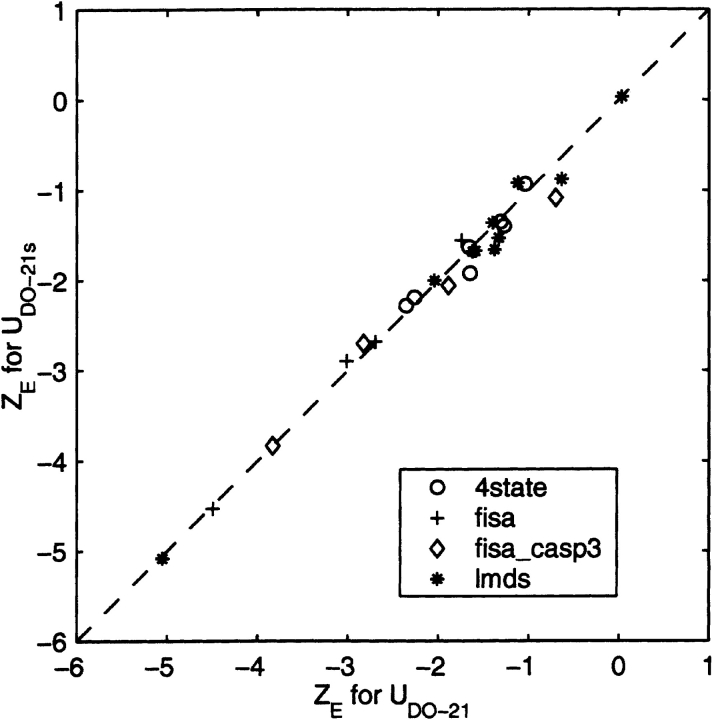
For all the decoy sets analyzed (Park and Levitt 1996; Park et al. 1997; Simons et al. 1997; Samudrala and Levitt 2000), a very good correlation is observed between ZE scores obtained using the 21 × 21 interaction scheme (UDO–21) and the ZE scores calculated after applying the spherical harmonic synthesis (SHS) method (UDO–21s). In fact, the ZE scores obtained using UDO–21s are marginally better (i.e., more negative).
Figure 10.
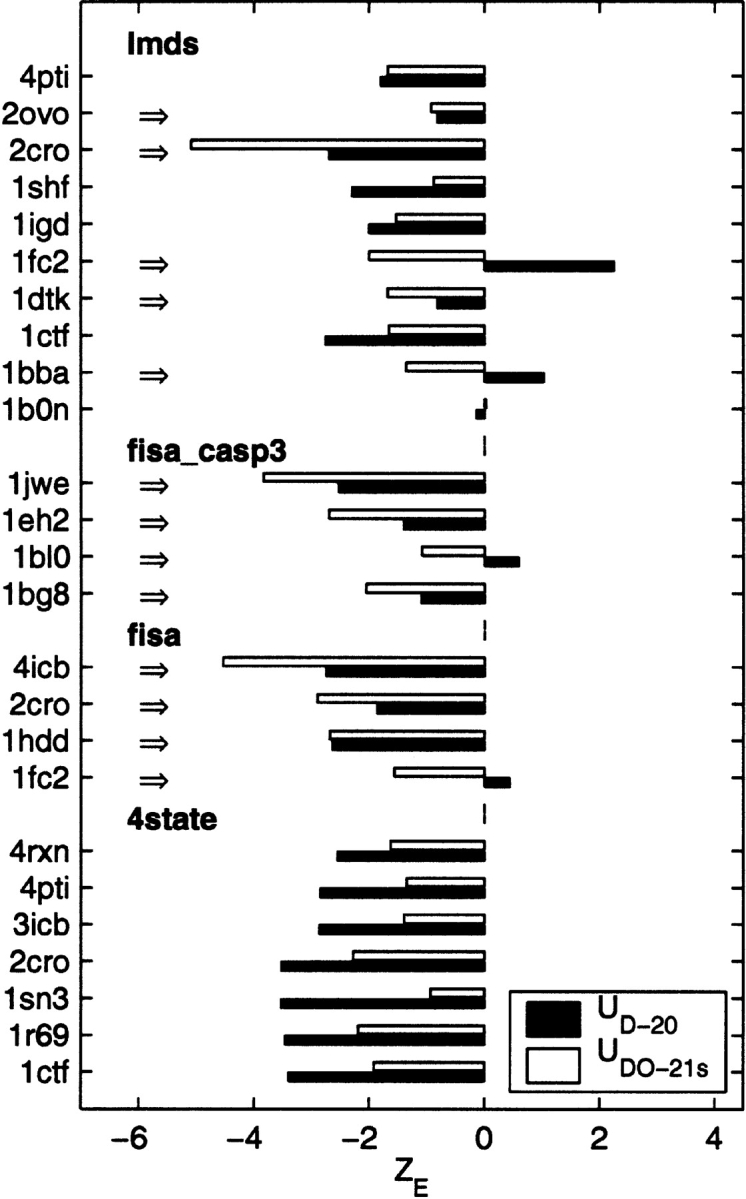
Comparison of ZE scores for multiple decoy sets (Samudrala and Levitt 2000). The cases in which the smooth, distance- and orientation- dependent potentials (UDO–21s, white bars) perform better than potentials depending solely on distances (UD–20, black) in discriminating the native state from decoys are emphasized by the arrows on the left.
 |
(1) |
where σx is the standard deviation and x¯ is the mean of the distribution of x values. For comparing the performance (with and without the Pep interaction center) of the interaction potentials on sets of decoy structures, we calculate both ZE and ZRMSD.
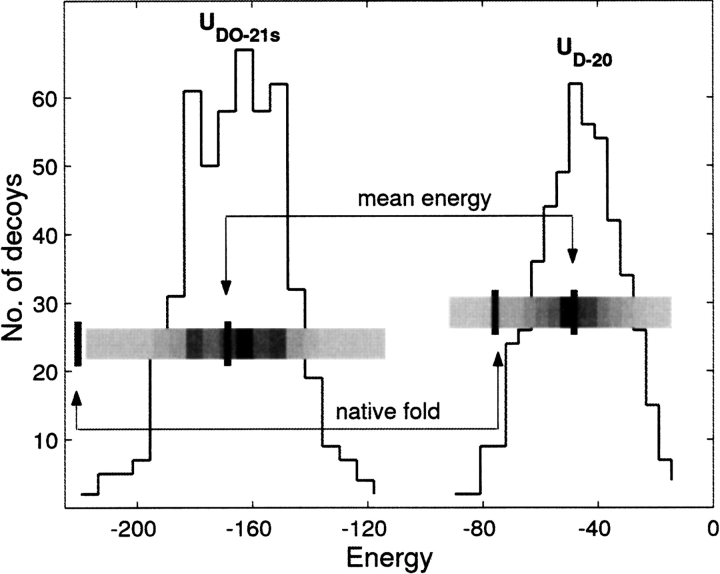
The data in Figure 7 ▶ shows energy distributions for the set of 500 decoys of the 2cro protein from the fisa family (Simons et al. 1997; Samudrala and Levitt 2000). The two distributions correspond to the distance-dependent statistical potential (UD histogram, right) for a 20 × 20 interaction scheme (Buchete et al. 2003), and to the present smoothed distance- and orientation-dependent 21 × 21 potential (UDO, left) that includes backbone interactions. The values for the corresponding energies of the native 2cro state and the mean values are also shown for illustrating the definitions of the energy Z scores (ZE) used in our analysis. For ideal potentials, it is expected that the structure corresponding to the native state would have the most negative ZE. In addition, a good potential scoring function should assign a very negative Cα RMSD Z score (ZRMSD) to the decoy structure that has the lowest energy. It is clear from Figure 7 ▶ that the UDO–21s (i.e., smooth, distance- and orientation-dependent potentials that are reconstructed by SHA using the 21 × 21 interaction model) are very successful in correctly identifying the native state in the 2cro decoy set. The UDO notation is used for statistical potentials that are both distance- and orientation-dependent, whereas the UD potentials depend solely on distance. The numerical ZE score in this case is lower than what is found using the UD–20 potential. In this instance, UDO–21s identifies the native state as the one with the lowest energy (Fig. 7 ▶). On the other hand, for the UD–20 potential, there are decoy structures with lower energies than the native state. In our tests, we use ZE scores to assess the efficacy of the potentials.
Figure 7.
Distribution of energies for the 500 decoys of the 2cro protein from the fisa set. The two energy distributions correspond to the distance-dependent statistical potential (UD–20 histogram, right) for a 20 × 20 interaction scheme (Buchete et al. 2003) and to the present smoothed distance-and orientation-dependent 21 × 21 potential (UDO–21s, left) that includes backbone interactions. The values for the corresponding energies of the native 2cro state and the mean values are also shown for illustrating the definitions of the energy Z scores (ZE) used in our analysis.
We have computed both the energy and the RMSD Z scores (ZE and ZRMSD) for the distribution of the total energies for each protein decoy set. Assuming pairwise additivity, the total potential for the residue pair ij is
 |
(2) |
The results for ZE and ZRMSD for the multiple decoy sets (Park and Levitt 1996; Park et al. 1997; Simons et al. 1997; Samudrala and Levitt 2000; Fain et al. 2001; Keasar and Levitt 2003) lmds, fisa, fisa_casp3, and 4state are shown in Figure 8 ▶. To assess the performance of the present potentials, we compare the results using UDO–20 (dark bars) and UDO–21 (white bars). The cases in which the new UDO–21 potentials perform better in discriminating the native state from decoys are emphasized by the arrows on the left. For a large majority of decoy sets (84% when considering the energy score ZE), the performance is improved by including the backbone interaction centers. The values of ZE computed using UDO–21 are more negative then for UDO–20 for all decoy sets except the 4state (Fig. 8 ▶).
The results in Figure 8 ▶ show an important number of improvements for the ZE score. However, our results show that the ZRMSD score is a noisy quantity, in agreement with the observations of Samudrala and Levitt (2000), showing a less systematic behavior. As a consequence, we are focusing on the energy ZE score as the main quantitative performance indicator of the ability of our potentials to identify native-like protein conformations in decoy tests.
Effect of the SHA/SHS method on the smoothed potentials
To assess the effect of smoothing (see Materials and Methods) on the results, we compare in Figure 9 ▶ ZE scores calculated using the UDO–21 potentials and the UDO–21s potentials reconstructed from expansion coefficients with the spherical harmonic synthesis (SHS) method. The effects of the SHA/SHS method on the energy ZE score are relatively small, and a very good correlation is observed between ZE scores obtained using the 21 × 21 interaction scheme (UDO–21) and the ZE scores calculated using the smooth UDO–21s potentials. Noticeably, the ZE scores obtained using UDO–21s are marginally better (i.e., more negative). Although there is an intrinsic information loss introduced by the SHS/SHA procedure (Adams and Swarztrauber 1997, 1999), the resulting potential smoothing improves the performance of the orientation-dependent potentials. These results show that the coarse graining of the orientational potential using the spherical harmonic analysis does not lead to loss of accuracy and could enhance the native fold recognition ability.
Figure 10 ▶ shows the energy ZE scores calculated for the same multiple decoy sets, but using the 20 × 20 interaction scheme dependent only on residue–residue distances (UD–20, dark bars) and the UDO–21s potentials (white). The new UDO–21s potentials perform better in a majority of cases for the fisa and fisa_casp3 and lmds decoy sets, as emphasized by the arrows in Figure 10 ▶. For the 4state set, where the energy Z scores for UD–20 are better, we still obtained negative ZE values consistently for all the new potentials. We need to mention that the UD–20 potentials were constructed as described by Buchete et al. (2003) for 20 radial bins of 1.2 Å, whereas the new UDO–21s potentials have only three interactions ranges (short, middle, and long). It is noticeable, therefore, that the detailed orientation dependence and the inclusion of interactions with the backbone in the UDO–21s potentials confer significant advantages in an important number of cases.
Role of decoy sets
The performance of the statistical potentials is crucially dependent on the decoy sets used. There are considerable variations in the nature of the decoy sets. For example, the decoys generated for 2cro (depicted in Fig. 11A ▶) by different methods, have Cα RMSD values from the native state in the range 0.81→8.31 Å for 4state, 4.29→12.60 Å for the fisa, and 3.87→13.47 Å for the lmds sets. The results shown in Figure 10 ▶ for the ZE score of the 4state decoys could be due to the fact that for these small α-helical proteins, the decoy structures are so close to the native state that small errors in the potentials can have important negative effects. It is not our goal to analyze in detail the magnitude of these errors and all of their possible sources (e.g., assumptions behind the statistical model, the dependency on training sets, and other technical details). Due to the statistical nature of this approach, there is always a possibility to fail in identifying the native state when using more detailed statistical data in the analysis of protein structures For example, the case of the 2cro protein seems to correspond to a failure for the 4state set of decoys (see Fig. 10 ▶), because the ZE score of the structure with the lowest UDO–20 value (shown in Fig. 11E ▶) is more negative. However, the decoy structure that scored the best by using to the new UDO–21s statistical potential (see Fig. 11C ▶) has a much lower Cα RMSD value (only 2.77 Å) from the native state. In addition, the decoy structure that scored the worst for the UDO–21s statistical potential (Fig. 11D ▶) has a high CαRMSD value (6.14 Å) as compared with the native state conformation. In Figure 11 ▶, the grayscale coding corresponds to structural features such as dark gray for helices, black for turns, and light gray for coil regions. As shown in Figure 11 ▶, even if the structure identified as native-like by using backbone-related information (i.e., UDO–21s, Fig. 11C ▶) does not have a ZE score as good as the one obtained by using only the side chain–side chain distances (i.e., UD–20, Fig. 11E ▶), the UDO–21s performance is reasonable, because the native-like structure shown in Figure 11C ▶ has noticeably more native features (e.g., number and relative positions of helical chains). The decoy with the largest Cα RMSD (8.31 Å) from the native state is also shown in Figure 11B ▶ for illustrating the range of conformations available in the 4state decoy set. The decoys with the highest UD–20 (Fig. 11E ▶) and UDO–21s (Fig. 11F ▶) values are observed to have large structural differences from the native conformation in both cases, as a manifestation of the efficacy of both potentials discussed here. Thus, the UDO–21s parameter set correctly discriminates between native and other misfolded structures even though there is no improvement in ZE relative to the UD–20 potentials.
Figure 11.
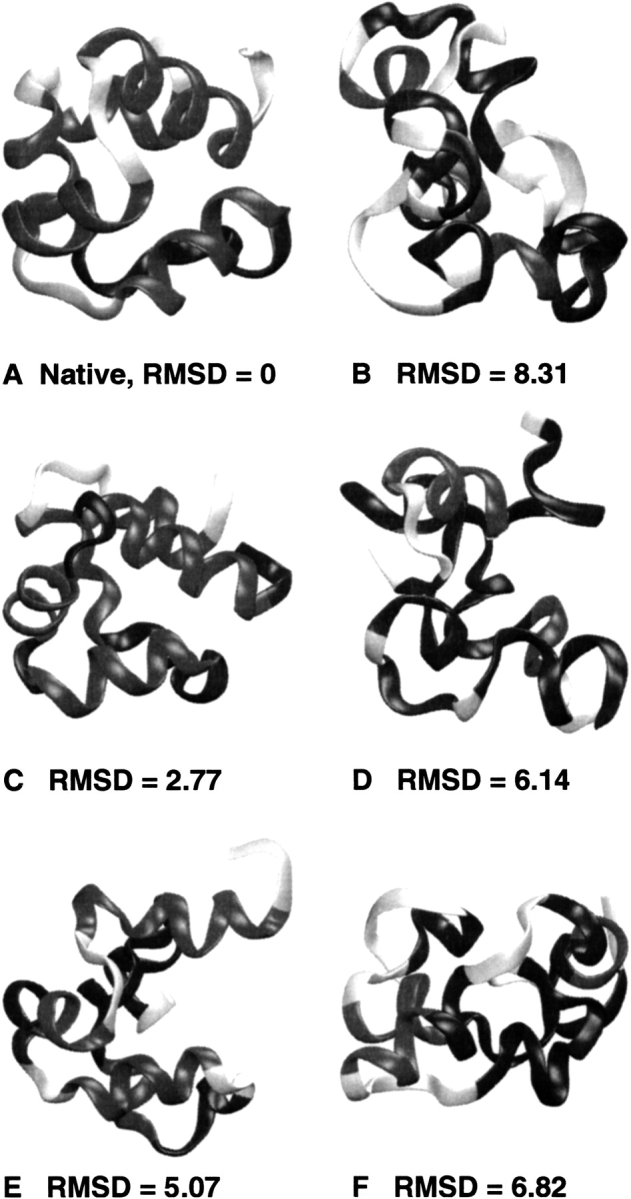
Examples of six structures (one native and five decoys from the 4state set) for the 2cro protein. (A) The native state; (B) the decoy with the largest Cα RMSD (8.31 Å); (C) the best (i.e., native-like) decoy with the lowest UDO–21s potential; (D) the decoy with the highest UDO–21s potential; (E) the decoy with the lowest UD–20 potential; (F) the decoy with the highest UD–20 potential. The UDO–21s potential presents an increased ability to identify the native-like decoy state shown in C. These structures have been aligned and plotted using VMD (Humphrey et al. 1996). All of the RMSD values are given in Å, and the gray levels correspond to structural features (dark gray for helices, black for turns, and light gray for coil regions).
Besides the results shown in Figures 8 ▶–10 ▶ ▶ for the lmds (Keasar and Levitt 2003), fisa_casp3 (Simons et al. 1997), fisa (Simons et al. 1997), and 4state (a.k.a. 4state_reduced; Park and Levitt 1996) decoy sets, we also computed the corresponding Z scores for the multiple decoy sets hg_structal, ig_structal (Samudrala and Levitt 2000). For the hg_structal (hemoglobines) and ig_structal (immunoglobulins) decoy sets, which have been built with the program segmod (Levitt 1992) by comparative modeling using other globins as templates, we also obtained better ZE scores for the UDO–21 potentials than for the UDO–20. Including the 21st backbone, interaction center proves to be beneficial for almost 70% of the immunoglobulin sets as compared with only 34% of the hemoglobins. This could be explained by the fact that for this type of |i − j| ≥4 interactions (as is the case for the potentials presented here), there is a significantly smaller number of backbone–backbone contacts at short-range distances in α-helical than in β-sheet structures (see data in Table 1).
The results of the tests on discriminating the native states from decoy sets show that the new 21 × 21 smoothed potentials, which include the virtual Pep particle to represent the backbone interaction center, perform better in a majority of cases. In agreement with our previous calculations (Buchete et al. 2003), the inclusion of orientational dependence alone can strongly improve the quality of inter-residue statistical potentials. Even though in the work presented here we consider only three distance interaction ranges, the performance of the new orientation- and distance-dependent potentials is generally better then the performance of the potentials that depend solely on inter-residue distances. The performance of the new orientation-dependent potentials is even further enhanced by including the 21st anisotropic backbone interaction site.
Discussion
The widely used statistical procedure for building distance-dependent coarse-grained inter-residue statistical potentials (Sippl 1990; Godzik et al. 1995; Lee et al. 1999; Miyazawa and Jernigan 1999b) can be generalized to include orientational effects (Bahar and Jernigan 1996; Buchete et al. 2003). The large and continually increasing number of experimentally derived protein structures available from protein databases (Berman et al. 2000) can be used to extract both distance- and orientation-dependent statistical potentials. Our investigation of relative side chain–side chain orientations in proteins, permits the identification of statistically preferred interaction loci for side chains, independently of their neighboring Cα backbone atoms. In accordance with previously reported results for a backbone-dependent coordination system (Bahar and Jernigan 1996) glycine, serine, and threonine present less complex orientational probability distributions, with fewer peaks than other amino acids (e.g., arginine or isoleucine). Our orientational probability density maps present, in general, more peaks than the orientational distributions of Bahar and Jernigan (1996), but a detailed comparison is not feasible due to the different residue coordination system used in that study.
Our previous tests (Buchete et al. 2003) showed that orientation-dependent potentials are better in discriminating the native folded state from large sets of alternative decoy structures (Samudrala and Levitt 2000), than the radial-only dependent statistical potentials.
In this study, we demonstrated that further improvements can be obtained by including backbone interactions explicitly, and by analyzing and describing coarse-grained, orientation-dependent inter-residue potentials in terms of the coefficients resulting from a spherical harmonic analysis. The statistical data extracted from the PDB structures is used to build orientation-dependent potentials that have sufficient continuity properties to make possible their spherical harmonic analysis. We have constructed and studied a novel distance- and orientation-dependent potential for the 20 amino acid set and an extra anisotropic backbone interaction center. The explicit inclusion of the 21st interaction center on the backbone was motivated by the important backbone–backbone and backbone–side chain contact fractions that can be observed in a representative set of the main protein classes (Pearl et al. 2003). The smooth, continuous potential is described using its spherical harmonic coefficients for short-, medium-, and long-range interactions.
Because the native structures, regardless of their architecture (α, β, or α/β), are stabilized by a substantial number of backbone–side chain and backbone–backbone interactions, it is crucial to account for them in any force field. The ability of the smoothed orientation- and distance-dependent potentials in recognizing the native structures from a large number of decoy sets is greatly enhanced by the inclusion of the virtual interaction center Pep for the backbone. For all decoy sets except for the 4state, the energy Z-scores improve with the potentials used here.
The results of testing the reconstructed potentials on the decoy sets of Samudrala and Levitt (2000) showed that only small differences are introduced by the continuous spherical harmonics treatment with respect to the case when the raw-binned orientational potentials are used. The discriminatory power of the new orientational potentials is strongly improved by considering the 21st anisotropic interaction site in the middle of the peptide bond and it is enhanced even more by the SHA/SHS procedure in a majority of cases. From a computational point of view, there are potential benefits both for free energy calculations and coarse-grained dynamical simulations that use statistical potentials as follows: (1) The memory requirements for storing the spherical harmonic coefficients instead of the raw orientational data are smaller, and (2) the values of the potentials can be reconstructed for any specific values of the θ and φ orientational parameters as smooth and continuous functions over the entire spherical domain. The parameters of the new orientation-dependent potentials are available on request. The novel smoothed distance- and orientation-dependent potentials constructed by spherical harmonic analysis of the statistical data are suited not only for use in protein fold recognition studies, but also could help the development of new large-scale coarse-grained protein simulations using molecular dynamics or Monte Carlo methods.
Materials and methods
Local reference frames of side chains
To get parameters for the orientational dependence of the coarse-grained potentials, it is useful to define local reference frames (LRFs) for each amino acid (Fig. 12 ▶). For any amino acid, a LRF can be constructed by considering at least three noncollinear points (P1, P2, and P3) that uniquely define the orientation of the LRF, and a fourth point (usually denoted by Si for the i-th side chain) that specifies the location of the LRF origin. In the coarse-grained representation, the Si points can be considered as the interaction centers, as all of the relative side chain–side chain distances and orientations are measured with respect to them. The choice of the three points P1, P2, and P3 is important for the following reasons: (1) The reference points should be unambiguously identifiable in all of the side chains, regardless of their particular conformation; (2) they must not be arranged in a collinear configuration; and (3) the positions of the side-chain atoms in the LRF should vary as little as possible for various side-chain conformations of the same amino acid type. The choice of these three reference points is easy for small or relatively rigid amino acids; however, it is more difficult for the relatively large ones that are expected to be quite mobile, with long side chains such as lysine or arginine.
Figure 12.
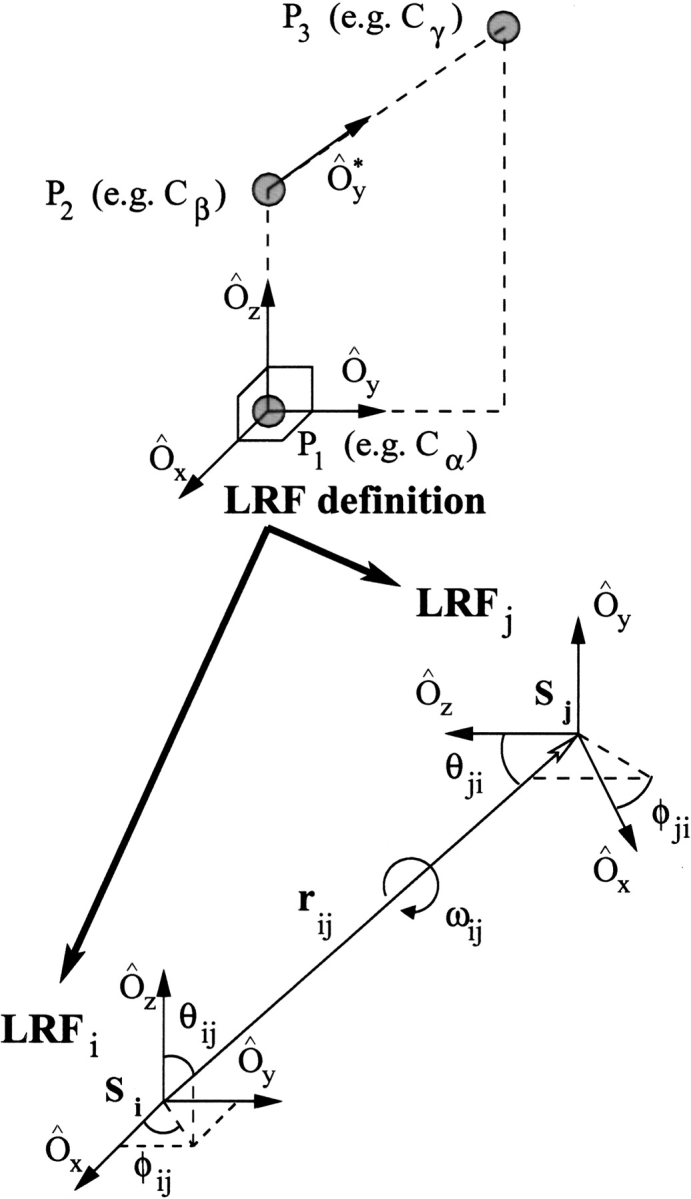
The local reference frames (LRFs) for amino acids. The orthogonal vectors Ôx, Ôy, and Ôz of any LRF can be constructed if three noncollinear points P1, P2, and P3 are specified. If the LRFs of two amino acids (LRFi and LRFj) are known, their relative positions and three-dimensional orientations are described by the parameters rij, θij, φij, θji, φji, and ωij.
Let r→P1, r→P2 , r→P3 , and r→si be the position vectors of the points P1,P2, P3, and Si, respectively (Fig. 12 ▶). The Ôz axis vector can be defined as
 |
(3) |
A second direction Ô*y , pointing toward the Oy axis can be similarly constructed as
 |
(4) |
Finally, the Ôx and Ôy axis vectors are defined in terms of the cross products:
 |
(5) |
For side chains, the positions of the three reference points P1, P2, and P3 are identified with the positions of the Cα, Cα, and Cγ atoms (Buchete et al. 2003). The position of the interaction centers Si are identified with the geometric center (GC) of the heavy atoms in the side chain. Exceptions to these rules are made for the following special cases: (1) For Gly there is no Cβ, so we used the position of the midpoint between the neighboring Ni and Ci atoms on the backbone as P1 and Ciα is taken to be P2 In this way, the local Oz,axis is defined by the bisector of the angle defined by Ni, Ciα and Ci. (2) Because Gly and Ala do not have Cγ atoms, we used the position of the backbone atom Ci as P3. In this way, the local Oy axis is pointing in the direction defined by the backbone atoms Ciα and Ci. (3) For Cys and Ser, the corresponding coordinates of the S and O atoms are substituted for the coordinates of the missing Cγ and are used, therefore, for defining P3. (4) For Ile and Val, the coordinates of the midpoint between the two Cγ atoms are used for P3.
These definitions have the advantage that, whereas being side–chain dependent, the positive Oz axis is always oriented away from the local backbone, whereas the positive Oy axis points toward more remote Cγ atoms in the SC. For small side chains, Oy points toward the next SC on the backbone sequence.
The most important advance made in this study is to introduce a virtual backbone interaction center (Pep) in the middle of the peptide bond. We were motivated to include this as the 21st interaction center on the basis of the analysis of proteins structures that revealed (see Results) that folded structures are stabilized by a substantial number of side chain–backbone contacts. For Pep, the positions of the three reference points P1, P2, and P3 are identified with the positions of the carbonyl C atom, its O atom, and the peptide bond N atom. The interaction center Si for Pep is placed in the middle of its C–N peptide link.
These definitions of the LRFs permit the investigation of relative coordination probabilities (e.g., for hydrogen bonding) as well as of hydropathic effects in side-chain packing.
Data mining: Building the relative orientational probability maps
To extract orientation-dependent potentials from PDB structures, we need to obtain the relative SC–SC, SC–BB, and BB–BB orientational distributions from protein structures (Buchete et al. 2003). This data can be expressed as orientational histograms or, after the corresponding normalization, as relative orientational probability maps that are specific for each pair of amino acids. For the set of nonhomologous proteins used by Scheraga et al. (Liwo et al. 1997a,b, 1998), the orientational histograms were collected using N = 12 bins for the range of the θ angle and two N bins for φ in the corresponding LRFs. Because all of the protein structures analyzed have a resolution of 2 Å or better, the choice of bin sizes ensures a high confidence level of correct angular bin assignment (80% at a distance of at least 4.5 Å; Buchete et al. 2003).
The extracted SC–SC pair frequencies are transformed to SC–SC interaction distance- and orientation-dependent probabilities Pij(r,φ ,θ) by normalization. In the case of three-dimensional orientation-dependent data, the measured frequencies must also be divided by sin(θk) to correct for the smaller volume elements near the poles when k equiangular intervals are used for the θ angle in the corresponding LRF. Because the amount of data available is relatively small for conventional statistical procedures, we used the sparse data correction method (Sippl 1990; Buchete et al. 2003) that builds the correct probability densities as linear combinations between the measured data and the reference, total-probability densities obtained by averaging over all 20 SC types. For the distance- and orientation-dependent probability densities, the sparse data correction formula is
 |
(6) |
where Pij are the actual probability densities obtained from the database for the ij pair of side chains, Pijcorr are the corrected probabilities. The reference probability density, Pref , is constructed by averaging over all the interactions corresponding to all of the types of side chains j that are observed around all of the side chains i. The parameter m′ is related to the actual number of measurements obtained for the ij pair. If m is the number of measurements for the ij pair (Sippl 1990), for considering the orientational dependence, we use a corrected value m′ = m/sin (θk), for k equiangular bins in the θ LRF angle. This is necessary for accounting for the azimuthal dependence of volume elements in spherical coordinates. The constant σ corresponds to how many actual measurements m must be observed such that both the actual probabilities and the reference would have equal weights. We used σ = 1/50 (Hendlich et al. 1990; Sippl 1990; Thomas and Dill 1996).
The orientation-dependent potentials: The Boltzmann device
We used the Boltzmann device (Sippl 1990, 1995) to construct statistical orientational potentials from the orientational probability maps. This approach is based on the assumption that the known protein structures from protein databases, such as PDB (Berman et al. 2000), correspond to classical equilibrium states. The side chain–side chain potentials can therefore be related to position pair distribution functions g(r) by the relation
 |
(7) |
for the distributions depending only on distances. We define a more general distance- and orientation-dependent potential:
 |
(8) |
As mentioned earlier, we use UDO for the statistical potentials that are both distance- and orientation-dependent, and UD for potentials that depend solely on inter-residue distances. As in previous studies (Buchete et al. 2003), we consider the reference pair distribution function gref and reference probability Pref to correspond to radial or angular pair distributions averaged over all 20 residue types. Databases of nonhomologous proteins are necessary for estimating the pair distributions and for extracting amino acid-specific interaction potentials that are consistent with various protein architectures.
Spherical harmonic analysis (SHA) and synthesis (SHS) of discrete potentials defined on spherical domains
The orientational dependence of the new inter-residue coarse-grained potentials can be expressed in terms of functions defined on spherical domains. For each interaction range distances, the angular dependent potentials are functions of the θ and φ polar angles defined in the corresponding local reference frames (LRFs) of the amino acids (Buchete et al. 2003). These potential functions can be decomposed using
 |
(9) |
where Ynm are complex spherical harmonics (Arfken and Weber 1995) and cmn are the expansion coefficients. This formula is valid only for functions U(θ,φ) that have well-behaved continuity properties over the entire angular range. In practice, it is convenient to use a series with real even and odd eigenfunctions, namely,
 |
(10) |
This approach was successfully used for the accurate description of the geomagnetic field of the Earth (Arfken and Weber 1995).
There are several difficulties associated with the numerical spherical harmonics analysis of discrete functions. These problems have been apparent since Neumann (1838) and Gauss (1839) who developed efficient two-step methods for spherical harmonics analysis that use Fourier transforms. In the first step, a numerical Fourier analysis of two-dimensional discrete data can be performed along parallels, due to the orthogonality of the trigonometric base functions (Sneeuw 1994). However, complications arise in the second step of computing spherical harmonic coefficients from the calculated Fourier coefficients due to the loss of orthogonality of Legendre functions at discrete points (Swarztrauber 1979; Sneeuw 1994; Sneeuw and Bun 1996). Problems can also arise from the nonuniform distribution of the discrete data points and the type of grid (equally spaced or Gaussian) that is used when collecting the data.
To overcome these problems, we used the analysis technique developed in Adams and Swarztrauber (1997, 1999), and implemented in the program Spherepack. Although they were initially developed for geophysical processes, we found that the Spherepack routines are general enough and can be used successfully for analyzing the data that we extracted from protein structures. We present below a short review of the numerical spherical harmonic analysis procedure that was performed using Spherepack 3.0 (Adams and Swarztrauber 1999).
Let N be the number of grid points corresponding to sampling the data along the θ angle. We use 2(N − 1) grid points forφ. These sampling points are placed on the following equiangular grid:
 |
(11) |
Assuming that the angular dependent potential function is sufficiently smooth, one can perform its spherical harmonic analysis and find the corresponding coefficients
 |
(12) |
 |
(13) |
where
 |
(14) |
and Pmn are the associated Legendre functions (Arfken and Weber 1995; Adams and Swarztrauber 1997).
Alternatively, if the coefficients anm and bnm are known, one can reconstruct the corresponding smooth potential function U(θ,φ) using the spherical harmonics synthesis formula:
 |
(15) |
The prime notation (Adams and Swarztrauber 1997) on the sum indicates that the first term corresponding to m = 0 must be multiplied by 0.5.
Acknowledgments
This work was supported by the National Institutes of Health R01 NS41356-01 (J.E.S. and D.T.), the National Science Foundation CHE-9975494 (J.E.S.), and CHE-0209340 (D.T.). The authors are grateful to the Center for Scientific Computing and Visualization at Boston University for computational resources. The data visualization was carried out using VMD (Humphrey et al. 1996), Raster3D (Merritt and Bacon 1997), and Matlab (The Mathworks, Inc.).
The publication costs of this article were defrayed in part by payment of page charges. This article must therefore be hereby marked “advertisement” in accordance with 18 USC section 1734 solely to indicate this fact.
Article and publication are at http://www.proteinscience.org/cgi/doi/10.1110/ps.03488704.
References
- Adams, J.C. and Swarztrauber, P.N. 1997. Spherepack 2.0: A model development facility. NCAR Tech. Note NCAR/TN-436-STR.
- ———. 1999. Spherepack 3.0: A model development facility. Monthly Weather Rev. 127 1872–1878. [Google Scholar]
- Arfken, G.B. and Weber, H.J. 1995. Mathematical methods for physicists, 4th ed. Academic Press, San Diego, CA.
- Bagci, Z., Jernigan, R.L., and Bahar, I. 2002a. Residue coordination in proteins conforms to the closest packing of spheres. Polymer 43 451–459. [Google Scholar]
- ———. 2002b. Residue packing in proteins: Uniform distribution on a coarse-grained scale. J. Chem. Phys. 116 2269–2276. [Google Scholar]
- Bahar, I. and Jernigan, R.L. 1996. Coordination geometry of nonbonded residues in globular proteins. Fold. Des. 1 357–370. [DOI] [PubMed] [Google Scholar]
- ———. 1997. Inter-residue potentials in globular proteins and the dominance of highly specific hydrophilic interactions at close separation. J. Mol. Biol. 266 195–214. [DOI] [PubMed] [Google Scholar]
- Bahar, I., Kaplan, M., and Jernigan, R.L. 1997. Short-range conformational energies, secondary structure propensities, and recognition of correct sequence-structure matches. Proteins 29 292–308. [DOI] [PubMed] [Google Scholar]
- Berman, H.M., Westbrook, J., Feng, Z., Gilliland, G., Bhat, T.N., Weissig, H., Shindyalov, I.N., and Bourne, P.E. 2000. The Protein Data Bank. Nucleic Acids Res. 28 235–242. [DOI] [PMC free article] [PubMed] [Google Scholar]
- Buchete, N.-V., Straub, J.E., and Thirumalai, D. 2003. Anisotropic coarse-grained statistical potentials improve the ability to identify native-like protein structures. J. Chem. Phys. 118 7658–7671. [Google Scholar]
- Fain, B., Xia, Y., and Levitt, M. 2001. Determination of optimal Chebyshev-expanded hydrophobic discrimination function for globular proteins. IBM J. Res. Dev. 45 525–532. [Google Scholar]
- Godzik, A., Kolinski, A., and Skolnick, J. 1995. Are proteins ideal mixtures of amino-acids? Analysis of energy parameter sets. Protein Sci. 4 2107–2117. [DOI] [PMC free article] [PubMed] [Google Scholar]
- Hendlich, M., Lackner, P., Weitckus, S., Floeckner, H., Froschauer, R., Gottsbacher, K., Casari, G., and Sippl, M.J. 1990. Identification of native protein folds amongst a large number of incorrect models: The calculation of low energy conformations from potentials of mean force. J. Mol. Biol. 216 167–180. [DOI] [PubMed] [Google Scholar]
- Humphrey, W., Dalke, A., and Schulten, K. 1996. VMD—Visual Molecular Dynamics. J. Mol. Graphics 14 33–38. [DOI] [PubMed] [Google Scholar]
- Keasar, C. and Levitt, M. 2003. A novel approach to decoy set generation: Designing a physical energy function having local minima with native structure characteristics. J. Mol. Biol. 329 159–174. [DOI] [PMC free article] [PubMed] [Google Scholar]
- Lee, J., Liwo, A., and Scheraga, H.A. 1999. Energy-based de novo protein folding by conformational space annealing and an off-lattice united-residue force field: Application to the 10–55 fragment of staphylococcal protein A and to Apo Calbindin D9K. Proc. Natl. Acad. Sci. 96 2025–2030. [DOI] [PMC free article] [PubMed] [Google Scholar]
- Levitt, M. 1992. Accurate modeling of protein conformation by automatic segment matching. J. Mol. Biol. 226 507–533. [DOI] [PubMed] [Google Scholar]
- Liwo, A., Oldziej, S., Pincus, M.R., Wawak, R.J., Rackovsky, S., and Scheraga, H.A. 1997a. A united-residue force field for off-lattice protein-structure simulations. I. Functional forms and parameters of long-range side-chain interaction potentials from protein crystal data. J. Comput. Chem. 18 849–873. [Google Scholar]
- Liwo, A., Pincus, M.R., Wawak, R.J., Rackovsky, S., Oldziej, S., and Scheraga, H.A. 1997b. A united-residue force field for off-lattice protein-structure simulations. II. Parameterization of short-range interactions and determination of weights of energy terms by Z-score optimization. J. Comput. Chem. 18 874–887. [Google Scholar]
- Liwo, A., Kazmierkiewicz, R., Czaplewski, C., Groth, M., Oldziej, S., Wawak, R.J., Rackovsky, S., Pincus, M.R., and Scheraga, H.A. 1998. United-residue force field for off-lattice protein-structure simulations: III. Origin of backbone hydrogen-bonding cooperativity in united-residue potentials. J. Comput. Chem. 19 259–276. [Google Scholar]
- Meller, J., Wagner, M., and Elber, R. 2002. Maximum feasibility guideline in the design and analysis of protein folding potentials. J. Comput. Chem. 23 111–118. [DOI] [PubMed] [Google Scholar]
- Merritt, E.A. and Bacon, D.J. 1997. Raster3D: Photorealistic molecular graphics. Method. Enzymol. 277 505–524. [DOI] [PubMed] [Google Scholar]
- Miyazawa, S. and Jernigan, R.L. 1985. Estimation of effective interresidue contact energies from protein crystal structures: Quasi-chemical approximation. Macromolecules 18 534–552. [Google Scholar]
- ———. 1999a. Evaluation of short-range interactions as secondary structure energies for protein fold and sequence recognition. Proteins 36 347–356. [PubMed] [Google Scholar]
- ———. 1999b. Self-consistent estimation of inter-residue protein contact energies based on an equilibrium mixture approximation of residues. Proteins 34 49–68. [DOI] [PubMed] [Google Scholar]
- Orengo, C.A., Michie, A.D., Jones, S., Jones, D.T., and Thornton, J.M. 1997. CATH—A hierarchic classification of protein domain structures. Structure 51093–1108. [DOI] [PubMed] [Google Scholar]
- Park, B. and Levitt, M. 1996. Energy functions that discriminate X-ray and near native folds from well-constructed decoys. J. Mol. Biol. 258 367–392. [DOI] [PubMed] [Google Scholar]
- Park, B., Huang, E.S., and Levitt, M. 1997. Factors affecting the ability of energy functions to discriminate correct from incorrect folds. J. Mol. Biol. 266 831–846. [DOI] [PubMed] [Google Scholar]
- Pearl, F.M.G., Lee, D., Bray, J.E., Sillitoe, I., Todd, A.E., Harrison, A.P., Thornton, J.M., and Orengo, C.A. 2000. Assigning genomic sequences to CATH. Nucleic Acids Res. 28 277–282. [DOI] [PMC free article] [PubMed] [Google Scholar]
- Pearl, F.M.G., Bennett, C.F., Bray, J.E., Harrison, A.P., Martin, N., Shepherd, A., Sillitoe, I., Thornton, J.M., and Orengo, C.A. 2003. The CATH database: An extended protein family resource for structural and functional genomics. Nucleic Acids Res. 31 452–455. [DOI] [PMC free article] [PubMed] [Google Scholar]
- Samudrala, R. and Levitt, M. 2000. Decoys ‘R’ Us: A database of incorrect conformations to improve protein structure prediction. Protein Sci. 9 1399–1401. [DOI] [PMC free article] [PubMed] [Google Scholar]
- Simons, K.T., Kooperberg, C., Huang, E.S., and Baker, D. 1997. Assembly of protein tertiary structures from fragments with similar local sequences using simulated annealing and Bayesian scoring functions. J. Mol. Biol. 268 209–225. [DOI] [PubMed] [Google Scholar]
- Sippl, M.J. 1990. Calculation of conformational ensembles from potentials of mean force. J. Mol. Biol. 213 859–883. [DOI] [PubMed] [Google Scholar]
- ———. 1995. Knowledge-based potentials for proteins. Curr. Opin. Struct. Biol. 5 229–235. [DOI] [PubMed] [Google Scholar]
- Skolnick, J., Jaroszewski, L., Kolinski, A., and Godzik, A. 1997. Derivation and testing of pair potentials for protein folding. When is the quasichemical approximation correct? Protein Sci. 6 1–13. [DOI] [PMC free article] [PubMed] [Google Scholar]
- Skolnick, J., Kolinski, A., and Ortiz, A. 2000. Derivation of protein-specific pair potentials based on weak sequence fragment similarity. Proteins 38 3–16. [PubMed] [Google Scholar]
- Sneeuw, N. 1994. Global spherical harmonic analysis by least-squares and numerical quadrature methods in historical perspective. Geophys. J. Int. 118 707–716. [Google Scholar]
- Sneeuw, N. and Bun, R. 1996. Global spherical harmonic computation by two-dimensional Fourier methods. J. Geodesy 70 224–232. [Google Scholar]
- Swarztrauber, P.N. 1979. On the spectral approximation of discrete scalar and vector functions on the sphere. SIAM J. Numer. Anal. 16 934–949. [Google Scholar]
- Tanaka, S. and Scheraga, H.A. 1976. Medium- and long-range interaction parameters between amino acids for predicting three-dimensional structures of proteins. Macromolecules 9 945–950. [DOI] [PubMed] [Google Scholar]
- Thomas, P.D. and Dill, K.A. 1996. Statistical potentials extracted from protein structures: How accurate are they? J. Mol. Biol. 257 457–469. [DOI] [PubMed] [Google Scholar]
- Tobi, D. and Elber, R. 2000. Distance-dependent, pair potential for protein folding: Results from linear optimization. Proteins 41 40–46. [PubMed] [Google Scholar]
- Tobi, D., Shafran, G., Linial, N., and Elber, R. 2000. On the design and analysis of protein folding potentials. Proteins 40 71–85. [DOI] [PubMed] [Google Scholar]


