

Abstract
The changes in excitability of cutaneous afferents in the median nerve of healthy subjects were compared during 13 min of ischaemia and during 13 min continuous depolarizing DC. In addition, intermittent polarizing currents were used to compensate for or to accentuate the threshold change produced by ischaemia. Measurements were made alternately of the ischaemic (or current-induced) changes in threshold, refractoriness and, in some experiments, supernormality. The strength-duration time constant (τSD) was calculated from the thresholds to test stimuli of different duration. During ischaemia for 13 min, the threshold decreased steadily by 34 % over the initial 8 min, reached a plateau and increased slightly over the final few minutes. However, with continuous depolarizing DC, the threshold decreased linearly with the applied current, by 55 % with strong current ramps. Intermittent injection of hyperpolarizing DC was used to compensate for the ischaemic threshold change, but the compensating current increased progressively and did not reach a plateau as had occurred with the ischaemic threshold change. During ischaemia, τSD increased to a plateau, following the threshold more closely than the current required to compensate for threshold. Refractoriness, on the other hand, increased more steeply than the applied compensating current. There were similar discrepancies in the relationships of τSD and refractoriness to supernormality. The smaller-than-expected threshold change during ischaemia could result from limitations on the change in excitability produced by ischaemic metabolites acting on the gating and/or permeability of Na+ channels. Intermittent depolarizing DC was applied during the ischaemic depolarization to determine whether it would reduce or accentuate the discrepancies noted during ischaemia alone. The extent of the threshold change was greater than with ischaemia alone, and there was a greater change in τSD and a proportionately smaller change in refractoriness. It is concluded that ischaemia produces factors that can block Na+ channels and/or alter their gating. Without these processes, the ischaemic change in threshold would be much greater than that actually recorded, probably sufficient to produce prominent ectopic impulse activity.
Accommodation to depolarizing currents is generally attributed to a slow K+ conductance (Baker et al. 1987) but during ischaemia accommodation is enhanced and its major cause becomes inactivation of Na+ channels (Baker & Bostock, 1989). Recent studies have suggested that, in addition to the effects of membrane potential on channel function, ischaemia generates a metabolite that accumulates as ischaemia develops and is capable of altering the gating of Na+ channels, specifically affecting their recovery from inactivation (Grosskreutz et al. 1999, 2000).
Inactivation would reduce the availability of Na+ channels for action potential generation, thereby limiting the extent of the change in excitability produced by ischaemic depolarization, but doing so without limiting the extent of the ischaemic change in membrane potential. However, reduced availability of Na+ channels could also be due to a metabolite blocking the channel. Indeed, H+, a potential candidate for the putative ischaemic metabolite, can block Na+ channels by binding within the pore so preventing Na+ permeation (Begenisich & Danko, 1983; Mozhayeva et al. 1984; Daumas & Andersen, 1993) or by altering the surface charge at the pore entrance (Hille et al. 1975). In addition, H+ can alter channel gating (Carbone et al. 1981). Importantly, inactivation is decreased by high intra-axonal pH (Carbone et al. 1981), while the channel blockade is voltage dependent, and not affected by the presence of the inactivation gate (Wanke et al. 1980). In addition, late Na+ currents (i.e. currents that inactivate slowly, if at all) may be blocked by lowering pH (Baker & Bostock, 1999), and this may be due to an alteration in the mode of gating of the Na+ channels responsible for the late current.
The present study was undertaken to shed further light on the disturbance of Na+ channel function that occurs in vivo during prolonged ischaemia of human cutaneous afferents, seeking evidence whether the dysfunction involves reduced channel permeability, impaired channel gating or both. By defining discrepancies in the behaviour of different indices of axonal excitability during ischaemia, it was hoped to shed light on the properties of the putative ischaemic metabolite.
METHODS
The present report is based on four sets of experiments on healthy subjects using threshold tracking to measure the changes in excitability of human cutaneous afferents during continuous depolarizing DC ramps lasting 13 min, during ischaemia for 13 min, or during ischaemia for 13 min with intermittent polarizing DC designed to compensate for or to accentuate the ischaemic change in threshold. The subjects gave informed written consent to the experimental procedures, which were approved by the Committee on Experimental Procedures Involving Human Subjects, of the University of New South Wales, and were performed in accordance with the Declaration of Helsinki.
The compound sensory action potential (CSAP) of cutaneous afferents in the median nerve was recorded antidromically from the index finger in response to stimulation of the median nerve at the wrist, as described previously (Grosskreutz et al. 1999, 2000). An IBM-compatible computer running the QTRAC threshold-tracking program (copyright Professor H. Bostock, Institute of Neurology, Queen Square, London, UK) was used to deliver different stimuli or stimulus combinations in a regularly repeating sequence, one stimulus every 0.5–1 s. On the first ‘stimulus channel’, a supramaximal stimulus was delivered to produce a maximal CSAP. On the other stimulus channels, the intensity of the test stimulus was adjusted by the computer using ‘proportional tracking’ (Bostock et al. 1998) to keep the test CSAP at 50 % of maximum (i.e. 50 % of that recorded on channel 1). With proportional tracking, the change in stimulus current was proportional to the size of the error between the target CSAP and the CSAP recorded in the immediately preceding stimulus cycle.
The current required to produce a CSAP with an amplitude 50 % of maximum is referred to as the ‘threshold’ for the CSAP. The strength-duration time constant (τSD) was determined from the thresholds obtained with unconditioned test stimuli of 0.1 and 1.0 ms duration (I0.1 and I1.0, respectively), in accordance with Weiss' formula (Mogyoros et al. 1997; Bostock et al. 1998; Grosskreutz et al. 1999, 2000). ‘Refractoriness’ was measured by sampling the relatively refractory period following a maximal nerve volley at a conditioning-test interval of 2 ms, and was expressed as the percentage increase in current required to produce the 50 % CSAP. ‘Supernormality’ was measured in some experiments as the decrease in threshold 7 ms after a maximal volley, this conditioning-test interval being that at which the increase in excitability during the supernormal period is normally maximal. To measure the conditioned CSAP uncontaminated by the response to the conditioning stimulus, the maximal CSAP recorded in response to the supramaximal stimulus on the first channel was subtracted on-line from the response to the conditioning and test pair.
In eight subjects, the responses to ischaemia for 13 min were measured using a sphygmomanometer cuff inflated to 200 mmHg around the upper arm. In six subjects, a continuous depolarizing current ramp was delivered to the median nerve through the stimulating electrodes (cathode over the nerve at the wrist and anode over forearm muscle, 10–15 cm proximally). In all six subjects, the strength of the continuous current increased linearly to a maximum of 30 % of resting I1.0 over 13 min. In some of these subjects, similar experiments were performed with stronger current ramps (up to 80 % of resting I1.0 over 13 min).
In five subjects, during ischaemia for 13 min, hyperpolarizing current was injected into the nerve at the wrist, the intensity being adjusted by the computer to negate the decrease in threshold produced by ischaemic depolarization (Grosskreutz et al. 2000). The pre-ischaemic threshold was measured using 1.0 ms test stimuli. A fixed 1 ms stimulus of this intensity was then added to a current of variable intensity and fixed duration (30, 120 or 220 ms in different experiments), in each case 20 ms before the end of the variable current. The intensity of the variable current was controlled by the computer using proportional tracking so that the superimposed fixed 1.0 ms stimulus produced a CSAP of the target amplitude (50 % of maximum). The results were similar whether the injected hyperpolarizing current was brief (30 ms) or long (120 and 220 ms), and only the data for the experiments using the 30 ms current are illustrated here. Further details are given in Grosskreutz et al. (2000).
In five subjects, during ischaemia for 13 min, depolarizing current was injected to increase the degree of depolarization. The DC pulse lasted 220 ms and the test stimulus was delivered 20 ms before the end of the pulse. The strength of the current increased linearly every six stimulus cycles to a maximum of 30 % of resting I1.0 after 13 min. In these experiments, excitability was measured in the presence and absence of the injected current.
In all experiments skin temperature was monitored continuously using sensors at the wrist and the first metacarpophalangeal joint and kept above 32 °C using blankets and radiant heat, if necessary.
RESULTS
In different experiments, threshold, refractoriness and τSD were observed during (i) ischaemia for 13 min, (ii) continuous depolarizing current ramps lasting 13 min, (iii) ischaemia with intermittent hyperpolarizing DC sufficient to compensate for the ischaemic change in threshold, and (iv) ischaemia with intermittent depolarizing DC designed to accentuate the ischaemic change in threshold. These indices of axonal excitability were chosen because, under normal circumstances, they depend on different aspects of Na+ channel function: threshold, activation of the immediately available pool of Na+ channels; refractoriness, recovery from inactivation of transient Na+ channels; the voltage dependence of τSD, Na+ channels that inactivate slowly, i.e. ‘persistent’ Na+ channels (see Bostock & Rothwell, 1997; Bostock et al. 1998).
Threshold changes during ischaemia and during continuous depolarizing DC
With ischaemia, threshold (i.e. I1.0) decreased by 34 %, with the maximal threshold reduction ∼8 min after the onset of ischaemia. Over the subsequent 5 min, the threshold increased slightly, on average by 4 % (Fig. 1A). Refractoriness continued to increase throughout ischaemia, but τSD increased, reached a plateau level and then decreased slightly. By contrast, with depolarizing DC each index of excitability changed progressively, without a tendency to plateau, throughout the 13 min current injection (Fig. 1B).
Figure 1. Changes in amplitude and excitability indices during ischaemia and continuous depolarizing DC for 13 min.
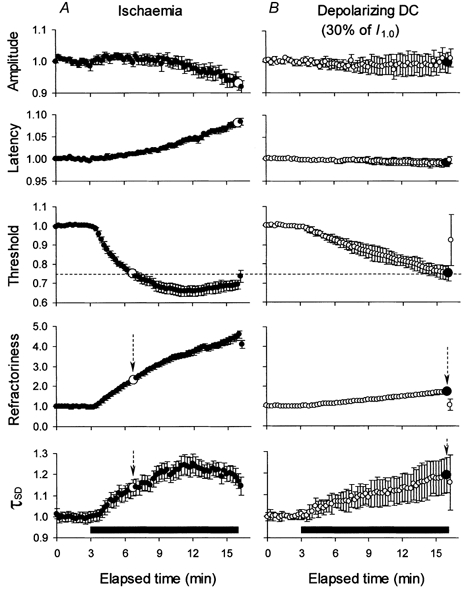
The data in A illustrate changes during ischaemia (means ± s.e.m., n = 8). Threshold decreased during ischaemia but, like τSD, reached a plateau after ∼8 min. Refractoriness continued to increase steadily throughout the 13 min. The data in B illustrate changes during a continuous depolarizing DC ramp, to a maximum of 30 % of resting I1.0 (means ± s.e.m., n = 6). There were continuous changes in each index of excitability without plateau, no decrease in maximal amplitude and no increase in latency. For the same change in threshold (indicated by the dashed horizontal line), there was a much greater increase in refractoriness and a slightly smaller increase in τSD in A than in B (see arrows and the large symbols). Note the decrease in the maximal sensory potential during ischaemia (A) but not during DC (B). The horizontal filled bars indicate the period of ischaemia (A) and depolarizing DC (B). All data were normalized to a pre-ischaemic control level of unity before averaging.
The maximal threshold reduction was 34.2 ± 2.68 % (mean ± s.e.m., n = 8) during ischaemia. Continuous depolarizing current designed to mimic the threshold reduction seen during ischaemia decreased the threshold by 25.0 ± 4.2 % (n = 6) by the end of the DC ramp. This depolarization increased refractoriness, but only by 74.3 % while, for the same decrease in threshold during ischaemia (25 %), refractoriness increased by 133 % (see vertical arrows in Fig. 1). On the other hand there was a slightly greater increase in τSD during the current ramp than during ischaemia (by 19.1 versus 13.8 %, respectively) for the same threshold change. In addition, the amplitude of the maximal CSAP decreased by 7.1 ± 2.2 % during ischaemia for 13 min and its latency increased by 8.0 ± 0.8 %, but these measures did not change during the current ramp.
To determine whether the decrease in threshold represented the maximal change that the threshold could undergo, continuous ramps of DC of different intensity were delivered in different experiments to four subjects. Figure 2 shows the data for experiments in two of these subjects in whom the current ramp increased to 80 % of resting I1.0 over 13 min, together with their data for the 13 min ischaemia. During ischaemia the threshold decrease was maximal at 40.8 % after ∼8 min in subject 1 and 41.5 % after 6.5 min in subject 2. In subject 1, this was associated with a progressive increase in refractoriness (as in Fig. 1) to almost 400 % of control but, in subject 2, the ischaemic increase in refractoriness was extreme (> 600 %) and there was a clear plateau in its time course. The 80 % DC ramps produced similar threshold reductions after a similar time, but the threshold continued to decrease as the depolarizing ramp continued to increase so that, after 13 min, it had decreased by 55.2 % in subject 1 and 56.8 % in subject 2. However, even though the DC ramp produced a greater threshold reduction, the increase in refractoriness was less than that during ischaemia for both subjects.
Figure 2. Comparison of the changes in amplitude, threshold and refractoriness produced by ischaemia and a continuous DC ramp in two subjects.
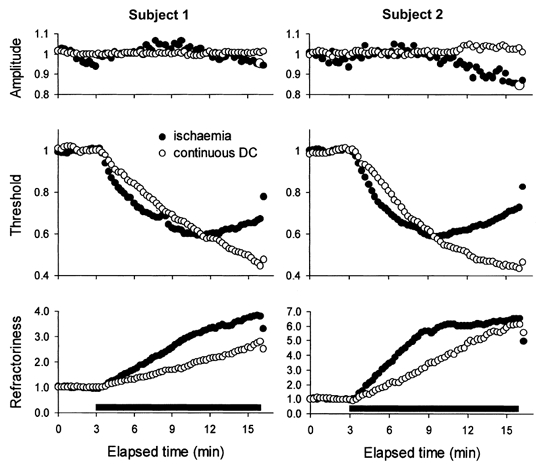
In both subjects, continuous depolarizing DC to a maximum of 80 % of resting I1.0 (○) produced a much greater decrease in threshold but a smaller increase in refractoriness than ischaemia (•). In subject 2, there was a prominent increase in refractoriness, which reached a plateau at > 600 %. Note the absence of a change in the maximal sensory potential during the DC. Data were recorded in different experiments and were normalized to a pre-ischaemic control level of unity before averaging.
These results suggest that, during ischaemia, there is a limitation on the extent of the change in threshold (and the change in τSD) and a greater than expected change in refractoriness.
Divergence of threshold from compensating current
Three sets of experiments were performed on five subjects using intermittent hyperpolarizing current to compensate for the ischaemic decrease in threshold. The results below were the same whether the injected hyperpolarizing current was brief (30 ms) or long (120 and 220 ms), and only the data for the five experiments using the brief current are presented below (Figs 3–6). In each instance, effective compensation for the threshold change was achieved, so that the profile of the current required to return the threshold to the pre-ischaemic level could be measured intermittently throughout the 13 min of ischaemia. The efficacy of the threshold compensation is illustrated in Fig. 3A, and the compensating current used in these five experiments is shown in Fig. 3B. The compensating current continued to increase throughout ischaemia for 13 min.
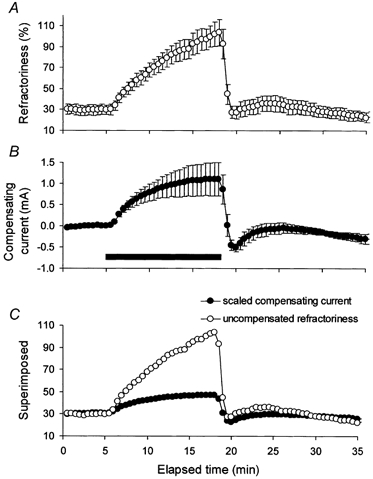
Figure 3. Compensation for the change in threshold during ischaemia.
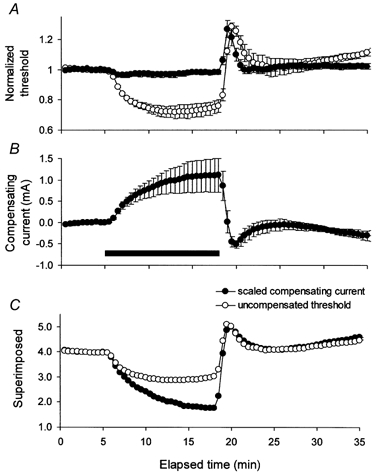
A, the change in threshold during ischaemia for 13 min in the absence (○) and presence (•) of intermittent hyperpolarizing DC of 30 ms duration to compensate for the threshold change (mean data for 5 subjects ± s.e.m.). Here and in Figs 7A and 8A, threshold data were normalized to a pre-ischaemic control level of unity. B, the intermittent compensating current (•), effective in controlling the threshold change except at the onset of ischaemia and on its release. C, superimposition of threshold and compensating current, after the latter was scaled, as detailed in the text, and inverted. Threshold underwent a proportionately smaller change than the current required to compensate for the threshold change. In this and subsequent figures, the horizontal filled bar indicates the period of ischaemia.
Figure 6. The change in supernormality during ischaemia.
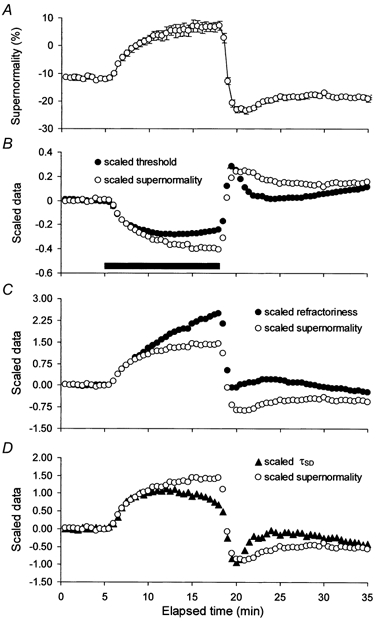
A, the change in supernormality from the experiments in Figs 3–5 (means ± s.e.m.). In B-D, supernormality was scaled (much as was the compensating current in Figs 3–5) and plotted on the same axes as threshold, refractoriness and τSD (after inversion in B). There were proportionately smaller changes in threshold (B), and τSD (D) but greater change in refractoriness (C).
As expected from the data in Fig. 3A and B, the relationship between the ischaemic change in threshold and the current required to compensate for it was not linear, and this is illustrated in Fig. 3C. Using plots of the uncompensated threshold (Fig. 3A, ○) against the compensating current (Fig. 3B), linear regression was fitted to the pre-ischaemic data and the first few data points during ischaemia. The resultant regression equation was then used to scale the compensating current to be of a magnitude comparable to the threshold change. In doing so, both the slope and the intercept on the Y-axis were adjusted iteratively so that the difference plot remained zero for the pre-ischaemic data. In Fig. 3C, the scaled compensating current was inverted and superimposed on the uncompensated threshold. The data were qualitatively similar for compensating currents of different duration (30, 120 and 220 ms).
Ischaemia began at 5 min. The threshold did not change for the first 0.5 min. The divergence between threshold and compensating current began at ∼6 min and increased progressively at much the same rate throughout ischaemia (Fig. 3C). At the end of ischaemia, the threshold was 25 % below the pre-ischaemic level. However, if it had followed the compensating current, the threshold would have decreased by ∼56 % of the pre-ischaemic level after 13 min rather than by 25 %. The divergence between threshold and compensating current is reminiscent of the different profiles of threshold during ischaemia and during depolarizing DC (Fig. 1 and Fig. 2). A reduction in the number of functioning Na+ channels during ischaemia could produce these discrepancies.
Figure 4 and Figure 5, respectively, show similar analyses for refractoriness and τSD as the experiments in Fig. 3, when the compensating current effectively controlled threshold. Refractoriness increased during ischaemia (Fig. 4A) but, unlike the threshold change (Fig. 3A), refractoriness continued to increase at much the same rate throughout the 13 min period of ischaemia, while the rate of increase of the compensating current slowed over the same period. In other words, the increase in refractoriness exceeded that expected from the compensating current. At the end of ischaemia it had increased to 103.8 % but it would have reached 47.1 % if it had followed the compensating current. As in previous experiments, τSD increased during ischaemia but, like the threshold, it reached a plateau and then decreased slightly (Fig. 5A). There was divergence between τSD and the scaled compensating current (Fig. 5C), such that, at the end of ischaemia, τSD was 591 μs, but it would have reached 723 μs if it had followed the compensating current.
Figure 4. The change in refractoriness during ischaemia.
A, the change in refractoriness during ischaemia for 13 min (mean data for 5 subjects ± s.e.m. from the experiments in Fig. 3). B, the intermittent compensating current of 30 ms duration (same data as in Fig. 3B). C, superimposition of refractoriness and compensating current, after the latter was scaled, as detailed in the text. Refractoriness underwent a proportionately greater change than the current required to compensate for the threshold change.
Figure 5. The change in strength-duration time constant (τSD) during ischaemia.
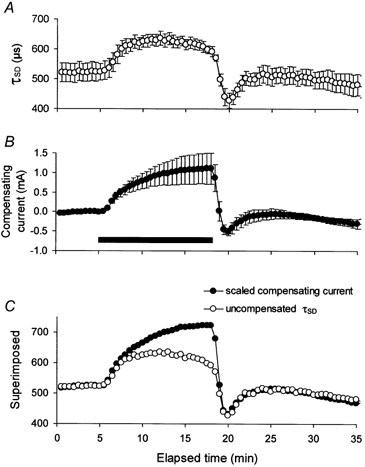
A, the change in τSD during ischaemia for 13 min (mean data for 5 subjects ± s.e.m. from the experiments in Fig. 3). B, the intermittent compensating current of 30 ms duration (same data as in Fig. 3B). C, superimposition of τSD and compensating current, after the latter was scaled, as detailed in the text. τSD underwent a proportionately smaller change than the current required to compensate for the threshold change.
Divergence of threshold from supernormality
As addressed in Discussion, the voltage dependence of supernormality is due largely to the voltage dependence of paranodal fast K+ channels (Baker et al. 1987; David et al. 1995; Bostock et al. 1998), such that the ischaemic changes in supernormality should be less affected by processes that depend primarily on Na+ channel function than other indices of axonal excitability. Unlike threshold, refractoriness and τSD, the profile of the ischaemic change in supernormality was similar to that of the current required to compensate for the ischaemic change in threshold (compare Fig. 6A and Fig. 3B). As a result, the scaled changes in threshold and τSD were less than the scaled change in supernormality (Fig. 6B and D), and the scaled refractoriness was greater (Fig. 6C).
Accepting that no one index can accurately reflect membrane potential, the totality of the findings thus far presented are consistent with disproportionately greater refractoriness coupled with lesser changes in threshold and τSD during ischaemia than would be expected for the probable change in membrane potential (see Discussion).
Ischaemia with intermittent depolarizing DC
The measures of Na+ channel function discussed above, including refractoriness, would change in the direction described if ischaemia decreased the pool of available Na+ channels (see Discussion). If this were the cause of the above discrepancies, the underlying mechanism could be either Na+ channel blockade or Na+ channel inactivation, the latter of necessity involving ultra-slow inactivation. However, Na+ channel block by potential ischaemic metabolites may be reversible with depolarization (for example see Wanke et al. 1980; Begenisich & Danko, 1983; Mozhayeva et al. 1984; Daumas & Andersen, 1993). In other words, if channel blockade was a factor, the injection of depolarizing current during ischaemia might reduce the threshold by more than during ischaemia alone, and produce a less marked increase in refractoriness and a greater increase in τSD.
In five subjects, depolarizing current pulses lasting 220 ms were injected during ischaemia, the strength of the pulses being increased every 30 s during ischaemia to a maximum of 30 % of resting I1.0 by 13 min. The duration of the pulses was sufficiently long to allow adequate time for removal of slow inactivation or of the putative channel blockade. Recordings were made alternately of the changes in sensory potentials and their thresholds during ischaemia alone and during ischaemia plus depolarizing current pulse in the same sequence.
The decrease in threshold was greater during ischaemia plus depolarizing current pulse than during ischaemia alone (46.5 ± 3.9 versus 35.4 ± 4.9 %; Fig. 7A). In addition, the increase in τSD was 100 μs greater during ischaemia plus depolarizing current pulse than during ischaemia alone (Fig. 7C). However, the slope of the relationship between τSD and axonal excitability was almost identical during ischaemia (0.3014) and during ischaemia plus depolarization (0.3035).
Figure 7. The effect of intermittent depolarizing DC on different parameters of axonal excitability during ischaemia.
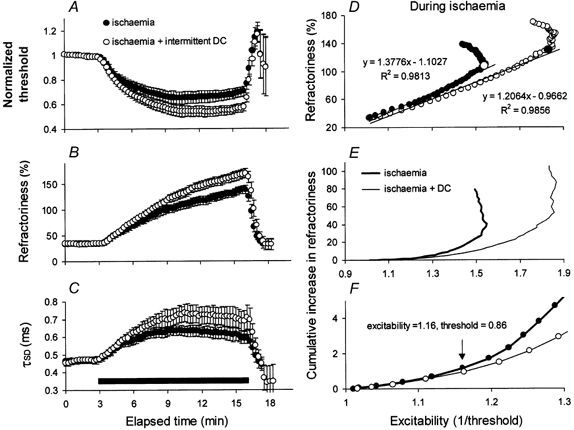
Mean data for five subjects (±s.e.m.) during ischaemia (•) and ischaemia plus intermittent depolarizing DC (○). With the additional DC there was a greater threshold decrease (A), a greater increase in refractoriness (B), and a greater increase in τSD (C). D, relationship between refractoriness and excitability (i.e. the reciprocal of threshold) during ischaemia for the data in A and B. The relationships were initially reasonably linear, and linear regression lines were fitted, up to the points indicated by the large symbols. There was proportionately less refractoriness for the data with additional intermittent depolarizing DC even though there was a greater absolute increase in refractoriness in B. E and F illustrate the relationship between the cumulative increase in refractoriness and excitability (ischaemia: thick line; ischaemia + DC: thin line). The data began to differ when the excitability increased by 16 % (i.e. when the threshold decreased to 86 %).
Refractoriness was greater during ischaemia plus depolarizing current than during ischaemia alone (Fig. 7B). However, this was expected because the change in threshold was greater. The change in refractoriness was less than expected relative to the change in threshold (Fig. 7D-F). In Fig. 7D, the ischaemic change in refractoriness is plotted against axonal excitability (calculated as the reciprocal of threshold). While the excitability change was greater with ischaemia plus depolarization, the data for refractoriness were shifted to the right. Linear regression was fitted to the approximately linear initial part of each relationship (i.e. up to the large open circle for ischaemia alone and the large filled circle for ischaemia plus depolarization). The slopes of the regression lines were significantly different (P (same slope) < 0.001). To illustrate the divergence of the plots of refractoriness versus excitability, Fig. 7E shows cumulative sums of the changes in refractoriness, and Fig. 7F the same data on expanded axes. The plots began to diverge at an excitability of 1.16 (equivalent to a threshold reduction of 14 %).
In one subject, continuous DC was injected during ischaemia, the experiment being terminated after 10 min. Figure 8 shows the data from this experiment together with the data from Fig. 2 (subject 2) for separate experiments on the same subject using ischaemia alone and a continuous DC ramp alone. Again, the depolarizing current either alone or in combination with ischaemia produced greater changes in threshold and τSD than during ischaemia alone. Ischaemia plus DC produced a greater change in refractoriness but, as shown in Fig. 8D (and on expanded axes in Fig. 8E) the increase in refractoriness was less than would be expected for the greater change in excitability. The slopes of linear parts of the relationships were significantly different (P (same slope) < 0.001), the current injection during ischaemia being almost sufficient to return the relationship to that seen with DC alone (compare open circles and open triangles in Fig. 8D).
Figure 8. Comparison between the changes produced by ischaemia (•), a continuous DC ramp (○) and ischaemia plus continuous DC (▵) for one subject.
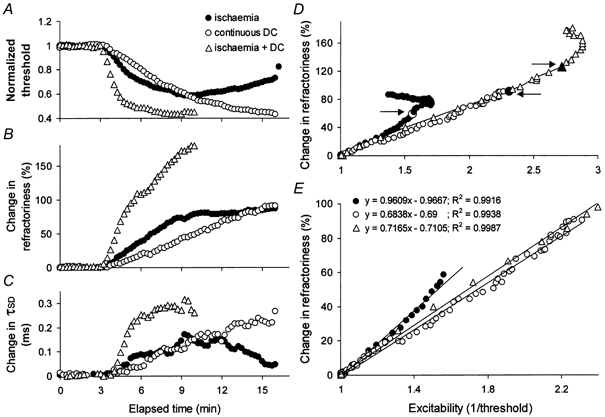
The data in Fig. 2 (for subject 2) are superimposed on the changes produced by ischaemia plus continuous depolarizing DC. Ischaemia + DC produced the greatest decrease in threshold (A) and the greatest increases in refractoriness (B) and τSD (C). D and E, the relationships between the change in refractoriness and excitability indicate that for the same change in excitability the change in refractoriness was greatest for ischaemia alone. Linear regression lines were fitted up to the large symbols indicated by the arrows in D. E shows the same data as in D on expanded axes.
It is concluded that the limitations on the extent of the ischaemic changes in threshold and τSD can be partially overcome and the disproportionately greater ischaemic increase in refractoriness can be partially reversed by injecting depolarizing current.
DISCUSSION
A plausible explanation for the present findings is that there is a discrepancy between the change in excitability produced by ischaemia and the ischaemic change in membrane potential, and that this discrepancy is probably due to a change in gating or blockage of Na+ channels, both transient and persistent, by an ischaemic metabolite. The discussion focuses on the validity of different indicators of membrane potential in intact human axons, the physiological consequences of rendering axons ischaemic, the effects of reducing the number of available Na+ channels, and whether any such reduction is likely to be due to a change in gating and/or to blockade of the pore of the channel by the putative metabolite. It will be suggested below that the behaviour of threshold under the different conditions is consistent with the effects of lowered pH on Na+ channel function.
Indicators of membrane potential in intact axons
There is no valid measure of membrane potential that can be used in studies on intact human subjects. However, measurements of axonal properties that vary with changes in membrane potential can provide insights into the direction and extent of any change in membrane potential, particularly when there are appropriate changes in each property (Bostock et al. 1998). These properties include latency, threshold, refractoriness, strength-duration time constant and supernormality. Unlike the other properties, the ischaemic changes in supernormality do not result primarily from changes in Na+ conductances. Accordingly, supernormality was used as a surrogate measure that might help resolve the discrepancies in the pattern and extent of the ischaemic changes in the Na+ channel-dependent properties. The ischaemic change in refractoriness was greater and the changes in threshold and τSD were less than expected for the change in supernormality. These discrepancies are similar to those seen when the properties were compared with the current required to negate the ischaemic change in threshold (Figs 3–5) and when the changes in these properties during ischaemia and depolarizing DC were compared (Fig. 1 and Fig. 2).
The voltage dependence of supernormality reflects the voltage dependence of the depolarizing afterpotential which is, in turn, largely determined by the voltage dependence of K+ channels, in particular fast K+ channels in the paranodal region (Baker et al. 1987; David et al. 1995; Bostock et al. 1998). If the ischaemic change in supernormality is a reasonable surrogate measure of the ischaemic change in membrane potential, as is implied above, it is likely that the putative ischaemic metabolites have less effect on K+ channel function than on Na+ channel function. This interpretation is consistent with the finding that K+ channels are blocked during hyperglycaemic hypoxia but not during normoglycaemic hypoxia (Schneider et al. 1993; Grafe et al. 1994).
Physiological changes produced by ischaemia
Ischaemia (or hypoxia) paralyses the electrogenic Na+-K+ pump and leads to increases in intracellular Na+ and extracellular K+. The Na+ influx occurs despite the depolarization-induced inactivation of transient Na+ channels, probably through incompletely inactivated (persistent) Na+ channels, in rat optic nerve axons (Stys et al. 1992, 1993), in rat ventricular myocytes (Ju et al. 1996) and in human peripheral nerve (Mogyoros et al. 1997). With long-lasting ischaemia (longer than in the present experiments), the resulting rise in the intracellular Na+, coupled with membrane depolarization, may lead to increased intracellular Ca2+ through reverse operation of the Na+-Ca2+ exchanger (Stys et al. 1992), something that normally occurs only as a transient phenomenon at the peak of the action potential (Tatsumi & Katayama, 1995). In addition, hypoxia decreases intra-axonal and interstitial pH (Wächtler et al. 1996), and changes in pH can affect ion channel function. The effects on Na+ channel function are discussed below. Intra-axonal acidification can also block K+ channels, particularly in the presence of hyperglycaemia (Schneider et al. 1993; Grafe et al. 1994).
The ischaemic depolarization increases axonal excitability, increases refractoriness, decreases supernormality and increases τSD, changes that are qualitatively appropriate for axonal depolarization (Mogyoros et al. 1997). However, the present results suggest that these changes are not quantitatively appropriate for the underlying change in membrane potential, a suggestion in agreement with previous findings (Grosskreutz et al. 1999, 2000).
Accommodation and Na+ channel function
There are clear parallels between the present results and those of Baker & Bostock (1989) who demonstrated in experiments on the cat that, during steady background depolarization, there was a difference between the threshold change produced by long-lasting subthreshold currents and the electrotonic potentials responsible for the threshold change (i.e. a dissociation of axonal excitability and membrane potential). In human axons, they then demonstrated that ischaemia produced equivalent changes in threshold electrotonus with the appearance of ‘fast’ accommodation to subthreshold depolarizing currents. In normally polarized axons, accommodation to long-lasting depolarizing currents was due to a slow process, attributed to activation of a slow K+ conductance. Approximately 2–3 min after the onset of ischaemia, fast accommodation began to appear and became the dominant accommodative process after 8–9 min. The fast accommodation could not be blocked by K+ channel blockers, was not associated with a significant change in conductance, and was therefore attributed to Na+ channel inactivation.
It is generally assumed that ∼30 % of Na+ channels are inactivated at resting membrane potential and that inactivation has a steep voltage dependence (for example Brismar, 1980; Schwarz & Eikhof, 1987; Schwarz et al. 1995). As such, it would have been reasonable to expect that even small depolarizations would have increased Na+ channel inactivation significantly. However, the inactivation processes, whether fast, slow or ultra-slow, would have operated when changes in membrane potential were produced by the injection of polarizing current, and this raises the question whether an additional process was responsible for the inappropriately greater limitation on the excitability change during ischaemia.
Channel blockade or a change in channel gating?
In previous experiments, it was demonstrated that the ischaemic increase in refractoriness was disproportionately great (Grosskreutz et al. 1999) and could not be reversed completely by clamping threshold at the pre-ischaemic level (Grosskreutz et al. 2000). These findings were interpreted as effects on the gating of Na+ channels, involving interference by an ischaemic metabolite with recovery of Na+ channels from inactivation. However, refractoriness is enhanced and conduction velocity is slowed if the number of available Na+ channels is reduced, whether by inactivation or blockade (Hodgkin & Huxley, 1952; Oda et al. 1989; Schwarz & Grigat, 1989; Long et al. 1990; Yokota et al. 1994; Roden, 1996). The findings that the maximal CSAP was reduced in amplitude, and that there were limitations on the ischaemic decrease in threshold and the ischaemic increase in τSD, as well as the large ischaemic increase in refractoriness, could all be explained by channel blockade.
The ischaemic limitation on the change in excitability involved τSD. Strength-duration properties of human axons are dependent on the passive membrane time constant and a local response due to a voltage-dependent, rapidly activating, depolarizing conductance that inactivates slowly, if at all (Bostock & Rothwell, 1997). These properties are consistent with a persistent Na+ conductance. Appropriate channels have been identified in dorsal root ganglia of the rat (Baker & Bostock, 1997, 1998, 1999; Kiernan et al. 2001), and their voltage dependence is the major determinant of the voltage dependence of τSD (Bostock & Rothwell, 1997; Mogyoros et al. 1997). Accordingly the smaller-than-expected change in τSD suggests that Na+ channels that lack fast inactivation are affected by the putative ischaemic metabolite, in addition to conventional transient Na+ channels. This would be consistent with the known effects of H+ ions on Na+ channels (Wanke et al. 1980) and, in particular, on those channels capable of generating ‘late’ Na+ currents (Baker & Bostock, 1999).
Injecting depolarizing current during ischaemia reversed the distortions created by ischaemia in the relationships between threshold, refractoriness and τSD on the one hand and axonal excitability on the other. These findings are reminiscent of the voltage dependence of channel blockade produced by H+ ions (Wanke et al. 1980; Begenisich & Danko, 1983; Mozhayeva et al. 1984; Daumas & Andersen, 1993), and it is therefore possible that one of the effects of ischaemia on Na+ channel function is channel blockade. However, an additional effect on channel gating, affecting both activation and inactivation, is likely: pH can modify channel gating (Carbone et al. 1981; Wanke et al. 1983). For example, Na+ channel inactivation is reduced by raised intracellular pH (Brodwick & Eaton, 1978; Wanke et al.1983), and low pH may alter the gating mode of those Na+ channels that generate ‘late’ Na+ currents (Baker & Bostock, 1999).
While the above mechanisms could explain the findings, the present studies cannot establish the underlying processes unequivocally or exclude additional modifying factors. Such factors could include effects on voltage-dependent K+ channels (due to changes in membrane potential or to the direct action of the putative ischaemic metabolite though, as discussed above, this is unlikely), effects on Ca2+-activated or ATP-dependent K+ channels, or effects on the nodal conductance. However, it would require convoluted arguments to explain the present findings on such mechanisms, and an alteration in Na+ channel function remains the most parsimonious explanation.
Functional implications
Accepting the above arguments, the ischaemic decrease in threshold was not as great as would have been the case but for the putative ischaemic metabolite. In other words, the ischaemic interference with Na+ channel function can negate much of the ischaemic threshold decrease. There are likely to be functionally important consequences of this limitation on the extent of the change in excitability. Without it, ischaemic depolarization would probably be sufficient to produce prominent ectopic impulse activity whereas, in reality, ectopic activity during ischaemia is usually mild and transient with ischaemic sensory axons and unusual with ischaemic motor axons (Bostock et al. 1991; Mogyoros et al. 1997).
Acknowledgments
This study was supported by the National Health & Medical Research Council of Australia. J.G. was supported by Deutsche Forschungsgemeinschaft.
REFERENCES
- Baker M, Bostock H. Depolarization changes the mechanism of accommodation in rat and human motor axons. Journal of Physiology. 1989;411:545–561. doi: 10.1113/jphysiol.1989.sp017589. [DOI] [PMC free article] [PubMed] [Google Scholar]
- Baker M, Bostock H, Grafe P, Martius P. Function and distribution of three types of rectifying channel in rat spinal root myelinated axons. Journal of Physiology. 1987;383:45–67. doi: 10.1113/jphysiol.1987.sp016395. [DOI] [PMC free article] [PubMed] [Google Scholar]
- Baker MD, Bostock H. Low-threshold, persistent sodium current in rat large dorsal root ganglion neurons in culture. Journal of Neurophysiology. 1997;77:1503–1513. doi: 10.1152/jn.1997.77.3.1503. [DOI] [PubMed] [Google Scholar]
- Baker MD, Bostock H. Inactivation of macroscopic late Na+ current and characteristics of unitary late Na+ currents in sensory neurons. Journal of Neurophysiology. 1998;80:2538–2549. doi: 10.1152/jn.1998.80.5.2538. [DOI] [PubMed] [Google Scholar]
- Baker MD, Bostock H. The pH dependence of late sodium current in large sensory neurons. Neuroscience. 1999;92:1119–1130. doi: 10.1016/s0306-4522(99)00058-5. [DOI] [PubMed] [Google Scholar]
- Begenisich T, Danko M. Hydrogen ion block of the sodium pore in squid giant axons. Journal of General Physiology. 1983;82:599–618. doi: 10.1085/jgp.82.5.599. [DOI] [PMC free article] [PubMed] [Google Scholar]
- Bostock H, Baker M, Grafe P, Reid G. Changes in excitability and accommodation of human motor axons following brief periods of ischaemia. Journal of Physiology. 1991;441:513–535. doi: 10.1113/jphysiol.1991.sp018765. [DOI] [PMC free article] [PubMed] [Google Scholar]
- Bostock H, Cikurel K, Burke D. Threshold tracking techniques in the study of human peripheral nerve. Muscle and Nerve. 1998;21:137–158. doi: 10.1002/(sici)1097-4598(199802)21:2<137::aid-mus1>3.0.co;2-c. [DOI] [PubMed] [Google Scholar]
- Bostock H, Rothwell JC. Latent addition in motor and sensory fibres of human peripheral nerve. Journal of Physiology. 1997;498:277–294. doi: 10.1113/jphysiol.1997.sp021857. [DOI] [PMC free article] [PubMed] [Google Scholar]
- Brismar T. Potential clamp analysis of membrane current in rat myelinated nerve fibres. Journal of Physiology. 1980;298:171–184. doi: 10.1113/jphysiol.1980.sp013074. [DOI] [PMC free article] [PubMed] [Google Scholar]
- Brodwick MS, Eaton DC. Sodium channel inactivation in squid axon is removed by high internal pH or tyrosine-specific reagents. Science. 1978;200:1494–1496. doi: 10.1126/science.26973. [DOI] [PubMed] [Google Scholar]
- Carbone E, Testa PL, Wanke E. Intracellular pH and ionic channels in the Loligo vulgaris giant axon. Biophysical Journal. 1981;35:393–413. doi: 10.1016/S0006-3495(81)84798-4. [DOI] [PMC free article] [PubMed] [Google Scholar]
- David G, Modney B, Scappaticci KA, Barrett JN, Barrett EF. Electrical and morphological factors influencing the depolarizing after-potential in rat and lizard myelinated axons. Journal of Physiology. 1995;489:141–157. doi: 10.1113/jphysiol.1995.sp021037. [DOI] [PMC free article] [PubMed] [Google Scholar]
- Dumas P, Andersen OS. Proton block of rat brain sodium channels. Evidence for two proton binding sites and multiple occupancy. Journal of General Physiology. 1993;101:27–43. doi: 10.1085/jgp.101.1.27. [DOI] [PMC free article] [PubMed] [Google Scholar]
- Grafe P, Bostock H, Schneider U. The effects of hyperglycaemic hypoxia on rectification in rat dorsal root axons. Journal of Physiology. 1994;480:297–307. doi: 10.1113/jphysiol.1994.sp020360. [DOI] [PMC free article] [PubMed] [Google Scholar]
- Grosskreutz J, Lin C, Mogyoros I, Burke D. Changes in excitability indices of cutaneous afferents produced by ischaemia in human subjects. Journal of Physiology. 1999;518:301–314. doi: 10.1111/j.1469-7793.1999.0301r.x. [DOI] [PMC free article] [PubMed] [Google Scholar]
- Grosskreutz J, Lin CS-Y, Mogyoros I, Burke D. Ischaemic changes in refractoriness of human cutaneous afferents under threshold-clamp conditions. Journal of Physiology. 2000;523:807–815. doi: 10.1111/j.1469-7793.2000.t01-1-00807.x. [DOI] [PMC free article] [PubMed] [Google Scholar]
- Hille B, Woodhull AM, Shapiro BI. Negative surface charge near sodium channels of nerve: divalent ions, monovalent ions, and pH. Philosophical Transactions of the Royal Society B. 1975;270:301–318. doi: 10.1098/rstb.1975.0011. [DOI] [PubMed] [Google Scholar]
- Hodgkin AL, Huxley AF. A quantitative description of membrane current and its application to conduction and excitation in nerve. Journal of Physiology. 1952;117:500–544. doi: 10.1113/jphysiol.1952.sp004764. [DOI] [PMC free article] [PubMed] [Google Scholar]
- Ju YK, Saint DA, Gage PW. Hypoxia increases persistent sodium current in rat ventricular myocytes. Journal of Physiology. 1996;497:337–347. doi: 10.1113/jphysiol.1996.sp021772. [DOI] [PMC free article] [PubMed] [Google Scholar]
- Kiernan MC, Baker MD, Bostock H. Tetrodotoxin-sensitive and -resistant late Na+ currents in adult rat small sensory neurones in culture. Journal of Physiology. 2001;531.P:82P. [Google Scholar]
- Long RR, Sargent JC, Hammer K. Paralytic shellfish poisoning: A case report and serial electrophysiologic observations. Neurology. 1990;40:1310–1312. doi: 10.1212/wnl.40.8.1310. [DOI] [PubMed] [Google Scholar]
- Mogyoros I, Kiernan MC, Burke D, Bostock H. Excitability changes in human sensory and motor axons during hyperventilation and ischaemia. Brain. 1997;120:317–325. doi: 10.1093/brain/120.2.317. [DOI] [PubMed] [Google Scholar]
- Mozhayeva GN, Naumov AP, Nosyreva ED. A study on the potential-dependence of proton block of sodium channels. Biochimica et Biophysica Acta. 1984;775:435–440. doi: 10.1016/0005-2736(84)90201-3. [DOI] [PubMed] [Google Scholar]
- Oda K, Araki K, Totoki T, Shibasaki H. Nerve conduction study of human tetrodotoxication. Neurology. 1989;39:743–745. doi: 10.1212/wnl.39.5.743. [DOI] [PubMed] [Google Scholar]
- Roden DM. Ionic mechanisms for prolongation of refractoriness and their proarrhythmic and antiarrhythmic correlates. American Journal of Cardiology. 1996;78:12–16. doi: 10.1016/s0002-9149(96)00448-1. [DOI] [PubMed] [Google Scholar]
- Schneider U, Quasthoff S, Mitrovi'c N, Grafe P. Hyperglycaemic hypoxia alters after-potential and fast K+ conductance of rat axons by cytoplasmic acidification. Journal of Physiology. 1993;465:679–697. doi: 10.1113/jphysiol.1993.sp019700. [DOI] [PMC free article] [PubMed] [Google Scholar]
- Schwarz JR, Eikhof G. Na currents and action potentials in rat myelinated nerve fibres at 20 and 37 degrees C. Pflügers Archiv. 1987;409:569–577. doi: 10.1007/BF00584655. [DOI] [PubMed] [Google Scholar]
- Schwarz JR, Grigat G. Phenytoin and carbamazepine: potential- and frequency-dependent block of Na currents in mammalian myelinated nerve fibers. Epilepsia. 1989;30:286–294. doi: 10.1111/j.1528-1157.1989.tb05300.x. [DOI] [PubMed] [Google Scholar]
- Schwarz JR, Reid G, Bostock H. Action potentials and membrane currents in the human node of Ranvier. Pflügers Archiv. 1995;430:283–292. doi: 10.1007/BF00374660. [DOI] [PubMed] [Google Scholar]
- Stys PK, Sontheimer H, Ransom BR, Waxman SG. Noninactivating, tetrodotoxin-sensitive Na+ conductance in rat optic nerve axons. Proceedings of the National Academy of Sciences of the USA. 1993;90:6976–6980. doi: 10.1073/pnas.90.15.6976. [DOI] [PMC free article] [PubMed] [Google Scholar]
- Stys PK, Waxman SG, Ransom BR. Ionic mechanisms of anoxic injury in mammalian CNS white matter: role of Na+ channels and Na+-Ca2+ exchanger. Journal of Neuroscience. 1992;12:430–439. doi: 10.1523/JNEUROSCI.12-02-00430.1992. [DOI] [PMC free article] [PubMed] [Google Scholar]
- Tatsumi H, Katayama Y. Na+ dependent Ca2+ influx induced by depolarization in neurons dissociated from rat nucleus basalis. Neuroscience Letters. 1995;196:9–12. doi: 10.1016/0304-3940(95)11823-f. [DOI] [PubMed] [Google Scholar]
- Wächtler J, Mayer C, Rucker F, Grafe P. Glucose availability alters ischaemia-induced changes in intracellular pH and calcium of isolated rat spinal roots. Brain Research. 1996;725:30–36. doi: 10.1016/0006-8993(96)00320-4. [DOI] [PubMed] [Google Scholar]
- Wanke E, Carbone E, Testa PL. The sodium channel and intracellular H+ blockage in squid axons. Nature. 1980;287:62–63. doi: 10.1038/287062a0. [DOI] [PubMed] [Google Scholar]
- Wanke E, Testa PL, Prestipino G, Carbone E. High intracellular pH reversibly prevents gating-charge immobilization in squid axons. Biophysical Journal. 1983;44:281–284. doi: 10.1016/S0006-3495(83)84300-8. [DOI] [PMC free article] [PubMed] [Google Scholar]
- Yokota T, Saito Y, Miyatake T. Conduction slowing without conduction block of compound muscle and nerve action potentials due to sodium channel block. Journal of the Neurological Sciences. 1994;124:220–224. doi: 10.1016/0022-510x(94)90330-1. [DOI] [PubMed] [Google Scholar]