

Abstract
Synapses exhibit different short-term plasticity patterns and this behaviour influences information processing in neuronal networks. We tested how the short-term plasticity of excitatory postsynaptic currents (EPSCs) depends on the postsynaptic cell type, identified by axonal arborizations and molecular markers in the hippocampal CA1 area. Three distinct types of short-term synaptic behaviour (facilitating, depressing and combined facilitating–depressing) were defined by fitting a dynamic neurotransmission model to the data. Approximately 75 % of the oriens-lacunosum-moleculare (O-LM) interneurones received facilitating EPSCs, but in three of 12 O-LM cells EPSCs also showed significant depression. Over 90 % of the O-LM cells were immunopositive for somatostatin and mGluR1α and all tested cells were decorated by strongly mGluR7a positive axon terminals. Responses in eight of 12 basket cells were described well with a model involving only depression, but the other cells displayed combined facilitating–depressing EPSCs. No apparent difference was found between the plasticity of EPSCs in cholecystokinin- or parvalbumin-containing basket cells. In oriens-bistratified cells (O-Bi), two of nine cells showed facilitating EPSCs, another two depressing, and the remaining five cells combined facilitating–depressing EPSCs. Seven of 10 cells tested for somatostatin were immunopositive, but mGluR1α was detectable only in two of 11 tested cells. Furthermore, most O-Bi cells projected to the CA3 area and the subiculum, as well as outside the hippocampal formation. Postsynaptic responses to action potentials recorded in vivo from a CA1 place cell were modelled, and revealed great differences between and within cell types. Our results demonstrate that the short-term plasticity of EPSCs is cell type dependent, but with significant heterogeneity within all three interneurone populations.
Neuronal networks process and store information via dynamic synaptic connections. In the central nervous system, synapses show a wide repertoire of use-dependent behaviours on time scales ranging from milliseconds (short-term plasticity) to several hours or days (long-term plasticity). It has been suggested that the dynamic properties of central synapses at time scales from tens to hundreds of milliseconds influence the way in which information is processed in neuronal networks (reviewed by Abbott et al. 1997; Zador & Dobrunz, 1997). Amongst the underlying mechanisms of the short-term synaptic plasticity, presynaptic calcium accumulation (Katz & Miledi, 1968), depletion of readily releasable pool of synaptic vesicles (Liu & Tsien, 1995; Dobrunz & Stevens, 1997), and the activation of auto- and heteroreceptors (Nakanishi et al. 1996; von Gersdorff et al. 1997) have been proposed. Synaptic connections in the neocortex and hippocampus display several distinct short-term behaviours (Zucker, 1989; Tsodyks & Markram, 1997; Varela et al. 1997; Markram et al. 1998b; Reyes et al. 1998; Scanziani et al. 1998; Dittman et al. 2000; Gupta et al. 2000; Thomson, 2000). Some synapses show only facilitation or only depression, but some others display combined facilitating–depressing patterns (Thomson et al. 1993; Thomson & Deuchars, 1994; Dittman et al. 2000; Gupta et al. 2000). It has been suggested that short-term synaptic plasticity may depend on the identity of the postsynaptic target cell (Ali et al. 1998; Ali & Thomson, 1998; Reyes et al. 1998; Scanziani et al. 1998). For example, depression of excitatory postsynaptic potentials (EPSPs) was reported in CA1 basket and bistratified cells, whereas EPSPs showed facilitation in O-LM cells (Ali et al. 1998; Ali & Thomson, 1998). However, Markram et al. (1998b) suggested that short-term plasticity between neocortical cells depends on the identity of both pre- and postsynaptic cells. To determine how short-term plasticity depends on the type of the target cell, we quantitatively characterized the short-term plasticity of excitatory synaptic responses of identified interneurones of the hippocampal CA1 area through the implementation of a dynamic neurotransmission model developed by Tsodyks & Markram (1997). The recorded cells were identified according to their dendritic and axonal arborizations as well as by neurochemical markers, such as their neuropeptide, calcium binding protein and metabotropic glutamate receptor expression (Freund & Buzsaki, 1996; Somogyi et al. 1998).
METHODS
Slice preparation and in vitro electrophysiological recordings
The data presented were obtained from 12- to 21-day-old (15.7 ± 2.1-day-old, mean ± s.d., n = 36) C57Black6 mice. The animals were anaesthetized first with halothane followed by ketamine (50 mg) in accordance with the guidelines of the Institute of Experimental Medicine Protection of Research Subjects. After decapitation, the brains were removed and placed into ice-cold artificial cerebrospinal fluid (ACSF). Horizontal slices (350 μm thick) were cut with a Leica VT1000S Vibratome (Leica Microsystems, Vienna, Austria) and were stored in continuously oxygenated ACSF (pH 7.4). The cutting solution contained (mm): 85 NaCl, 75 sucrose, 2.5 KCl, 25 glucose, 1.25 NaH2PO4, 24 NaHCO3, 4 MgCl2 and 0.5 CaCl2. After 30 min this medium was replaced by the ACSF, containing (mm): 126 NaCl, 2.5 KCl, 25 glucose, 1.25 NaH2PO4, 24 NaHCO3, 2 MgCl2 and 2 CaCl2. After another hour of incubation at 30 °C, the slices were transferred to a recording chamber where they were perfused with the same ACSF, but which contained the GABAA receptor antagonist SR95531 (20 μM). Recordings were performed at 26 °C from the somata of visually identified (Olympus BX50WI microscope with infrared differential interference contrast optics and a × 40 water-immersion objective lens) interneurones located mostly in the strata oriens/alveus with an Axopatch 200B amplifier (Axon Instruments, Foster City, CA, USA). In horizontal slices the boundaries between the targeted CA1 area and the CA3 area or the subiculum are not always clear. Following anatomical visualization of the cells, the somata of some of the cells were outside the CA1 area. Recordings were made with an intracellular solution, containing (mm): 130 potassium gluconate, 5 KCl, 2 MgCl2, 0.05 EGTA, 10 Hepes, 2 Mg-ATP, 0.4 Mg-GTP, 10 creatinine phosphate and 0.013 biocytin. The intracellular solution was adjusted to a pH of 7.25 and an osmolarity of 305-315 mosmol l−1. Patch electrodes were pulled (Narishige PP-830, Tokyo) from thick-walled borosilicate glass (o.d., 1.5 mm; i.d., 0.86 mm; Sutter Instruments Co., Novato, CA, USA). The DC resistance of the electrodes was 4-8 MΩ when filled with pipette solution. Series resistance and whole-cell capacitance were estimated by compensating for the fast current transients evoked at the onset and offset of 10 ms, 5 mV voltage-command steps and were checked every 2 min during the recordings. If the compensated series resistance increased by more than 40 %, the recording was discontinued. The series resistance remaining after 70-90 % compensation (with 7-8 μs lag values) was 2.7 ± 1.5 MΩ (mean ± s.d.). Excitatory synaptic currents were evoked by extracellular stimulation (stimulus isolator made by Supertech, Pécs, Hungary, 0.1 ms pulse width) through a theta glass pipette (tip diameter ∼5 μm) filled with ACSF and placed 30-100 μm away from the somata.
Data acquisition and analysis
All recordings were low-pass filtered at 2 kHz and digitized on-line at 10 kHz using a PCI-MIO 16E-4 data acquisition board (National Instuments, Austin, TX, USA) and WinWCP 3.0.6 software (courtesy of Dr J. Dempster, University of Strathclyde, Glasgow, UK) running on a Pentium II IBM/AT compatible computer. The amplitudes, 10-90 % rise times, 50 % decay times of the evoked EPSCs were measured using WCP3.0.6.
The short-term plasticity of evoked EPSCs (eEPSCs) was investigated using a train of 10 stimuli at 33 Hz, followed by a single pulse at recovery time intervals from 150 to 1800 ms. This protocol was repeated every 20 s, and in each trial a different recovery time was used (7 times). The amplitude of the individual EPSCs was measured and the means and standard deviations were calculated at every time point during the train and the recovery. A single exponential was fitted (Origin 6.1, Microcal Software Inc., Northampton, MA, USA) to the seven recovery time points to constrain either the time constant of recovery of synaptic efficacy (τrec) or the time constant of recovery from facilitation (τfac). The discrete version of the dynamic neurotransmitter model developed by Markram and his colleagues (Tsodyks & Markram, 1997; Markram et al. 1998a) was implemented in the Berkeley Madonna differential equation solving software (R. I. Macey & G. F. Oster, UC Berkeley, CA, USA). The model was fitted to the data points and the parameters of τfac, τrec, absolute synaptic efficacy (A) and utilized synaptic efficacy (U) were extracted. Parameter fitting was performed in cells, where the recovery points between 150 and 1800 ms yielded an approximately exponential recovery from either facilitation or depression. Statistical comparisons of A, U, τrec and τfac values between cell types were performed using the Kruskal-Wallis test followed by the post hoc Bonferoni-Dunn test using StatView (Abacus Concepts, Inc., Berkeley, CA, USA).
The continuous version of the dynamic neurotransmission model was also implemented in Berkeley Madonna and postsynaptic responses were modelled to a train of action potentials recorded from a rat CA1 pyramidal cell (see Fig. 8), while the animal was moving through the place field of that CA1 cell (the action potential pattern was kindly provided by Dr G. Buzsaki). Excitatory postsynaptic potentials were computed using a passive, single compartment model cell (dV/dt = Rin × Isyn(t)/τmem) with an input resistance (Rin) of 50 MΩ and a membrane time constant (τmem) of 10 ms.
Figure 8. Modelling of postsynaptic responses in basket and O-LM cells to a naturally occurring presynaptic activity pattern.
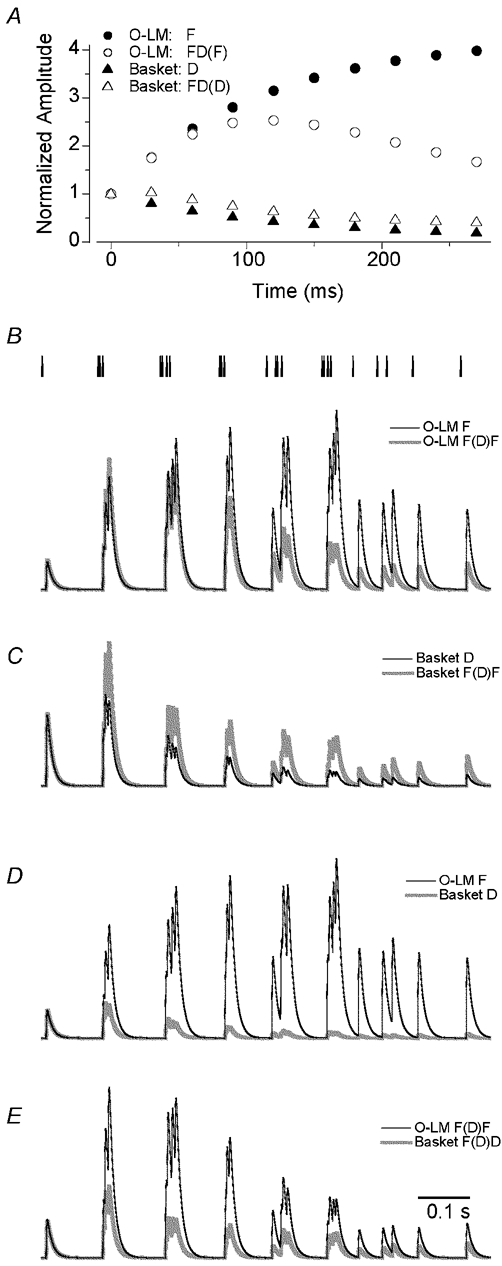
A, parameter values (U, τrec and τfac) were averaged within O-LM cells showing only facilitating EPSCs (O-LM F, n = 9 cells), facilitating–depressing EPSCs (O-LM FD(F), n = 3), basket cells showing only depressing EPSCs (basket D, n = 8), and in basket cells displaying facilitating–depressing EPSCs (basket FD(D), n = 4). The parameter ‘A’ was normalized within each category in a way that the amplitude of the first EPSC became 1. The peak amplitudes of the modelled EPSCs are plotted throughout the train of 10 stimuli at 33 Hz. B, the vertical bars (24) represent the temporal position of presynaptic action potentials in a CA1 pyramidal (place) cell recorded in vivo. Note the clustering of the action potentials at the theta frequency. Comparison of the modelled EPSPs in two O-LM cell categories. The depolarizations are very similar in both cells at the beginning of the input train, when the animal entered the place field of the presynaptic cell, but the EPSPs became gradually different in a time and action potential number-dependent manner. C, the difference in the EPSPs between the two basket cell categories is very similar from the second theta cycle to the end of the 1 s period. D, the greatest absolute difference between the EPSPs was found between the facilitating O-LM and the depressing basket cells. E, comparison of the modelled EPSPs in FD(F) O-LM and in FD(D) basket cells. The largest difference in the depolarization is observed at the early phase of the activity.
Chemicals and drugs
All chemicals and drugs used in the electrophysiological experiments were obtained from Sigma-Aldrich.
Anatomical identification of the recorded cells
Following electrophysiological recording, slices were fixed in a solution containing 4 % paraformaldehyde, 0.05 % glutaraldehyde and 0.2 % picric acid in 0.1 m phosphate buffer (pH 7.4) overnight. The slices were then embedded in gelatine and re-sectioned at 60 μm thickness. The biocytin-filled cells were visualized with 7-amino-4-methylcoumarin-3-acetic acid (AMCA)-conjugated streptavidin (1:1000, Vector Laboratories, Burlingame, CA, USA). Immunoreactivity for somatostatin, pro-CCK, parvalbumin (PV), calretinin, calbindin, mGluR1α and mGluR7a were visualized by immunocytochemistry, usually using a mixture of two or three primary antibodies raised in rabbit, guinea-pig or mouse, followed by a mixture of two or three secondary antibodies (Maccaferri et al. 2000). Primary antibodies were used in the following concentrations: mouse monoclonal anti-somatostatin, code: SOMA8, ascites fluid diluted 1:500 (gift from Dr A. Buchan, Department of Physiology, University of British Columbia, Canada, characterized by Vincent et al. 1985); rabbit anti-pro-cholecystokinin 1:1000 (gift from Dr A. Varro, Department of Physiology, University of Liverpool, UK, characterized by Morino et al. 1994), rabbit anti-PV at 1:500 (Code, PV-28; Swant, Bellinzona, Switzerland), mouse monoclonal antibodies to PV diluted 1:2000 (Sigma, Product No. P-3171); guinea-pig antibodies to PV at 1:1000 (Code, GP404, gift from Dr K. Baimbridge), mouse monoclonal antibodies to calretinin 1:2000 (Code, 6B3; Swant); mouse monoclonal antibodies to calbindin D28K at 1:400 (Code, 300; Swant), guinea-pig antibodies to mGluR1α at 1:00 (gift from Dr M. Watanabe, Department of Anatomy, Hokkaido University, Sapporo, Japan, characterized by Tanaka et al. 2000); affinity purified rabbit anti-mGluR1α at 1:500 (DiaSorin, Wokingham, UK) and affinity purified rabbit anti-mGluR7a at 1 μg ml−1 (Shigemoto et al. 1996). The primary antibodies were visualized by Alexa Fluor 488- (diluted 1:1000, Molecular Probes, Leiden, The Netherlands), Cy3- (diluted 1:400, Jackson ImmunoResearch, West Grove, PA, USA) or Cy5-conjugated (diluted 1:1000, Jackson ImmunoResearch) secondary antibodies in an indirect immunofluorescence procedure. All reagents were diluted in Tris-buffered saline (TBS) containing 0.1 % Triton X-100. After several washes in buffer the sections were mounted on slides, covered with Vectashield (Vector Laboratories). Cells were studied using a Leica dichromatic mirror system, as described previously (Maccaferri et al. 2000), with a new Y3 block (excitation filter, BP 545/30 nm, dichroic mirror 565 nm, suppression filter BP 610/75 nm) for recording Cy3 fluorescence and supplemented with a Y5 block (excitation filter, BP 620/60 nm, dichroic mirror 660 nm, suppression filter BP 700/75 nm) detecting Cy5 fluorescence. The cells were recorded on a CCD camera, analysed and displayed using the Openlab software (Improvision, Coventry, UK). Brightness and contrast were adjusted for the whole frame and no part of a frame was enhanced or modified in any way. If a cell was found immunonegative to all the molecules tested in the first incubation, then the section was incubated again with a different set of antibodies and recorded again using the CCD camera. Some cells remained immunonegative even after testing with up to four antibodies. The immunonegativity of a cell for a given marker could be due to damage caused by the recording, an undetectable low level of the molecule or the genuine absence of the molecule. Therefore, only the positive detection of immunoreactivity is informative following extensive whole-cell recordings. As controls for method specificity, each primary antibody was replaced with 1 % normal serum of the species in which it was raised and was also applied on its own to some sections followed by a mixture of the two secondary antibodies. Control experiments showed that the fluorescence signal of the secondary antibody was associated only with the targeted primary antibody in multiple labelling experiments.
The use of a maximum of five antibodies was attempted on any one cell in order to achieve some positive identification, but immunoreactivity for a maximum of four antibodies could be evaluated. The choice of antibody in the first incubation was governed by the short-term plasticity of the cells; cells displaying facilitating EPSCs were tested for molecules likely to occur in relation to O-LM cells, whereas cells displaying depressing EPSCs were tested for basket cell markers as reported earlier. Because there was a considerable variability in short-term plasticity and other cell types were also recorded, the first set of antibodies was not always against molecules likely to occur in the cell type identified subsequently. In some cases not only the recorded cell, but all cells in the given section were immunonegative, which indicated a failure of immunoreaction. Thus no conclusion could be drawn about the presence or absence of immunoreactivity of the cell.
Following immunocytochemical evaluation, the sections were de-mounted and the recorded cells were further labelled by avidin-biotinylated HRP complex (Vector Laboratories) followed by peroxidase reaction using diaminobenzidine (0.05 %) as chromogen and 0.01 % H2O2 as substrate. The sections were then dehydrated and permanently mounted on slides. The axonal and dendritic patterns of each neurone were analysed at high magnifications. Some recovered neurones were subsequently reconstructed using a drawing tube.
RESULTS
We obtained whole-cell voltage-clamp recordings from neurones of the hippocampal formation of young mice. We aimed to record interneurones with somata located in the alveus or stratum oriens of the hippocampal CA1 area, but in horizontal slices the boundaries with the subiculum and CA3 area are not always clear. As a result, following histological processing and anatomical analysis, some of the cells were found to be in the subiculum or CA3 area. Only cells with sufficient axonal and dendritic arborizations for identification were included in this study. Only one axo-axonic cell was identified; therefore, it was omitted. Pyramidal cells were also omitted from the present work.
Excitatory postsynaptic currents (EPSCs) were evoked with weak extracellular stimulations in the presence of the GABAA receptor antagonist SR95531 (20 μM) while the cells were held at -60 mV. Using a potassium gluconate-based intracellular solution and holding the cells at -60 mV, evoked EPSCs (eEPSCs) are inward with fast rise (10-90 % rise time: 1.00 ± 0.23 ms, mean ± s.d., n = 43) and decay times (50 % decay time = 2.1 ± 0.91 ms, mean ± s.d.; n = 43). The rapid kinetics of the eEPSCs indicate that mainly AMPA receptors mediate these synaptic currents. To characterize quantitatively the short-term plasticity of eEPSCs, 10 stimuli were delivered at 33 Hz, followed by a single pulse at one of seven different recovery time points, ranging from 150 to 1800 ms. A dynamic neurotransmission model developed by Tsodyks & Markram (1997) was then fitted to the data. This model was chosen as it contains few parameters (A, absolute efficacy; U, utilized synaptic efficacy; τrec, recovery of synaptic efficacy; τfac, recovery from facilitation) and still describes the postsynaptic responses to regular and irregular stimulus patterns at several cortical inhibitory and excitatory connections. Three distinct short-term synaptic behaviours could be distinguished (Gupta et al. 2000) based on the ratio of τrec and τfac. The model of synaptic connections showing strong short-term depression resulted in a very small value of τfac (< 2 ms), with negligible effect below ∼200 Hz of presynaptic activity, resulting in a very large value of τrec/τfac (> 100). Fitting the model to synaptic connections with pronounced facilitation resulted in a negligibly small τrec value, and consequently a very small value of τrec/τfac (< 0.02). An intermediate value of τrec/τfac (0.5 < τrec/τfac < 35) was obtained at connections, displaying combined facilitating–depressing behaviours (Table 1). Following electrophysiological recordings, the cells were anatomically identified on the basis of their dendritic and axonal arborizations and characterized according to their neuropeptide (somatostatin, pro-CCK), calcium binding protein (parvalbumin (PV), calretinin, calbindin), and metabotropic glutamate receptor 1α (mGluR1α) content and whether they were decorated by strongly mGluR7a immunoreactive axon terminals.
Table 1.
Neurochemical characterization of the recorded cells and qualitative and quantitative description of the short-term plasticity of the eEPSCs
| Cell No. | Cell type | Immunoreactivity | 10 stim at 33 Hz | Model fit | ||||
|---|---|---|---|---|---|---|---|---|
| A | U | taurec | taufac | taurec/taufac | ||||
| A018 | O-LM | som +; mGluR1a + | F, 3.2X | 293 | 0.29 | 1.1 | 622 | 0.002 |
| A020 | O-LM | som +; mGluR1a + | F, 4.0X | 219 | 0.23 | 2.0 | 503 | 0.004 |
| A035 | O-LM | som +; mGluR1a + | F, 3.0X | 661 | 0.32 | 1.4 | 246 | 0.006 |
| A042 | O-LM | som +; mGluR1a + | F, 8.8X | > 5000 | <0.005 | 1.0 | 204 | 0.005 |
| A069 | O-LM | som −; mGluR1a − | F, 4.3X | 126 | 0.25 | 2.0 | 2070 | 0.001 |
| A077 | O-LM | som +; mGluR1a + | F, 3.7X | 223 | 0.22 | 2.0 | 405 | 0.005 |
| A078 | O-LM | som +; mGluR1a + | F, 3.5X | 316 | 0.12 | 1.3 | 250 | 0.005 |
| A082 | O-LM | som +; mGluR1a + | F, 3.7X | 6502 | 0.01 | 1.2 | 89 | 0.013 |
| A112 | O-LM | n.d. | F, 6.5X | 259 | 0.24 | 1.5 | 212 | 0.007 |
| A113 | O-LM | som +; mGluR1a +; mGluR7 + | FD(F), 2.7X (2.1X) | 4280 | 0.05 | 205 | 160 | 1.28 |
| A034 | O-LM | som +; mGluR1a + | FD(F), 6.2X (4.0X) | 512 | 0.06 | 286 | 418 | 0.68 |
| A064 | O-LM | n.d. | FD(F), 3.4X (2.2X) | 2800 | 0.02 | 2000 | 58 | 34.50 |
| A119 | O-LM | som +; mGluR1a +; mGluR7 + | FD(F), 3.7X (2.4X) | n.d. | n.d. | n.d. | n.d. | n.d. |
| A173 | O-LM | som +; mGluR1a +; mGluR7 + | n.d. | n.d. | n.d. | n.d. | n.d. | n.d. |
| A204 | O-LM | som +; mGluR1a +; mGluR7 + | n.d. | n.d. | n.d. | n.d. | n.d. | n.d. |
| A224 | O-LM | som +; mGluR1a +; mGluR7 + | n.d. | n.d. | n.d. | n.d. | n.d. | n.d. |
| A253 | O-LM | som +; mGluR1a +; mGluR7 + | n.d. | n.d. | n.d. | n.d. | n.d. | n.d. |
| A036 | Basket | mGluR1a- | D, 0.24X | 2075 | 0.37 | 250 | 1.8 | 139 |
| A060 | Basket | PV +; CR- | D, 0.52X | 4910 | 0.08 | 3425 | 0.2 | 17125 |
| A072 | Basket | CR −; som −; mGluR1a- | D, 0.33X | 1525 | 0.16 | 866 | 1.7 | 509 |
| A074 | Basket | PV −; CR −; som −; mGluR1a- | D, 0.21X | 388 | 0.26 | 352 | 1.9 | 185 |
| A075 | Basket | CCK −; PV −; CR- | D, 0.33X | 1214 | 0.19 | 427 | 1.4 | 305 |
| A076 | Basket | som −; mGluR1a- | D, 0.23X | 1397 | 0.38 | 240 | 1.6 | 150 |
| A080 | Basket | PV +; CR- | D, 0.29X | 932 | 0.15 | 2400 | 1.0 | 2400 |
| A083 | Basket | PV +; CR- | D, 0.59X | 3957 | 0.07 | 2372 | 1.2 | 1977 |
| A090 | Basket | CCK +; PV −; CR- | D, 0.13X | n.d. | n.d. | n.d. | n.d. | n.d. |
| A108 | Basket | CCK −; PV −; CR- | D, 0.40X | n.d. | n.d. | n.d. | n.d. | n.d. |
| A111 | Basket | CCK +; PV −; CR- | D, 0.20X | n.d. | n.d. | n.d. | n.d. | n.d. |
| A126 | Basket | CCK −; PV +; CR- | D, 0.40X | n.d. | n.d. | n.d. | n.d. | n.d. |
| A127 | Basket | CCK −; PV +; CR- | D, 0.50X | n.d. | n.d. | n.d. | n.d. | n.d. |
| A057 | Basket | PV +; CR- | D, 0.28X | 1963 | 0.25 | 317 | 15.5 | 20.5 |
| A066 | Basket | som −; mGluR1a- | FD(D), 1.1X(0.30X) | 683 | 0.15 | 432 | 26.9 | 16.1 |
| A071 | Basket | PV −; CR −; som −; mGluR1a- | FD(D), 1.1X (0.58X) | 1446 | 0.10 | 576 | 17 | 33.9 |
| A073 | Basket | mGluR1a- | FD(D), 1.1X (0.55X) | 3760 | 0.17 | 240 | 30 | 8.0 |
| A099 | Basket | PV −; CR- | FD(D), 1.1X (0.44X) | n.d. | n.d. | n.d. | n.d. | n.d. |
| A106 | Basket | CCK +; PV −; CR- | FD(D), 1.2X (0.70X) | n.d. | n.d. | n.d. | n.d. | n.d. |
| A120 | Basket | CCK −; PV +; CR- | FD(D), 1.4X (0.94X) | n.d. | n.d. | n.d. | n.d. | n.d. |
| A117 | Basket | PV −; mGluR1a −; mGluR7- | FD(F), 1.7X (1.20X) | n.d. | n.d. | n.d. | n.d. | n.d. |
| A144 | Basket | CCK −; PV −; CR- | n.d. | n.d. | n.d. | n.d. | n.d. | n.d. |
| A151 | Basket | CCK −; PV +; som −; mGluR1a- | n.d. | n.d. | n.d. | n.d. | n.d. | n.d. |
| A155 | Basket | CCK −; PV +; CR- | n.d. | n.d. | n.d. | n.d. | n.d. | n.d. |
| A098 | O-Bi | mGluR1a −; mGluR7± | F, 5.6X | 1149 | 0.12 | 1.9 | 185 | 0.010 |
| A040 | O-Bi | som +; mGluR1a- | F, 2.8X | 193 | 0.23 | 1.5 | 297 | 0.005 |
| A116 | O-Bi | som +; mGluR1a −; mGluR7- | FD(F), 3.0X (2.72X) | n.d. | n.d. | n.d. | n.d. | n.d. |
| A032 | O-Bi | som −; mGluR1a −; PV −; CR- | FD(F), 1.5X (1.30X) | 920 | 0.05 | 470 | 170 | 2.77 |
| A089 | O-Bi | som +; mGluR1a −; CB- | FD(F), 1.5X (1.01X) | 1755 | 0.13 | 153 | 71 | 2.16 |
| A081 | O-Bi | som +; mGluR1a- | FD(D), 1.1X (0.42X) | 1315 | 0.17 | 312 | 49 | 6.37 |
| A115 | O-Bi | som −; mGluR1a −; CCK −; CR- | FD(D), 1.2X (0.58X) | 1384 | 0.20 | 164 | 33 | 4.97 |
| A262 | O-Bi | CCK −; PV −; CR- | FD(D), 1.2X (0.75X) | 486 | 0.30 | 94 | 170 | 0.55 |
| A103 | O-Bi | CCK −; PV −; CR- | D, 0.43X | 3515 | 0.10 | 654 | 1.0 | 654 |
| A079 | O-Bi | PV −; CR- | D, 0.79X | 1700 | 0.10 | 98 | 1.0 | 98 |
| A092 | O-Bi | som −; mGluR1a +; mGluR7± | n.d. | n.d. | n.d. | n.d. | n.d. | n.d. |
| A114 | O-Bi | som +; mGluR1a −; CR- | n.d. | n.d. | n.d. | n.d. | n.d. | n.d. |
| A159 | O-Bi | som +; mGluR1a −; mGluR7- | n.d. | n.d. | n.d. | n.d. | n.d. | n.d. |
| A164 | O-Bi | n.d. | FD(F), 2.6X (2.2X) | n.d. | n.d. | n.d. | n.d. | n.d. |
| A200 | O-Bi | som +; mGluR1a +; mGluR7± | n.d. | n.d. | n.d. | n.d. | n.d. | n.d. |
For legend see facing page.
In the Immunoreactivity column, the results are shown as immunopositive (+) or immunonegative (−) for the following tested molecules: somatostatin (som); pro-cholecystokinin (CCK); parvalbumin (PV); calretinin (CR); calbindin (CB) and mGluRs. Immunoreactivity for mGluR7a is not in the cell, but refers to immunopositive boutons surrounding the cell. The qualitative description of the short-term plasticity of the evoked EPSCs is described in the 10 stim at 33 Hz column. The numbers after F (facilitating) and D (depressing) indicate the ratio of the amplitude of the 10th and the 1st EPSC. The first number after FD(F) (facilitating–depressing pattern with the last EPSC of the train still facilitating) and FD(D) (facilitating–depressing pattern with the last EPSC being smaller than the 1st) shows the ratio of the amplitude of the largest EPSC of the train and the 1st EPSC, while the second number in parenthesis indicates the ratio of the amplitude of the 10th and 1st EPSC. The quantitative description of the short-term plasticity using the dynamic neurotransmission model developed by Tsodyks & Markram (1997) is shown in the Model Fit column. In the τrec/τfac column, connections with negligible depression are shown in bold; those showing negligible facilitation are shown in italics and connections having both significant depression and facilitation are shown as normal font. n.d., no data.
Short-term plasticity of eEPSCs in O-LM cells
A cell was classified as an O-LM cell (n = 17) if it had horizontal dendrites emitting many spines, filopodia and appendages and mainly restricted to the alveus and stratum oriens, and the main axonal arbor was in stratum lacunosum-moleculare (McBain et al. 1994; Ali & Thomson, 1998; Maccaferri et al. 2000). In twelve cells, we managed to obtain long enough stable recordings of eEPSCs for quantitative characterization of the short-term plasticity and achieved a sufficient anatomical recovery of the recorded cell for identification. In agreement with previous work in adult rat hippocampus (Ali & Thomson, 1998), we found that EPSCs showed paired-pulse facilitation in response to the first two stimuli in all (n = 17) anatomically identified O-LM cells (Fig. 1 and Fig. 3 and Table 1). However, when additional responses to stimuli at 33 Hz were analysed, we found that in some O-LM cells EPSCs facilitated throughout the whole train (Fig. 3A), whereas in other O-LM cells, a combined facilitating–depressing pattern was observed (Fig. 1Ab and Fig. 3B). The median and the mean ± s.d. values for O-LM cells were 1.8 and 209 ± 572 ms for τrec; and 248 and 436 ± 541 ms for τfac. However, the parameters of the model showed two distinct categories according to the τrec/τfac values. In nine of 12 cells, the value of τrec was very small and, therefore, the τrec/τfac ratio was less than 0.02. In the remaining three cells, the model resulted in a significant τrec, and the τrec/τfac ratios were between 0.1 and 35.
Figure 1. Properties of O-LM cells.
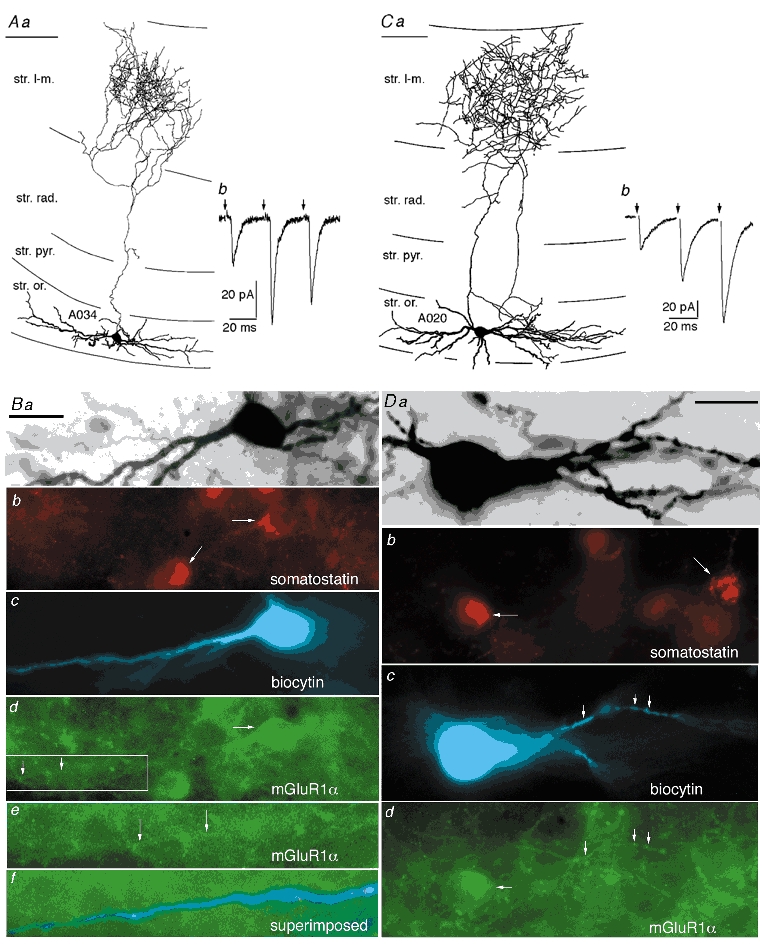
A and C, two cells with similar dendritic and axonal patterns (Aa and Ca), but showing either facilitating–depressing (Ab) or purely facilitating (Cb) patterns of short-term plasticity of EPSCs. Stimulus artefacts have been digitally removed for clarity (arrows). B and D, both cells were visualized by intracellular injection of biocytin, revealed by AMCA fluorescence (c) followed by peroxidase reaction (a). Both cells were immunopositive for somatostatin (horizontal arrows in b) as shown by Cy3 fluorescence along with other, unrecorded cells (oblique arrows). The cells were also immunopositive for mGluR1α (rabbit antibody) both along their somatic (horizontal arrows in d) and dendritic membranes (vertical arrows in d and e) as shown by Alexa-488 fluorescence. The framed area in Bd is shown at higher magnification in Be and extended to the left to demonstrate mGluR1α immunoreactivity of a dendrite. Bf, biocytin labelling (blue) and mGluR1α immunoreactivity (green) are superimposed to demonstrate the position of the dendrite for e. Scale bars in A and C, 100 μm; Ba-d and D, 20 μm; Be and Bf, 11 μm.
Figure 3. Heterogeneity in the short-term plasticity of eEPSCs in identified O-LM cells.
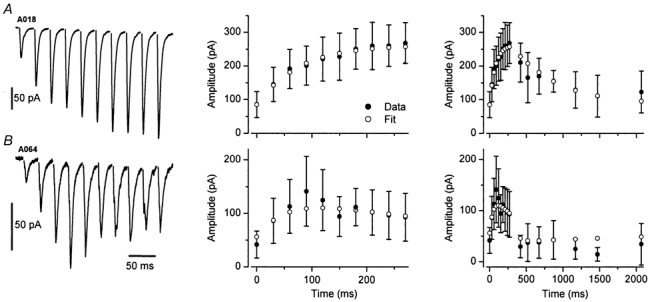
A, an averaged whole-cell voltage-clamp trace shows 10 EPSCs evoked at 33 Hz. The amplitude of the EPSCs increased throughout the whole train. Stimulus artefacts have been digitally removed for clarity. Middle panel, shows the mean ± s.d. of the individual EPSC amplitudes (filled circles) and superimposed are the results obtained from the model fit (open circles). Parameter values are A = 2.3, U = 0.29, τrec = 1.1 ms, τfac = 622 ms. Right panel, plot of the same data as in the middle panel on an extended time scale, including seven recovery points at intervals from 150 to 1800 ms following the stimulus train. The model accurately described the short-term plasticity of EPSCs during the train, and also reliably predicted the time course of the recovery from facilitation. B, the averaged trace of eEPSCs shows a combined facilitating–depressing behaviour in another O-LM cell. Middle and right panels, plots of the mean EPSC amplitudes and the superimposed model fits (A = 2.00, U = 0.02, τrec = 2000 ms, τfac = 58 ms). Note that the model describes the very rapid recovery from facilitation and the much slower recovery from depression.
Having found variability in the short-term synaptic plasticity patterns of O-LM cells, we investigated whether the functional characteristic of the synapses correlated with molecular differences amongst the cells. Seven of eight tested O-LM cells, showing only facilitating EPSCs, had immunocytochemically detectable levels of somatostatin and mGluR1α (Fig. 1D). Similarly, all three tested O-LM cells displaying combined facilitating–depressing EPSCs, were immunopositive for somatostatin and mGluR1α (Fig. 1B and Table 1). Somatostatin immunoreactivity was localized to perinuclear patches corresponding to the Golgi apparatus, whereas mGluR1α immunoreactivity outlined the soma and also the dendrites along the plasma membrane. For three of three tested O-LM cells, we could positively demonstrate that strongly mGluR7a immunopositive puncta, shown previously to be axon terminals (Shigemoto et al. 1996), decorated their somata and dendrites (Fig. 2), providing evidence that the strongly mGluR7a decorated cells are indeed the O-LM cells (Shigemoto et al. 1996). An additional four recorded O-LM cells, which were not evaluated for short-term plasticity quantitatively, were also tested for somatostatin, mGluR1α and mGluR7a immunoreactivity, and they were all immunopositive in the patterns described above. These results show that somatostatin, mGluR1α and mGluR7a immunoreactivity are characteristic to O-LM cells. In summary, O-LM cells are homogeneous for the tested molecules and we have not found any anatomical or molecular correlates of the distinct short-term plasticity patterns.
Figure 2. The dendrites of mGluR1α-containing O-LM cells are innervated by mGluR7a-rich terminals.
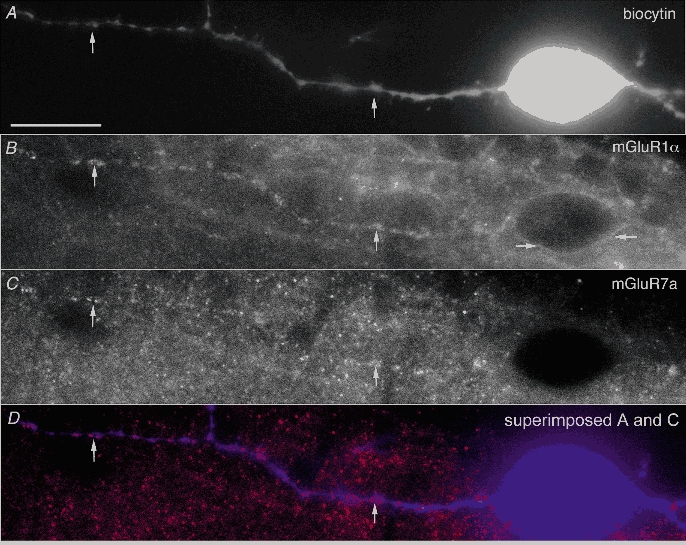
A, the soma and some of the dendrites of a recorded O-LM cell (A119), which showed facilitating–depressing short-term plasticity, are revealed by AMCA fluorescence. B, immunoreactivity for mGluR1α (guinea-pig antibody) outlines the plasma membrane of both the soma (horizontal arrows) and the dendrites (vertical arrows), as shown by Alexa-488 fluorescence. C, mGluR7a immunoreactive dots (rabbit antibody) follow the dendritic membrane as shown by Cy3 fluorescence. The dots correspond to immunoreactivity in nerve terminals as found by electron microscopy previously. D, the position of the dendrite is shown in an image by superimposing A (blue) and C (red). Scale bar, 20 μm
Short-term plasticity of eEPSCs in basket cells
The axons of basket cells (n = 24) were mainly confined to stratum pyramidale and proximal strata oriens and radiatum in the CA1 and CA3 areas (Fig. 4 and Maccaferri et al. 2000). Some cells innervated mainly the pyramidal layer towards the alveus, and much less the compact layer towards stratum radiatum. The majority of the recorded basket cells were in the CA1 area, with the exception of three cells (A127, A144 and A151) in the CA3 area and two cells (A057 and A071) in the subiculum, where they innervated the deeper layers (Fig. 4C). The dendritic arborizations of the basket cells with somata in the alveus and stratum oriens were mainly restricted to these layers (60 % of 22 cells with sufficient dendritic arbor) in the CA1 and CA3 areas. The other cells had some radial dendrites passing through stratum radiatum, and in some cases reaching stratum lacunosum-moleculare.
Figure 4. Short-term plasticity of excitatory synaptic responses in basket cells.
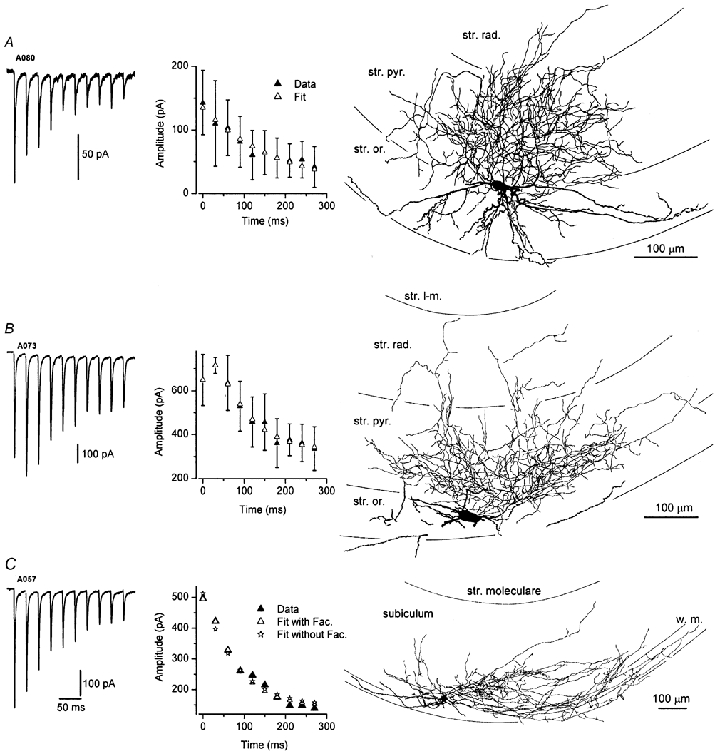
A, an averaged voltage-clamp trace of eEPSCs illustrates pronounced short-term depression in a basket cell. Model fit to the data resulted in a negligible τfac (1 ms) and A = 9.2, U = 0.15, τrec = 2400 ms. The right panel shows the reconstruction of the parvalbumin immunopositive cell (see Fig. 6). As most of its axonal tree remained in the stratum pyramidale, the cell was classified as a basket cell. The dendrites (thick lines) remained in strata oriens and pyramidale. B, an averaged trace shows a facilitating–depressing pattern of short-term plasticity in a basket cell. The dense innervation of stratum pyramidale (right panel) indicates that it is a basket cell; the dendrites could only be partially reconstructed due to folding of a section. To quantitatively describe the short-term plasticity in this cell (middle panel), significant facilitation (τfac = 30 ms) had to be included in the model (A = 3.60, U = 0.17, τrec = 240 ms). C, in this cell, eEPSCs display only depression during the train of stimuli, thus the pattern can be qualitatively described as depressing only. However, a significantly (P < 0.01, F test) better fit was obtained when facilitation was included in the model (asterisks vs. open triangles in the middle panel). The s.d. of the data is not shown in this cell for clarity. Right panel, reconstruction of the axonal and dendritic arborizations of the parvalbumin-positive cell in the subiculum.
When the short-term plasticity of eEPSCs was compared in basket and O-LM cells, a pronounced cell type-dependent difference was found (for both τrec and τfacP < 0.05, Kruskal-Wallis test followed by post hoc Dunn test). The median and the mean ± s.d. values for basket cells were 430 and 911 ± 1094 ms for τrec; and 1.8 and 8.4 ± 11.0 ms for τfac. However, similarly to the O-LM cells, significant variability in the short-term plasticity of excitatory synaptic inputs was found within identified basket cells. Two-thirds of the 21 tested basket cells received depressing excitatory inputs throughout the whole stimulus train (Fig. 4A and C and Table 1), whereas in seven cells EPSCs facilitated at the beginning of the train and then depressed (Fig. 4B). In eight of nine quantitatively evaluated cells, showing depression of EPSCs throughout the train, the model fitting to the EPSCs resulted in a very small value of τfac, rendering the τrec/τfac values large. In one cell (A057, Fig. 4C), the EPSCs depressed throughout the whole train of stimuli, but a significant τfac value was obtained from the model, grouping this cell with the facilitating–depressing population. Basket cells form at least two populations, PV- or CCK-expressing cells. As we have found basket cells displaying distinct forms of short-term plasticity of their EPSCs, we tested whether their response properties correlated with the PV or CCK content of the cells. Out of the 14 basket cells, qualitatively showing only depressing EPSCs, we found detectable PV immunoreactivity in six of 11 tested cells (Fig. 6A-C) and pro-CCK immunoreactivity in two of six tested cells. Similarly, amongst those cells that displayed facilitating–depressing EPSC patterns, we found PV immunoreactivity in one of five tested cells and CCK immunoreactivity in one of two tested cells (Table 1). The degree of depression measured as the ratio of the EPSC amplitude of the 10th to the first stimulus does not appear to be different between the qualitatively analysed seven PV- and three CCK-positive basket cells, and there was no statistically significant difference (P > 0.05, Mann-Whitney U test) in depression between basket cell with exclusively horizontal dendrites (n = 11) and those having some radial dendrites (n = 6). In conclusion, there does not appear to be a correlation between the observed heterogeneity in the short-term plasticity of EPSCs and the neurochemical or dendritic heterogeneity of basket cells.
Figure 6. Neurochemical characterization of basket and O-Bi cells.
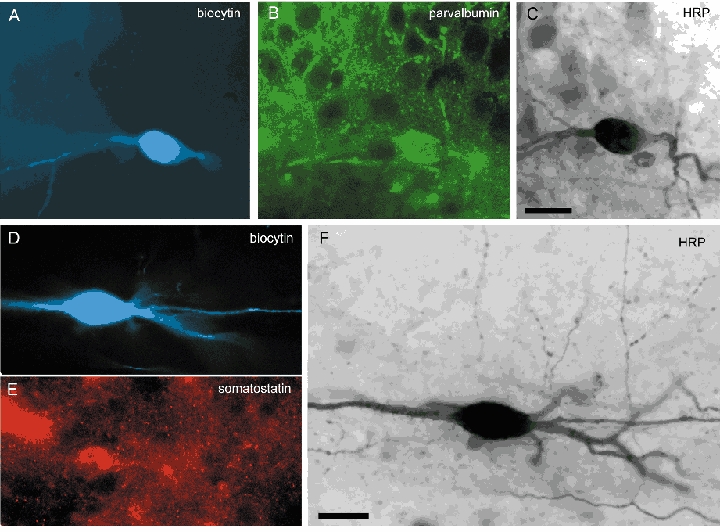
A-C, the basket cell (A080) shown in Fig. 4A is immunopositive for parvalbumin (B). Biocytin was visualized with AMCA-conjugated streptavidin (A), and parvalbumin was visualized with Alexa-488 (B). Note parvalbumin immunopositive boutons surrounding immunonegative pyramidal cell bodies. Following immunocytochemical evaluation, biocytin was also revealed by peroxidase reaction for reconstruction of the cell (C). D-F, the O-Bi cell (A089) shown in Fig. 5B is immunopositive for somatostatin revealed by Cy3 immunnofluorescence (E). Following a peroxidase reaction the varicose axonal branches became apparent (F). Scale bars, 20 μm.
Eleven of the 24 basket cells were tested for both PV and pro-CCK immunoreactivity; five of them were PV positive, three of them were CCK positive, but none were immunopositive for both molecules (see also Pawelzik et al. 2002). We also tested six basket cells for somatostatin, nine cells for mGluR1α and 18 basket cells for calretinin immunoreactivity, and they were all immunonegative (Table 1).
Short-term plasticity of eEPSCs in O-Bi cells
We defined oriens-bistratified (O-Bi) cells according to the description of Maccaferri et al. (2000). The soma and most of the dendritic trees of two of the cells (A032, A116) were in the CA3 area; several cells had soma in the CA1 area, but their dendrites spanned both CA1 and CA3 areas (Fig. 5D and Fig. 7D). In the mouse, these cells (n = 15) had in most cases horizontally elongated somata, horizontal dendrites mainly in alveus and stratum oriens, and highly variable axonal ramifications, which could span all or only some of the layers (Fig. 5). Nevertheless, the axon in most cases was concentrated in strata oriens and/or radiatum, and only rarely entered stratum lacunosum-moleculare, as described in the rat. In two cases axonal varicose branches also penetrated the white matter and innervated the surrounding isocortex (Fig. 5A). In all cases bouton-bearing axonal branches were found in more than one hippocampal area. In addition to the CA1 area, which was innervated by all cells, the CA3 area (73 % of cells), the subiculum (47 %), or both (40 %) were innervated, and 47 % of the cells had one or more main axonal branches running in the white matter and entering the fimbria (Fig. 5D). It is likely that most O-Bi cells innervate both the CA3 area and the subiculum, because, in addition to those cells having axon collaterals in the cell layer of the subiculum, another 30 % of cells had axon collaterals running towards the subiculum in the alveus of the CA1 area. Because these cells had the widest axonal arborizations within the hippocampal formation, and most, if not all, of them project outside the hippocampus, it is likely that out of the three populations examined in the present study, their axons were most severely truncated during slice preparation, partly explaining the large variability in axonal appearance. However, it is also possible that this population of cell includes several classes of non-pyramidal cells to be defined in more detail (see below and Discussion).
Figure 5. Large heterogeneity in the short-term plasticity of eEPSCs in identified O-Bi cells.
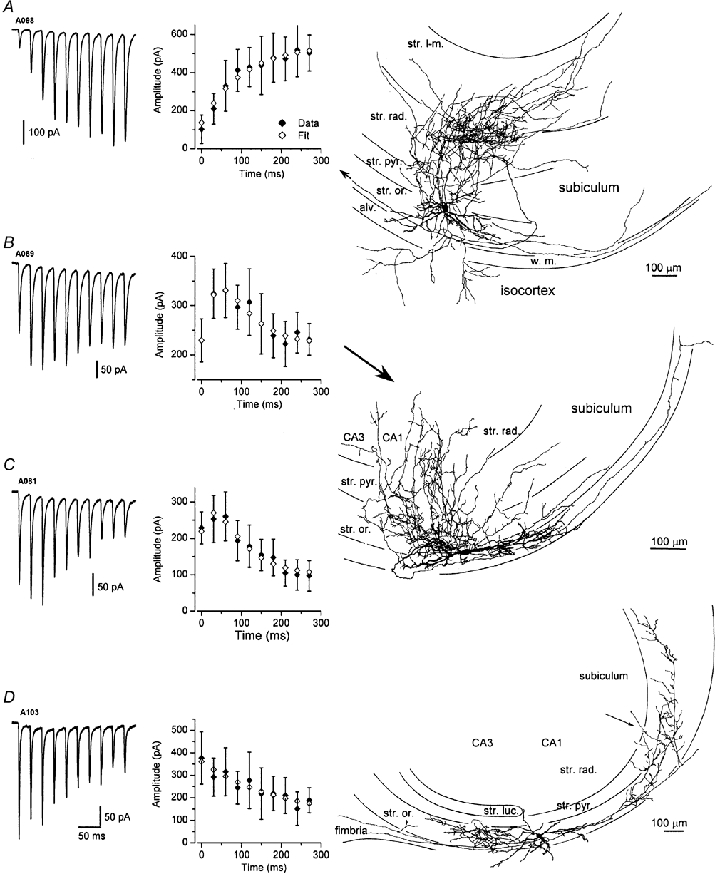
A, an averaged whole-cell voltage-clamp trace showing facilitation throughout the whole train of stimuli (10 stimuli at 33 Hz). Middle panel, the results of the model fit (A = 1.49, U = 0.12, τrec = 1.9 ms, τfac = 185 ms) are superimposed on the mean ± s.d. of the individual EPSC amplitudes measured within the train. Right panel, reconstruction of the cell showing dendrites restricted to stratum oriens and an extensive axonal arborization in all layers of the CA1 area and projections to the isocortex, subiculum and the main axon heading toward the fimbria and CA3 area (arrow). B and C, combined facilitating–depressing patterns of short-term plasticity are shown in the left panels. The last EPSC of the train could be either larger (B) or smaller (C) than the first EPSC. The model fits and the mean ± s.d. values are shown in the middle panels. In both cases, significant values of the τrec (B, 153 ms; C, 312 ms) and τfac (B, 71 ms; C, 49 ms) were needed to quantitatively describe the short-term plasticity patterns. Right panel, reconstruction of one of the cells (EPSCs in panel B) showing an axonal arborization in strata oriens, pyramidale and radiatum and innervating also the CA3 area and the subiculum. D, in this O-Bi cell, eEPSCs displayed short-term depression. The depression could be described by the dynamic neurotransmission model with the following parameters: A = 3.15, U = 0.1, τrec = 654 ms, τfac = 1 ms. Right panel, the cell body was close to the border of the CA1 and CA3 areas; the axonal arborization was mainly in stratum oriens and innervating the CA1, CA3 areas as well as the subiculum. Note the axonal projection to the fimbria.
Figure 7. Complex recovery pattern following 10 stimuli at 33 Hz in an O-Bi cell.
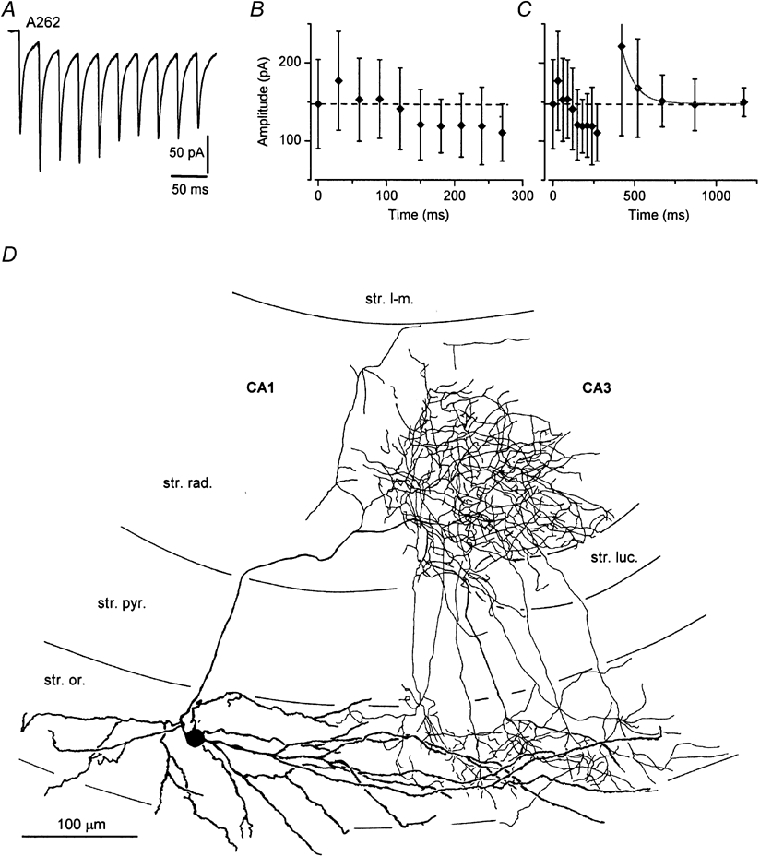
A, a whole-cell voltage-clamp trace of eEPSCs showing a combined facilitating–depressing pattern during the train of stimuli. B, the mean ± s.d. of the individual EPSCs is plotted within the train of 10 stimuli. The amplitudes of the EPSCs at the second half of the train are smaller than that of the first EPSC. C, the mean ± s.d. of individual EPSCs is plotted, including five recovery points from 150-900 ms. Although the last EPSCs in the train are smaller than the first EPSC, the recovery process as tested with the five test pulses appears to be a recovery from facilitation only. The recovery from depression is a much faster process than that from facilitation and it is already complete within the first 150 ms (the time point of the first test pulse). The recovery from facilitation is well described by a single exponential (continuous line) process with a time constant of 76 ms. D, reconstruction of the cell shows a very restricted axonal arborization in strata oriens and radiatum at the border of the CA1 and CA3 areas. Although the soma of the cell is in the CA1 area, the relatively long dendrites reach the CA3 area.
Comparing the short-term plasticity of eEPSCs in O-Bi vs. basket or O-LM cells, no significant difference was found for the model parameters (P > 0.05, Kruskal-Wallis test followed by post hoc Dunn test). The median and the mean ± s.d. values for O-Bi cells were 153 and 216 ± 221 ms for τrec; and 71 and 109 ± 102 ms for τfac. The largest heterogeneity in the short-term plasticity of eEPSCs was found in this cell type. In two of the nine identified cells, EPSCs facilitated throughout the whole train of stimuli (Fig. 5A). In two additional cells, EPSCs showed only depression (Fig. 5D). The τrec/τfac ratios obtained after the parameter extraction with the dynamic neurotransmission model were 0.01 and 0.005 for the facilitating EPSCs, and 98 and 654 for the depressing ones. In the remaining five cells, combined facilitating–depressing EPSC patterns were observed with intermediate τrec/τfac ratios (0.5 < τrec/τfac < 7; Figs 5B, 5C and 7 and Table 1). In one of these cells, a very interesting pattern of recovery following the 10 stimuli was observed (Fig. 7). Following an initial facilitation, the EPSCs in the second half of the train of stimuli showed relatively strong depression (Fig. 7A and B). However, when the recovery was tested 150-900 ms after the train, only the recovery from facilitation was detected. The recovery points could be well fitted with a single exponential (Fig. 7C). These data also indicate that the recovery from depression must be much faster than that from facilitation and, by the time of our first test stimulus at 150 ms, the recovery from depression was almost complete. Indeed, the τrec (94 ms) was found to be smaller than the τfac (170 ms), as determined from the fit of the dynamic neurotransmission model to the data. Thus, the time period 150-400 ms after the train is dominated by the slower recovery from facilitation.
To characterize this cell population and to test whether the heterogeneity in the short-term plasticity could be correlated with neurochemical characteristics of the cells, we immunoreacted the recorded cells for CR, PV, calbindin, somatostatin, CCK, mGluR1α, and mGluR7a. In agreement with a previous study in the rat (Maccaferri et al. 2000), we found that a large proportion of the tested O-Bi cells are somatostatin immunopositive (7 of 10 cells tested; Fig. 6D-F). However, of the 11 cells tested for mGluR1α immunoreactivity, only two cells were weakly immunopositive. Immunoreactivity for mGluR7a was difficult to evaluate around three tested cells (denoted ‘mGluR7a±’ in Table 1), because of the high density of immunoreactive dots in the dendritic fields. The dots did not appear to be selectively associated with the dendrites, but we could not exclude the possibility that some terminals innervating O-Bi cells were immunopositive. In two additional cells tested, no mGluR7a positive dots could be identified along the dendrites. No O-Bi cell was immunopositive for PV (4 cells tested), CR (6 cells tested), CCK (3 cells tested) or CB (1 cell tested). Other types of cell targeting the dendritic regions of pyramidal cells were reported to express CCK (Cope et al. 2002; Pawelzik et al. 2002).
Modelling postsynaptic responses in basket and O-LM cells to a naturally occurring presynaptic activity pattern
The heterogeneity in the short-term plasticity of excitatory inputs between distinct cell types and within the same type of GABAergic interneurones predicts that they would respond in a differential manner to a shared input depending on its temporal pattern. To compare the depolarization of different interneurones during repetitive presynaptic activity, we used a phenomenological model based on the recorded parameters. The dynamic neurotransmission model developed by Markram and his colleagues describes well the synaptic responses not only to regular, but also to irregular patterns of stimuli (Tsodyks & Markram, 1997). Because one of the major excitatory inputs to stratum oriens interneurones originates from the CA1 pyramidal cells that they innervate, we used the in vivo theta rhythm-modulated firing pattern of a CA1 pyramidal cell of a rat during a 1 s period, when the animal moved through the place field of the pyramidal cell. We compared the postsynaptic responses of basket and O-LM cells, showing distinct short-term plasticity patterns (Fig. 8). The parameters U, τrec and τfac were averaged in O-LM cells, showing facilitating EPSCs only (O-LM F; Fig. 8); and in O-LM cells, displaying facilitating–depressing EPSCs (O-LM FD(F)). Similarly, these parameters were also averaged in basket cells with depressing EPSCs (basket D); and basket cells, receiving combined facilitating–depressing EPSCs (basket FD(D)). The parameter A was normalized within each category such that the amplitude of the 1st response became the same (unity) in all categories. Postsynaptic potentials (EPSPs) were modelled with a single compartment model, using an input resistance value of 50 MΩ and a membrane time constant value of 10 ms. The postsynaptic depolarization for the first three theta cycle was almost identical in F and FD(F) O-LM cells, but a gradual difference became more and more pronounced in the second half of the 1 s input period (Fig. 8B). We also measured the difference between the depolarization around half-way through the place field of the cell (at 0.6 s) and found a 4 times larger depolarization in O-LM cells receiving only facilitating input. The temporal evolution of the difference between the postsynaptic depolarization in D and FD(D) basket cells showed a different pattern. The depolarizations were approximately the same from the second stimulus to the end of the modelled period (Fig. 8C). The depolarization in the 5th theta cycle was approximately 3.5 times larger in basket cells that received facilitating–depressing EPSCs. The largest absolute difference between the EPSPs was revealed when facilitating (F) O-LM and depressing (D) basket cells were compared. Due to temporal summation, the large value of τfac, and a negligible τrec, summed EPSPs in O-LM cells remain large as long as the animal is in the place field. In contrast, EPSPs in basket cells increase initially due to temporal summation, but by the third theta cycle begin to decline as short-term depression dramatically reduces single EPSPs. As the animal leaves the place field the action potentials become less regular and few bursts are fired, which reduces temporal summation (Fig. 8D). During the 5th theta cycle, the difference in the depolarization was 33 times higher in O-LM cell, receiving facilitating EPSCs compared with basket cells, innervated by only depressing EPSCs. When the FD(F) O-LM cells were compared to the FD(D) basket cells, we found that the difference in the postsynaptic depolarization was largest at the beginning of the modelled period, when the animal entered the place field of the presynaptic place cell (Fig. 8E). In the middle of the 1 s period, there was only a two-fold difference in the depolarization.
DISCUSSION
Postsynaptic target cell-dependent short-term plasticity of excitatory postsynaptic responses
It has been suggested that the short-term plasticity of excitatory postsynaptic responses depends on the identity of the postsynaptic target cell in the neocortex (Reyes et al. 1998) and in the hippocampus (Ali et al. 1998; Ali & Thomson, 1998; Scanziani et al. 1998). The averaged parameters of short-term plasticity obtained from the model indicate a clear postsynaptic cell type-dependent difference between basket vs. O-LM cells in agreement with previous studies. Evoked EPSCs mainly facilitated or facilitated and depressed in O-LM cells, but showed mainly depressing, or facilitating–depressing patterns in basket cells. It remains to be determined, whether the different types of short-term plasticities of eEPSCs are expressed exclusively presynaptically or postsynaptic mechanisms could also be involved. For a quantitative comparison between the cell types, we characterized the short-term plasticity with a dynamic neurotransmission model (Tsodyks & Markram, 1997). When the model parameters were compared between basket and O-LM cells, significant differences were found for τfac and τrec, but not for A and U. However, by examining the variance of the parameters a large heterogeneity was revealed within all categories. The variance was much larger than the mean for parameters τfac, τrec, and A in both basket and O-LM cells, suggesting more than one underlying population. Indeed, the τrec/τfac for all cells showed three distinct categories (see also Gupta et al. 2000). Approximately 75 % of the eEPSCs in O-LM cells required no significant depression in the model (very small τrec/τfac values), whereas ∼25 % showed a significant depression (intermediate τrec/τfac values). A similar heterogeneity was observed within the basket cell population; although 70 % of the cells were characterized by negligible facilitation, the rest showed significant facilitation and this difference did not correlate with the expression of PV or CCK. The largest heterogeneity was found in the responses of O-Bi cells, which had eEPSCs falling into all three categories of parameters. When the facilitating EPSCs are compared between O-Bi and O-LM cells, the properties seem to be akin. Similarly, when the depressing EPSCs are compared between O-Bi and basket cells, no difference is apparent.
Our data, showing variability in short-term plasticity patterns within anatomically defined postsynaptic interneurone populations, indicate that although the postsynaptic cell has an influence on the parameters, it alone cannot be responsible for determining the nature of short term plasticity. At least two possibilities might explain these results. One possibility is that both pre- and postsynaptic factors are responsible for determining the short-term plasticity of a given connection, as suggested by Markram and his colleagues for excitatory and inhibitory connections in the neocortex (Markram et al. 1998b; Gupta et al. 2000). In this case, the synapses showing different short-term dynamics on the same type of cell may have originated from different presynaptic sources. Stimulation of stratum oriens may activate at least four known glutamatergic afferents. The most numerous are probably the axons and local collaterals of CA1 pyramidal cells, which were previously tested in paired recordings and showed paired-pulse and brief-train facilitation in O-LM, but depression in basket cells (Ali et al. 1998; Ali & Thomson, 1998). The Schaffer collateral-commissural afferents originating from CA3 pyramidal cells also innervate the full depth of stratum oriens (Ishizuka et al. 1990). The projection from the entorhinal cortex also has an alvear part, which is numerically smaller than the previous two inputs (Deller et al. 1996). And finally, a small and presumably glutamatergic projection to stratum oriens was also reported from the amygdala (Pikkarainen et al. 1999). It is currently unknown whether in stratum oriens the latter three pathways innervate interneurones or not. Provided they do, the dynamic properties of these synapses remain to be determined. There are many examples of differential short-term dynamics of distinct glutamatergic synaptic inputs to a single cell. For example, climbing vs. parallel fibre inputs to cerebellar Purkinje cells (Dittman et al. 2000) or sensory vs. cortical inputs to thalamo-cortical relay cells (Castro-Alamancos & Calcagnotto, 2001; Castro-Alamancos, 2002) differ in short-term plasticity. The second possibility is that there is some variability in the short-term plasticity within a population of connections, which are homogeneous with respect to the participating pre- and postsynaptic cells. For example, synapses from a single presynaptic CA1 pyramidal cell, which establishes connections on two O-LM cells, may show distinct short-term plasticities. As we applied extracellular stimulation of the excitatory fibres, we cannot discriminate between the above scenarios.
As the short-term plasticity is only one important characteristic of synaptic connections, the diversity within a given connection may be more pronounced as more and more functionally relevant parameters are taken into account. For example, it is well known that AMPA receptors have diverse properties and the subunit composition of the receptors determines the kinetic properties and the ion permeability of the channels (Seeburg, 1996; Dingledine et al. 1999). Thus, within a homogeneous population of synaptic connection (e.g. CA1 pyramidal cell to basket cell), variability could also exist in the subunit composition of the AMPA receptors and in the number of receptors per synapse. Indeed, when we previously investigated the number of AMPA receptors in glutamatergic synapses on GABAergic interneurones, a large variability was found (Nusser et al. 1998). Additional heterogeneity may originate from the location of the synapses on the somato-dendritic surface of the cells, leading to specific interaction of the synaptic conductances with intrinsic, voltage-gated conductances. Whether such variability in the functional properties of the synapses within a given connection has functional consequences, or whether it only represents a ‘noise’ in the precisely designed and built neuronal networks, remains to be determined. Heterogeneity in functional parameters of interneurone populations has already been reported (Parra et al. 1998), and a recent modelling study suggested that diversity within GABAergic interneurones influences the behaviour of neuronal networks (Aradi & Soltesz, 2002). The role of functional diversity within a given interneurone population (as defined according to their axo-dendritic arborizations/input-output relationships) in neuronal networks remains to be determined.
Anatomical identification of cells
Comparison of the properties of interneurones depends on the reliability of grouping cells on the basis of the distribution of their processes and the expression of molecular markers. Most cells examined in this study were found to be similar to those reported previously in mice (Lorente de No, 1934; Oliva et al. 2000), rats (Freund & Buzsaki, 1996; Maccaferri et al. 2000; Pawelzik et al. 2002), and, as first presented by Ramon y Cajal (1893), in rabbits. Two of the three examined cell classes, the basket and O-LM cells, are unequivocally separated from each other on the basis of axonal distributions, basket cells being biased for stratum pyramidale and O-LM cells being biased for stratum lacunosum-moleculare. However, both cell types also innervate strata oriens and radiatum to a varying degree. The dendritic trees of basket and O-LM cells were often less different, as 60 % of basket cells and all O-LM cells had dendrites restricted to the alveus and adjoining str. oriens, as reported for a few cells earlier (Ramon y Cajal, 1893; Maccaferri et al. 2000; Pawelzik et al. 2002).
In the present study, all tested basket cells were somatostatin negative, but nine were PV positive. We did not test O-LM cells for PV, but the four tested O-Bi cells were PV negative. In the rat, there is a network of horizontally oriented PV-positive interneurones (Fukuda & Kosaka, 2000) and several of the PV-positive cells in this study had similar dendrites. Parvalbumin is present in basket and axo-axonic cells (Kosaka et al. 1987) and, in addition, it has also been shown to coexist with somatostatin in some interneurones of the mouse (Jinno & Kosaka, 2000). The latter cells cannot be basket cells, because somatostatin has not been found in axo-somatic terminals (see Freund & Buzsaki, 1996). This is supported by a report of PV- and somatostatin-positive O-LM and O-Bi cells (Maccaferri et al. 2000).
The apparently complete segregation of PV and CCK expression by basket cells reported in other species is confirmed in the mouse here. No gross differences were noted in the dendritic and axonal patterns of the two neurochemically distinct basket cell populations; both included cells with radial or horizontal dendrites and the radial extent of their axonal fields was variable to a similar extent, as in the rat (Pawelzik et al. 2002). In the rat, CCK immunoreactive terminals are more widely distributed radially than PV-positive ones, but many of the CCK positive terminals in stratum radiatum and oriens probably originate not from basket cells, but from Schaffer collateral-associated CCK immunopositive interneurones (Cope et al. 2002; Pawelzik et al. 2002). The short-term plasticity of CCK- or PV-positive cells did not appear to be different. However, relatively few immunopositive cells could be compared and a larger sample with different stimulus protocols may reveal differences in their short-term plasticity.
In the absence of molecular markers, basket cells are more difficult to separate from O-Bi cells in some cases, because O-Bi cells may also have numerous terminals in and around the pyramidal layer. In the rat, electron microscopic testing of O-Bi cell terminals in the pyramidal layer showed that they innervated dendrites (Maccaferri et al. 2000). Somatostatin immunoreactivity is not present in basket cells and CCK immunoreactivity is unlikely to be present in O-Bi cells, but many cells were not tested or labelled for either molecule. Parvalbumin immunoreactivity may not unequivocally separate basket and O-Bi cells, because one PV immunoreactive O-Bi cell has been reported in the rat (Maccaferri et al. 2000) and some PV and somatostatin immunopositive cells were reported to project to the septum in the mouse (Jinno & Kosaka, 2000), and these may be O-Bi cells (see below). Because O-Bi cells have the widest ranging axons, potential truncation of them during slice preparation would most severely affect these neurones, partially explaining the high variability in axonal appearance. Nevertheless, in all cases where immunocytochemical data were missing the laminar preference of the axonal arbor separated basket and O-Bi cells in our sample.
Heterogeneity in the somatostatin-containing GABAergic interneurones
Somatostatin immunoreactivity is present in at least two populations of cells, the O-LM and O-Bi cells, having distinct laminar axonal targets. On the basis of axonal patterns, the O-Bi cells described here probably are equivalent to some of the previously described backprojection (Sik et al. 1995) and trilaminar cell (Freund & Buzsaki, 1996) recorded in vivo, which were not characterized immunocytochemically. As many of the cells recorded by us also had axons directed towards, or reaching the fimbria, they appear similar to a somatostatin-positive neurone described in stratum oriens (Katona et al. 1999) and may correspond to the calbindin (Freund & Buzsaki, 1996) or somatostatin (unpublished observation quoted in Katona et al. 1999) immunopositive hippocampo-septal cells in the rat. Some somatostatin-positive cells were shown to project to the septum in the mouse as well (Jinno & Kosaka, 2000). The frequent projection by O-Bi cells to the subiculum found here in the mouse, and our demonstration of axonal ramification there, show that these cells have a widespread influence on the hippocampal system. We prefer to use the name O-Bi cell, based on the local hippocampal axonal arbor, because a term based on a projection target to, for example, septum, subiculum, the dentate gyrus or the CA1 and CA3 areas does not exclude the possibility that the cell projects to all or only some of these areas.
In contrast to the shared somatostatin content, we found that strong mGluR1α and mGluR7a immunoreactivity is associated mainly with O-LM, but not with O-Bi cells, identifying the cell type for these receptors (Baude et al. 1993; Shigemoto et al. 1996). However, in addition to strongly mGluR1α-positive cells, there are somatostatin immunoreactive cells having a distinctly low level, or no mGluR1α immunoreactivity (Ferraguti et al. 2001). Some of these cells may be O-Bi cells, because two O-Bi cells in the present study showed weak mGluR1α immunoreactivity. As a variable level of mGluR7a immunoreactivity is present in pyramidal cell terminals innervating pyramidal cells and various interneurones, in addition to the high level present in terminals innervating O-LM cells (Shigemoto et al. 1996), it is expected that some presynaptic mGluR7a immunoreactivity is detected around most neurones. Nevertheless, the strong outlining of the dendrites of cells by mGluR7a is a good predictor that a cell is an O-LM cell.
Theta frequency bursts of presynaptic activity differentially modulate the contribution of distinct interneurones to the network
Distinct patterns of temporal evolution in the postsynaptic depolarizations were observed when comparing two cell categories. When facilitating (F)-type inputs to O-LM and depressing (D)-type to basket cells and when F-type and facilitating–depressing (FD)-type to O-LM cells were compared, the differences in the postsynaptic depolarizations became more and more pronounced as the animal moved through the place field of the presynaptic pyramidal cell, indicating that F-type O-LM cells will increase and maintain their contribution to the active ensemble of GABAergic interneurones. In contrast, by comparing the FD-type inputs to basket and FD-type inputs to O-LM cells we found that the differences in the postsynaptic depolarizations were most pronounced at the beginning of the modelled period, as the animal was entering the place field of the presynaptic pyramidal cell. The depressing nature of pyramidal input to some interneurones, such as basket cells (Ali et al. 1998), may explain the elegant demonstration that the first pyramidal cell spike in a series is most likely to evoke a spike in a postsynaptic interneurone in vivo (Marshall et al. 2002).
The increase in postsynaptic depolarization of O-LM cells, as compared to basket cells during theta activity together with a converging tendency of difference in the short-term plasticity of their postsynaptic effect (Maccaferri et al. 2000) predicts that O-LM cells increase and maintain rhythmic hyperpolarization of the distal pyramidal dendrites innervated by entorhinal afferents. During theta activity the net depolarization of the distal dendrites increases relative to non-theta states and the hyperpolarization of the soma increases (see Buzsaki, 2002). However the net depolarization of the distal apical dendrites does not exclude the rhythmic hyperpolarization introduced by synapses from O-LM cells. The hyperpolarization could assist in the maintenance of the efficacy of the entorhinal input by de-inactivating T-type calcium channels and/or activating hyperpolarizing current (Ih). In line with this hypothesis, a high level of immunoreactivity was shown for HCN1 in the entorhinal innervated zone of the CA1 area (Santoro et al. 1997). Interestingly, a hyperpolarizing prepulse in the distal apical dendrite increased calcium entry evoked by synaptic stimulation in CA1 pyramidal cells (Magee et al. 1995). Thus, facilitation of the glutamatergic inputs in O-LM cells may be one element of the co-operation of entorhinal and O-LM inputs maintaining pyramidal cell responsiveness during theta activity.
The likely decrease in basket cell depolarization contributed by a single pyramidal cell may not necessarily lead to a net decrease in the recurrent somatic hyperpolarization of pyramidal cells under physiological conditions. As up to 25 basket cells converge onto a pyramidal neurone (Buhl et al. 1994) the recruitment of additional pyramidal cells during theta activity could compensate for the loss of synaptic efficacy in their recurrent excitatory drive. Moreover, the reduction of excitatory drive could be a mechanism for saving synaptic efficacy to maintain somatic hyperpolarization of the postsynaptic cells at a steady-state level during theta activity. The differences in short-term plasticity reported here would also produce a differential involvement of the O-LM and basket cells during sharp waves when pyramidal cells fire few high frequency action potentials (Freund & Buzsaki, 1996). Basket cells would respond with highest efficacy and participate in the recurrent termination of sharp wave population bursts, whereas O-LM cells may not be brought to threshold by the few action potentials that an individual pyramidal cell fires. Recording the action potential discharge of identified interneurones in vivo would provide insights into their differential roles.
Acknowledgments
The authors are grateful to Dr M. Watanabe for antibodies to mGluR1α, to Dr A. Varro for antibodies to pro-CCK, to Dr A. Buchan for antibodies to somatostatin and to Dr K. Baimbridge for antibodies to parvalbumin. We thank Ms Klara Peto, Mr Philip Cobden and Mr David J. B. Roberts for their assistance in immunocytochemistry. We thank Drs M. Capogna and F. Ferraguti for their comments on the manuscript. Z. N. was supported by a Hungarian Science Foundation grant (T032309), a Howard Hughes Medical Institute grant, and a Wellcome Trust award; Boehringer Ingelheim Awards were made to A. L. and Z. N.; and a Japanese Science and Technology grant to Z. N. and R. S. L. Z. was supported by fellowships from IBRO and CONACYT-Mexico.
REFERENCES
- Abbott LF, Varela JA, Sen K, Nelson SB. Synaptic depression and cortical gain control. Science. 1997;275:220–224. doi: 10.1126/science.275.5297.221. [DOI] [PubMed] [Google Scholar]
- Ali AB, Deuchars J, Pawelzik H, Thomson AM. CA1 pyramidal to basket and bistratified cell EPSPs: dual intracellular recordings in rat hippocampal slices. Journal of Physiology. 1998;507:201–217. doi: 10.1111/j.1469-7793.1998.201bu.x. [DOI] [PMC free article] [PubMed] [Google Scholar]
- Ali AB, Thomson AM. Facilitating pyramid to horizontal oriens-alveus interneurone inputs: dual intracellular recordings in slices of rat hippocampus. Journal of Physiology. 1998;507:185–199. doi: 10.1111/j.1469-7793.1998.185bu.x. [DOI] [PMC free article] [PubMed] [Google Scholar]
- Aradi I, Soltesz I. Modulation of network behaviour by changes in variance in interneuronal properties. Journal of Physiology. 2002;538:227–251. doi: 10.1113/jphysiol.2001.013054. [DOI] [PMC free article] [PubMed] [Google Scholar]
- Baude A, Nusser Z, Roberts JD, Mulvihill E, McIlhinney RA, Somogyi P. The metabotropic glutamate receptor (mGluR1a) is concentrated at perisynaptic membrane of neuronal subpopulations as detected by immunogold reaction. Neuron. 1993;11:771–787. doi: 10.1016/0896-6273(93)90086-7. [DOI] [PubMed] [Google Scholar]
- Buhl EH, Halasy K, Somogyi P. Diverse sources of hippocampal unitary inhibitory postsynaptic potentials and the number of synaptic release sites. Nature. 1994;368:823–828. doi: 10.1038/368823a0. [DOI] [PubMed] [Google Scholar]
- Buzsaki G. Theta oscillations in the hippocampus. Neuron. 2002;33:325–340. doi: 10.1016/s0896-6273(02)00586-x. [DOI] [PubMed] [Google Scholar]
- Castro-Alamancos MA. Properties of primary sensory (lemniscal) synapses in the ventrobasal thalamus and the relay of high-frequency sensory inputs. Journal of Neurophysiology. 2002;87:946–953. doi: 10.1152/jn.00426.2001. [DOI] [PubMed] [Google Scholar]
- Castro-Alamancos MA, Calcagnotto ME. High-pass filtering of corticothalamic activity by neuromodulators released in the thalamus during arousal: in vitro and in vivo. Journal of Neurophysiology. 2001;85:1489–1497. doi: 10.1152/jn.2001.85.4.1489. [DOI] [PubMed] [Google Scholar]
- Cope DW, Maccaferri G, Marton LF, Roberts JD, Cobden PM, Somogyi P. Cholecystokinin-immunopositive basket and Schaffer collateral-associated interneurones target different domains of pyramidal cells in the CA1 area of the rat hippocampus. Neuroscience. 2002;109:63–80. doi: 10.1016/s0306-4522(01)00440-7. [DOI] [PubMed] [Google Scholar]
- Deller T, Adelmann G, Nitsch R, Frotscher M. The alvear pathway of the rat hippocampus. Cell Tissue Research. 1996;286:293–303. doi: 10.1007/s004410050699. [DOI] [PubMed] [Google Scholar]
- Dingledine R, Borges K, Bowie D, Traynelis SF. The glutamate receptor ion channels. Pharmacological Reviews. 1999;51:7–61. [PubMed] [Google Scholar]
- Dittman JS, Kreitzer AC, Regehr WG. Interplay between facilitation, depression, and residual calcium at three presynaptic terminals. Journal of Neuroscience. 2000;20:1374–1385. doi: 10.1523/JNEUROSCI.20-04-01374.2000. [DOI] [PMC free article] [PubMed] [Google Scholar]
- Dobrunz LE, Stevens CF. Heterogeneity of release probability, facilitation, and depletion at central synapses. Neuron. 1997;18:995–1008. doi: 10.1016/s0896-6273(00)80338-4. [DOI] [PubMed] [Google Scholar]
- Ferraguti F, Cobden P, Pollard M, Watanabe M, Somogyi P. Distinct populations of mGluR1a-immunoreactive interneurones in the hippocampal CA1 area. Society for Neuroscience Abstracts. 2001;27:913. [Google Scholar]
- Freund TF, Buzsaki G. Interneurons of the hippocampus. Hippocampus. 1996;6:347–470. doi: 10.1002/(SICI)1098-1063(1996)6:4<347::AID-HIPO1>3.0.CO;2-I. [DOI] [PubMed] [Google Scholar]
- Fukuda T, Kosaka T. Gap junctions linking the dendritic network of GABAergic interneurons in the hippocampus. Journal of Neuroscience. 2000;20:1519–1528. doi: 10.1523/JNEUROSCI.20-04-01519.2000. [DOI] [PMC free article] [PubMed] [Google Scholar]
- Gupta A, Wang Y, Markram H. Organizing principles for a diversity of GABAergic interneurons and synapses in the neocortex. Science. 2000;287:273–278. doi: 10.1126/science.287.5451.273. [DOI] [PubMed] [Google Scholar]
- Ishizuka N, Weber J, Amaral DG. Organization of intrahippocampal projections originating from CA3 pyramidal cells in the rat. Journal of Comparative Neurology. 1990;295:580–623. doi: 10.1002/cne.902950407. [DOI] [PubMed] [Google Scholar]
- Jinno S, Kosaka T. Colocalization of parvalbumin and somatostatin-like immunoreactivity in the mouse hippocampus: quantitative analysis with optical dissector. Journal of Comparative Neurology. 2000;428:377–388. [PubMed] [Google Scholar]
- Katona I, Acsady L, Freund TF. Postsynaptic targets of somatostatin-immunoreactive interneurons in the rat hippocampus. Neuroscience. 1999;88:37–55. doi: 10.1016/s0306-4522(98)00302-9. [DOI] [PubMed] [Google Scholar]
- Katz B, Miledi R. The role of calcium in neuromuscular facilitation. Journal of Physiology. 1968;195:481–492. doi: 10.1113/jphysiol.1968.sp008469. [DOI] [PMC free article] [PubMed] [Google Scholar]
- Kosaka T, Katsumaru H, Hama K, Wu JY, Heizmann CW. GABAergic neurons containing the Ca2+-binding protein parvalbumin in the rat hippocampus and dentate gyrus. Brain Research. 1987;419:119–130. doi: 10.1016/0006-8993(87)90575-0. [DOI] [PubMed] [Google Scholar]
- Liu G, Tsien RW. Properties of synaptic transmission at single hippocampal synaptic boutons. Nature. 1995;375:404–408. doi: 10.1038/375404a0. [DOI] [PubMed] [Google Scholar]
- Lorente De No R. Studies on the structure of the cerebral cortex. II. Continuation of the study of the ammonic system. Journal fur Psychologie und Neurologie. 1934;46:113–177. [Google Scholar]
- McBain CJ, Dichiara TJ, Kauer JA. Activation of metabotropic glutamate receptors diferentially affects two classes of hippocampal interneurons and potentiates excitatory synaptic transmission. Journal of Neuroscience. 1994;14:4433–4445. doi: 10.1523/JNEUROSCI.14-07-04433.1994. [DOI] [PMC free article] [PubMed] [Google Scholar]
- Maccaferri G, Roberts JD, Szucs P, Cottingham CA, Somogyi P. Cell surface domain specific postsynaptic currents evoked by identified GABAergic neurones in rat hippocampus in vitro. Journal of Physiology. 2000;524:91–116. doi: 10.1111/j.1469-7793.2000.t01-3-00091.x. [DOI] [PMC free article] [PubMed] [Google Scholar]
- Magee JC, Christofi G, Miyakawa H, Christie B, Lasser-Ross N, Johnston D. Subthreshold synaptic activation of voltage-gated Ca2+ channels mediates a localized Ca2+ influx into the dendrites of hippocampal pyramidal neurons. Journal of Neurophysiology. 1995;74:1335–1342. doi: 10.1152/jn.1995.74.3.1335. [DOI] [PubMed] [Google Scholar]
- Markram H, Pikus D, Gupta A, Tsodyks M. Potential for multiple mechanisms, phenomena and algorithms for synaptic plasticity at single synapses. Neuropharmacology. 1998a;37:489–500. doi: 10.1016/s0028-3908(98)00049-5. [DOI] [PubMed] [Google Scholar]
- Markram H, Wang Y, Tsodyks M. Differential signaling via the same axon of neocortical pyramidal neurons. Proceedings of the National Academy of Sciences of the USA. 1998b;95:5323–5328. doi: 10.1073/pnas.95.9.5323. [DOI] [PMC free article] [PubMed] [Google Scholar]
- Marshall L, Henze DA, Hirase H, Leinekugel X, Dragoi G, Buzsaki G. Hippocampal pyramidal cell-interneuron spike transmission is frequency dependent and responsible for place modulation of interneuron discharge. Journal of Neuroscience. 2002;22:U6–15. doi: 10.1523/JNEUROSCI.22-02-j0001.2002. [DOI] [PMC free article] [PubMed] [Google Scholar]
- Morino P, Herrera-Marschitz M, Castel MN, Ungerstedt U, Varro A, Dockray G, Hokfelt T. Cholecystokinin in cortico-striatal neurons in the rat: immunohistochemical studies at the light and electron microscopical level. European Journal of Neuroscience. 1994;6:681–692. doi: 10.1111/j.1460-9568.1994.tb00980.x. [DOI] [PubMed] [Google Scholar]
- Nakanishi S, Nakajima Y, Nomura A, Masu M, Iwakabe H, Hayashi Y, Yokoi M. Functions and roles of glutamate receptors in synaptic transmission and plasticity. Cold Spring Harbor Symposium on Quantitative Biology. 1996;61:67–75. [PubMed] [Google Scholar]
- Nusser Z, Lujan R, Laube G, Roberts JDB, Molnar E, Somogyi P. Cell type and pathway dependence of synaptic AMPA receptor number and variability in the hippocampus. Neuron. 1998;21:545–559. doi: 10.1016/s0896-6273(00)80565-6. [DOI] [PubMed] [Google Scholar]
- Oliva AA, Jr, Jiang M, Lam T, Smith KL, Swann JW. Novel hippocampal interneuronal subtypes identified using transgenic mice that express green fluorescent protein in GABAergic interneurons. Journal of Neuroscience. 2000;20:3354–3368. doi: 10.1523/JNEUROSCI.20-09-03354.2000. [DOI] [PMC free article] [PubMed] [Google Scholar]
- Parra P, Gulyas A, Miles R. How many subtypes of inhibitory cells in the hippocampus? Neuron. 1998;20:983–993. doi: 10.1016/s0896-6273(00)80479-1. [DOI] [PubMed] [Google Scholar]
- Pikkarainen M, Ronkko S, Savander V, Insausti R, Pitkanen A. Projections from the lateral, basal, and accessory basal nuclei of the amygdala to the hippocampal formation in rat. Journal of Comparative Neurology. 1999;403:229–260. [PubMed] [Google Scholar]
- Ramon y Cajal S. Estructura del asta de ammon y fascia dentata. Anales de Sociedad espanola Historia natural. 1893;22:53–114. [Google Scholar]
- Reyes A, Lujan R, Rozov A, Burnashev N, Somogyi P, Sakmann B. Target-cell-specific facilitation and depression in neocortical circuits. Nature Neuroscience. 1998;1:279–285. doi: 10.1038/1092. [DOI] [PubMed] [Google Scholar]
- Santoro B, Grant SG, Bartsch D, Kandel ER. Interactive cloning with the SH3 domain of N-src identifies a new brain specific ion channel protein, with homology to eag and cyclic nucleotide-gated channels. Proceedings of the National Academy of Sciences of the USA. 1997;94:14815–14820. doi: 10.1073/pnas.94.26.14815. [DOI] [PMC free article] [PubMed] [Google Scholar]
- Scanziani M, Gahwiler BH, Charpak S. Target cell-specific modulation of transmitter release at terminals from a single axon. Proceedings of the National Academy of Sciences of the USA. 1998;95:12004–12009. doi: 10.1073/pnas.95.20.12004. [DOI] [PMC free article] [PubMed] [Google Scholar]
- Seeburg PH. The role of RNA editing in controlling glutamate receptor channel properties. Journal of Neurochemistry. 1996;66:1–5. doi: 10.1046/j.1471-4159.1996.66010001.x. [DOI] [PubMed] [Google Scholar]
- Shigemoto R, Kulik A, Roberts JD, Ohishi H, Nusser Z, Kaneko T, Somogyi P. Target-cell-specific concentration of a metabotropic glutamate receptor in the presynaptic active zone. Nature. 1996;381:523–525. doi: 10.1038/381523a0. [DOI] [PubMed] [Google Scholar]
- Sik A, Penttonen M, Ylinen A, Buzsaki G. Hippocampal CA 1 interneurons: an in vivo intracellular labeling study. Journal of Neuroscience. 1995;15:6651–6665. doi: 10.1523/JNEUROSCI.15-10-06651.1995. [DOI] [PMC free article] [PubMed] [Google Scholar]
- Somogyi P, Tamas G, Lujan R, Buhl EH. Salient features of synaptic organisation in the cerebral cortex. Brain Research Reviews. 1998;26:113–135. doi: 10.1016/s0165-0173(97)00061-1. [DOI] [PubMed] [Google Scholar]
- Tanaka J, Nakagawa S, Kushiya E, Yamasaki M, Fukaya M, Iwanaga T, Simon MI, Sakimura K, Kano M, Watanabe M. Gq protein a subunits Gaq and Ga11 are localized at postsynaptic extra-junctional membrane of cerebellar Purkinje cells and hippocampal pyramidal cells. European Journal of Neuroscience. 2000;12:781–792. doi: 10.1046/j.1460-9568.2000.00959.x. [DOI] [PubMed] [Google Scholar]
- Thomson AM. Facilitation, augmentation and potentiation at central synapses. Trends in Neurosciences. 2000;23:305–312. doi: 10.1016/s0166-2236(00)01580-0. [DOI] [PubMed] [Google Scholar]
- Thomson AM, Deuchars J. Temporal and spatial properties of local circuits in neocortex. Trends in Neurosciences. 1994;17:119–126. doi: 10.1016/0166-2236(94)90121-x. [DOI] [PubMed] [Google Scholar]
- Thomson AM, Deuchars J, West DC. Single axon excitatory postsynaptic potentials in neocortical interneurons exhibit pronounced paired pulse facilitation. Neuroscience. 1993;54:347–360. doi: 10.1016/0306-4522(93)90257-g. [DOI] [PubMed] [Google Scholar]
- Tsodyks MV, Markram H. The neural code between neocortical pyramidal neurons depends on neurotransmitter release probability. Proceedings of the National Academy of Sciences of the USA. 1997;94:719–723. doi: 10.1073/pnas.94.2.719. [DOI] [PMC free article] [PubMed] [Google Scholar]
- Varela JA, Sen K, Gibson J, Fost J, Abbott LF, Nelson SB. A quantitative description of short-term plasticity at excitatory synapses in layer 2/3 of rat primary visual cortex. Journal of Neuroscience. 1997;17:7926–7940. doi: 10.1523/JNEUROSCI.17-20-07926.1997. [DOI] [PMC free article] [PubMed] [Google Scholar]
- Vincent SR, McIntosh CHS, Buchan AMJ, Brown JC. Central somatostatin systems revealed with monoclonal antibodies. Journal of Comparative Neurology. 1985;238:169–186. doi: 10.1002/cne.902380205. [DOI] [PubMed] [Google Scholar]
- Von Gersdorff H, Schneggenburger R, Weis S, Neher E. Presynaptic depression at a calyx synapse: the small contribution of metabotropic glutamate receptors. Journal of Neuroscience. 1997;17:8137–8146. doi: 10.1523/JNEUROSCI.17-21-08137.1997. [DOI] [PMC free article] [PubMed] [Google Scholar]
- Zador AM, Dobrunz LE. Dynamic synapses in the cortex. Neuron. 1997;19:1–4. doi: 10.1016/s0896-6273(00)80341-4. [DOI] [PubMed] [Google Scholar]
- Zucker RS. Short-term synaptic plasticity. Annual Review of Neuroscience. 1989;12:13–31. doi: 10.1146/annurev.ne.12.030189.000305. [DOI] [PubMed] [Google Scholar]