

Abstract
To investigate paired pulse facilitation of corticogeniculate EPSCs, whole-cell patch-clamp recordings were made from principal cells in the rat dorsal lateral geniculate nucleus (dLGN) in vitro. Thalamic slices, oriented so that both corticogeniculate and retinogeniculate axons could be stimulated, were cut from young (16- to 37-day-old) DA-HAN rats. Corticogeniculate EPSCs displayed pronounced paired pulse facilitation at stimulus intervals up to 400 ms. The facilitation had a fast and a slow component of decay with time constants of 12 ± 7 and 164 ± 47 ms (means ± s.d.), respectively. Maximum paired pulse ratio (EPSC2 × EPSC1−1) was 3.7 ± 1.1 at the 20-30 ms interval. Similar to other systems, the facilitation was presynaptic. Retinogeniculate EPSCs recorded in the same dLGN cells displayed paired pulse depression at intervals up to at least 700 ms. The two types of EPSCs differed in their calcium response curves. At normal [Ca2+]o, the corticogeniculate synapse functioned over the early rising part of a Hill function, while the retinogeniculate synapse operated over the middle and upper parts of the curve. The paired pulse ratio of corticogeniculate EPSCs was maximal at physiological [Ca2+]o. The facilitation is proposed to have an important role in the function of the corticogeniculate circuit as a neuronal amplifier.
In the dorsal lateral geniculate nucleus (dLGN), the visual relay nucleus of the thalamus, neurones are excited by two major glutamatergic fibre tracts. Principal cells relay visually evoked activity from a small number of neighbouring ganglion cells in the retina (Hubel & Wiesel, 1961) and receive feedback excitation from pyramidal cells in layer six of the primary visual cortex (Gilbert & Kelly, 1975). From anatomical data in the rat it can be estimated that the descending fibres from the cortex are about ten times more abundant than the retinal axons to the dLGN (Peters et al. 1985; Sefton & Dreher, 1995). Even so, the functional role of this massive corticogeniculate projection remains elusive.
Corticogeniculate neurones receive direct excitatory connections from principal cells which they in turn innervate (Ahlsén & Lindström, 1982; Ferster & Lindström, 1983; Lindström & Wróbel, 1990). The same neurones also send an intracortical axon collateral to stellate cells in layer four, the main entry point for visual information to the cortex (Gilbert & Wiesel, 1979; Ferster & Lindström, 1985a,b; Tarczy-Hornoch et al. 1999). Thus, corticogeniculate neurones are organised as a combined excitatory feedback-feedforward circuit. We have previously proposed that the system works as a variable neuronal amplifier that enhances the transfer of visual information to the cortex in the attentive state (Ahlsén et al. 1985; Ferster & Lindström, 1985b; Lindström & Wróbel, 1990). The finding that corticogeniculate cells are poorly responsive in anaesthetised or sleeping animals is in keeping with this idea (Livingstone & Hubel, 1981). A number of other functions have been ascribed to the corticogeniculate system, including binocular interaction (Schmielau & Singer, 1977), end-inhibition (Murphy & Sillito, 1987), action potential synchronisation (Sillito et al. 1994) and shifting between burst and tonic firing mode of the principal cell (McCormick & von Krosigk, 1992; Godwin et al. 1996). Most such effects can be incorporated in the concept of a neuronal amplifier.
The dLGN is not the only thalamic nucleus to receive an impressive cortical feedback. Large numbers of synapses are formed by corticothalamic neurones in the sensory and motor parts of the thalamus (Steriade et al. 1997). When such axons are stimulated repetitively, the responses display a marked frequency-dependent facilitation (Ferster & Lindström, 1985a,b; Deschênes & Hu, 1990; Lindström & Wróbel, 1990; McCormick & von Krosigk, 1992; Turner & Salt, 1998; von Krosigk et al. 1999; Golshani et al. 2001). The hypothesis of a neuronal amplifier is reliant on this common feature and brings together the corticothalamic feedback for the different modalities to a common principle, namely a variable gain regulation of thalamocortical transfer (Ahlsén et al. 1985).
To characterise the corticogeniculate excitation of principal cells in the dLGN, paired pulse stimulation was used in combination with whole-cell patch-clamp recordings of EPSCs in dLGN cells in thalamic slices from young rats. It will be shown that the facilitation at the corticogeniculate synapse is similar in nature but larger in magnitude than facilitation at most other central synapses (e.g. Stevens & Wang, 1995; Thomson et al. 1995; Atluri & Regehr, 1996; Rozov et al. 2001). This striking facilitation, found at physiological [Ca2+]o, highlights its functional role for the corticogeniculate feedback system. Some results have been presented in abstract form (Granseth et al. 2000a).
METHODS
Preparation of dLGN slices
Brain slices were prepared from pigmented DA-HAN rats (BK Universal, Sollentuna, Sweden) of both sexes, 16-37 days old. Animals were anaesthetised with halothane (ISC Chemicals, Avonmouth, UK) and decapitated. All procedures were approved by the Linköping Committee for ethics in animal research, in accordance with Swedish animal welfare legislation. Brains were rapidly transferred to ice-cold Krebs medium containing (mm): sucrose, 248; NaH2PO4, 1.25; NaHCO3, 26; KCl, 3.0; MgCl2 6.0; CaCl2, 0.5; myo-inositol, 3.0; ascorbic acid, 0.5; lactic acid, 4.0; and glucose, 10; equilibrated with 95 % O2-5 % CO2. Slices, 250-300 μm thick, were cut on a vibroslicer (Campden Instruments, Leicester, UK) in a plane, close to the parasaggital, that saves distal projections to the dLGN from corticogeniculate and retinal ganglion cells (Turner & Salt, 1998). Slices were stored for at least 1 h before recordings in Krebs medium containing (mm): NaCl, 124; NaH2PO4, 1.25; NaHCO3, 26; KCl, 3.0; MgCl2 2.0; CaCl2, 4.0; myo-inositol, 3.0; ascorbic acid, 0.5; lactic acid, 4.0; and glucose, 10; at 37 °C equibrilated with 95 % O2-5 % CO2.
Recording procedures
For patch-clamp recordings, slices were transferred to a separate recording chamber and submerged in Krebs medium containing (mm): NaCl, 124; NaH2PO4, 1.25; NaHCO3, 26; KCl, 3.0; MgCl2 2.0; CaCl2, 2.0; and glucose, 10; at 34 °C equilibrated with 95 % O2-5 % CO2. To block GABAA receptors, picrotoxin was routinely added to the medium to a final concentration of 100 μM. Unless specified in the text, 100 μM dl-2-amino-5-phosphonovaleric acid (dl-APV) was included to suppress NMDA receptor currents. When required, calcium ions in the medium were replaced by equimolar amounts of magnesium ions to maintain the gigaseal (Formenti & De Simoni, 2000) and minimise changes in nerve fibre excitability. For [Ca2+]o above 3.0 mm, [Mg2+]o was maintained at 1.0 mm.
Excitatory postsynaptic currents (EPSCs) were recorded in the whole-cell mode of the patch-clamp technique using an EPC9 amplifier (HEKA Elektronik, Lambrecht, Germany). Borosilicate glass microelectrodes (Clark Electromedical, Reading, UK) were made with a PIP5 pipette puller (HEKA Elektronik). To optimise the space clamp and block GABAB-mediated currents, a caesium gluconate-based buffer containing QX-314 and TEA was used in the microelectrodes (mm: caesium gluconate, 100; NaCl, 10; Hepes, 10; TEA-Cl, 20; QX-314, 5.0; EGTA, 0.10; and MgATP 1.0; pH adjusted to 7.3 and osmolality to 300 mmol kg−1). Tip resistance was 3-6 MΩ.
Individual principal cells in the dLGN were identified with an Axioskop FS microscope (Zeiss, Jena, Germany) with water immersion objectives and infrared differential phase contrast optics equipped with an infrared digital camera (C7500, Hamamatsu, Hamamatsu City, Japan). Before seal formation the surface of the neurone was washed from debris by applying a small pressure to the interior of the recording electrode (Sakmann & Stuart, 1995). Seals were initially 1.0-2.5 GΩ and after rupturing the cell membrane access resistance was <30 MΩ. In experiments where holding potential was to be changed, access resistance was <15 MΩ. It was not allowed to vary by more than 10 % in experiments with pharmacological or ion concentration interventions. Whole-cell capacitance was 144 ± 43 pF and input resistance 400 ± 167 MΩ. Neurones were voltage clamped at −70 mV, adjusted for a liquid junction potential of 8 mV. Records were sampled at 20 kHz and filtered at 4.0 kHz using a Pulse software (HEKA Elektronik) and stored to the hard disk of a computer.
To stimulate retinogeniculate axons (Fig. 1A), a bipolar electrode (World Precision Instruments, Sarasota, FL, USA) was placed at the caudal ventral border of the dLGN. Corticogeniculate fibres were stimulated with a bipolar electrode rostroventrally to the dLGN (Turner & Salt, 1998). Amplitude-graded voltage pulses of 0.2 ms duration were generated by Iso-flex stimulus isolators (AMPI, Jerusalem, Israel) and a Master 8 pulse generator (AMPI) at a stimulus repetition rate of 0.2-0.5 Hz. Threshold stimulation intensity for retinogeniculate fibres was 1-25 V. For corticogeniculate axons the threshold was 1-10 V. Corticogeniculate axons were, unless specified, stimulated at an intensity that recruited many fibres in order to minimise response variability and to provide representative measurements. With the chosen intensity and electrode placement, antidromic spikes were rarely evoked in dLGN cells.
Figure 1. Schematic diagram of major excitatory connections of dLGN principal cells and effects of paired pulse stimulation.
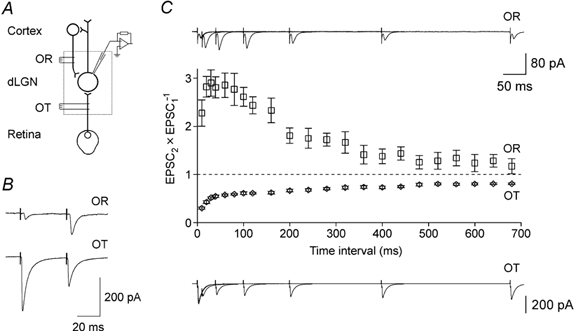
A, slice preparations of the dLGN (dotted box) were cut with an orientation that preserved distal axons of excitatory corticogeniculate and retinogeniculate neurones. The axons were stimulated by bipolar electrodes in the optic radiation (OR) and the optic tract (OT) using amplitude-graded voltage pulses. Recordings were obtained with patch-clamp electrodes from principal cells identified by infrared differential phase contrast microscopy. B, averaged EPSCs (10 responses) evoked in the same principal cell by paired pulse stimulation of either the optic radiation (OR) or the optic tract (OT). For clarity, several OR axons were stimulated to elicit compound EPSCs, while a single OT fibre evoked large unitary EPSCs. Note pronounced paired pulse facilitation for corticogeniculate EPSCs and depression for retinogeniculate EPSCs. C, paired pulse ratios (EPSC2× EPSC1−1) at different stimulation intervals. Each point represents the mean of 20 responses; error bars indicate 95 % confidence interval (CI). Sample records are superimposed averages of 20 responses for 6 different stimulus intervals. Records in B and C are from different cells.
Data analysis
EPSC amplitudes were measured manually using PulseFit software (HEKA Elektronik) after digital Bessel filtering at 1.5 kHz. At intervals less than 30 ms the second EPSC was sometimes superimposed on the decay phase of the first. In such cases, single stimuli EPSCs were averaged, scaled, and subtracted at the appropriate interval from the second EPSC trace. EPSCs were averaged using PulseFit or IgorPro software (Wavemetrics, Lake Oswego, OR, USA). For quantitative comparisons, at least ten individual responses were averaged. A measure of facilitation or depression was obtained from the amplitude of the first (EPSC1) and second EPSC (EPSC2) by the formula EPSC2 × EPSC1−1. Functions were fitted using a least sum of squares method to the data with Origin (MicroCal, Northampton, MA, USA) or Igor Pro computer programs.
Statistics
Values are given as means ± s.d. unless otherwise stated. Data were statistically evaluated with Student's paired or unpaired t test; P < 0.05 was considered significant. Confidence intervals (CI) were determined using the t distribution and significance level P < 0.05.
Chemicals
Picrotoxin, kynurenic acid (4-hydroxyquinoline-2-carboxylic acid), dl-APV (dl-2-amino-5-phosphonovaleric acid), QX-314 (lidocaine N-ethyl bromide), TEA (tetraethylammonium chloride), gluconic acid (2,3,4,5,6-pentahydroxycaproic acid), CsOH, EGTA (ethylene glycol-bis(β-aminoethylether)-N,N,N′,N′-tetraacetic acid) and Mg-ATP (adenosine 5′-triphosphate, magnesium salt), were purchased from Sigma, St Louis, MO, USA. All other chemicals were obtained from Merck, Darmstadt, Germany.
RESULTS
Properties of EPSCs from retinogeniculate and corticogeniculate fibres
Recordings were obtained from 80 dLGN cells in slices from 50 animals. Retinogeniculate EPSCs were evoked in 37 cells and corticogeniculate EPSCs in 73 cells. Stimulation of retinogeniculate fibres gave rise to EPSCs with short latencies (2.2 ± 0.7 ms), consisting of large unitary components (−374 ± 350 pA) that were recruited in distinct steps as the stimulation intensity was increased (Paulsen & Heggelund, 1994; Turner & Salt, 1998). When paired stimuli were used, the second EPSC was much depressed in all cells (Fig. 1B). In contrast, EPSCs evoked by paired stimulation of corticogeniculate fibres displayed pronounced facilitation in all but one cell. The exceptional cell was lost before a thorough analysis could be performed and might have been misclassified. Corticogeniculate responses had long latencies (3.9 ± 1.0 ms) and small unitary EPSC components (−8.3 ± 1.0 pA). The responses in the present study were, unless specified, compound EPSCs evoked by stimulation of many axons.
Application of the broad spectrum excitatory amino acid antagonist kynurenic acid abolished both retinogeniculate (4 cells) and corticogeniculate responses (6 cells) consistent with both synapses being glutamatergic (Turner & Salt, 1998; von Krosigk et al. 1999). The NMDA receptor antagonist dl-APV had no effect on the peak amplitude of corticogeniculate EPSCs or the paired pulse facilitation (see below). It was, however, routinely added to the extracellular solution because NMDA receptor currents could occur when holding potential or extracellular electrolyte concentrations were changed.
Time course of paired pulse facilitation of corticogeniculate EPSCs
When the time interval between paired stimuli was varied between 10 and 700 ms in 11 cells, paired pulse facilitation of corticogeniculate EPSCs was present at intervals up to at least 400 ms (Fig. 1C). The facilitation was optimal at 20-30 ms stimulus separation and was typically less pronounced at shorter intervals. This pattern of paired pulse facilitation is consistent with an early, short lasting depression observed at other facilitating synapses (Stevens & Wang, 1995; Thomson & Bannister, 1999; Turecek & Trussel, 2000). The peak paired pulse ratio was 3.7 ± 1.1, decreasing to 2.4 ± 0.6 at 100 ms and to 1.2 ± 0.1 at 400 ms interval. The decay of facilitation was well described by double exponential functions with time constants τfast = 12 ± 7 ms and τslow = 164 ± 47 ms. In two cells only the slow component could be resolved.
The time course of paired pulse depression of retinogeniculate EPSCs was investigated in five cells. Depression was found in all cells at all studied time intervals (Fig. 1C). The smaller the pulse interval, the more pronounced was the depression. With an interval of 10 ms, the mean paired pulse ratio was 0.3 ± 0.1 and with 100 ms it was 0.6 ± 0.1. A significant depression (0.8 ± 0.1) still remained at 700 ms.
Magnitude of paired pulse facilitation of corticogeniculate EPSCs
Paired pulse facilitation was typically investigated with a stimulus interval of 40 ms, when facilitation was prominent with minimal interference from early depression (Stevens & Wang, 1995; Thomson & Bannister, 1999; Turecek & Trussel, 2000). The mean paired pulse ratio was 3.7 ± 1.6 (64 cells; Fig. 2A). No difference in facilitation was observed in slices from animals of different ages (16-37 days), indicating that the facilitation was mature shortly after eye opening.
Figure 2. Paired pulse facilitation of corticogeniculate EPSCs at different animal ages and degrees of recruitment.
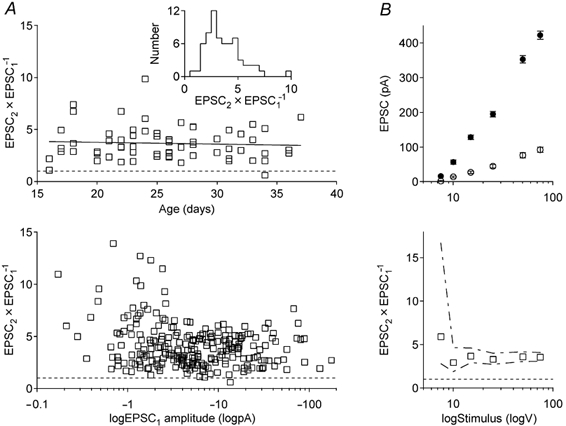
A, paired pulse ratio (EPSC2× EPSC1−1) of corticogeniculate EPSCs in 64 principal cells, in slices from 47 animals. Stimulus interval was 40 ms. Top graph, average paired pulse ratio in cells from animals aged 16-37 days. Linear regression (r2 < 0.01) suggests no change in facilitation. Inset shows distribution of average paired pulse facilitation for the cells. Bottom graph plots paired pulse ratio versus average amplitude of EPSC1. Different amplitudes were obtained by recruiting more OR fibres by increasing stimulation intensity (246 trials in 64 cells). Note logarithmic scale for X-axis. B, recruitment of compound EPSCs over a forty-fold range in amplitudes in 1 cell. In the top graph, amplitudes of EPSC1 (○) and EPSC2 (•) are plotted against stimulation intensity. Each point is the mean (± CI) of 20 responses. Corresponding paired pulse ratios are plotted in the bottom graph. Dashed lines define statistical maximum and minimum values from confidence limits of EPSC1 and EPSC2.
Stimulation intensity was varied in most cells to generate EPSC1 ranging in amplitude from less than −1 to more than −100 pA. The facilitation was consistently large over the entire range of recruitment (Fig. 2A, lower panel). In a representative cell (Fig. 2B), the mean EPSC increased almost forty-fold, from −2.4 to −93 pA, when the stimulation intensity was changed from 7.5 to 75 V. The paired pulse ratio remained the same at all amplitudes except for the smallest EPSCs. At this intensity, there were many response failures due to the quantal nature of corticogeniculate synaptic transmission. Since the failure rate was much higher for EPSC1 than EPSC2, a ratio of the means tends to overestimate the facilitation (see Kim & Alger, 2001). The same problem applies to the apparent high facilitation at average EPSC1 values smaller than −3 pA in Fig. 2A. Increasing the sample size would reduce this error. For five cells, where >100 unitary responses were averaged, the paired pulse ratio was 3.2 ± 1.1, i.e. not different from the average of all cells (P = 0.56).
Effects of changes in extracellular calcium ion concentration
As for other synapses (Katz & Miledi, 1968; Rahamimoff, 1968; Thomson et al. 1995; Rozov et al. 2001), the amplitude of corticogeniculate EPSCs was much dependent on [Ca2+]o (Fig. 3A). Increasing [Ca2+]o from 2.0 to 5.0 mm more than doubled both the first and second EPSC amplitudes, while reducing [Ca2+]o to 0.5 mm virtually abolished the EPSCs. Hill functions fitted to the normalised EPSC amplitude revealed that the corticogeniculate synapse operated in the lowest range of the calcium dependency curve (Fig. 3A). Also, facilitated EPSCs were far from saturation. In contrast, the retinogeniculate synapse operated over the middle and upper part of the curve (Fig. 3C), as found for other synapses with paired pulse depression (Rozov et al. 2001).
Figure 3. Effect of changes in [Ca2+]o on amplitude and paired pulse ratio of corticogeniculate and retinogeniculate EPSCs.

A, corticogeniculate EPSCs evoked by paired stimuli at different values of [Ca2+]o, balanced with [Mg2+]o as detailed in Methods. Graph shows mean amplitude (± CI) of EPSC1 (○) and EPSC2 (•) in 11 principal cells, normalised with respect to EPSC1 at 2.0 mm[Ca2+]o. Continuous lines are Hill functions (EPSC = EPSCmax×[Ca2+]oN× (K1/2N+[Ca2+]oN)−1). A least sum of squares fit to the data gave N = 2.1 and K1/2= 6.0 for EPSC1 and N = 2.6 and K1/2= 2.7 for EPSC2. EPSCmax 10.0 was derived from EPSC2 and was used for both functions. Data points for 4.0 and 5.0 mm[Ca2+]o lack error bars and were not included in curve fits since they derive from only 2 cells. B, paired pulse ratio (± CI) versus[Ca2+]o for the same EPSCs. Continuous line indicates theoretical facilitation derived from Hill functions. C, retinogeniculate EPSCs evoked by paired stimuli at different values of [Ca2+]o. Top graph shows mean amplitude of EPSC1 (▵) and EPSC2 (▴) in 3 principal cells. Symbols at 0.5 mm[Ca2+]o are overlapping. Amplitudes are normalised with respect to EPSC1 at 2.0 mm[Ca2+]o. Continuous line is Hill function EPSC = 1.4 ×[Ca2+]o2.5× (1.32.5+[Ca2+]o2.5)−1 from fit to EPSC1. Corresponding paired pulse ratio is plotted in bottom graph.
Although paired pulse facilitation of corticogeniculate EPSCs was distinct at all values of [Ca2+]o, it was maximal close to the physiological level (1.0-1.5 mm; Fig. 3B) and decreased both at higher and lower [Ca2+]o. Facilitation is generally less pronounced at high [Ca2+]o (Magleby, 1987; Rozov et al. 2001) but a decrease at low [Ca2+]o has not yet been described for a central synapse. Comparing averages, paired pulse ratio for corticogeniculate EPSCs decreased from 3.7 ± 0.5 to 1.8 ± 0.7 (P = 0.01, 4 cells) when [Ca2+]o was lowered from 2.0 to 0.5 mm. One concern with this observation might be that a high proportion of EPSC failures were encountered at 0.5 mm [Ca2+]o, more so for the first (81 ± 7 %) than for the second stimulus (69 ± 15 %; 4 cells). Such multiple failures cannot explain the observed decrease in facilitation since they would bias the ratio in the direction towards increased facilitation (see above; Kim & Alger, 2001).
A representative cell illustrating the decrease in paired pulse ratio with low [Ca2+]o is shown in Fig. 4A. For the corticogeniculate EPSC, the paired pulse ratio estimated from a floating average of consecutive EPSCs increased at a [Ca2+]o of 1.0 mm but decreased at a [Ca2+]o of 0.5 mm. A similar pattern was also obtained when the original recordings were averaged electronically (ratios were 3.9, 4.6 and 2.6 at [Ca2+]o 2.0, 1.0 and 0.5 mm, respectively). For retinogeniculate EPSCs the paired pulse ratio changed from depression to a small facilitation when [Ca2+]o was lowered to 1.0 mm (Fig. 4B) or 0.5 mm (not illustrated). The finding that the facilitation at corticogeniculate synapses is largest at physiological [Ca2+]o is in agreement with the idea that the facilitation has a physiological role for this pathway (Ahlsén et al. 1985; Lindström & Wróbel, 1990).
Figure 4. Paired EPSCs evoked by corticogeniculate and retinogeniculate axons at different values of [Ca2+]o.

Paired pulse facilitation after manipulations to the postsynaptic cell
Paired pulse ratios of corticogeniculate EPSCs remained the same at different holding potentials of the recorded cell (4 cells). For the cell in Fig. 5A, EPSCs were evoked at holding potentials between +40 and −100 mV. The EPSCs had reversal potentials suggestive of a nonselective monovalent cation conductance. Current-voltage relationships were linear over the entire range of holding potentials for both the first and second EPSC. Consequently, the paired pulse ratio remained the same at different membrane potentials of the postsynaptic cell, i.e. it was independent of changes in EPSC driving force.
Figure 5. Peak amplitudes of corticogeniculate EPSCs at different holding potentials.
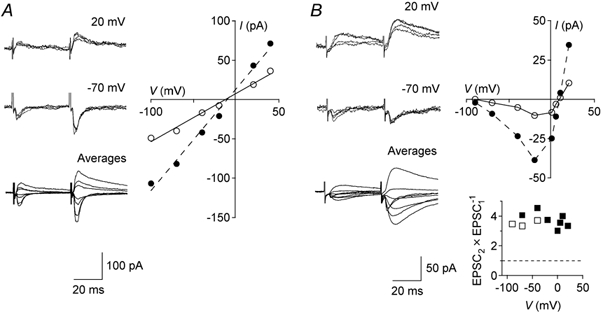
A, corticogeniculate EPSCs with standard concentration of dl-APV (100 μM). Top and middle traces show four superimposed consecutive records at +20 and −70 mV holding potential. Lower traces are superimposed averages of records at membrane potentials ranging from +40 to −100 mV. Peak amplitude (I) of EPSC1 (○) and EPSC2 (•) at different holding potentials (V) are plotted in the current-voltage diagram. For linear functions fitted to the data, reversal potentials were −12 mV for EPSC1 (r2= 0.99) and −10 mV for EPSC2 (r2= 0.99). All data points are averages of 10 responses. B, corticogeniculate EPSCs without dl-APV. Top and middle traces show four superimposed consecutive records at +20 and −70 mV. Lower traces are superimposed averages of records at +20 to −100 mV. Current-voltage plot with EPSC amplitudes measured 33 ms after first (○) and second stimulus (•) at different holding potentials. A drop in conductance at membrane potentials less than −40 mV, characteristic of NMDA currents, was present. The bottom graph plots paired pulse ratio for putative NMDA component (▪) and peak current (□) at different values of V. Averages of 20 responses.
To further explore if postsynaptic activity was important for paired pulse facilitation in corticogeniculate synapses, EPSC size was decreased by partly blocking glutamate receptors with kynurenic acid (KA; Fig. 6). Average EPSC amplitudes were about halved by adding KA to a final concentration of 250 μM. The paired pulse facilitation remained unchanged, as evident by scaling and superimposing the partly blocked response to the control (lower right trace in Fig. 6A). Similar findings were obtained for three more cells.
Figure 6. Effects on amplitude and paired pulse facilitation of corticogeniculate EPSC blockade by kynurenic acid and dl-APV.
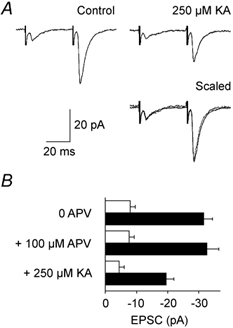
A, averaged recordings of 35 responses in 1 cell during control conditions (left trace) and with 250 μM KA in extracellular medium (upper right trace). Lower right traces show KA-antagonised EPSCs (dotted line), scaled to control EPSC1 and superimposed on control trace (continuous line). Paired stimulation of OR axons, stimulus interval 40 ms. B, histogram of mean EPSC amplitudes (□, EPSC1; ▪, EPSC2) before and after sequential addition of dl-APV and KA to the extracellular medium; same cell as in A. Error bars are CI, 35 responses. Paired pulse ratios were similar (4.0, 4.3 and 4.4, respectively; P = 0.40, single factor ANOVA). Holding potential was −70 mV.
As mentioned previously, EPSC peak amplitudes, and consequently paired pulse ratios, were unchanged by dl-APV blockade of NMDA receptors at the standard holding potential (−70 mV; Fig. 6B). Without dl-APV, a late NMDA receptor-mediated EPSC component was visible at more positive holding potentials (Fig. 5B). At +20 mV the paired pulse ratio for the late current, measured after the end of the non-NMDA component, was 2.7 ± 0.6 (4 cells). This value was not different from the paired pulse ratio of the non-NMDA component at −70 mV (3.2 ± 0.7; P = 0.13) in the same cells. The full current-voltage relationship for one of these cells is illustrated in Fig. 5B. Thus, the paired pulse facilitation of corticogeniculate EPSCs was independent of postsynaptic conditions (receptor blockade, receptor types and driving force), confirming a presynaptic mechanism in common with other synapses.
DISCUSSION
Corticogeniculate EPSCs in dLGN principal cells displayed pronounced facilitation as suggested in earlier in vivo studies (Lindström & Wróbel, 1990). This facilitation was in apparent contrast to the depression of retinogeniculate EPSCs in the same cells (Paulsen & Heggelund, 1994; Turner & Salt, 1998). The paired pulse facilitation at corticogeniculate synapses seemed homogeneous in animals of different age, in different cells and at all levels of recruitment. At optimal stimulus interval, the second facilitated EPSC was typically three to four times larger than the resting response. This striking facilitation could be entirely accounted for by a presynaptic mechanism, as for the neuromuscular junction and other excitatory synapses in the mammalian central nervous system (Katz & Miledi, 1968; Neher, 1998; Zucker & Regehr, 2002). The presynaptic origin is an important finding since earlier studies have attributed corticothalamic facilitation to activation of postsynaptic NMDA receptors (Deschênes & Hu, 1990; Scharfman et al. 1990).
Effect of extracellular calcium ions
Facilitation seems to be a common feature of synapses, although the extracellular Ca2+:Mg2+ ratio may have to be reduced to uncover the effect in many systems (Katz & Miledi, 1968; Rahamimoff, 1968; Magleby, 1987; Neher, 1998; Zucker & Regehr, 2002). The retinogeniculate synapse belongs to the latter category (Fig. 4B; Paulsen & Heggelund, 1994) while the corticogeniculate synapse displays pronounced facilitation at the physiological calcium level. Facilitation at normal [Ca2+]o has been seen before at excitatory synapses in the hippocampus (Wigström & Gustafsson, 1981; Stevens & Wang, 1995; Dittman et al. 2000), the cerebellum (Atluri & Regehr, 1996; Dittman et al. 2000) and the neocortex (Thomson et al. 1995; Rozov et al. 2001). Although the mechanism of facilitation seems to be basically the same for all these synapses, the magnitude at the population level seems to be larger for the corticogeniculate system.
The pronounced facilitation of corticogeniculate EPSCs could be related to the finding that the synapse normally operates at the very low end of the calcium response curve (estimated K1/2 = 6.0 and 2.7 mm, Hill functions for EPSC1 and EPSC2, respectively). This finding suggests a very low resting release probability under physiological conditions. The retinogeniculate synapse operates at the other end of the calcium response curve. A similar difference in calcium dependency between facilitating and depressing synapses has recently been described for the rat neocortex (Rozov et al. 2001).
The corticogeniculate EPSCs showed pronounced facilitation over the entire range of [Ca2+]o investigated, with a maximal effect close to the physiological level. A decrease in facilitation at low [Ca2+]o was postulated by Rozov et al. (2001) but not observed (see, however, Rahamimoff, 1968). To reveal this reduction in the present system, [Ca2+]o had to be lowered to 0.5 mm, i.e. below the concentration used by Rozov et al. (2001). At this low concentration, response failures were frequent even for compound EPSCs but failures would, if anything, bias the ratio towards increased facilitation (Kim & Alger, 2001), i.e. opposite to the observed effect. Another putative source of error, a contamination of evoked EPSCs with noise or spontaneous EPSCs, was excluded by the finding that the paired pulse ratio was decreased also in electronic averages of evoked EPSCs. Hence, the corticogeniculate synapse seems to have calcium kinetics that provides optimal facilitation at physiological [Ca2+]o. We take this property to indicate that facilitation is an integral element of the normal function of this synapse.
Mechanism of facilitation
Studies during the last decade have revealed that the transmitter release mechanism is surprisingly complicated, with several proteins involved in the sequence of events leading to exocytosis of synaptic vesicles (Bajjalieh, 1999). Despite intense research efforts, the molecular identity of the critical calcium sensor is still uncertain, although synaptotagmins seem to be the favoured candidates (Augustine, 2001). Even less is known about the molecular mechanism that underlies paired pulse facilitation. Traditionally, facilitation has been explained in terms of the ‘residual calcium’ hypothesis (Katz & Miledi, 1968; Zucker & Regehr, 2002). In its simplest form, low levels of calcium remaining in the terminal from a preceding impulse are assumed to add to the calcium inflow during a subsequent impulse and enhance the transmitter release. Such a mechanism could possibly explain moderate facilitation but is clearly unsatisfactory for systems with a multifold facilitation, such as the corticogeniculate synapse.
To account for pronounced facilitation, it has been suggested that the transmitter release depends on two calcium sensors, a low-affinity sensor triggering fast release and a high-affinity sensor responsible for facilitation (Atluri & Regehr, 1996; Zucker & Regehr, 2002). The facilitating calcium sensor would be at some distance from the calcium channels and function by ‘priming’ the vesicles for release, possibly by changing their interaction with the cytoskeleton (Tang et al. 2000). In this model, the low resting release would result from a small number of release-ready, ‘primed’ vesicles. Recently, a calcium buffer hypothesis has been suggested as an alternative explanation of facilitation (Neher, 1998; Rozov et al. 2001). An endogenous high-affinity calcium buffer is postulated to compete with the trigger sensor by chelating the calcium ions entering during the first impulse. With subsequent impulses the buffer would partly saturate and more calcium ions be available at the release trigger, thereby causing facilitation. Both models assume a low resting release probability. They could also account for a decreased facilitation at very low [Ca2+]o, as found here for the corticogeniculate synapse. In the vesicle priming model, too few calcium ions would diffuse to the remote calcium sensor; in the buffer model, too large buffer capacity would remain after the first impulse.
As a word of caution, the decay of facilitation suggests the involvement of more than one component (Magleby, 1987; Zucker & Regehr, 2002). In most dLGN cells the paired pulse facilitation of corticogeniculate EPSCs decayed with two time constants in the range of tens and hundreds of milliseconds. An additional component, operating over the time scale of seconds (augmentation; Magleby, 1987; Zucker & Regehr, 2002), is also present (Granseth et al. 2000b). Thus, several mechanisms might be involved in the increase of transmitter release with repetitive activation at this synapse.
The corticogeniculate system as a neuronal amplifier
In his searchlight hypothesis, Crick (1984) proposed that recurrent activation of thalamic relay neurones might represent a neuronal correlate of visual attention. This activation, he suggested, would arise from rebound activation of principal cells following recurrent inhibition from neurones in the thalamic reticular nucleus. Since this pattern of activity only occurs in an inattentive state, such as during sleep and drowsiness (Steriade et al. 1997), this inhibitory pathway cannot be the source of active attention. A more attractive alternative is the recurrent excitatory pathway formed by corticogeniculate neurones (Ahlsén & Lindström, 1982; Lindström & Wróbel, 1990). These neurones are highly excitable during arousal (Livingstone & Hubel, 1981) which, in combination with a pronounced facilitation, could generate the required excitation. In fact, the time course of facilitation implies a transient enhancement suitable for attention control.
From the dynamics of facilitation, it also follows that the excitation evoked by each impulse would increase with the firing frequency of the corticogeniculate neurone. A feedback system operating in this way can be viewed as a neuronal amplifier regulating the gain in the frequency domain. By selective control of the excitability of corticogeniculate neurones (Livingstone & Hubel, 1981; Ferster & Lindström, 1985b), the gain of signal transmission through the dLGN could be varied according to the behavioural state.
Most other studies pertinent to the function of the corticogeniculate system have focused on modulation of receptive field properties (Schmielau & Singer, 1977; Murphy & Sillito, 1987; Sillito et al. 1994). The results of such investigations mainly reflect the specificity of functional connections within the system. Our suggestion that the corticogeniculate pathway operates as a variable neuronal amplifier is not at odds with ideas from such studies. Both perspectives, the synaptic amplification and the specificity of connections, are required for a satisfactory description of the functional role of the corticogeniculate feedback system.
Acknowledgments
We thank Eric Hanse and Bengt Gustafsson for introducing us to patch-clamp recordings in brain slices. This work was supported by a grant from the Swedish medical research council (Project no. 4767). B. G. is a PhD student at Forum Scientum, supported by the Swedish foundation for strategic research.
REFERENCES
- Ahlsén G, Lindström S. Monosynaptic excitation of principal cells in the lateral geniculate nucleus by corticofugal fibres. Brain Research. 1982;234:454–458. doi: 10.1016/0006-8993(82)90886-1. [DOI] [PubMed] [Google Scholar]
- Ahlsén G, Lindström S, Lo F-S. Interaction between inhibitory pathways to principal cells in the lateral geniculate nucleus of the cat. Experimental Brain Research. 1985;58:134–143. doi: 10.1007/BF00238961. [DOI] [PubMed] [Google Scholar]
- Atluri PP, Regehr WG. Determinants of the time course of facilitation at the granule cell to Purkinje cell synapse. Journal of Neuroscience. 1996;16:5661–5671. doi: 10.1523/JNEUROSCI.16-18-05661.1996. [DOI] [PMC free article] [PubMed] [Google Scholar]
- Augustine GJ. How does calcium trigger neurotransmitter release. Current Opinion in Neurobiology. 2001;11:320–326. doi: 10.1016/s0959-4388(00)00214-2. [DOI] [PubMed] [Google Scholar]
- Crick F. Function of the thalamic reticular complex: the searchlight hypothesis. Proceedings of the National Academy of Sciences of the USA. 1984;81:4586–4590. doi: 10.1073/pnas.81.14.4586. [DOI] [PMC free article] [PubMed] [Google Scholar]
- Deschênes M, Hu B. Electrophysiology and pharmacology of the corticothalamic input to the lateral thalamic nuclei: an intracellular study in the cat. European Journal of Neuroscience. 1990;2:140–152. doi: 10.1111/j.1460-9568.1990.tb00406.x. [DOI] [PubMed] [Google Scholar]
- Dittman JS, Kreitzer AC, Regehr WG. Interplay between facilitation, depression, and residual calcium at three presynaptic terminals. Journal of Neuroscience. 2000;20:1374–1385. doi: 10.1523/JNEUROSCI.20-04-01374.2000. [DOI] [PMC free article] [PubMed] [Google Scholar]
- Ferster D, Lindström S. An intracellular analysis of geniculo-cortical connectivity in area 17 of the cat. Journal of Physiology. 1983;342:181–215. doi: 10.1113/jphysiol.1983.sp014846. [DOI] [PMC free article] [PubMed] [Google Scholar]
- Ferster D, Lindström S. Augmenting responses evoked in area 17 of the cat by intracortical axon collaterals of cortico-geniculate cells. Journal of Physiology. 1985a;367:217–232. doi: 10.1113/jphysiol.1985.sp015821. [DOI] [PMC free article] [PubMed] [Google Scholar]
- Ferster D, Lindström S. Synaptic excitation of neurones in area 17 of the cat by intracortical axon collaterals of cortico-geniculate cells. Journal of Physiology. 1985b;367:233–252. doi: 10.1113/jphysiol.1985.sp015822. [DOI] [PMC free article] [PubMed] [Google Scholar]
- Formenti A, De Simoni A. Effects of extracellular Ca2+ on membrane and seal resistance in patch-clamped rat thalamic and sensory ganglion neurons. Neuroscience Letters. 2000;279:49–52. doi: 10.1016/s0304-3940(99)00951-9. [DOI] [PubMed] [Google Scholar]
- Gilbert CD, Kelly JP. The projection of cells in different layers of the cat's visual cortex. Journal of Comparative Neurology. 1975;163:81–106. doi: 10.1002/cne.901630106. [DOI] [PubMed] [Google Scholar]
- Gilbert CD, Wiesel TN. Morphology and intracortical projections of functionally characterised neurones in the cat visual cortex. Nature. 1979;280:120–125. doi: 10.1038/280120a0. [DOI] [PubMed] [Google Scholar]
- Godwin DW, Vaughan JW, Sherman SM. Metabotropic glutamate receptors switch visual response mode of lateral geniculate nucleus cells from burst to tonic. Journal of Neurophysiology. 1996;76:1800–1816. doi: 10.1152/jn.1996.76.3.1800. [DOI] [PubMed] [Google Scholar]
- Golshani P, Liu X-B, Jones EG. Differences in quantal amplitude reflect GluR4-subunit number at corticothalamic synapses on two populations of thalamic neurons. Proceedings of the National Academy of Sciences of the USA. 2001;98:4172–4177. doi: 10.1073/pnas.061013698. [DOI] [PMC free article] [PubMed] [Google Scholar]
- Granseth B, Ahlstrand E, Lindström S. Effects of extracellular calcium ions on paired pulse facilitation and depression in the dorsal lateral geniculate nucleus in vitro. European Journal of Neuroscience. 2000a;12(suppl. 11):75. [Google Scholar]
- Granseth B, Ahlstrand E, Lindström S. Augmentation of EPSCs at corticogeniculate synapses in the dorsal lateral geniculate nucleus of the rat in vitro. Society for Neuroscience Abstracts. 2000b;26:1195. [Google Scholar]
- Hubel DH, Wiesel TN. Integrative action in the cat's lateral geniculate body. Journal of Physiology. 1961;155:385–398. doi: 10.1113/jphysiol.1961.sp006635. [DOI] [PMC free article] [PubMed] [Google Scholar]
- Katz B, Miledi R. The role of calcium in neuromuscular facilitation. Journal of Physiology. 1968;195:481–492. doi: 10.1113/jphysiol.1968.sp008469. [DOI] [PMC free article] [PubMed] [Google Scholar]
- Kim J, Alger BE. Random response fluctuations lead to spurious paired-pulse facilitation. Journal of Neuroscience. 2001;21:9608–9618. doi: 10.1523/JNEUROSCI.21-24-09608.2001. [DOI] [PMC free article] [PubMed] [Google Scholar]
- Lindström S, Wróbel A. Frequency dependent corticofugal excitation of principal cells in the cat's dorsal lateral geniculate nucleus. Experimental Brain Research. 1990;79:313–318. doi: 10.1007/BF00608240. [DOI] [PubMed] [Google Scholar]
- Livingstone MS, Hubel DH. Effects of sleep and arousal on the processing of visual information in the cat. Nature. 1981;291:554–561. doi: 10.1038/291554a0. [DOI] [PubMed] [Google Scholar]
- McCormick DA, Von Krosigk M. Corticothalamic activation modulates thalamic firing through glutamate “metabotropic” receptors. Proceedings of the National Academy of Sciences of the USA. 1992;89:2774–2778. doi: 10.1073/pnas.89.7.2774. [DOI] [PMC free article] [PubMed] [Google Scholar]
- Magleby KL. Short-term changes in synaptic efficacy. In: Edelman GM, Gall WE, Cowan WM, editors. Synaptic Function. New York, NY, USA: John Wiley & Sons; 1987. pp. 21–56. [Google Scholar]
- Murphy PC, Sillito AM. Corticofugal feedback influences the generation of length tuning in the visual pathway. Nature. 1987;329:727–729. doi: 10.1038/329727a0. [DOI] [PubMed] [Google Scholar]
- Neher E. Vesicle pools and Ca2+ microdomains: new tools for understanding their roles in neurotransmitter release. Neuron. 1998;20:389–399. doi: 10.1016/s0896-6273(00)80983-6. [DOI] [PubMed] [Google Scholar]
- Paulsen O, Heggelund P. The quantal size at retinogeniculate synapses determined from spontaneous and evoked EPSCs in guinea-pig thalamic slices. Journal of Physiology. 1994;480:505–511. doi: 10.1113/jphysiol.1994.sp020379. [DOI] [PMC free article] [PubMed] [Google Scholar]
- Peters A, Kara DA, Harriman KM. The neuronal composition of area 17 of rat visual cortex. III. Numerical considerations. Journal of Comparative Neurology. 1985;238:263–274. doi: 10.1002/cne.902380303. [DOI] [PubMed] [Google Scholar]
- Rahamimoff R. A dual effect of calcium ions on neuromuscular facilitation. Journal of Physiology. 1968;195:471–480. doi: 10.1113/jphysiol.1968.sp008468. [DOI] [PMC free article] [PubMed] [Google Scholar]
- Rozov A, Burnashev N, Sakmann B, Neher E. Transmitter release modulation by intracellular Ca2+ buffers in facilitating and depressing nerve terminals of pyramidal cells in layer 2/3 of the rat neocortex indicates a target cell-specific difference in presynaptic calcium dynamics. Journal of Physiology. 2001;531:807–826. doi: 10.1111/j.1469-7793.2001.0807h.x. [DOI] [PMC free article] [PubMed] [Google Scholar]
- Sakmann B, Stuart G. Patch-pipette recordings from the soma, dendrites, and axon of neurones in brain slices. In: Sakmann B, Neher E, editors. Single-Channel Recording. New York, NY, USA: Plenum Press; 1995. pp. 199–211. [Google Scholar]
- Scharfman HE, Lu S-M, Guido W, Adams R, Sherman SM. N-methyl-D-aspartate receptors contribute to excitatory postsynaptic potentials of cat lateral geniculate neurons recorded in thalamic slices. Proceedings of the National Academy of Sciences of the USA. 1990;87:4548–4552. doi: 10.1073/pnas.87.12.4548. [DOI] [PMC free article] [PubMed] [Google Scholar]
- Schmielau F, Singer W. The role of visual cortex for binocular interactions in the cat lateral geniculate nucleus. Brain Research. 1977;120:354–361. doi: 10.1016/0006-8993(77)90914-3. [DOI] [PubMed] [Google Scholar]
- Sefton AJ, Dreher B. Visual system. In: Paxinos G, editor. The Rat Nervous System. San Diego, CA, USA: Academic Press; 1995. pp. 833–898. [Google Scholar]
- Sillito AM, Jones HE, Gerstein GL, West DC. Feature-linked synchronisation of thalamic relay cell firing induced by feedback from the visual cortex. Nature. 1994;369:479–482. doi: 10.1038/369479a0. [DOI] [PubMed] [Google Scholar]
- Steriade M, Jones EG, McCormick DA. Organisation and Function. I. New York, NY, USA: Elsevier; 1997. Thalamus. [Google Scholar]
- Stevens CF, Wang Y. Facilitation and depression at single central synapses. Neuron. 1995;14:795–802. doi: 10.1016/0896-6273(95)90223-6. [DOI] [PubMed] [Google Scholar]
- Tang Y-G, Schlumpberger T, Kim T-S, Lueker M, Zucker RS. Effects of mobile buffers on facilitation: experimental and computational studies. Biophysical Journal. 2000;78:2735–2751. doi: 10.1016/s0006-3495(00)76819-6. [DOI] [PMC free article] [PubMed] [Google Scholar]
- Tarczy-Hornoch K, Martin KAC, Stratford KJ, Jack JJB. Intracortical excitation of spiny neurons in layer 4 of cat striate cortex. Cerebral Cortex. 1999;9:833–843. doi: 10.1093/cercor/9.8.833. [DOI] [PubMed] [Google Scholar]
- Thomson AM, Bannister AP. Release-independent depression at pyramidal inputs onto specific cell targets: dual recordings in slices of rat cortex. Journal of Physiology. 1999;519:57–70. doi: 10.1111/j.1469-7793.1999.0057o.x. [DOI] [PMC free article] [PubMed] [Google Scholar]
- Thomson AM, West DC, Deuchars J. Properties of single axon excitatory postsynaptic potentials elicited in spiny interneurones by action potentials in pyramidal neurones in slices of rat cortex. Neuroscience. 1995;69:727–738. doi: 10.1016/0306-4522(95)00287-s. [DOI] [PubMed] [Google Scholar]
- Turecek R, Trussel LO. Control of synaptic depression by glutamate transporters. Journal of Neuroscience. 2000;20:2054–2063. doi: 10.1523/JNEUROSCI.20-05-02054.2000. [DOI] [PMC free article] [PubMed] [Google Scholar]
- Turner JP, Salt TE. Characterization of sensory and corticothalamic excitatory inputs to rat thalamocortical neurones in vitro. Journal of Physiology. 1998;510:829–843. doi: 10.1111/j.1469-7793.1998.829bj.x. [DOI] [PMC free article] [PubMed] [Google Scholar]
- Von Krosigk M, Monckton JE, Reiner PB, McCormick DA. Dynamic properties of excitatory postsynaptic potentials and thalamic reticular inhibitory postsynaptic potentials in thalamocortical neurons of the guinea-pig dorsal lateral geniculate nucleus. Neuroscience. 1999;91:7–20. doi: 10.1016/s0306-4522(98)00557-0. [DOI] [PubMed] [Google Scholar]
- Wigström H, Gustafsson B. Two types of synaptic facilitation recorded in pyramidal cells of in vitro hippocampal slices from guinea pigs. Neuroscience Letters. 1981;26:73–78. doi: 10.1016/0304-3940(81)90428-6. [DOI] [PubMed] [Google Scholar]
- Zucker RS, Regehr WG. Short-term synaptic plasticity. Annual Review of Physiology. 2002;64:355–405. doi: 10.1146/annurev.physiol.64.092501.114547. [DOI] [PubMed] [Google Scholar]