

Abstract
The triceps surae (TS) stretch reflex was measured in decerebrate cats during crossed extensor stimulation (tonic contractions) and after spinalization during rhythmic locomotor activity. The TS reflex force in response to a short pulse stretch measured during tonic contractions at low level of background activity was greater than when more background activity was present at the time of application of stretch. In contrast, the reflex force measured during rhythmic contractions was very small at low level of background force (flexion phase) and increased at moderate and high levels of background activity (extension phase). Thus, even in reduced preparations, a task modulation of the stretch reflex occurs. Throughout the experimental procedure, the torque motor used to stretch the muscles behaved like a spring of a preset compliance (from isometric to very compliant). A reflex model was used to simulate the responses obtained experimentally. The gain of the stretch reflex loop was estimated for each load condition and both behavioural tasks. The reflex loop gain was significantly larger as the compliance of the external load increased for both tonic and rhythmic contractions, although to a lesser extent in the phasically activated muscles. During rhythmic locomotor contractions the gain was less than 1, assuring stability of the system. In contrast, during tonic contractions against a compliant load the gain exceeded 1, consistent with the instability (oscillations, clonus) seen at times under these load conditions. However, the high gain and instability was only transient, since repeated stretch reduced the gain. Thus, non-linearities in the system assured vigorous responses at the onset of perturbations, but then weaker responses to ongoing perturbations to reduce the chance of feedback instability (clonus).
Despite a large number of studies performed on the stretch reflex, details of its mechanism and control still remain unclear. When considering the predominant monosynaptic component of this reflex, many investigators looked at the change in the amplitude of the H-reflex, the electrical equivalent of a tendon jerk, in a variety of tasks in humans (for review see Schieppati, 1987; Stein, 1995; Brooke et al. 1997; Zehr & Stein, 1999). A modulation of the H-reflex was observed throughout cyclic movements such as locomotion (Capaday & Stein, 1986; Crenna & Frigo, 1987; Yang & Whelan, 1993), or pedalling (Brooke et al. 1992). During walking, the H-reflex size was closely related to the amount of EMG activity in the muscle, facilitated during the stance phase and suppressed during the swing phase. A similar modulation of the H-reflex was also observed in decerebrate cats (Akazawa et al. 1982).
However, in studying the H-reflex, two components of the stretch reflex loop are missing: the mechanical properties of the muscle and load shaping the reflex contraction and the influence of the fusimotor drive on the spindle afferent sensitivity. The stretch reflex has been previously examined in decerebrate cats with locomotion induced by electrical stimulation of the mesencephalic locomotor region (Akazawa et al. 1982). Pulse stretches were applied to the soleus muscle at various phases of the step cycle and the results obtained showed a deep modulation in the stretch reflex. The reflex varied in parallel with the intrinsic muscle stiffness, thus being positively related to the background force. Interestingly, a reverse relationship was observed during tonic muscle activity (spontaneous activity); the force produced in response to stretch decreased with increasing levels of background activity. The behaviour of the stretch reflex during tonic and phasic activation of hindlimb muscles will be further examined in the present study.
The mammalian stretch reflex is difficult to quantify because the sensors (muscle spindles and tendon organs) are an integral part of the muscle; the sense organs cannot be stretched without stretching the muscle, and the response is directly affecting both the muscle and the sensors. In simpler systems, such as in stick insects where the sense organs are separated from the muscle, the open loop gain has been determined by oscillating (stretching) the sense organ and measuring the relative magnitude and phase of the resulting muscle/limb movements (a unitless output/input ratio; Bässler, 1983). In the current study, a model of the reflex loop was used to simulate the responses recorded experimentally while stretching a muscle. It was then possible to quantify the gain of the stretch reflex by opening the loop in the model, as was done in the stick insect experiments.
Estimates of the loop gain have also been obtained experimentally with the same cat preparations as used in the present study (Bennett et al. 1996b). A sinusoidal stretch was applied to the triceps surae (TS) muscles, the gain of the reflex loop was estimated and it was shown to be markedly lowered during walking in the spinalized cats, when compared to a similar level of contraction in tonically activated muscles. Surprisingly, the gain did not vary significantly throughout the step cycle, showing no clear relationship between gain and contraction level. In fact, the reflex force and electromyographic responses to stretch increased with the contraction level, but their effect on the total reflex gain was cancelled by an associated increase in the intrinsic muscle stiffness, thus stressing the importance of considering the mechanical load on the feedback responses.
In addition, with pulse inputs applied to the human ankle joint, superimposed on larger random perturbations, Stein & Kearney (1995) showed that the reflex responses decreased in a graded manner with increasing amplitude or bandwidth of the random perturbations. These results suggest that the gain of the reflex loop would be enhanced if calculated when short discrete pulses are applied rather than continuous perturbations such as sinusoidal stretches (Bennett et al. 1996b). The use of a brief pulse stretch along with computer simulations of sinusoidal perturbations in the present study allowed us to verify this result.
Throughout the present experiments, the torque motor used to stretch the muscles behaved like a spring of a preset stiffness (from isometric to very compliant). This type of compliant loading simulates more closely the normal physiological conditions observed in an intact preparation, i.e. in response to sudden stretch muscles generally contract against opposing antagonist muscles which act as an elastic load. Moreover, during a task such as locomotion, the stiffness of the external load varies greatly throughout one cycle, from very compliant while the foot is in the swing phase to very rigid at the time of ground contact. Such loading properties have been used to study the mechanisms of muscle contraction in cats (Bawa et al. 1976a,b) and frogs (Jewell & Wilkie, 1960) and the behaviour of short-latency reflexes in the human elbow flexor muscles (Stein et al. 1995). In this latter study, a dramatic increase in reflex shortening accompanied by an attenuated reflex force was observed when the load was made more compliant (less stiff). However, no previous study attempted to estimate the gain of the stretch reflex loop when the muscles are contracting against loads of various compliance. By varying the load compliance in the present study, combined with the use of computer simulations, we are able to show that the gain gradually increases with an increase in the load compliance for the tonic contractions but not to the same extent for the rhythmic contractions. Preliminary results from the present study have briefly been presented in abstract form (De Serres et al. 1995, 1996).
Methods
General preparation
Experiments were performed to examine the reflex response to stretch of the triceps surae (TS) muscles of the left hindlimb in seven male cats (3.9 ± 0.6 kg). For each of the seven cats, the muscle responses to stretch were recorded after the premammillary decerebration for three different conditions: (1) prior to spinalization (hereafter referred to as the ‘decerebrate’ condition), (2) after spinalization between the T12 and T13 vertebrae (hereafter referred to as the ‘spinal’ condition), and (3) after deafferentation by sectioning the ipsilateral L5-S2 dorsal roots (hereafter referred to as the ‘deafferented’ condition). The results from five of the seven cats were obtained during the course of a previous study (Bennett et al. 1996b). The experiments had the approval of the University of Alberta Health Sciences Laboratory Animal Welfare Committee and conformed with the guidelines of the Canadian Council on Animal Care.
The surgical procedures were performed under general anaesthesia (1.5-2.5 % halothane mixed with 95 % O2-5 % CO2). Anaesthesia was initiated with the use of a mask covering the mouth and nose of the animal. Cannulation of the trachea was then performed to allow for a continued administration of the anaesthetic. Both carotid arteries were ligated and one artery was also cannulated proximally to monitor blood pressure throughout the entire experimental procedure. A jugular vein was also cannulated to allow the administration of fluids and drugs. The body temperature of the animal was maintained with the use of a heating pad during the surgical procedures and throughout the experimental manipulations. After this initial procedure, hindlimb nerves and muscles were prepared as described below and two laminectomies were performed, at T12 and L5-L7, in preparation for later spinalization and deafferentation. The cat was then placed in a stereotaxic apparatus. The brain was exposed by a craniotomy and the cat was decerebrated by removing both cortices and all tissue rostral to the superior colliculi (cut at 45 deg with a spatula). Immediately following the decerebration which had rendered the animal insentient anaesthetic was removed. A bolus (2-5 ml) of 5 % dextrose solution, plasma volume expander (dextran) was administered if the blood pressure fell below 60 mmHg. At the end of the experiment death was ensured by the injection of a lethal dose of pentobarbitone anaesthetic.
Nerve and muscle preparation
Both hindlimbs were extensively denervated (obturator nerve, femoral nerve, hamstring nerve and distal branches of the sciatic nerve) except for nerves to the TS muscles. A nerve cuff for TS stimulation was placed on the ipsilateral tibial nerve just behind the knee. On the contralateral leg a cuff was placed on the common peroneal (CP) nerve. The ipsilateral TS muscles were freed from surrounding tissue and the end of the calcaneum bone was cut, leaving the tendinous insertion of the TS intact. A heavy inelastic thread (No. 5 silk) was tied either through a hole drilled in the bone chip or around the tendon proximal to the bone. Exposed nerves and muscles were kept from drying out by adding saline and reclosing the skin and surrounding tissues over them.
The cat was mounted in a stereotaxic frame and the ipsilateral leg was held slightly extended with a foot clamp and a bone screw inserted in the femur just above the (denervated) knee. The contralateral leg was allowed to swing freely, facilitating locomotion. The TS tendon thread was tied to a muscle puller. The initial muscle length was set by slowly lengthening the muscle during repeated maximal twitch contractions until the maximal twitch force was reached. This length corresponded to an ankle dorsiflexion of about 135 deg, and was chosen because it was at the peak of the length-tension curve (Rack & Westbury, 1969), where muscle stiffness changes minimally with small stretches.
Tonic and phasic activation of the TS muscle
A crossed extensor reflex was induced by stimulating the common peroneal nerve of the contralateral hindlimb in the decerebrate preparation (decerebrate condition; stimulation with pulses of 0.2 ms at 50 Hz with amplitude graded to generate different contraction levels). After spinalization (spinal condition), locomotion was generated upon administration of the opiate antagonist naloxone (25 mg kg−1; Sigma Chemical Co., St Louis, MO, USA) along with the α2 noradrenergic agonist clonidine (50-200 mg kg−1; Sigma Chemical Co.). Rhythmicity was initiated by manual stimulation of the skin of the perineum. Step cycles occurred at 0.5-1 Hz for periods of 1-2 min, and were not entrained by manual stimulation (Pearson et al. 1992).
Stretch application
Short pulse stretches, which lasted about 10 ms, were applied by a servo-controlled motor (310B, Cambridge Technology Inc., Watertown, MA, USA), at a frequency of 0.7 Hz during the tonic (Fig. 1A) or phasic (Fig. 1B) activation of the TS muscles. Stretch amplitudes were of 1 and 3 mm. These amplitudes corresponded to a change in length on a straight line tangent to the path described by the tip of the motor manipulandum when it rotated to stretch the muscles. Since the thread used to attach the TS muscle to the tip of the manipulandum formed an angle of ≈70 deg with this tangent (varying from one cat to another), the actual stretch amplitudes were slightly smaller that the values stated above.
Figure 1. Reflexes during tonic and phasic contractions.
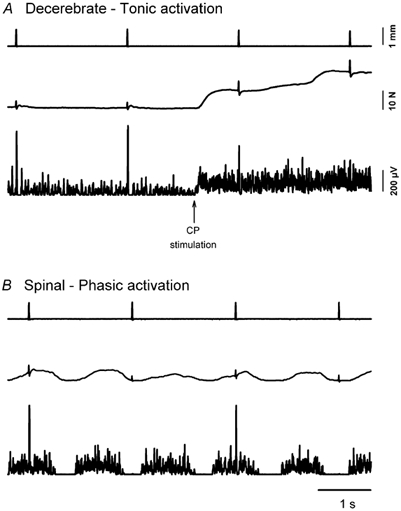
A, reflex responses to pulse stretches before and during contractions produced by contralateral CP nerve stimulation (vertical arrow marks onset of stimulation) in a decerebrate cat. Only the beginning of the tonic contraction is shown. From top to bottom the traces are, respectively: TS length, force and EMG. Data recorded with an isometric load. B, reflex responses to pulse stretches during locomotion in a spinal cat. Same formats as in A.
By varying the length and velocity feedback parameters of the motor controller, the motor puller (external load) could behave like a spring of a particular stiffness (from isometric to very compliant). The external load compliance (inverse of load stiffness) was therefore varied throughout the experiments with values of 0.2, 0.5 and 1.5 mm N−1, in addition to the isometric condition. Only the pulse stretch of 1 mm in amplitude was used with the elastic loads. When the load was compliant, the input commanded through the motor controller was increased to keep the actual muscle stretch at about 1 or 3 mm.
Signal recording and averaging
Force and length were obtained from the servo-controlled motor and were stored on tape for off-line analysis. Force and length responses to stretch were averaged for each experimental condition, separating the data recorded during tonic contraction from the data obtained during rhythmic activity. The averaging process was triggered by a brief impulse delivered prior to the application of the stretch. In the case of tonic contractions, the averaging process was based on the mean background force generated by the TS muscle over a period of 10 ms just prior to the stretch. The total range of muscle force was divided into six intervals of equal size. For both force and length signals, responses occurring at a similar background force level were averaged together.
In the case of phasic contractions, the averaging process was based on the time of occurrence of the perturbation within the step cycle. The total duration of the step cycle was divided into eight intervals of equal size. For both force and length signals, responses occurring at the same time in the step cycle were averaged together. The level of background force present in the muscles at the time of application of the stretch was also measured over a period of 10 ms prior to the application of the perturbation. Due to the variation in the muscle force generated during the tonic contractions, and the variation in the time of occurrence of the stretches throughout the step cycle, the number of responses used to compute the averages varied from one interval to another. The number of traces used in each average ranged from 5 to 26. Further analysis was performed on the averaged traces for each signal as explained below.
Data analysis
Pulse stretch against isometric load
Two upward deflections were seen on the averaged force trace in response to the pulse stretch of the muscles (Fig. 2B): a transient deviation corresponding to a direct mechanical effect of stretching the muscle, and a slower deflection representing the force produced by the reflex response. The intrinsic muscle stiffness was evaluated by dividing the force change directly related to the stretch (amplitude of transient deviation) by the measured amplitude of the stretch. Reflex force was calculated by subtracting the deafferented force responses from the responses obtained in the non-deafferented (decerebrate or spinal) conditions. Due to the strong dependence of intrinsic muscle stiffness on the mean background force (for example see Hoffer & Andreassen, 1981), it was important that this subtraction occurred for matched levels of background force. If necessary, prior to the subtraction, the averaged data from the deafferented condition were adjusted so that the background force level and the intrinsic muscle stiffness matched those measured in the decerebrate or spinal condition. This adjustment was performed by multiplying the averaged trace of the deafferented condition by an appropriately selected factor in order to match the force resulting from the direct mechanical effect of the stretch (first upward deflection seen on the averaged force trace of Fig. 2B) for the decerebrate or spinal condition. The peak value of the subtracted force trace was computed as the reflex force response.
Figure 2. Typical reflex responses to pulse stretch during tonic and phasic contractions.
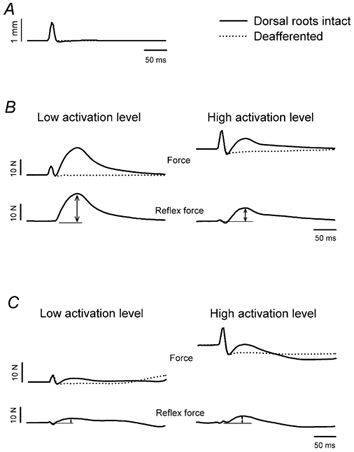
A, averaged length trace representing a pulse stretch in isometric condition. B, averaged total force and reflex force in response to a pulse stretch in isometric condition, for low (left panel) and high (right panel) levels of background force, in tonically active TS muscles (decerebrate). Remember that the reflex force is obtained by subtracting the averaged force recorded after deafferentation (dotted line) from the averaged force obtained with intact dorsal roots (continuous line, see also Fig. 1). Arrows indicate the reflex force measurement. C, averaged total force and reflex force in response to pulse stretch in isometric conditions, for low (left panel) and high (right panel) levels of background force, in phasically active TS muscles (spinal walking). Same formats as in B.
Pulse stretch against compliant load
The averaged length and force traces recorded in the presence of an elastic load were prepared for their match to the computer simulation outputs. Background changes in force and length (linear trend) were removed by selecting two points on each trace (one prior to the stretch, and one after completion of the force or length change due to the reflex action).
Computer simulations
A simplified model for the mammalian segmental reflex system was used to simulate the experimental results from five cats in the isometric as well as in the compliant loading conditions. This dynamic reflex model included among its principal elements: series and parallel elastic components for intrinsic muscle characteristics, an active force element, a transfer function for spindle Ia afferents including a delay and an adjustable gain, a rectifier (since the afferents respond to stretch, but go silent when the muscle is shortened), an external load with a variable compliance, and an external perturbation. The model parameters were individually adjusted in order to match as closely as possible the averaged length and force traces for each load characteristic (isometric, 0.2, 0.5 and 1.5 mm N−1), for each experimental condition (decerebrate tonic, spinal at rest and spinal walking) and at each level of background force. Details of the model and how the parameters were selected are given in the Appendix. Simulations were performed using Matlab 4.2c and its associated graphics-based Simulink 1.3c control systems software (The MathWorks Inc., Natick, MA, USA).
In simulating the experimental data we calculated the variance accounted for (VAF) by the fitted curve. The VAF was calculated for both length and force responses as follows:
where RMS was the root mean square error between the simulated and experimental traces, and σ2 was a measure of deviation from the mean (variance) for the experimental data. For each experimental condition, the model parameters were varied until the sum of the length and force VAF values was optimal (see Appendix).
Reflex loop gain estimation
The open-loop gain (abbreviated as gain) of the stretch reflex loop was obtained from the simulations done with the model set with the parameters that offered the best fit for each experimental condition. This gain evaluation was performed by introducing sinusoidal inputs of 1, 2, 5, 7, 10, 14 and 20 Hz to the model. The choice of sinusoidal inputs allowed the estimation of the loop gain at discrete frequencies. The reflex loop gain was estimated following a procedure described in detail in the Appendix, similar to the approach used to estimate the reflex loop gain when a sinusoidal stretch was experimentally applied to the TS muscles (Bennett et al. 1996b). All the gain values reported in the current paper were obtained from the simulations.
Statistical analysis
A variety of statistical tests were performed on the data presented in this paper. Analyses of variance (ANOVA) or Student's paired-sample t tests were generally used. However, when the sets of data did not meet the assumptions of normality and equal variance (P < 0.05), a non-parametric analysis was conducted with either the Mann-Whitney or Kruskal-Wallis test (non-parametric analog to two-sample t test and single factor ANOVA, respectively; Zar, 1984). Furthermore, when the analysis of variance revealed significant differences among multiple sets of data, a multiple comparison procedure (Tukey for a parametric test and Dunn’ s method for a non-parametric test) was applied in order to determine which of the variances differed. For each statistical result reported below, the test used is indicated in parentheses, along with the level of significance and the sample size. Note that the notation ‘t test’ refers to Student's two-tailed paired-sample t test, unless otherwise specified. All the statistical tests were performed with the commercially available software SigmaStat (SPSS Inc., Chicago, IL, USA).
Results
Effect of muscle background activity
Tonic contractions
In the decerebrate condition, pulse stretches were applied to the TS muscles during tonic contractions produced by the crossed extensor reflex. Because the level of force generated by the crossed extensor reflex varied, we could compare the data for different amount of force developed by the muscles prior to the stretch. In Fig. 2B, force traces are shown for both the decerebrate (continuous lines) and the deafferented (dotted lines) conditions, for low and high levels of background force. The extra force generated during high activation is evident as a displacement in force along the y-axis in the right panels of Fig. 2B and 2C. Note the absence of reflex response after deafferentation. The reflex force obtained after subtracting the deafferented force responses from those obtained in the decerebrate condition, is also shown for both background activity levels. Figure 2B clearly shows that the reflex force decreased when more background activity was present in the muscles at the time of application of the stretch.
Phasic contractions
After spinalization, locomotion was induced by the administration of naloxone and clonidine. Manual perineal stimulation was required to trigger and maintain continuous periods of walking for 1-2 min. Cycles where the animal was walking regularly were analysed and the responses to stretch which occurred at the same time in the step cycle were averaged together. Figure 2C represents averaged data for low and high levels of background force during phasic contractions (locomotion). In addition to the fact that the reflex seems highly attenuated during walking when compared with the postural task, the behaviour of the reflex force in relation to the background force is opposite to that seen during tonic contractions. The reflex force was rather small when there was almost no activity in the muscles (corresponding to the flexion phase of the walking cycle), and augmented when the background force increased (corresponding to the extension phase of the walking cycle).
The modulation in the reflex force over a full range of background forces is represented by the results from all cats in Fig. 3. Due to the wide variation in the ranges of background forces generated by the TS muscles across the seven cats studied, the reflex data were normalized using the following steps. (1) The data were grouped in three distinct levels of background force (low, moderate and high). (2) The reflex force was expressed as a percentage of the response measured at a moderate level of tonic force in the decerebrate condition. Typical values for low, medium and high levels of background forces were around 2.5, 8.5 and 15 N, respectively. The data in Fig. 3 clearly show that the reflex force is greater during the tonic contractions (decerebrate condition) when compared with walking (Mann-Whitney, n = 30, P < 0.01).
Figure 3. Normalized reflex responses across background force levels.
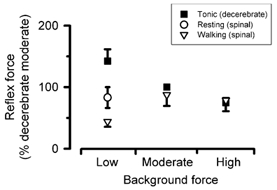
Reflex force was plotted against background force levels across tasks, after normalization. The data for all cats are grouped in three distinct levels of background force (low, moderate and high). Each point represents the mean ± standard error for data from seven cats.
In the decerebrate condition, the reflex force decreased when the background force was augmented by tonically contracting the muscle (Kruskal-Wallis, n = 10, P < 0.001). A pairwise multiple comparison test specified that the reflex force for low tonic contractions was significantly greater than for moderate and high tonic contractions (Dunn's method, P < 0.05). In the spinal condition, an opposite relationship is seen where the reflex force increased when the background force was augmented from low to moderate and high levels of force by rhythmically activating the muscle during locomotion. However, in neither task was there a significant difference between the responses at moderate and high levels of background force. Note that these normalized results include the data from both 1 and 3 mm stretch amplitudes because the differences in response amplitude and modulation behaviour between the two stretch amplitudes were shown not to be significant (t test, P > 0.1).
Spinal cats treated with clonidine display intermittent periods of walking, triggered and maintained by manual perineal stimulation. This peculiarity allowed us to stretch the TS muscles between locomoting intervals while the muscle was at rest (open circle in Fig. 3). In this particular condition, the reflex force was attenuated when compared with the decerebrate data for a similar level of background force (t test, P < 0.05), while remaining greater than the reflex response measured during locomotion (t test, P < 0.05). This last result supports the fact that the observed drop in the reflex force in the spinal walking cat was not solely due to a spinal shock provoked at the time of spinalization, or a reduced fusimotor drive to the muscle spindle (Bennett et al. 1996a). As these significant differences occurred for stretches applied with low level of tonic contractions and during the flexion phase of the locomotor cycle, it is a clear indication of powerful mechanisms which are acting to regulate the reflex response across different tasks.
Effect of load compliance
In the course of these experiments, the motor used to stretch the muscles was set to act as an elastic load with several compliance values: isometric, 0.2, 0.5 and 1.5 mm N−1. That is, with the last three compliance values each 1 N of force produced by the muscle caused movements of 0.2, 0.5 and 1.5 mm respectively. The effect of the variation in the motor stiffness on the reflex responses is shown in Fig. 4. Averaged length and force traces for one cat in the decerebrate condition are presented starting with the isometric condition at the top of the figure and up to a gradually increasing load compliance towards the bottom of the figure. The reflex change in length clearly became much larger as the compliance was augmented, whereas the reflex force became smaller. A more detailed analysis of these results will be presented in the next section, along with the computer simulation results. Note that with more elastic loads the shortening was substantial and could be more than twice the amplitude of the stretch (for example see 1.5 mm N−1 length trace in Fig. 4).
Figure 4. Examples of effect of a compliant load on the reflex response to a pulse stretch.
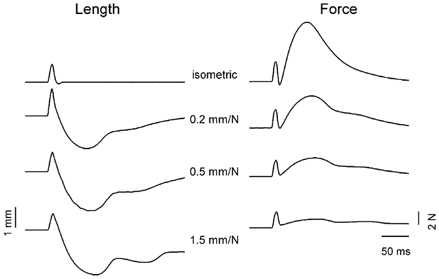
Length (left panel) and force (right panel) responses to a pulse stretch for isometric and compliant loads (0.2, 0.5 and 1.5 mm N−1). Note the increase in muscle shortening with a more compliant load accompanied by a decrease in reflex force.
Computer simulations, using a simplified model of the mammalian stretch reflex loop, were performed to match the experimental data acquired with isometric and non-isometric loads. Figure 5 shows examples of experimental and simulated traces, in the decerebrate, resting spinal and walking spinal conditions, for a load with a compliance of 0.2 mm N−1. As mentioned earlier, the variance accounted for (VAF specified in brackets) was calculated as an indicator of the goodness of the fit. Note that the values of VAF are very close to 100 %, indicating a very good although not perfect match between the experimental and simulated data. The averaged VAF values across tasks and across loads are indicated in Table 1.
Figure 5. Examples of experimental and simulated data across tasks.
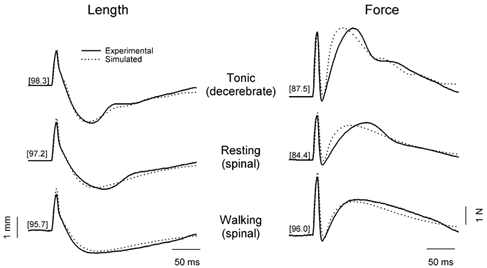
Simulated responses to a pulse stretch superimposed to the averaged length (left panel) and force (right panel) traces obtained experimentally during a tonic contraction, and in a resting and walking spinal cat. The numbers in brackets indicate the proportion of the variance accounted for (VAF) by the fit, calculated for verification of goodness of fit. Experimental data is from one cat with a load compliance of 0.2 mm N−1.
Table 1.
Averaged values of VAF (%) optimized when setting the model parameters for simulating the length and force reflex responses across tasks and across loads
| Averaged VAF for length (%) | Averaged VAF for force(%) | |||||
|---|---|---|---|---|---|---|
| Load compliance | Tonic (decerebrate) | Resting (spinal) | Walking (spinal) | Tonic (decerebrate) | Resting (spinal) | Walking (spinal) |
| Isometric | 86.2 | 95.6 | 94.5 | 91.0 | 91.3 | 71.6 |
| 0.2 mm N−1 | 92.5 | 85.1 | 84.0 | 83.1 | 74.4 | 73.5 |
| 0.5 mm N−1 | 82.7 | 87.7 | 81.2 | 77.5 | 73.3 | 69.1 |
| 1.5 mm N−1 | 84.9 | 87.3 | 76.8 | 77.6 | 75.6 | 84.5 |
Gain of the stretch reflex loop
The gain of the reflex loop was estimated for the data acquired when the load was compliant. Figure 6 presents the variations of the gain magnitude and phase amplitude for both experimental conditions (decerebrate tonic and spinal walking) and for all elastic loading conditions (0.2, 0.5 and 1.5 mm N−1), at a low level of background muscle activation. For each elastic load, the gain estimated during tonic contractions was greater than during locomotion (two-way ANOVA, P < 0.001). Also, the gain increased significantly with the compliance of the load (P < 0.001). A pairwise multiple comparison test indicated that this difference was significant between each individual load during the tonic contractions (Tukey, P < 0.001), but was only significant when comparing the 0.2 and 1.5 mm N−1 loads during the phasic contractions.
Figure 6. Reflex loop gain magnitude and phase across stretch frequencies for non-isometric loading.
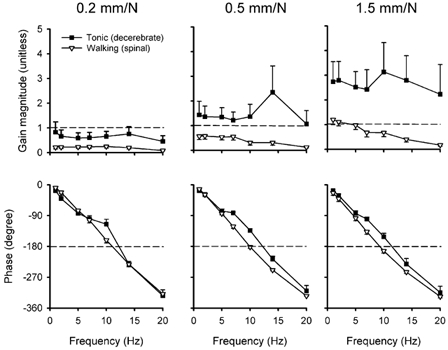
Reflex gain magnitude (top graphs) and phase (bottom graphs) estimated for tonic and phasic contractions, for compliant loads of 0.2, 0.5 and 1.5 mm N−1, plotted against the sinusoidal stretch frequency. Sinusoidal inputs of 1, 2, 5, 7, 10, 14 and 20 Hz were used in the reflex model described in Appendix. Horizontal dashed lines help indicate the frequency at which the phase lag reaches 180 deg for each load, each task. Note that at this specific frequency the gain magnitude is well below 1 for all loads during phasic contractions. Each point represents the mean ± standard error for simulation data from five cats.
The gain magnitude of the reflex loop was generally decreasing with increasing frequency, especially during the phasic contractions for the compliant loading of 0.5 and 1.5 mm N−1. A greater variability in the gain magnitude was seen during tonic contractions. For both tasks, the phase lag increased up to 330 deg with increasing frequencies. An interpolation was used to determine the frequency at which a phase lag of 180 deg occurred for each set of data presented in Fig. 6 (horizontal dashed lines of bottom graphs). During tonic contractions, the gain at the interpolated frequency was greater than 1 with the compliant loading conditions of 0.5 and 1.5 mm N−1. In contrast, the gain at the interpolated frequency was much smaller than 1 during phasic contractions for all loading conditions. This result supports the idea that the gain is kept low during movements where instability might occur (see Discussion)
Figure 7 shows the magnitude of the gain obtained with a 5 Hz sinusoidal stretch plotted against the load compliance. The gain is zero against an isometric load (0 mm N−1) because no movement can be produced by the reflexes, no matter how vigorous the reflex response is. The gain gradually increases with an increase in the load compliance for the tonic contractions (significant increase; two-way ANOVA, n = 5, P < 0.001) but does not increase significantly for the rhythmic contractions (P > 0.05). We also estimated the gain that should occur if the muscle was free to move, with very little load (essentially isotonic). To do this we used a very compliant load of 6 mm N−1 in the model simulation (not tested experimentally). The other model parameters were extrapolated from the most compliant load tested experimentally (1.5 mm N−1). The results of the gain calculation with this ‘isotonic’ load show a significant increase in the gain for both contraction types (Tukey, n = 5, P < 0.05).
Figure 7. Gain magnitude for both tasks across load compliance.
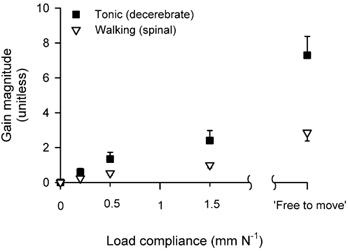
Reflex gain magnitude estimated for sinusoidal stretch of 5 Hz, during low level of tonic and phasic contractions for each load compliance. The gain was also estimated for an extremely compliant load (free to move). Each point represents the mean ± standard error for simulation data from five cats.
Discussion
The results of the present study can be summarized as follows. (1) Even in reduced preparations, there is a task-dependent modulation of the stretch reflex when comparing responses invoked during tonic and phasic muscle activation. (2) The reflex loop gain gradually increases with an increase in the load compliance for both behavioural states. (3) The gain of the stretch reflex loop is large when measured with rapid and brief pulse stretches compared with more continuous perturbations such as sinusoidal stretches investigated in a previous study (Bennett et al. 1996b).
Task-dependent reflex modulation
The reflex response to a pulse stretch was modulated when applied during locomotion. The reflex force increased when the background activity was augmented (during the extension phase of the step cycle) and was small when the muscle was quiet (during the flexor phase). This modulation in the stretch reflex matches the variation seen by Akazawa et al. (1982) in decerebrate cats. The fact that the reflex modulation during walking remains after spinalization suggests that it occurs at the spinal level. This modulation is similar to the variations observed in the H-reflex, during walking in humans (Capaday & Stein, 1986; Crenna & Frigo, 1987; Yang & Whelan, 1993) and in decerebrate cats (Akazawa et al. 1982).
This similarity between stretch and H-reflex behaviours refutes the possibility that a cyclic variation in fusimotor activity or afferent volley accounts for most of the observed modulation. Instead, changes in presynaptic inputs to α-motoneurones are likely to explain the difference seen throughout the step cycle phases. Indeed, several studies have shown that presynaptic inhibition plays a role in the modulation of the H-reflex during walking in humans (Capaday & Stein, 1987, 1989; Edamura et al. 1991; Yang & Whelan, 1993). Presynaptic inhibition may also be responsible for reducing the stretch reflex response during walking when compared with tonically active muscle. However, the sensitivity of Ia afferent spindle receptors did present a marked decrease at the onset of locomotion (Bennett et al. 1996a), most probably caused by a decrease in dynamic γ-drive combined with a substantial increase in static γ-drive. This change in sensitivity is likely to be involved in the difference in the stretch reflex observed between tonic and rhythmic contractions.
The reflex force produced by a pulse stretch during the crossed extensor reflex (tonic muscle activation) was not only larger than during locomotion but also displayed an inverse relationship when plotted against background muscle force. This opposite relationship between reflex and background force seen when comparing tonically and phasically active muscles suggest that different control mechanisms are regulating the size of the reflex response in the two tasks.
In humans the relationships between H-reflex size and muscle background activity were in the same direction (although different slopes) when comparing walking with standing. This discrepancy between stretch and H responses could be explained by a distinct fusimotor drive to control the sensitivity of the afferent receptors. In fact, results obtained from direct recordings of Ia afferents from the cat soleus muscle suggested that the static γ-drive is increased during crossed extensor reflex while dynamic γ-drive remains unchanged (when compared with the relaxed state, see Table 3 in Bennett et al. 1996b). This rather constant dynamic γ-drive during tonic activity could partly be responsible for the larger reflex responses seen in tonically active muscles, when compared to locomotion where dynamic γ-drive was decreased.
In a recent study, Misiaszek et al. (2000) elicited both stretch and H-reflexes in high decerebrate cats during tonic and rhythmic contractions. Unlike the data presented in the current study, they failed to observe a reduction in the magnitude of both reflexes with the onset of the rhythmic locomotor pattern. However, they only examined the reflex responses elicited during the extensor phase of the walking cycle, comparing the amplitude of the responses of both stretch and H-reflexes with matching level of tonic background activity. In our current study, the significant attenuation of the stretch reflex occurred at a low level of background force, which included responses elicited during the flexion phase of the locomotor cycle. On the other hand, stretch reflex responses at moderate and high levels of background force did not differ from one task to the other.
Similar to the data presented by Misiaszek et al. (2000), the absence of reflex modulation at moderate and high levels of background force, when comparing rhythmically and tonically activated muscles, suggests that the central pattern generator (CPG) for stepping does not presynaptically inhibit monosynaptic reflexes during the extension phase of locomotion. Instead, the presynaptic inhibition of the monosynaptic reflex associated with normal locomotion in cats or humans may arise from sources other than the extensor burst generating system of the CPG such as the command system initiating and maintaining locomotion (Gosgnach et al. 2000), or afferent signals in the moving limbs (Gossard, 1996; Misiaszek & Pearson, 1997).
Another aspect of the monosynaptic reflex loop pathway is always neglected in the H-reflex studies, i.e. the amount of force produced by the reflex volley. Conclusions are usually drawn based on the size of the EMG response, and not on the amount of force resulting from the neural reflex volley. In humans, it was demonstrated that the twitch force generated by an H-reflex was proportional to the H response amplitude but the slope of the relationship was changing depending on the amount of background activity (Gottlieb & Agarwal, 1971). Incidentally, for the same H-reflex peak-to-peak amplitude, the twitch force was smaller when the muscle was already contracted, compared with the relaxed condition. Gottlieb & Agarwal (1971) proposed that for a reflex elicited in a muscle that is voluntarily contracting, the twitch is reduced because the two activating signals summate within the same motor units rather than solely by recruiting additional ones. Clearly, as the force of most motor units approaches a tetanic level, little extra force can be generated by activating more EMG (Woods & Bigland-Ritchie, 1983). Finally, following a stretch at high force levels, the force was initially decreased, presumably due to the breakage of cross-bridge bonds (Rack & Westbury, 1974; Flitney & Hirst, 1978). In such a situation, the effect of the reflex may only be able to replace the broken bonds and bring the tension back to its initial level (see Fig. 2, lower right panel).
Effect of external load compliance
Using a torque motor with an adjustable compliance, the reflex responses to the pulse stretch were examined with various load compliance. The length and force traces that we obtained are comparable to those obtained by Stein et al. (1995) for the short-latency stretch reflex in human elbow flexors. Indeed, the reflex change in length clearly became much larger as the compliance was augmented, whereas the reflex force became smaller. When the reflex loop gain was estimated with the use of a model, the results showed a significantly increasing gain as the load became more compliant. In part this result is to be expected from the mechanics, because with increasing external load compliance a given reflex response can produce more displacement against this load, and thus ultimately the system will have a higher gain (open-loop gain is the reflex induced displacement divided by input displacement, see Appendix). At the other extreme, a very low load compliance allows very little reflex induced movement and thus the gain is necessarily very small, and approaches zero for isometric loads. On a similar note, as the muscle contraction decreases, the intrinsic stiffness of the muscle decreases, and again, a given reflex response (and associated Ia gain) can produce more and more displacement. This tends to increase the gain for smaller contractions, with a given reflex amplitude (Bennett et al. 1996b). The increase in the gain with compliance was prevalent during both tonic and phasic contractions, although the gain during walking remained lower than for tonic contractions even with more compliant loading. Thus it appears that during walking the mechanism involved in keeping the response small (most likely presynaptic inhibition) still exerts a great control despite the change in the load mechanical properties.
The increase in gain with a more compliant load may produce an appropriate adjustment in locomotion mechanics to compensate for the lack of resistance to movement provided by the less stiff external loading. A higher gain will generate a stronger muscle contraction in response to a given perturbation, increasing the joint stiffness which is necessary for the control of the corrective movement. Furthermore, an increase in the gain in the presence of more compliant external loading is probably needed in order to maintain a given contribution of the reflex system to the force produced by the TS muscles during locomotion. Bennett et al. (1996b) estimated that the reflexes contribute to 23 % of this movement-related force in spinal cats, while Stein et al. (2000) estimated reflex contributions of about 35 % to the stance phase of the decerebrate walking cat. Similarly, the importance of afferent feedback from ankle extensors for the activation of these muscles in the stance phase of human walking was also demonstrated in humans (Sinkjaer et al. 2000) where unloading of the ankle extensors significantly reduced the soleus activity by 50 % in early and mid-stance.
This type of compensation in the stiffness of the limb has also been observed in humans when hopping and running on terrains of various stiffness (Ferris & Farley, 1997; Ferris et al. 1998). Indeed, when asked to hop on a very stiff surface as well as on a variety of elastic surfaces, humans adjusted their leg spring stiffness to accommodate the different surface stiffness, thus offsetting the effects of the compliant surface on the mechanics of locomotion. Farley et al. (1998) have further proposed that adjustments to ankle stiffness are most important in adjusting leg stiffness, resulting in a constant total stiffness of the series combination of the legs and the surface, regardless of the surface stiffness.
The results shown in Fig. 6 indicate that, even for the more compliant loads, the magnitude of the gain remained smaller than 1 during locomotion while it exceeded 1 for the tonic contractions. This suggests that the system has the capability to keep the loop gain low in order to prevent instability in the presence of more compliant external loading, at least during locomotion. Theoretically, an open-loop gain < 1 guarantees mechanical stability even for a non-linear system (small-gain theorem; see Appendix and Desoer & Vidyasager, 1975), and thus unstable oscillations (tremor) are unlikely to occur during locomotion, as observed experimentally. The gain can, in principle, exceed 1 without instability, provided that it does not do so when the phase lag is 180 deg. The reflex loop gain did increase above 1 in rhythmic contractions when the muscle model was made to work against a simulated isotonic load condition (see ‘free to move’ phasic point on Fig. 7), but this high gain only occurred at low frequencies, and dropped below 1 at a frequency associated with a 180 deg phase lag (data not shown). Furthermore, the gain in this isotonic condition was only an extrapolation from the data, since we did not experimentally test with an isotonic load.
In contrast, during tonic contractions the gain was sometimes much greater than 1 at frequencies associated with a 180 deg phase lag, suggesting that unstable oscillations should occur (Fig. 6). In fact, damped oscillations could be seen, on occasion, with a compliant load, though they did not persist for long periods. The existence of rectification in the feedback loop is believed to help preserve stability at the elbow joint, despite a compliant loading (see simulation results in Stein et al. 1995). This rectification non-linearity was included in the dynamic model used in the present study. Another stabilizing factor, which might specifically explain the damping of the unstable oscillations, is that the reflex gain is smaller for repeated stretches (Bennett et al. 1996b) compared with the gain associated with brief single pulses used in the present experiments (see discussion below; see also Stein & Kearney, 1995). This input-related non-linearity may have numerous mechanisms, including an increase in presynaptic inhibition with ongoing afferent input.
Much evidence has been presented to support the participation of segmental reflexes in the generation of physiological tremor (for reviews see McAuley & Marsden, 2000; Deuschl et al. 2001). Without excluding any other mechanisms, it has been proposed that tremor is most probably due to segmental reflexes either with twitch-generated afferent activity when isometrically contracting (Prochazka & Hulliger, 1983), or with a combination of agonist-antagonist reflex response (Joyce et al. 1974). However, the instability of the feedback loop occurs and even dominates under a variety of physiological loading conditions. When a spring-mass system was used as the external load, the tremor frequency was strongly related to the mechanical properties of the limb-load system (in humans: Joyce & Rack, 1974) or muscle-load system (in decerebrate cats: Nichols et al. 1978). The present results confirm that the stretch reflex gain is directly influenced by the mechanical characteristics of the load. Muscle properties and non-linearities in the reflex loop help maintain the appropriate level of stability. Moreover, segmental control mechanisms (e.g. presynaptic inhibition) seem to play an important role in keeping the stretch reflex gain low during locomotion, preventing any instability that may occur in the presence of the varying loading conditions experienced throughout the step cycle (from isometric to very compliant).
Stretch-specific dependence of the reflex loop gain
In the present study, brief and rapid pulse stretches (10 ms in duration) were applied to the triceps surae (TS) muscles during tonic and rhythmic contractions. Simulations allowed the feedback loop to be opened in a model, which is not possible experimentally (see Introduction). The gain of the stretch reflex loop could then be estimated from the model, using the parameters selected for each experimental compliant loading studied in five cats. The gain was shown to be greater during tonic contractions than during walking.
Furthermore, the gain magnitude estimated in the current study (with the model fitted to the experimental data for the pulse stretch) is much higher than the gain obtained with sinusoidal stretches experimentally applied to the triceps surae muscles for the same cat preparations (Bennett et al. 1996b). This is not an artifact of the modelling used in the gain calculation, since the EMG reflex responses were also substantially larger with single pulses, compared to sinusoidal stretch (not shown). It is likely that the repeated stretching associated with the sinusoidal movements caused the reflex gain to be lowered compared to the gain with a single stretch. This interpretation is consistent with the finding that ongoing random stretching can lower the response to a tendon jerk, likely by mechanisms such as presynaptic inhibition (Stein et al. 1995; Stein & Kearney, 1995). Ramp-and-hold perturbations have been widely utilized (e.g. in humans: Allum & Mauritz, 1984; Toft et al. 1989; De Serres & Milner, 1991; Doemges & Rack, 1992; Carter et al. 1993; and in cats: Nichols & Houk, 1976; Hoffer & Andreassen, 1981; Lin & Rymer, 1993), and the associated reflex gain is probably intermediate between the gains found with a pulse and continuous sinusoidal stretch. The stretch-specific dependence of the gain presented here clearly highlights the non-linear characteristic of this reflex system, and as discussed above, these non-linearities are important in guaranteeing the motor system stability and performance (e.g. damping unstable oscillations by lowering gain with repeated contractions).
In summary, our results indicate that the size of the stretch reflex response is automatically adjusted according to the task, the mechanical characteristics of the load and the type of perturbation encountered, even in a reduced preparation such as a spinalized cat. This automatic control probably arises from central control of reflex transmission and from non-linearities in the system (e.g. rectification), and ultimately gives the motor system its ability to perform under varying load and task requirements with relatively little mechanical instability.
Acknowledgments
This research was supported by the Alberta Heritage Foundation for Medical Research (AHFMR) and the Medical Research Council of Canada. S.J.D. was supported by a studentship from the Fonds pour la Formation de Chercheurs et l'Aide à la Recherche (FCAR) from Québec, and D.J.B. was supported by a postdoctoral fellowship from the AHFMR
APPENDIX
To quantify the functional contribution of the muscle spindle feedback we computed the open-loop gain of the combined spindle, muscle and load system (Bennett et al. 1996b; Frederick & Carlson, 1971; Desoer & Vidyasager, 1975). In principle, the open-loop gain can be measured for any feedback system by cutting off the normal input to the feedback sensor (thus the term open-loop), applying a controlled perturbation (stretch, Li) to this detached feedback sensor, and measuring the response of the whole system (length response, L) to the sensor output. The open loop gain is then computed as: Go = L/Li. This direct measurement can be made in simple animals such as the stick insect where the length sensor can be detached and stretched in isolation to evoke a whole limb movement (see Introduction). In the mammalian system, the muscle spindles cannot be stretched without also stretching the whole muscle. However, the open-loop gain can be computed from the measured or known components of the muscle system. Indeed, with a computer model of the system a simulated stretch can be applied to the muscle spindle model element, and the whole system response to the spindle output will be computed to give the open-loop gain (Go).
Thus, the main difficulty with computing Go for a particular experimental condition (e.g. specific load and animal state) resides in the choice of a reasonable model of the muscle system that fits the experimental data for this particular condition. In order to do this we employed a minimally complex model of the system, so that the model parameters can be relatively unambiguously determined from the data (Fig. 8A). The muscle was modelled with a Hill-type system, with a series stiffness (Ks), parallel stiffness and damping (Kp and Bp, respectively) and an active force generation element (a) with exponential decay following a given neural activation (n) (thus, a = n exp(-t/β)]. The Ks, Kp and Bp parameters were scaled by Cbf to account for changes in background force (Bawa et al. 1976b). The ratio Kp/Bp constitutes the viscoelastic rate constant for the muscle. The muscle worked against a simulated servo motor with a load stiffness of Ke and damping of Be, and commanded servo length of ld, as in the experiment. Finally, the muscle spindle transduced its length y into a response with spindle gain GIA and a simple spindle model based on Matthews & Stein (1969); that is, the response is GIA (y + 0.1 dy/dt). The spindle response was offset (by SOFF, to account for background spindle firing), rectified (since negative firing rates are impossible) and delayed (by τ, to account for transmission delay and excitation-contraction coupling delay) to produce the neural signal n that was fed back into the muscle active force generation element, described above. The non-linearity associated with the rectifier was initially not included, but was found to be absolutely essential in order to be able to simulate the responses to the brief pulse perturbation used in these experiments (see also Stein & Kearney, 1995).
Figure 8. Schematic diagrams of the reflex loop model.
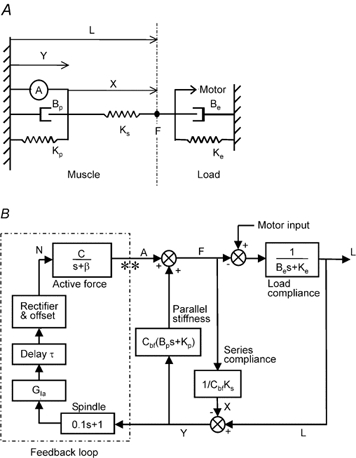
A, schematic representation of the Hill-type muscle model used to simulate the experimental data. B, detailed block diagram of the muscle, load and muscle spindle showing the feedback loop and where the loop was cut open (indicated by **) to estimate the open-loop gain. See Appendix for details.
Thus, the model can be described by the following equations as a function of time t where the total muscle length is l(t), series elastic element length is x(t), parallel elastic element length is y(t) = l(t) - x(t), force produced by the muscle is f(t), and muscle spindle feedback (or neural activation of muscle) is n(t).
| (A1) |
| (A2) |
| (A3) |
| (A4) |
| (A5) |
Equations (A1) to (A5) can be represented by the block diagram shown in Fig. 8B, which makes the feedback loop clear, and also shows where this loop was cut in measuring the open-loop gain. In the block diagram the equations are represented by Laplace/Fourier transforms L(s), X(s), Y(s), F(s), N(s) and A(s) of the variables l(t), x(t), Y(t), F(t), N(t) and A(t), respectively, with s = -jω and where ω is the frequency. For example, eqn (A3) is represented as A(s) = N(s)/(s + β). The simulation was performed based on these Laplace transforms using Simulink (Matlab, The MathWorks Inc., Natick, MA, USA) with a 450 ms run time Euler algorithm with steps of 1 ms. Terms were added to the Laplace transfer functions for the muscle spindle and parallel stiffness in order to have the number of poles greater than or equal to the number of zeros, a Matlab requirement for running simulations, though these were chosen to have no impact on the transfer function in the frequency range of interest.
The parameters τ, C and Ks were set based on reasonable values for this muscle system: 17 ms, 25 N and 4000 N mm−1, respectively (Bawa et al. 1976b). The compliant load parameters Ke and Be were set to the values used experimentally. The muscle compliance terms Kp and Bp and scale factor Cbf were estimated for each cat based on the deafferented stretch responses, following the methods used by Bawa et al. (1976b) and the parameter optimization procedure described below (Kp: 1010-1510 N mm−1; Bp: 85-130 N ms mm−1; Cbf: 0.8-5.1). The remaining feedback related parameters (GIA, SOFF and β) were optimally estimated for each experimental state (spinal vs. decerebrate), compliant load and force condition (ranges: 0.3-1587, -2 to 2 and 8-45 ms−1, respectively), though SOFF was usually not varied much and held fixed for each state. Finally, small adjustments in the muscle scale parameter Cbf were occasionally needed for each condition to account for changes in the muscle over the course of the experiment. The optimization procedure in all parameter estimation involved adjusting the parameters individually so that the response of the model fit the experimental force and length data (for compliant loading). The quality of fit (optimization criterion) used was to maximize the variance accounted for (VAF, see Methods) by the model in predicting the force and length data, while adjusting the parameters with a trial-and-error Newton search method. Initial muscle parameter values used in this search were taken from Bawa et al. (1976b). The final model fits gave VAF values of well over 70 % (Table 1) for all cats, suggesting that the model adequately predicted the data.
Finally, this optimal model was used to compute the open-loop gain for this particular data set, as described above. Specifically, the feedback loop was cut open as indicated in Fig. 8B, a length perturbation Li was applied to the muscles spindles, and the feedback response was computed (A). This response was then applied to the muscle-load system (still under open-loop conditions) and the resulting displacement of the system (L) was computed. Finally, the gain was computed as Go = L/Li.
The gain was computed using a sinusoidal input Li with frequency of ω and amplitude of |Li| = 1 mm. This sinusoidal input was used for several reasons. First, it is the standard control system analysis procedure that enables related feedback stability assessment (see below). Second, a pulse input could have been used, but because of the non-linear rectifier in the model, the response L would be substantially different in shape (twitch like), and thus difficult to compare to the pulse input. Finally, by using a sinusoidal input we could compare the computed open-loop gain to previous estimates of the gain where a sinusoid was used in the experimental measurements (Bennett et al. 1996b). Due to the non-linearity present in the model which was used (rectifier), the length output L was not perfectly sinusoidal and thus a best fit sinusoid was computed for L (Norton, 1986) to obtain an amplitude (|L|) and phase lag (θ) that was used in the final gain calculation:
Thus, the gain Go was computed from the complex number ratio L/Li, where the magnitude of Go is |Go| = |L|/|Li|, and the phase of Go is θ - θi (where θi is the phase of the input sinusoid Li).
The gain Go can be used to assess stability of the mechanical system. Specifically, a very general theorem from non-linear control theory states that ‘if the non-linear transfer function relating L and Li can be approximated (bounded) by a scalar number Go (as we described above), then when |Go | < 1 the closed loop response is guaranteed to be stable’ (response does not grow without bound, small gains theorem from Desoer & Vidyasager, 1975). Mechanical instability will not necessarily occur when |Go| > 1, but at least for a linear approximation to the system, instability will occur when |Go| > 1 and the phase of Go is 180 deg (Frederick & Carlson, 1971).
Errors can occur when using a model to calculate the gain of the reflex loop. Errors will arise, in part, from an inappropriate choice of the model parameters. In our study, we adjusted these parameters to optimally fit the experimental data. This procedure provided us with a very good estimate of the reflex responses, with minimal error (see above). The model was deliberately kept simple, so that the parameters could be determined unambiguously. Also, the meaning of the parameters related to physiologically relevant variables, and as many parameters as possible were held fixed under all conditions. Errors can also occur from not using a model that is sufficiently complex to quantify the non-linearities in the system (incomplete model). Though we did include several non-linearities (rectifier, delay, stiffness scale factor), a single parameter set was not adequate to model the system under all conditions (tonic vs. phasic). Therefore, we optimally adjusted some parameters for each experimental condition, and used this parameter set in the gain calculation. This way, each model set gave an optimal pseudolinear approximation to the system, and this approximation was only used to simulate the system under the same conditions as used experimentally. The open-loop gains computed with these parameters are unlikely to have large errors, considering that the closed-loop responses reflect the data closely (see above).
References
- Akazawa K, Aldridge JW, Steeves JD, Stein RB. Modulation of stretch reflexes during locomotion in the mesencephalic cat. Journal of Physiology. 1982;329:553–567. doi: 10.1113/jphysiol.1982.sp014319. [DOI] [PMC free article] [PubMed] [Google Scholar]
- Allum JHJ, Mauritz K-H. Compensation for intrinsic muscle stiffness by short-latency reflexes in human triceps surae muscles. Journal of Neurophysiology. 1984;52:797–818. doi: 10.1152/jn.1984.52.5.797. [DOI] [PubMed] [Google Scholar]
- Bässler U. Neural Basis of Elementary Behavior in Stick Insects. Berlin: Springer-Verlag; 1983. [Google Scholar]
- Bawa P, Mannard A, Stein RB. Effects of elastic loads on the contractions of cat muscles. Biological Cybernetics. 1976a;22:129–137. doi: 10.1007/BF00365523. [DOI] [PubMed] [Google Scholar]
- Bawa P, Mannard A, Stein RB. Predictions and experimental tests of a visco-elastic and inertial loads. Biological Cybernetics. 1976b;22:139–145. doi: 10.1007/BF00365524. [DOI] [PubMed] [Google Scholar]
- Bennett DJ, De Serres SJ, Stein RB. Regulation of soleus muscle spindle sensitivity in decerebrate and spinal cats during postural and locomotor activities. Journal of Physiology. 1996a;495:835–850. doi: 10.1113/jphysiol.1996.sp021636. [DOI] [PMC free article] [PubMed] [Google Scholar]
- Bennett DJ, De Serres SJ, Stein RB. Gain of the triceps surae stretch reflex in decerebrate and spinal cats during postural and locomotor activities. Journal of Physiology. 1996b;496:837–850. doi: 10.1113/jphysiol.1996.sp021731. [DOI] [PMC free article] [PubMed] [Google Scholar]
- Brooke JD, Cheng J, Collins DF, McIlroy WE, Misiaszek JE, Staines WR. Sensori-sensory afferent conditioning with leg movement: gain control in spinal reflex and ascending paths. Progress in Neurobiology. 1997;51:393–421. doi: 10.1016/s0301-0082(96)00061-5. [DOI] [PubMed] [Google Scholar]
- Brooke JD, McIlroy WE, Collins DF. Movement features and H-reflex modulation. I. Pedalling versus matched controls. Brain Research. 1992;582:78–84. doi: 10.1016/0006-8993(92)90319-5. [DOI] [PubMed] [Google Scholar]
- Capaday C, Stein RB. Amplitude modulation of the soleus H-reflex in the human during walking and standing. Journal of Neuroscience. 1986;6:1308–1313. doi: 10.1523/JNEUROSCI.06-05-01308.1986. [DOI] [PMC free article] [PubMed] [Google Scholar]
- Capaday C, Stein RB. A method for simulating the reflex output of a motoneuron pool. Journal of Neuroscience Methods. 1987;21:91–104. doi: 10.1016/0165-0270(87)90107-5. [DOI] [PubMed] [Google Scholar]
- Capaday C, Stein RB. The effects of postsynaptic inhibition on the monosynaptic reflex of the cat at different levels of motoneuron pool activity. Experimental Brain Research. 1989;77:577–584. doi: 10.1007/BF00249610. [DOI] [PubMed] [Google Scholar]
- Carter RR, Crago PE, Gorman PH. Nonlinear stretch reflex interaction during cocontraction. Journal of Neurophysiology. 1993;69:943–952. doi: 10.1152/jn.1993.69.3.943. [DOI] [PubMed] [Google Scholar]
- Crenna P, Frigo C. Excitability of the soleus H-reflex arc during walking and stepping in man. Experimental Brain Research. 1987;66:49–60. doi: 10.1007/BF00236201. [DOI] [PubMed] [Google Scholar]
- De Serres SJ, Bennett DJ, Stein RB. Stretch reflex gain of the triceps surae muscles while contracting against isometric or compliant loads in decerebrate and spinal cats. Canadian Journal of Physiology and Pharmacology. 1996;74:Aix. [Google Scholar]
- De Serres SJ, Milner TE. Wrist muscle activation patterns and stiffness associated with stable and unstable mechanical loads. Experimental Brain Research. 1991;86:451–458. doi: 10.1007/BF00228972. [DOI] [PubMed] [Google Scholar]
- De Serres SJ, Stein RB, Bennett DJ. Stretch reflex modulation in decerebrate and spinal cats during tonic and phasic (locomotion) contractions. Society for Neuroscience Abstracts. 1995;21:1429. [Google Scholar]
- Desoer CA, Vidyasager M. Feedback Systems: Input-Output Properties. London: Academic Press; 1975. [Google Scholar]
- Deuschl G, Raethjen J, Lindemann M, Krack P. The pathophysiology of tremor. Muscle and Nerve. 2001;24:716–735. doi: 10.1002/mus.1063. [DOI] [PubMed] [Google Scholar]
- Doemges F, Rack PMH. Task-dependent changes in the response of human wrist joints to mechanical disturbance. Journal of Physiology. 1992;447:575–585. doi: 10.1113/jphysiol.1992.sp019019. [DOI] [PMC free article] [PubMed] [Google Scholar]
- Edamura M, Yang JF, Stein RB. Factors that determine the magnitude and time course of human H-reflexes in locomotion. Journal of Neuroscience. 1991;11:420–427. doi: 10.1523/JNEUROSCI.11-02-00420.1991. [DOI] [PMC free article] [PubMed] [Google Scholar]
- Farley CT, Houdijk HHP, van Strien C, Louie M. Mechanism of leg stiffness adjustment for hopping on surfaces of different stiffnesses. Journal of Applied Physiology. 1998;85:1044–1055. doi: 10.1152/jappl.1998.85.3.1044. [DOI] [PubMed] [Google Scholar]
- Ferris DP, Farley CT. Interaction of leg stiffness and surface stiffness during human hopping. Journal of Applied Physiology. 1997;82:15–22. doi: 10.1152/jappl.1997.82.1.15. [DOI] [PubMed] [Google Scholar]
- Ferris DP, Louie M, Farley CT. Running in the real world: adjusting leg stiffness for different surfaces. Proceedings of the Royal Society of London. 1998;B 265:989–994. doi: 10.1098/rspb.1998.0388. [DOI] [PMC free article] [PubMed] [Google Scholar]
- Flitney FW, Hirst DG. Cross-bridge detachment and sarcomere ‘give’ during stretch of active frog's muscle. Journal of Physiology. 1978;276:449–465. doi: 10.1113/jphysiol.1978.sp012246. [DOI] [PMC free article] [PubMed] [Google Scholar]
- Frederick DK, Carlson AB. Linear Systems in Communication and Control. Toronto: Wiley; 1971. [Google Scholar]
- Gosgnach S, Quevedo J, Fedirchuk B, McCrea DA. Depression of group Ia monosynaptic EPSPs in cat hindlimb motoneurones during fictive locomotion. Journal of Physiology. 2000;526:639–652. doi: 10.1111/j.1469-7793.2000.00639.x. [DOI] [PMC free article] [PubMed] [Google Scholar]
- Gossard J-P. Control of transmission in muscle group Ia afferents during fictive locomotion in the cat. Journal of Neurophysiology. 1996;76:4104–4112. doi: 10.1152/jn.1996.76.6.4104. [DOI] [PubMed] [Google Scholar]
- Gottlieb GL, Agarwal GC. Effects of initial conditions on the Hoffmann reflex. Journal of Neurology, Neurosurgery and Psychiatry. 1971;34:226–230. doi: 10.1136/jnnp.34.3.226. [DOI] [PMC free article] [PubMed] [Google Scholar]
- Hoffer JA, Andreassen S. Regulation of soleus muscle stiffness in premammillary cats: Intrinsic and reflex components. Journal of Neurophysiology. 1981;45:267–285. doi: 10.1152/jn.1981.45.2.267. [DOI] [PubMed] [Google Scholar]
- Jewell BR, Wilkie DR. The mechanical properties of relaxing muscle. Journal of Physiology. 1960;152:30–47. doi: 10.1113/jphysiol.1960.sp006467. [DOI] [PMC free article] [PubMed] [Google Scholar]
- Joyce GC, Rack PMH. The effects of load and force on tremor at the normal human elbow joint. Journal of Physiology. 1974;240:375–396. doi: 10.1113/jphysiol.1974.sp010615. [DOI] [PMC free article] [PubMed] [Google Scholar]
- Joyce GC, Rack PMH, Ross HF. The forces generated at the human elbow joint in response to imposed sinusoidal movements of the forearm. Journal of Physiology. 1974;240:351–374. doi: 10.1113/jphysiol.1974.sp010614. [DOI] [PMC free article] [PubMed] [Google Scholar]
- Lin DC, Rymer WZ. Mechanical properties of cat soleus muscle elicited by sequential ramp stretches: Implications for control of muscle. Journal of Neurophysiology. 1993;70:997–1008. doi: 10.1152/jn.1993.70.3.997. [DOI] [PubMed] [Google Scholar]
- McAuley JH, Marsden CD. Physiological and pathological tremors and rhythmic central motor contol. Brain. 2000;123:1545–1567. doi: 10.1093/brain/123.8.1545. [DOI] [PubMed] [Google Scholar]
- Matthews PBC, Stein RB. The sensitivity of muscle spindle afferents to small sinusoidal changes of length. Journal of Physiology. 1969;200:723–743. doi: 10.1113/jphysiol.1969.sp008719. [DOI] [PMC free article] [PubMed] [Google Scholar]
- Misiaszek JE, De Serres SJ, Stein RB, Jiang W, Pearson KG. Stretch and H reflexes in triceps surae are similar during tonic and rhythmic contractions in high decerebrate cats. Journal of Neurophysiology. 2000;83:1941–1950. doi: 10.1152/jn.2000.83.4.1941. [DOI] [PubMed] [Google Scholar]
- Misiaszek JE, Pearson KG. Stretch of quadriceps inhibits the soleus H reflex during locomotion in decerebrate cats. Journal of Neurophysiology. 1997;78:2975–2984. doi: 10.1152/jn.1997.78.6.2975. [DOI] [PubMed] [Google Scholar]
- Nichols TR, Houk JC. Improvement in linearity and regulation of stiffness that results from actions of stretch reflex. Journal of Neurophysiology. 1976;39:119–142. doi: 10.1152/jn.1976.39.1.119. [DOI] [PubMed] [Google Scholar]
- Nichols TR, Stein RB, Bawa P. Spinal reflexes as a basis for tremor in the premammillary cat. Canadian Journal of Physiology and Pharmacology. 1978;56:375–383. doi: 10.1139/y78-056. [DOI] [PubMed] [Google Scholar]
- Norton JP. An Introduction to Identification. Orlando: Academic Press; 1986. [Google Scholar]
- Pearson KG, Ramirez JM, Jiang W. Entrainment of the locomotor rhythm by group Ib afferents from ankle extensor muscles in spinalized cats. Experimental Brain Research. 1992;90:557–566. doi: 10.1007/BF00230939. [DOI] [PubMed] [Google Scholar]
- Prochazka A, Hulliger M. Muscle afferent function and its significance for motor control mechanisms during voluntary movements in cat, monkey, and man. In: Desmedt JE, editor. Motor Control Mechanisms in Health and Disease. New York: Raven Press; 1983. pp. 93–132. [PubMed] [Google Scholar]
- Rack PMH, Westbury DR. The effects of length and stimulus rate on tension in the isometric cat soleus muscle. Journal of Physiology. 1969;204:443–460. doi: 10.1113/jphysiol.1969.sp008923. [DOI] [PMC free article] [PubMed] [Google Scholar]
- Rack PMH, Westbury DR. The short-range stiffness of active mammalian muscle and its effect on mechanical properties. Journal of Physiology. 1974;240:331–350. doi: 10.1113/jphysiol.1974.sp010613. [DOI] [PMC free article] [PubMed] [Google Scholar]
- Schieppati M. The Hoffmann reflex: A means of assessing spinal reflex excitability and its descending control in man. Progress in Neurobiology. 1987;28:345–376. doi: 10.1016/0301-0082(87)90007-4. [DOI] [PubMed] [Google Scholar]
- Sinkjaer T, Andersen JB, Ladouceur M, Christensen LOD, Nielsen JB. Major role for sensory feedback in soleus EMG activity in the stance phase of walking in man. Journal of Physiology. 2000;523:817–827. doi: 10.1111/j.1469-7793.2000.00817.x. [DOI] [PMC free article] [PubMed] [Google Scholar]
- Stein RB. Presynaptic inhibition in humans. Progress in Neurobiology. 1995;47:533–544. doi: 10.1016/0301-0082(95)00036-4. [DOI] [PubMed] [Google Scholar]
- Stein RB, Hunter IW, Lafontaine SR, Jones LA. Analysis of short-latency reflexes in human elbow flexor muscles. Journal of Neurophysiology. 1995;73:1900–1911. doi: 10.1152/jn.1995.73.5.1900. [DOI] [PubMed] [Google Scholar]
- Stein RB, Kearney RE. Nonlinear behavior of muscle reflexes at the human ankle joint. Journal of Neurophysiology. 1995;73:65–72. doi: 10.1152/jn.1995.73.1.65. [DOI] [PubMed] [Google Scholar]
- Stein RB, Misiaszek JE, Pearson KG. Functional role of stretch reflexes in the decerebrate walking cat. Journal of Physiology. 2000;525:781–791. doi: 10.1111/j.1469-7793.2000.00781.x. [DOI] [PMC free article] [PubMed] [Google Scholar]
- Toft E, Sinkjaer T, Andreassen S. Mechanical and electromyographic responses to stretch of the human anterior tibial muscle at different levels of contraction. Experimental Brain Research. 1989;74:213–219. doi: 10.1007/BF00248294. [DOI] [PubMed] [Google Scholar]
- Woods JJ, Bigland-Ritchie B. Linear and non-linear surface EMG/force relationships in human muscle: an anatomical/functional argument for the existence of both. American Journal of Physical Medicine. 1983;62:287–299. [PubMed] [Google Scholar]
- Yang JF, Whelan PJ. Neural mechanisms that contribute to cyclical modulation of the soleus H-reflex in walking in humans. Experimental Brain Research. 1993;95:547–556. doi: 10.1007/BF00227148. [DOI] [PubMed] [Google Scholar]
- Zar JH. Biostatistical Analysis. 2. London, UK: Prentice-Hall International, Inc.; 1984. [Google Scholar]
- Zehr EP, Stein RB. What functions do reflexes serve during human locomotion? Progress in Neurobiology. 1999;58:185–205. doi: 10.1016/s0301-0082(98)00081-1. [DOI] [PubMed] [Google Scholar]