Abstract
Detection of posttranslational modifications is expected to be one of the major future experimental challenges for proteomics. We describe herein a mass spectrometric procedure to screen for protein modifications by peptide mass fingerprinting that is based on post-data acquisition improvement of the mass accuracy by exporting the peptide mass values into analytical software for multipoint recalibration on recognized peaks. Subsequently, the calibrated peak mass data set is used in searching for modified peptides, i.e., peptides possessing specific mass deviations. In order to identify the location of Lys- and Gln-residues available for transglutaminase-catalyzed isopeptide bond formation, mammalian small heat shock proteins (sHsps) were screened for labeling with the two hexapeptide probes GQDPVR and GNDPVK in presence of transglutaminase. Peptide modification due to cross-linking of the GQDPVR hexa-peptide probe was detected for C-terminal Lys residues. Novel transglutaminase-susceptible Gln sites were identified in two sHsps (Q31/Q27 in Hsp20 and HspB2, respectively), by cross-linking of the GNDPVK hexapeptide probe. Deamidation of specific Gln residues was also detected, as well an isopeptide derived from intramolecular Gln-Lys isopeptide bond formation. We conclude that peptide mass fingerprinting can be an efficient way of screening for various posttranslational modifications. Basically any instrumentation for MALDI mass spectrometry can be used, provided that post-data acquisition recalibration is applied.
Keywords: Chaperone, cross-linking, MALDI-TOF, peptide mass fingerprinting, posttranslational modification, small heat shock protein, tissue transglutaminase
Mass spectrometry is widely used for large-scale protein identification in proteomics, based on peptide mass fingerprinting or peptide fragmentation fingerprinting.1 Mass spectrometry is also extremely useful to investigate posttranslational modifications (PTMs) in a protein.2–4 These modifications may control the activity, subcellular localization and half-life of the proteins, and their interaction with other macromolecules, such as other proteins or DNA. Common modifications are phosphorylation, O-linked glycosylation, methylation, acetylation, farnesylation, ubiquitinylation, and, as seen below, deamidation and transpeptidation. Each protein may actually contain several different PTMs; for example, the transcription factor CREB is subject to regulation by phosphorylation, O-GlcNAc-glycosylation, and acetylation.5 Well over 300 different PTMs are listed and can be searched across the Internet (see Delta Mass web page; http://www.abrf.org/index.cfm/dm.home). Posttranslational modification of proteins occurs frequently, and varies depending on cellular conditions. The picture is even emerging that differences between any two cellular states, e.g., a tumour tissue and a normal tissue, can be manifested in changes in the state of the PTMs rather than changes in expression of proteins.6 Experimental detection of PTMs is expected to be one of the major experimental challenges for proteomics in this decade.7 Clearly, there is a need for methods to rapidly screen for PTMs in any sample set, by any investigator, using any MS instrumentation.
Peptide mass fingerprinting offers a possibility to rapidly screen for possible PTMs, but only provided that the mass accuracy is sufficiently good. We here describe a rationale for routinely achieving data with sufficient mass accuracy, from any type of instrumentation for peptide mass fingerprinting, by applying a procedure with user-designed data analysis following data acquisition. After recording mass spectra for peptide mass fingerprinting, a subsequent three-step data analysis is performed. First, observed peak mass values are used to search for recognized peaks, such as trypsin or keratin peaks. Such tryptic autodigest products and peptides from contaminating keratin are particularly prevalent when working with a low amount of sample. If the identity of the protein is known, peaks derived from the known protein can also be recognized. A fairly large mass accuracy window can be used, since only a small data set is searched, namely the peptide mass values from theoretical digests of the sequences for trypsin, a limited number of keratins, and the known protein. Secondly, the recognized peaks are used for a multipoint recalibration of the peak mass values, typically down to approximately 10 ppm. Thirdly, the recalibrated peak mass values are used to search for PTMs by means of user-designed peak mass deviations.
We describe below how this approach was used to screen a number of small heat shock proteins (sHps) for modifications induced by tissue transglutaminase (TG).8–10 The TG catalyzes transamidation, i.e., the formation of a covalent isopeptide bond, within or between polypeptide chains, between the ɛ-amino group of specific Lys residues, and the γ-carboxyamide group of specific Gln residues. In a first step, the side chain of a Gln residue forms a thioester with a cysteine in the active site of TG, and ammonia is released yielding an activated acyl group. Subsequently, a covalent isopeptide bond is formed between the activated acyl group and the amine group of a specific Lys. Alternatively, hydrolysis of the thioester bond leads to deamidation, converting the Gln into a glutamic acid residue. Both processes, transamidation and deamidation, are involved in celiac disease.11 Transamidation is also referred to as transpeptidation, or transglutamination.
The sHsps are a family of ATP-independent chaperones which protect cellular proteins from irreversible aggregation by forming large, soluble complexes with the proteins that tend to unfold under stress conditions.12–14 The sHsps are oligomeric proteins, which probably become activated by formation of dimers which expose hydrophobic surfaces for binding to unfolding proteins.12,15,16 Mammalian sHsps often found in both extra- and intracellular protein aggregates in neurological disorders such as Alzheimer’s disease17 or sporadic inclusion body myositis.18
Large amounts of isopeptide cross-links have been found in such pathological protein deposits.19–21 Recently, cross-linking was demonstrated between Hsp27 and parkin and α-synuclein in neurofibrillar tangles.22 To assess the capability for various sHsps to take part in such cross-linking, different mammalian sHsps were recently characterized in terms of their susceptibility to transglutaminase, using hexapeptides designed as probes for possible amine donor (Lys, K) and amine acceptor (Gln, Q) sites.23 Here we used the same hexapeptide probes to screen for the actual location of the Lys and Gln modifications in these sHsps by mass spectrometry. Lys modification by hexapeptide probe cross-linking was detected in the C-terminal Lys of αB-crystallin K175, Hsp27 K205, and Hsp20 K162. Gln modifications were detected by hexapeptide probe cross-linking, deamidation, and cross-linking by intramolecular Lys-Gln isopeptide bond formation.
MATERIALS AND METHODS
Expression of sHsps and Catalyzed Labeling of Transglutaminase-sHsps
Several sHsps were recombinantly expressed and purified and treated by TG and biotinylated hexapeptides as described previously.23 Shortly, a Gln amine-acceptor hexapeptide (GQDPVR) was used for labeling of Lys residues, and a Lys amine-donor peptide (GNDPVK) for labeling of Gln residues. After treatment with TG (guinea pig liver transglutaminase from Sigma, 2.5 10−4 U/mL, 5 μg to 20 μg sHsp and 1 μg hexapeptide probe in 50 mM Tris-HCL, pH 7.5), samples were separated by 1D sodium dodecylsulfate-polyacrylamide gel electrophoresis, and samples were subjected to silver staining.
Mass Spectrometry and Acquisition of MALDI-TOF Mass Spectra
Vacuum-dried gel pieces were trypsin digested according to the protocol described in reference 24, and mass spectra were recorded by matrix-assisted laser desorption/ionization time-of-flight mass spectrometry (MALDI-TOF-MS) on a Voyager Elite BioSpectrometry Workstation (Perseptive Biosystems, Framingham, Massachusetts), using α-cyano hydroxy cinnamic acid as matrix after micropurification on R2 columns, as described in reference 25.
Data Analysis and Multipoint Recalibration on Recognized Peaks
Observed peak mass values were used to search, with a large mass accuracy window, for recognized peaks, such as trypsin peaks, keratin peaks, and peaks derived from the protein investigated. Then the recognized peaks were used for multipoint recalibration of the peak mass value data set, typically down to approximately 10 ppm. Trypsin and keratin peak mass values were then removed from the recalibrated peak mass value data set, which was used in searching for user-designed PTMs.
The software MoverZ (freeware available from Genomic Solutions, Ann Arbor, MI, http://65.219.84.5/moverzDL.html) was used to open mass spectrum files and export peak mass lists into the software GPMAW (General Protein Mass Analysis for Windows, available from Lighthouse data Ltd, Odense, Denmark, http://welcome.to/gpmaw/, demo-version freely available). The software includes the stand-alone module Peak-Erazor for recalibration of mass spectrum files on recognized peaks and removal of trypsin and keratin peaks (full version freely available).
Detection of Modified Peptides Using the Recalibrated Data Set
Transglutaminase-catalyzed isopeptide bond formation between a Lys and a Gln takes place under concomitant loss of NH3, or NH4+. Mass deviations following the isopeptide bond formation between the sHsp and the hexapeptide probes were calculated using the composition calculator in the software GPMAW—for both the probes including biotin (B) and a spacer arm (LC)—by specifying names, formula, and valid residues. For the hexapeptide GQDPVR, to label Lys residues, the mass deviations were calculated for the modification files, named B-LC-hexQ and B-LC-hexQ+, to 992.475 Da (C43H68N12O13S1) and 991.467 Da (C43H67N12O13S1) for loss of NH3 or NH4+, respectively. For the hexapeptide GNDPVK, to label Gln residues, mass deviations were calculated for the modification files, named B-LC-hexK and B-LC-hexK+, to 950.453 Da (C42H66N10O13S1) and 949.445 Da (C42H65N10O13S1), respectively.
RESULTS
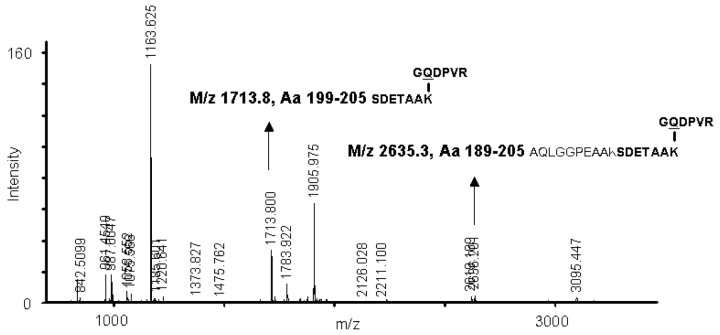
We recently proposed that several members of the human sHsp family contain Lys and/or Gln residues which are substrates for TG,23 based on biotin blotting after incubation of sHsps in the presence of biotinylated hexapeptide probes, containing either a substrate Gln (hexapeptide GQDPVR) for cross-linking to sHsp Lys residues, or a substrate Lys (hexapeptide GND-PVK) for cross-linking to sHsp Gln residues. Here the sHsps, incubated with TG and hexapeptides, were analyzed by mass spectrometry to pinpoint the location of the TG-susceptible Lys and Gln residues. For all sHsps, MALDI mass spectra were recorded and analyzed as outlined in detail below, in order to identify peaks carrying covalent modifications. Figure 1 shows the mass spectrum obtained for Hsp27 labeled with the hexapeptide GQDPVR. Arrows indicate peptides that carry the probe covalently cross-linked to the C-terminal Lys (K205). This is in agreement with existing data (Table 1). Hsp20 is used in the following discussion as an example of the strategy employed for screening new potential modifications induced by TG.
FIGURE 1.
MALDI mass spectrum used to screen for TG-susceptible Lys and Gln residues. Mass spectrum showing a tryptic digest of human Hsp27 treated by TG in the presence of the hexapeptide probe GQDPVR for Lys labeling. After export of peak mass values for spectrum analysis, multipoint recalibration on recognized peaks was performed using the programs MoverZ, GPMAW, and PeakErazor as outlined in the protocol in Scheme 1 and Figures 2 and 3. After such spectrum analysis, two peaks were identified as peptides containing the C-terminal Lys, K205, modified by formation of a covalent isopeptide bond with the hexapeptide probe GQD-PVR (arrows). That the C-terminal Lys is susceptible to TG was previously documented using a similar hexa-peptide probe in combination with exoprotease treatment, both for αB-crystallin26 and for Hsp27.27
TABLE I.
Modifications of Lys and Gln Residues Detected in Four sHsps
| Contains TG-Modified Residuesa | TG-Modified Residues Identified by MS | |||
| sHsp | Lys | Gln | Lys | Gln |
| Hsp20 (P97541) | YES | YES | K162, cross-linked | Q31, cross-linked Q66, deamidated |
| Hsp27 (P04792) | YES | YES | K205, cross-linked | No cross-linked Q detected |
| αB-crystallin (P02511) | YES | NO | K175, cross-linked | No cross-linked Q detected |
| HspB2 (Q16082) | NO | YES | No cross-linked K detected | Q27, cross-linked Q75, deamidated |
Summary of results obtained by mass spectrometry as outlined in Figures 1–5 to screen four sHsps in order to locate and identify Lys and Gln residues modified due to TG-catalyzed hexapeptide probe cross-linking, intramolecular cross-linking, or Gln deamidation. Using the same biotinylated hexapeptide probes, sHsps were previously investigated by biotin blotting to elucidate differences between mammalian sHsps in terms of their possession of any Lys and Gln residues available for TG-catalyzed cross-linking between sHsps and amyloid-β (Boros et al. 200423).
aBoros et al 200423.
1. Multipoint Recalibration on Recognized Peaks
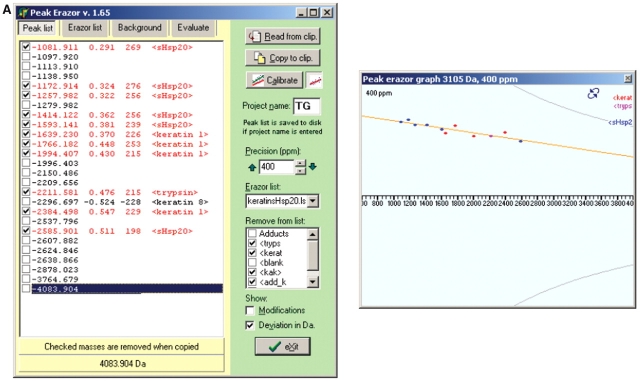
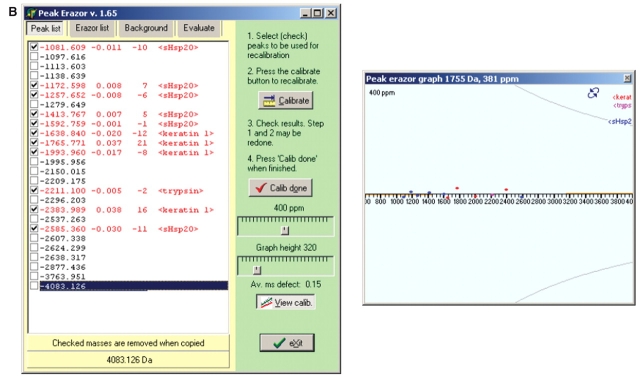
Recorded mass spectra were subjected to multipoint recalibration on recognized peaks using the programs GPMAW, PeakErazor, and MoverZ as outlined in the protocol in Scheme 1. A peptide mass value list, obtained by in silico theoretical cleavage of the known sHsp sequence in GPMAW, is first pasted into PeakErazor. After data acquisition, the mass spectrum for each sHsp is opened in software like MoverZ, and peak labeling is performed to assign peak mass values to the observed peaks. A peak mass value list is retrieved and imported into PeakErazor, yielding the situation illustrated with the PeakErazor screen-shots in Figure. 2A. In contrast to a Mascot database search, only a small data set is being searched here, namely peptide mass values from the theoretical digests of the known protein, trypsin, and keratin (trypsin and keratin peak lists are intrinsic in PeakErazor). Consequently, a large mass accuracy window (up to 800 ppm) can be used. In the left-hand peak list window, peptides from the observed mass spectrum match to six peptides from the in silico theoretical cleavage mass values (marked as <sHsp20> in Fig. 2), five keratin peaks, and one trypsin peak at 2211 Da. The matched peptides are automatically checked in the squares on the left-hand side, and the ones marked as <sHsp0> are hence recognized as peptides belonging to the sHsp. Although the mass deviations of the checked peptides are as large as 200–300 ppm in this step (Fig. 2A, left), the mass values from the six recognized sHsp peaks and the keratin 1 and trypsin peaks all fall on a straight line, as seen in the PeakErazor graph (Fig. 2A, right), hence forming a good basis for calibration. The keratin 8 peak (m/z value 2296.697) has a mass deviation of −228 and is clearly not a true contaminant and is removed from the calibration step. Using PeakErazor’s calibrate button, multipoint (linear) recalibration is thereafter performed on the peptides marked with a tick in the peak list in Fig. 2A, to yield the situation illustrated in Fig. 2B. Note how the mass deviations are now improved, as reflected by the way the peaks mass values are now centered around the horizontal line (Fig. 2B, right). The mass deviations are now on the order of 10 ppm for the <sHsp20> peaks (Fig. 2B, left). The simple linear calibration algorithm in PeakErazor requires that the mass errors fall on a straight line. However, even if the mass error distribution curve is nonlinear, the graphic tools in PeakErazor and GPMAW allow the user to evaluate whether the mass deviation found on a potential modified peptide falls on the curve, i.e., has the expected calibration error.
SCHEME 1.
How to Make a Multipoint Calibration Against Theoretical Mass Values for Matched Peptide Peaks Using the Programs GPMAW, PeakErazor, and MoverZ
| GPMAW |
| 1. Open relevant sequence. |
| 2. Make digest with scissor symbol, choosing trypsin or other relevant enzyme, with zero or 1 missed cleavages. Sort after MH+ column and remove low masses. |
| 3. Right-click: Copy special, Copy mass list (singly charged). |
| PeakErazor |
| 4. Read from clipboard. Now all theoretical peak mass values are pasted into the Peak list window. |
| 5. Right-click: Copy list to <blank>. Now the list with theoretical mass values are pasted into the Erazor list, which can be checked by looking in the Erazor list window. After the listed mass values for keratins, trypsin and contaminants of unknown origin now the theoretical mass values are listed as <blank>. The name can be changed to a more appropriate name, e.g., <sHsp20>. |
| MoverZ |
| 6. Copy peak mass values from your spectrum to clipboard. |
| Peak Erazor |
| 7. Read from clipboard. Now your experimentally determined peak mass values are listed in the Peak list window. |
| 8. To calibrate, first click the “Show graph” button beside “Calibrate button” to show a window in which your detected peak mass values are presented graphically to show how much they deviate (experimentally determined peak mass values from your spectrum that fit with the theoretical peak mass values, keratin peaks, trypsin peaks, and so called unknown peaks. Colours and names can be defined by the user). |
| 9. Then click on Calibrate button, and to the right of the Peak list window the appearance now changes to allow calibration. By moving the ruler in the mass accuracy window you can now chose how many dots you want to use for calibration. You can also remove single dots by Press Ctrl+click. |
| 10. When you have chosen the right conditions, press button Calibrate. Now the experimentally determined mass value list is calibrated, and you can see that the mass values in the Peak list window are adjusted after calibration, and that the deviations have become much smaller (now only a few ppm mass deviation from <blank> values). |
| 11. Copy to clipboard the calibrated list of experimentally determined peak mass values, after removing trypsin and keratin peaks, but not the sample peaks (“blanks”)! |
| GPMAW |
| 12. Finally, you can now paste the calibrated mass values into the Mass search in GPMAW using a very low ppm-setting (look what the ppm deviations were in the Peak list window after calibration). This will allow you to identify more peaks from your mass spectrum, such as peptides with missed cleavage sites or modifications. |
FIGURE 2.
Multipoint recalibration on recognized peaks. Screen-shots of the program PeakErazor used for multipoint recalibration on recognized peaks as outlined in the protocol in Scheme 1. Peak mass value lists of peptides observed are imported from mass spectra into PeakErazor, and matched against peak lists derived from theoretical digests in silico of the sequence from the analyzed protein, annotated as <sHsp20>, and an Erazor list, intrinsic to PeakErazor, derived from theoretical digests in silico of the sequences for keratin and trypsin. Screen-shots illustrate appearance before (A) and after (B) the linear multipoint calibration, which is based on these matched and recognized peaks. Values presented in this figure are for Hsp20 (P97541 in Swiss-Prot).
The trypsin and keratins peaks that were utilized in the calibration procedure are now excluded from the peak mass list, before exporting the recalibrated peak mass list to GPMAW to search for PTMs by identifying modified peaks.
2. Searching for Modified Peaks with User-Defined Modifications
After multipoint calibration as described above, the recalibrated peak lists were next used with the Mass Search function in GPMAW, to search for peptides matching to the theoretical digest of the Hsp20 sequence, now using a mass accuracy of 10 ppm. Searching for modified peaks is simultaneously performed in the Mass Search function in GPMAW by loading modification files provided with the program, or by creating a new modification file and entering the desired modification. New user-defined modifications are added by specifying the name, its formula, and valid residues (i.e., the residue that is able to incorporate the modification). A composition calculator provided with the program simplifies the task of calculations associated with entering the molecular formula of a new protein modification. Modifications can be defined globally (such as cysteine alkylation or methionine oxidation) for all amino acid residues of its kind, or locally by selecting an individual amino acid residue. To perform the search for peptides modified by the hexapeptide probes, masses were calculated for mass modification files named B-LC-hexQ, B-LC-hexQ+, B-LC-hexK, and B-LC-hexK+, respectively, as described in Materials and Methods.
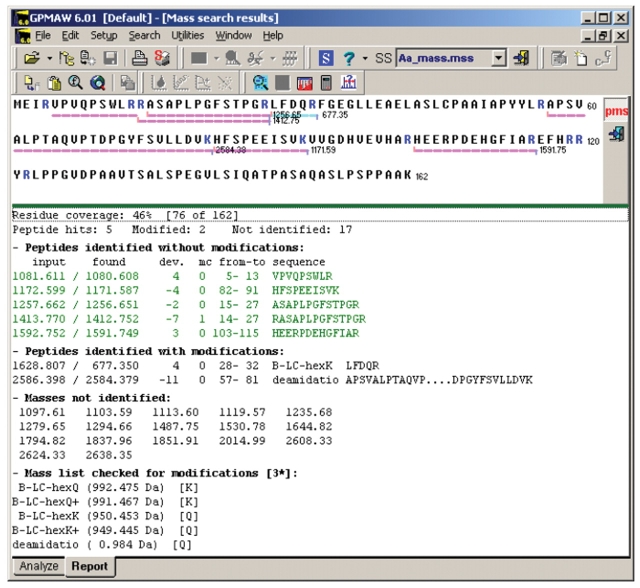
A screen-shot of the output report from GPMAW for Hsp20 is presented in Figure 3, showing that Q31 in the peptide corresponding to amino acid 28–32, LFDQR, was labeled with the hexapeptide probe GNDPVK, as detected by the modification file B-LC-hexK. Furthermore, Gln deamidation is also detected in another Gln residue, Q66, in the peptide corresponding to amino acid 57–81 (APSVAL...VLLDVK), as evident from the modification file searching for a 1 Da mass increment (Gln 146.07 Da, glutamic acid 147.05 Da). Such Gln deamidation was never seen in any sample without prior TG treatment. Another sHsp, HspB2, was also found to display similar hexapeptide probe cross-linking on one Gln (HspB2 Q27), and deamidation of another Gln (HspB2 Q75), as summarized in Table 1.
FIGURE 3.
Searching for modified peaks using GPMAW with user-defined modifications. Searching for modified peaks is performed in the program GPMAW using user-defined modifications as outlined in the protocol in Scheme 1. Screen-shot from the program GPMAW showing the report from a mass search in the Hsp20 sequence (P97541 in Swiss-Prot), with user-defined modifications for Hsp20 incubated with TG and the hexapeptide probe GNDPVK. Upper part shows a graphic presentation of the sequence coverage (in this case 46%). Lower part shows the number of matched peptides (in this case 5) with mass deviations, 10 ppm, and the number of matched peptides with modifications (in this case 2), one peptide (aa 28–32) containing Hsp20 Q31 modified by Gln cross-linking to the hexapeptide probe GNDPVK, and one peptide (aa 57–81) containing Hsp20 Q66 with Gln deamidation to Hsp20 E66. Further below unmatched peptides are reported, and at the bottom also a list of all the user-defined modifications used in the GPMAW mass search.
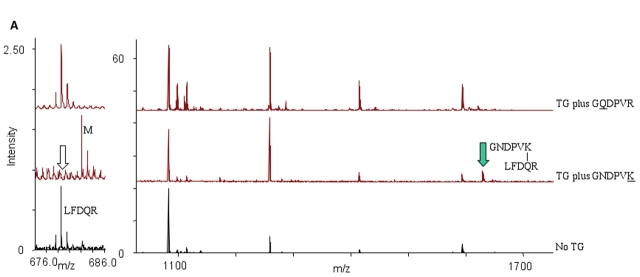
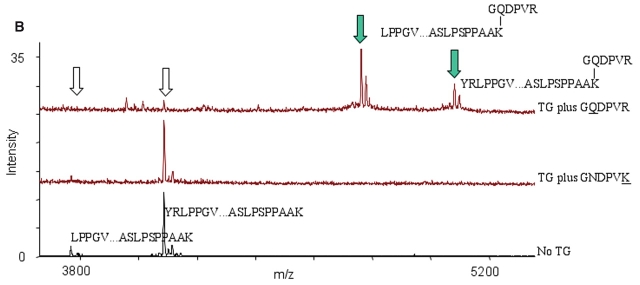
After identifying the modified peptides using the Mass Search function in GPMAW, inspection of the peaks in the corresponding mass spectra showed that the appearance of a certain modified peak occurred under concomitant disappearance of the corresponding unmodified peak. The hexapeptide probe labeling detected for Gln (Q31) corresponded to the disappearance of the LFDQR peak at 677.35 Da and the appearance of a peak at 1628.8 Da, i.e., with a 950.45 Da mass increment corresponding to B-LC-hexK (Fig. 4A). The hexapeptide probe labeling detected on the C-terminal Lys (K162) corresponded to the disappearance of peaks at 3763.7 Da and 4083.2 Da (corresponding to amino acids 123–162 YRLPP. . . PAAK and 125–162 LPP. . . PAAK) and the appearance of peaks at 4756.5 Da and 5075.7 Da, both with a 992.5 Da mass increment corresponding to B-LC-hexQ (Fig. 4B).
FIGURE 4.
Hexapeptide probe cross-linking and appearance of modified peaks at the expense of unmodified peaks in Hsp20. Overview of MALDI mass spectra recorded for Hsp20 incubated with TG in presence of the hexapeptide probe GQDPVR for labeling of Lys residues (upper), or the hexapeptide probe GNDPVK for labeling of Gln residues (middle), and control Hsp20 without TG (lower). Mass spectra are magnified to show different mass ranges, m/z below 1700 Da (A) or m/z above 3800 Da (B). Filled and unfilled arrows mark the peptides, which increase and decrease in intensity, respectively.
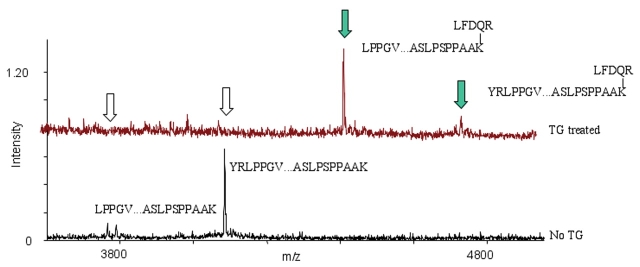
Since Hsp20 was found to possess both Lys (K162) and Gln (Q31) residues susceptible to TG, we also checked if we could detect any signal that could represent an intramolecular Gln-Lys isopeptide bond formation. The expected mass of an isopeptide from the peptides containing Q31 and K162 would be LPP. . . PAAK (3763.0 Da) +LFDQR (677.35 Da), and with the loss of one NH3 (3763.0 +677.35 −17.03) = 4423.32 Da. Such a peptide is indeed observed (Fig. 5), even in two variants—one without missed cleavage sites and one with a missed cleavage site, making the assignment even more reliable. Detection of TG-modified Lys and Gln residues in the four sHsps (Hsp20, Hsp27, αB-crystallin, and HspB2) is summarized in Table I.
FIGURE 5.
Cross-linking by intramolecular peptide bond formation in Hsp20. MALDI mass spectra recorded for Hsp20 incubated with TG (A) and control Hsp20 without TG (B). A band, detected below the hexapeptide probe labeled Hsp20 (see Fig. 1, Hsp20 in Boros et al., reference 23), was investigated for a presumed intramolecular cross-link. A cross-linked peptide representing an intramolecular Q31-K162 isopeptide bond formation was detected as two peaks (marked by green arrows) appearing at 3763.0 Da (LFDQ31R covalently cross-linked to LPP. . .PAAK162) and 4423.32 Da (LFDQ31R covalently cross-linked to LPP. . .PAAK162), respectively. The peaks representing corresponding unmodified peptides decreased correspondingly (marked by white arrows ).
DISCUSSION
Screening sHsps for TG-Susceptible Lys and Gln Residues
We have described how a number of sHps could be screened by peptide mass fingerprinting for modifications induced by tissue TG. Evidence that such cross-linking involves Lys and Gln residues in several different mammalian sHsps was previously suggested, using the same hexapeptides used here as probes to search for possible amine donor (Lys, K) and amine acceptor (Gln, Q) sites.23 By our peptide mass fingerprinting, Lys modification was confirmed for the previously known modification of the C-terminal Lys in αB-crystallin, K175,26 and Hsp27 K205,27 and was also detected on the C-terminal Lys in Hsp20, K162.
Gln residues susceptible to TG-catalyzed modification were identified for the first time and located at Hsp20 Q31 (incorporation of hexapeptide probe) and Hsp20 Q66 (deamidation of). A similar pattern was observed for another sHsp, HspB2, for which incorporation of the hexapeptide probe was detected at a corresponding Gln, HspB2 Q27, and deamidation of HspB2 Q75.
It is likely that the different sHsps in the mammalian sHsp family may play distinctly different roles in general, and in transglutamination events in particular. By our peptide mass fingerprinting, Hsp20 was found to have both a TG-susceptible Lys (K162) and a TG-susceptible Gln (Q31), whereas αB-crystallin has only a TG-susceptible Lys (K175) and HspB2 only a TG-susceptible Gln (Q27). This fits the previous observations,23 with the exception of Hsp27 for which we could only detect unmodified Q31 (Table 1). The different human sHsps have different capacities to intermix and cross-link with each other and with amyloid-β in brain autopsy material, 23 and the exact roles for the various sHsps remain to be elucidated. Present data call for further investigation on differences between sHsps in terms of their behavior with TG under cellular conditions.
The Approach to Screen Proteins for Various Modifications Using Peptide Mass Fingerprinting and Recalibrated Data Sets
Mass spectrometry has been used previously to suggest the location of Gln residues susceptible to TG cross-linking after incubation with 14C-labeled polyamines, such as Q93 in vitronection28 or the Q83, Q84 and Q86 for plasminogen activator inhibitor type 2.29 We describe herein a procedure to systematically screen for protein modifications by peptide mass fingerprinting, based on post-data acquisition improvement of the mass accuracy by multipoint recalibration of recognized peaks. This approach offers the possibility to screen for PTMs in any sample set, by any investigator, using any MS instrumentation. In our case, the Lys and Gln modifications discovered by this approach had already been indicated by other independent techniques, such as the streptavidin-biotin blot analyses.23 Otherwise, a sound strategy may be to first screen for PTMs by peptide mass fingerprinting as done here, than to verify the most interesting discoveries by peptide fragmentation (MS/MS) and de novo sequencing, which, however, is more time-consuming. In the case of cross-linked peptides, MS/MS can also turn out very complex, since the two peptides will fragment simultaneously. To first screen for PTMs by peptide mass fingerprinting as done here is obviously useful in itself. In addition, it also provides an idea of what to expect from an MS/MS spectrum of cross-linked peptides, which otherwise would be very difficult to solve.
Other Types of Software
To use the recalibrated data set in searching for PTMs, other types of software than GPMAW, which we have used here, can also be applied. The new search engine Aldente at ExPASy has, in contrast to Mascot, ProFound and MS-Fit, a function for editing user-defined modifications similar to what we describe here for the software GPMAW. Mascot can do the same on an “in-house” server.
When the identity of the protein (whose PTM status is going to be investigated) is known, it is still an important advantage to restrict the search only to the amino acid sequence of this protein as can be done in GPMAW or in FindMod at ExPASy. Another advantage with using the GPMAW program locally on the user’s own computer is that the user can store and build small databases of often-used sequences of the proteins under investigation. Moreover, PeakErazor offers the opportunity to detect and filter away specific contaminants, other than keratins and trypsin, which repeatedly occur in any given sample set.
The world of PTMs is extremely complex—one protein may have several potential PTMs, yet under some circumstances some will not appear at all and others will. Especially in the beginning of the “PTMomics”/“modificomics” challenge there will be a need for systematic and comprehensive analyses applying multiple time-points and experimental conditions. New functions are continuously added to GPMAW.
We have detected sHsp Lys and Gln residues which become modified by TG cross-linking. Several other Lys and Gln residues were detected as unmodified, and some were not detected at all. We can conclude that some specific Lys and Gln residues are indeed substrates for TG (αB-crystallin K175, Hsp27 K205 and Hsp20 K162, and Hsp20 Q31, HspB2 Q27 (cross-linking), and Hsp20 Q66, HspB2 Q75 (deamidation), but not exclude the possibility that certain other Lys and Gln residues in the sHsps may be substrates also. This is due to sequence coverage aspects and to quantitative aspects. For the best characterized PTMs so far, phosphorylation,30–32 it has become clear that a single modification of a protein can be a very small fraction of the total amount of protein. The actual amount of modified peptide may vary depending on the conditions assayed. That PTMs vary with cellular status further emphasizes the need for rapid screening approaches which can cope with assessment of more than one time-point.
In order to be really useful, PTM screening should have 100% sequence coverage not to “miss” the PTM. There are various ways to improve sequence coverage.33 One way is to reduce the suppression effects by separating the individual peptides before reaching the mass spectrometer by applying LC-MALDI-MS/MS to tryptic digests of the individual proteins. Sequence coverage can also be improved by using other proteolytic enzymes besides trypsin; by removing impurities by microcolumns;25,33 by sample pretreatment to convert Lys residues to homoarginine by O-methylisourea to enhance signals from Lys-containing peptides;35–37 or by using matrix mixtures instead of a single matrix.38
Peptide mass fingerprinting can be an efficient way of screening for various PTMs, and basically any instrumentation for mass spectrometry can be used provided that post-data acquisition recalibration is applied.
Acknowledgments
This study was supported by a grant from the Carl Tryggers Research Foundation (03:322) to CSE and from the Netherlands Organization for Scientific Research (grant NOW-MW 903-51-170) to WCB. Professor Peter Roepstorff is acknowledged for continuous encouragement and stimulating discussions and for providing a superior research environment in which to develop GPMAW. We are indebted to Prof. Wilfried de Jong for critical reading of the manuscript.
REFERENCES
- 1.Pandey A, Mann M. Proteomics to study genes and genomes. Nature, 2000;405: 837–846. [DOI] [PubMed] [Google Scholar]
- 2.Larsen MR, Roepstorff P. Mass spectrometric identification of proteins and characterization of their posttranslational modifications in proteome analysis. Fresenius J Anal Chem, 2000;366:677–690. [DOI] [PubMed] [Google Scholar]
- 3.Mann M, Jensen ON. Proteomic analysis of posttranslational modifications. Nat Biotechnol, 2003;21:255–261. [DOI] [PubMed] [Google Scholar]
- 4.Jensen ON. Modification-specific proteomics: Characterization of posttranslational modifications by mass spectrometry. Curr Opin Chem Biol, 2004; 8: 33–41. [DOI] [PubMed] [Google Scholar]
- 5.Khidekel N, Hsieh-Wilson LC. A “molecular switchboard”—Covalent modifications to proteins and their impact on transcription. Org Biomol Chem, 2004;2:1–7. [DOI] [PubMed] [Google Scholar]
- 6.Imafuku Y, Omenn GS, Hanash S. Proteomics approaches to identify tumor antigen directed autoantibodies as cancer biomarkers. Dis Markers, 2004; 20:149–153. [DOI] [PMC free article] [PubMed] [Google Scholar]
- 7.Appel RD, Bairoch A. Post-translational modifications: A challenge for proteomics and bioinformatics. Proteomics, 2004;4: 1525–1526. [DOI] [PubMed] [Google Scholar]
- 8.Griffin M, Casadio R, Bergamini CM. Transglutaminases: Nature’s biological glues. Biochem J, 2002;368: 377–396. [DOI] [PMC free article] [PubMed] [Google Scholar]
- 9.Fesus L, Piacentini M. Transglutaminase 2: An enigmatic enzyme with diverse functions. Trends Biochem Sci, 2002;27:534–539. [DOI] [PubMed] [Google Scholar]
- 10.Lorand L, Graham RM. Transglutaminases: Cross-linking enzymes with pleiotropic functions. Nat Rev Mol Cell Biol, 2003;4:140–156. [DOI] [PubMed] [Google Scholar]
- 11.Fleckenstein B, Qiao SW, Larsen MR, et al. Molecular characterization of covalent complexes between tissue transglutaminase and gliadin peptides. J Biol Chem, 2004; 279:17607–17616. [DOI] [PubMed] [Google Scholar]
- 12.Giese KC, Vierling E. Mutants in a small heat shock protein that affect the oligomeric state: Analysis and allele-specific suppression. J Biol Chem, 2004;279: 32674–32683. [DOI] [PubMed] [Google Scholar]
- 13.Van Montfort R, Slingsby C, Vierling E. Structure and function of the small heat shock protein/alpha-crystallin family of molecular chaperones. Adv Protein Chem, 2001;59:105–156. [DOI] [PubMed] [Google Scholar]
- 14.de Jong WW, Caspers GJ, Leunissen JA. Genealogy of the alpha-crystallin—Small heat-shock protein superfamily. Int J Biol Macromol, 1998;22:151–162. [DOI] [PubMed] [Google Scholar]
- 15.Haslbeck M, Walke S, Stromer T, et al. Hsp26: A temperature-regulated chaperone. Eur Mol Biol Org J, 1999; 18: 6744–6751. [DOI] [PMC free article] [PubMed] [Google Scholar]
- 16.van Montfort, RL, Basha E, Friedrich KL, Slingsby C, Vierling E. Crystal structure and assembly of a eukaryotic small heat shock protein. Nat Struct Biol, 2001;8: 1025–1030. [DOI] [PubMed] [Google Scholar]
- 17.Renkawek K, Bosman GJ, de Jong WW. Expression of small heat-shock protein hsp 27 in reactive gliosis in Alzheimer disease and other types of dementia. Acta Neuropathol (Berl), 1994;87:511–519. [DOI] [PubMed] [Google Scholar]
- 18.Banwell BL, Engel AG. AlphaB-crystallin immunolocalization yields new insights into inclusion body myositis. Neurology, 2000;54:1033–1041. [DOI] [PubMed] [Google Scholar]
- 19.Kim SY, Grant P, Lee JH, Pant HC, Steinert PM. Differential expression of multiple transglutaminases in human brain. Increased expression and cross-linking by transglutaminases 1 and 2 in Alzheimer’s disease. J Biol Chem, 1999;274:30715–30721. [DOI] [PubMed] [Google Scholar]
- 20.Choi YC, Park GT, Kim TS, et al. Sporadic inclusion body myositis correlates with increased expression and cross-linking by transglutaminases 1 and 2. J Biol Chem, 2000;275:8703–8710. [DOI] [PubMed] [Google Scholar]
- 21.Lesort M, Tucholski J, Miller ML, Johnson GV. Tissue transglutaminase: A possible role in neurodegenerative diseases. Prog Neurobiol, 2000;61:439–463. [DOI] [PubMed] [Google Scholar]
- 22.Nemes Z, Devreese B, Steinert PM, Van Beeumen J, Fesus L. Cross-linking of ubiquitin, HSP27, parkin, and alpha-synuclein by gamma-glutamylepsilon-Lys bonds in Alzheimer’s neurofibrillary tangles. FASEB J, 2004;18:1135–1137. [DOI] [PubMed] [Google Scholar]
- 23.Boros S, Kamps B, Wunderink L, et al. Transglutaminase catalyzes differential cross-linking of small heat shock proteins and amyloid-beta. FEBS Lett, 2004;576: 57–62. [DOI] [PubMed] [Google Scholar]
- 24.Shevchenko A, Jensen ON, Podtelejnikov AV, et al. Linking genome and proteome by mass spectrometry: Large-scale identification of yeast proteins from two dimensional gels. Proc Natl Acad Sci USA, 1996;93: 14440–14445. [DOI] [PMC free article] [PubMed] [Google Scholar]
- 25.Gobom, J, Nordhoff E, Mirgorodskaya E, Ekman R, Roepstorff P. Sample purification and preparation technique based on nano-scale reversed-phase columns for the sensitive analysis of complex peptide mixtures by matrix-assisted laser desorption/ionization mass spectrometry. J Mass Spectrom, 1999;34:105–116. [DOI] [PubMed] [Google Scholar]
- 26.Groenen, PJ, Bloemendal H, de Jong WW. The carboxy-terminal Lys of alpha B-crystallin is an amine-donor substrate for tissue transglutaminase. Eur J Biochem, 1992;205:671–674. [DOI] [PubMed] [Google Scholar]
- 27.Merck, KB, Groenen PJTA, Voorter CEM, et al. Structural and functional similarities of bovine alpha crystallin and mouse small heat-shock protein a family of chaperones. J Biol Chem, 1993; 268: 1046–1052. [PubMed] [Google Scholar]
- 28.Skorstengaard, K, Halkier T, Hojrup P, Mosher D. Sequence location of a putative transglutaminase cross-linking site in human vitronectin. FEBS Lett,1990;262: 269–274. [DOI] [PubMed] [Google Scholar]
- 29.Jensen, PH, Schuler E, Woodrow G, et al. A unique interhelical insertion in plasminogen activator inhibitor-2 contains three Glns, Gln83, Gln84, Gln86, essential for transglutaminase-mediated cross-linking. J Biol Chem, 1994;269:15394–15398. [PubMed] [Google Scholar]
- 30.McLachlin DT, Chait BT. Analysis of phosphorylated proteins and peptides by mass spectrometry. Curr Opin Chem Biol, 2001;5:591–602. [DOI] [PubMed] [Google Scholar]
- 31.Sickmann A, Meyer HE. Phosphoamino acid analysis. Proteomics, 2001;1:200–206. [DOI] [PubMed] [Google Scholar]
- 32.Mann M, Ong SE, Gronborg M, et al. Analysis of protein phosphorylation using mass spectrometry: Deciphering the phosphoproteome. Trends Biotechnol, 2002;20: 261–268. [DOI] [PubMed] [Google Scholar]
- 33.Hjerno K, Roepstorff P. Improvement of sequence coverage in peptide mass fingerprinting. In Dunn H (ed): Core methodologies, Vol 3: Proteomics. Encyclopedia of Genetics, Genomics, Proteomics and Bioinformatics. NY: John Wiley, 2005. Online edition available at http://www.mrw.interscience.wiley.com/ggpb/articles/g301413/frame.html.
- 34.Larsen MR, Graham ME, Robinson PJ, Roepstorff P. Improved detection of hydrophilic phosphopeptides using graphite powder microcolumns and mass spectrometry: Evidence for in vivo doubly phosphorylated dynamin I and dynamin III. Mol Cell Proteomics, 2004;3:456–465. [DOI] [PubMed] [Google Scholar]
- 35.Beardsley RL, Karty JA, Reilly JP. Enhancing the intensities of Lys-terminated tryptic peptide ions in matrix-assisted laser desorption/ionization mass spectrometry. Rapid Commun Mass Spectrom, 2000;14:2147–2153. [DOI] [PubMed] [Google Scholar]
- 36.Brancia FL, Oliver SG, Gaskell SJ. Improved matrix-assisted laser desorption/ionization mass spectrometric analysis of tryptic hydrolysates of proteins following guanidination of Lys-containing peptides. Rapid Commun Mass Spectrom, 2000;14:2070–2073. [DOI] [PubMed] [Google Scholar]
- 37.Hale JE, Butler JP, Knierman MD, Becker GW. Increased sensitivity of tryptic peptide detection by MALDI-TOF mass spectrometry is achieved by conversion of Lys to homoarginine. Anal Biochem, 2000;287: 110–117. [DOI] [PubMed] [Google Scholar]
- 38.Laugesen S, Roepstorff P. Combination of two matrices results in improved performance of MALDI MS for peptide mass mapping and protein analysis. J Am Soc Mass Spectrom, 2003;14:992–1002. [DOI] [PubMed] [Google Scholar]


