

Abstract
Critical illness myopathy is an acquired disorder in which skeletal muscle becomes electrically inexcitable. We previously demonstrated that inactivation of Na+ channels contributes to inexcitability of affected fibres in an animal model of critical illness myopathy in which denervated rat skeletal muscle is treated with corticosteroids (steroid denervated; SD). Our previous work, however, did not address the relative importance of membrane depolarization versus a shift in the voltage dependence of fast inactivation in causing inexcitability. It also remained unknown whether changes in the voltage dependence of activation or slow inactivation play a role in inexcitability. In the current study we found that a hyperpolarizing shift in the voltage dependence of fast inactivation of Na+ channels is the principal factor underlying inexcitability in SD fibres. Although depolarization tends to decrease excitability, it is insufficient to account for inexcitability in SD fibres since many normal and denervated fibres retain normal excitability when depolarized to the same resting potentials as affected SD fibres. Changes in the voltage dependence of activation and slow inactivation of Na+ channels were also observed in SD fibres; however, the changes appear to increase rather than decrease excitability. These results highlight the importance of the change in fast inactivation in causing inexcitability of SD fibres.
Critical illness myopathy is a disorder of skeletal muscle in which weakness is due to failure of muscle fibres to generate action potentials (Rich et al. 1996, 1997). In rats, denervation of muscle combined with administration of corticosteroids (steroid denervated, SD) produces muscle inexcitability and serves as a model of the human disorder that enables the study of mechanisms underlying loss of muscle excitability.
A number of factors modulate muscle fibre excitability: (1) a decrease in muscle fibre specific membrane resistance due to increased Cl− or K+ conductance could prevent action potential initiation (Noble & Stein, 1966). Other factors may decrease the maximum available inward current; (2) the density of Na+ channels in the sarcolemma might be reduced; (3) current flow through channels could be reduced by a change in the Na+ equilibrium potential; (4) the voltage dependence of activation might be shifted towards more positive voltages; (5) single channel conductance might be decreased; or (6) the number of Na+ channels that are inactivated may be increased.
We previously observed several changes in SD muscle fibres that decrease excitability. Specific membrane resistance in SD fibres was slightly decreased relative to denervated muscle (Rich et al. 1998), and there was a nearly twofold decrease in maximum Na+ current density (Rich & Pinter, 2001). There was also a reduction in the resting potential and a hyperpolarized shift in the voltage dependence of Na+ channel fast inactivation (Rich & Pinter, 2001) that combined to increase inactivation of Na+ channels at the resting potential of affected SD fibres.
Although our previous study suggested that inactivation of Na+ channels was an important contributor to reduced excitability of SD fibres, several questions remained unanswered. First, the relative importance of depolarization of the resting potential and the shift in the voltage dependence of fast inactivation was unclear. Second, the role of another form of Na+ channel inactivation, slow inactivation, was unknown. Slow inactivation of Na+ channels occurs on a 1–5 min timescale and causes inactivation of Na+ channels at the resting potential of normally innervated muscle fibres (Simoncini & Stuhmer, 1987; Ruff et al. 1988; Cummins & Sigworth, 1996; Featherstone et al. 1996; Ruff, 1996a,b; Richmond et al. 1998; Bendahhou et al. 2002). In the rat model of critical illness myopathy, muscle fibres remain at depolarized resting potentials (secondary to denervation) for days so that slow inactivation may significantly limit Na+ conductance available at the resting potential. Impaired slow inactivation has been implicated in the pathogenesis of hyperkalaemic periodic paralysis (Cummins & Sigworth, 1996; Bendahhou et al. 2002) and it seemed likely that slow inactivation plays an important role in causing inexcitability of SD fibres. Third, the role of changes in the voltage dependence of Na+ channel activation remained unknown.
Our goal in this study was to determine the factor(s) most important in causing inexcitability of SD muscle. We examined the relative importance of resting membrane potential depolarization and shifts in the voltage dependence of fast inactivation in determining loss of excitability. This was accomplished by expanding our study to include denervated fibres not treated with corticosteroids, and control fibres depolarized with increased extracellular K+. Denervated and control fibres did not lose excitability until the resting potential was depolarized relative to the resting potential at which SD fibres became inexcitable. Furthermore, in the few denervated fibres where excitability was reduced, the decrease in excitability was accompanied by a shift in the voltage dependence of fast inactivation towards more hyperpolarized potentials. We also examined whether changes in Na+ channel activation or slow inactivation contribute to inexcitability of SD fibres. Unexpectedly, the voltage dependence of slow inactivation and activation in SD muscle fibres exhibited changes that tended to increase, rather than decrease excitability of SD fibres. Our results demonstrate that a shift in the voltage dependence of fast inactivation is the most important factor causing loss of excitability in SD muscle.
METHODS
Tissue preparation and perfusion
Denervation, treatment of rats and viewing of muscle fibres was carried out as previously described (Rich et al. 1998; Rich & Pinter, 2001). Briefly, rat muscle was denervated by removing a 10 mm segment of the left sciatic nerve in anaesthetized (ketamine 5 mg kg−1 and zylaxine 15 mg kg−1 administered intraperitoneally) adult female Wistar rats (250–350 g body weight). Dexamethasone (5 mg kg−1) was injected intraperitoneally, beginning on the day of denervation and continuing for 7–10 days. Rats were killed by exposure to a rising concentration of carbon dioxide, and the extensor digitorum longus (EDL) was dissected tendon-to-tendon and muscle fibres were labelled with 10 μm 4-(4-diethylaminostyryl)-N-methylpyridinium iodide (4-Di-2-ASP; Molecular Probes, Eugene, USA) using an upright epifluorescence microscope. For all experiments the recording chamber was continuously perfused with solution containing (mm): NaCl 118; KCl 3.5; CaCl2 1.5; MgSO4 0.7; NaHCO3 26.2; NaH2PO4 1.7; glucose 5.5 (pH 7.3–7.4, 20–22 °C) equilibrated with 95 % O2 and 5 % CO2. All animal protocols were performed in accordance with Emory University Institutional Animal Care and Use Committee guidelines.
Measurement of action potentials in high K+
In some experiments, the effect of depolarization on muscle fibre action potential initiation was studied by elevating the external K+ concentration. The K+ concentration in the bathing fluid was raised to 7–12 mm in increments of 1–3 mm by adding KCl until action potential initiation failed. Recording commenced 15 min after each increase in K+ concentration to provide sufficient time for exchange of solution and development of slow inactivation. Intracellular action potentials were then recorded using a pair of glass micropipettes (one for current passage, the other for voltage recording) that had resistances of greater than 15 MΩ and were filled with 3 m KCl and 10 ng ml−1 sulforhodamine (used to visualize the electrode with fluorescence). To initiate action potentials the electrodes were placed 50–100 μm apart and depolarizing 5 ms current pulses of up to 100 nA were given. Before categorizing a fibre as inexcitable, current pulses were applied sufficient to depolarize the fibre to a potential of at least −25 mV. Muscle contraction was inhibited with dantrolene (6 mg ml−1; Calbiochem, La Jolla, USA) as previously described (Rich et al. 1998).
Loose patch voltage clamp
Loose patch voltage recording was used to study voltage-activated membrane currents. Several recent studies of Na+ channel gating that used loose patch clamp recording from intact muscle fibres have used enzymatic pretreatment to improve seal resistances (Ruff, 1996a, 1999). We elected not to use enzymatic pretreatment out of concern that such treatment might alter gating of Na+ channels. For details of the loose patch technique used see Rich & Pinter (2001). All loose patch recordings were made greater than 50 μm from the endplate to avoid the steep gradient of Na+ channels that is present near the endplate (Roberts, 1987; Ruff & Lennon, 1998). Prior to seal formation, resting potentials were measured by briefly impaling each fibre approximately 50–100 μm from the loose patch recording site with a sharp electrode. The measured voltage was assumed to be the resting potential for all subsequent voltage steps. To ensure that no loss of resting potential occurred during the measurement of the voltage dependence of slow inactivation, the resting potential was re-measured after completing the slow inactivation protocol. Data were discarded if the resting potential measurements disagreed by 4 mV or more. In cases where the resting potential differed by 3 mV or less the two measurements of the resting potential were averaged.
Patch electrodes were made from soft glass (catalogue no. 22–358739, Fisher Scientific) using a horizontal pipette puller (Brown and Flaming). All patch pipettes were lightly heat polished, had internal diameters of 5–11 μm and resistances of 0.3–0.5 MΩ. The patch pipette, filled with the normal external solution (see above) and 1 ng ml−1 sulforhodamine, was advanced under visual guidance until it gently indented the muscle fibre. The seal factor (Rs/(Rs+Rp), where Rs is the shunt resistance and Rp is the patch pipette resistance) was kept greater than 0.4 (mean ±sd= 0.44 ± 0.025) since at values of less than 0.4 the leak could not be adequately compensated. The leak was compensated manually by adjusting the compensation current. Shunt resistance was measured on-line immediately before the application of each voltage step and used to adjust the step amplitude. In order to calculate current densities, the cross-sectional area of each patch pipette tip was estimated from tip diameters visualized microscopically (500 ×).
Slow inactivation voltage protocol
An important consideration in measuring slow inactivation is how long to hold at a given potential before inward currents are measured. This time is dictated by the time constant for slow inactivation. While most studies have reported time constants for slow inactivation of less than 1 min (Cummins & Sigworth, 1996; Featherstone et al. 1996; Richmond et al. 1998; Bendahhou et al. 2002) in some studies time constants for slow inactivation at room temperature were reported that were as long as 3–5 min at certain holding potentials (Ruff, 1999; Todt et al. 1999; Hilber et al. 2001). In these experiments, the patch was held at a given potential for 3 min before measuring Na+ current. Slow inactivation may have been overestimated in the range of 90 to −110 mV since that is the voltage range where the longest time constants have been reported. Steps to those voltages were made from the resting potential and the time may not have been long enough to fully relieve slow inactivation. Since the time constant for slow inactivation is more rapid at potentials more negative than −110 mV, this is less of a concern at −130 mV where we estimated maximum Na+ current (Ruff, 1999). The most important voltage steps for our purposes were those between −80 and −50 mV since this is the voltage range over which action potentials fail in both normal and SD fibres (see Results). In this range, even the studies reporting the longest slow inactivation time constants found the time constant of slow inactivation to be less than 1.5 min (Simoncini & Stuhmer, 1987; Ruff, 1999). Thus it appears unlikely that we underestimated slow inactivation in this voltage range. The use of a 3 min holding time rather than longer holding times had the important advantage of enabling multiple measurements of slow inactivation on individual fibres so that a full inactivation curve could be obtained for each fibre. This has not been possible in previous studies using longer holding times.
Following seal formation, the following protocol was used to measure slow inactivation. The fibre was held at the test voltage for 3 min, followed by a brief step to −120 mV to relieve fast inactivation. A 10 ms depolarizing pulse to −20 mV was then given to activate Na+ current. The prepulse to −120 mV and the step to −20 mV were repeated three times and the Na+ current traces averaged. After the series of voltage steps, the holding current was removed, the transmembrane potential was allowed to return to the resting potential, the seal resistance was checked and leak current compensation adjusted. The test voltages used were −130, −80, −95, −110, −65, −50 and −130 mV. If at any time during the recording the seal factor fell below 0.4 the fibre was discarded. If the difference between the initial and final current amplitudes at −130 mV exceeded 20 %, the data from the fibre were also discarded. In several fibres with very stable seals, additional holding voltages of −102, −87 and −72 mV were used following the completion of the initial series of steps to allow for a more detailed measurement of the voltage dependence of slow inactivation. The number of fibres in which slow inactivation was measured in this study was limited by the fact that the slow inactivation protocol takes 30 min to complete on a single fibre.
Fast inactivation voltage protocol
Fast inactivation was measured by applying 50 ms conditioning prepulses to various holding potentials between −130 and −50 mV followed by a 10 ms pulse to −20 mV to activate Na+ current. Each voltage step was repeated three times and averaged. The voltage dependence of fast inactivation was measured twice and averaged. The data from the two measures of fast inactivation were averaged and fitted with a Boltzmann curve (see below). For measures of fast inactivation, the fibre was held at −110 mV between pulse protocols to relieve most slow inactivation.
Activation voltage protocol
The voltage dependence of activation was measured during the slow inactivation protocol following the holding potential of −110 mV. This holding potential was used since the currents were large enough to accurately measure, but not as large as those at a holding potential of −130 mV where depolarization of the muscle fibre by the larger inward current might lead to an artificially steep voltage dependence due to lack of voltage clamp of the muscle fibre. After a prepulse of 50 ms to −120 mV to relieve fast inactivation, a series of 10 ms voltage steps was then made from −70 to −10 mV. Each voltage step was repeated three times and averaged. For calculation of Na+ conductance, the Na+ reversal potential was assumed to be +45 mV (Almers et al. 1984; Ruff, 1999).
Calculation of maximal Na+ conductance
Maximal Na+ conductance was calculated from the Na+ current density measured following a step to −20 mV. To remove all forms of inactivation, the fibre was held for 3 min at −130 mV. In a preliminary analysis, we found that relief of slow inactivation was close to 90 % complete by 3 min after a step to −130 mV. A 3 min holding time at −130 mV thus gave a reasonable estimate of the maximal Na+ current density. In both indeterminate and SD inexcitable fibres, a step to −20 mV from a holding potential of −130 mV activated close to 100 % of Na+ channels and thus led to an accurate estimate of maximal Na+ conductance. In control and SD excitable fibres, however, activation was not complete following a step to −20 mV so that maximal Na+ conductance would be underestimated. In SD excitable fibres only 90 % of Na+ channels open following a step to −20 mV. To correct for this, the calculated Na+ conductance was increased by dividing by 0.9. In control fibres 94 % of Na+ channels were opened following a step to −20 mV so the calculated Na+ conductance was increased by dividing by 0.94.
Analysis
For both fast and slow inactivation the Boltzmann distribution equation used to fit the data was:
where INa/INa,max is the relative amplitude of INa during a pulse to −20 mV, Vm is the membrane potential during the prepulse (fast inactivation) or the holding potential (slow inactivation), V1/2) is the potential at which half of the Na+ channels are inactivated, and k is a parameter describing the slope of the voltage dependence.
The voltage dependence of activation was calculated with the equation:
where G(Vm) is the Na+ conductance as a function of membrane potential, Ipk(Vm) is the peak inward Na+ current produced by a step to Vm and Erev is the Na+ reversal potential. The maximal Na+ conductance was normalized to a value of 1 and was then fitted with a Boltzmann distribution similar to that used for inactivation.
All data other than linear fits were compared using the Student's t test to determine statistical significance. All means are given ± the s.e.m. Fits of data analysing correlation between factors altering excitability were performed using linear regression analysis. All fits (linear and Boltzmann) were performed using Origin software from Microcal Software (Northampton, MA, USA).
RESULTS
Membrane potential depolarization and excitability
Depolarization may be an important contributor to loss of excitability in SD muscle as it increased the percentage of Na+ channels inactivated at the resting potential (Rich et al. 1998). To determine the importance of depolarization in causing inexcitability, we examined the relationship between membrane potential and excitability in SD fibres with that observed in two other experimental conditions where fibres are similarly depolarized: (1) control muscle depolarized with high external K+ and (2) denervation of muscle in the absence of corticosteroid treatment.
When control muscle fibres were depolarized by increasing external K+, excitability decreased in a stereotyped manner and muscle fibres passed through a stage where action potential generation was no longer all or none. The characteristics of action potentials in normal muscle fibres at various resting potentials are illustrated in Fig. 1. Action potentials in control muscle at the normal resting potential were all or none, and peaked between +30 and +40 mV (Fig. 1A). The first changes that occurred as muscle fibres were depolarized were an increase in the threshold for action potential initiation and a reduction in the peak potential reached (Fig. 1B). At more depolarized resting potentials, there was a further increase in action potential threshold, and action potential amplitude became a function of stimulus strength. These action potentials resembled those from a subset of SD fibres that we previously labelled as indeterminate since we could not determine if they had action potentials that propagated the length of the muscle fibre (Fig. 1C and Rich & Pinter, 2001). After further depolarization, excitability was lost completely and no regenerative response could be obtained with a depolarizing stimulus (Fig. 1D).
Figure 1. Failure of action potentials in control muscle depolarized with high external potassium.

A-D, traces from control fibres depolarized with increasing external K+ concentrations. Each panel shows superimposed traces of action potentials following increasing current pulses. In A the resting potential was −87 mV; in B, C and D the resting potential had been depolarized to −65, −63 and −61 mV, respectively. A, five superimposed traces are shown, two of which are suprathreshold. With increasing current strength the action potential occurs earlier, but the peak potential of the action potential is unchanged. B, action potentials are still all or none, but the peak amplitude is decreased and threshold for action potential initiation occurs at a more depolarized potential. Despite the decrease in excitability such fibres were classified as excitable. In C, however, the action potential is no longer all or nothing. With increased current pulses the peak of the action potential increases (arrow). Fibres with graded actions potential amplitudes such as the one shown were classified as indeterminate. D, no action potential can be elicited despite current pulses that depolarized the fibre to close to −15 mV. Such fibres were classified as inexcitable.
To quantify the depolarization dependence of excitability, we classified muscle fibres as excitable, indeterminate and inexcitable as outlined previously (Rich & Pinter, 2001). Briefly, excitable fibres were defined by the presence of an action potential that was all or none and peaked at a potential above 10 mV. Indeterminate fibres exhibited graded action potentials that increased in amplitude with increasing stimulus strength and had action potential peaks between −5 and +10 mV. Inexcitable fibres showed only graded responses to intracellular current stimulation. The percentage of fibres in each category versus resting potential for control, SD and denervated muscle is shown in Fig.2. At resting potentials equal to or more hyperpolarized than −67 mV, all control fibres were excitable. In SD muscle, however, a significant percentage of fibres had reduced excitability at resting potentials equal to or more hyperpolarized than −67 mV. In denervated muscle, excitability was not reduced in a significant percentage of fibres until resting potentials equal to or more depolarized than −62 mV were achieved. In all three groups there is a clear correlation between depolarization of the resting potential and decreased excitability. However, the relationship between resting potential and excitability is shifted towards hyperpolarized potentials in SD fibres relative to control and denervated muscle. This shift in the relationship between resting potential and excitability explains why denervated fibres are excitable while SD fibres are inexcitable.
Figure 2. Resting potential versus excitability in control, SD and denervated muscle.
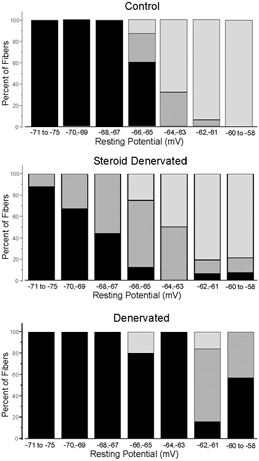
In each graph, the percentages of excitable, indeterminate and inexcitable fibres are shown at resting potentials ranging from −75 to −58 mV. Excitable fibres that can generate an action potential peaking at a potential greater than +10 mV are shown in black; indeterminate fibres that generate an action potential peaking at potentials of −5 to +10 mV are dark grey; inexcitable fibres with no action potential or action potentials peaking at less than −10 mV are light grey. In the top graph excitability is plotted for control muscle depolarized to various resting potentials with high K+. The middle graph plots excitability for SD muscle and the bottom graph plots excitability for denervated muscle. The number of fibres in each resting potential (mV) group is (control, SD, denervated): −75 to −71 (3, 8, 2); −70, −69 (10, 12, 5); −68, −67 (9, 9, 3); −66, −65 (15, 8, 5); −64, −63 (22, 10, 8); −62, −61 (16, 16, 6); −60 to −58 (8, 14, 7).
Voltage dependence of fast inactivation and excitability
We showed previously that a hyperpolarized shift of the voltage dependence of fast inactivation occurs in SD fibres with reduced excitability (Rich & Pinter, 2001). Since denervated fibres do not lose excitability at the same resting membrane potentials as do SD fibres, it seemed likely that steroid treatment is responsible for the shift in fast inactivation that causes reduced excitability. If true, then denervated muscle fibres with reduced excitability are less excitable because of their relatively depolarized resting potentials and should not have a shift in the voltage dependence of fast inactivation. To test this idea, we compared the voltage dependence of fast inactivation between SD inexcitable and indeterminate fibres with denervated inexcitable and indeterminate fibres.
To our surprise we found that in denervated fibres where action potentials were absent or were graded (inexcitable and indeterminate fibres respectively) there was a shift in the voltage dependence of fast inactivation towards more hyperpolarized potentials (Table 1, Fig.3). The degree to which the voltage dependence of fast inactivation was shifted, correlated with excitability in the same way that it did in SD fibres. In indeterminate denervated fibres the midpoint of fast inactivation was shifted by 6 mV (P < 0.01); the same degree that fast inactivation is shifted in SD indeterminate fibres. In the two denervated inexcitable fibres that we sampled, the midpoint of fast inactivation was shifted by 13 mV; very similar to the 11 mV shift in fast inactivation that occurs in SD inexcitable fibres. This suggests that a hyperpolarized shift of the voltage dependence of fast inactivation is an important contributor to reduced excitability in both denervated and SD fibres. Furthermore, these findings suggest that steroids do not cause a shift in fast inactivation that is unique to SD muscle. Rather, steroid treatment increases the percentage of fibres in which the voltage of fast inactivation is shifted. In denervated muscle only a minority of fibres have a shifted voltage dependence of fast inactivation while in SD muscle the majority of fibres have a shifted voltage dependence of fast inactivation.
Table 1.
Resting potential and voltage dependence of fast inactivation in denervated and SD muscle
| Den. excit. (n = 18) | Den. indet. (n = 6) | Den. inex. (n = 2) | SD excit. (n = 10) | SD indet. (n = 12) | SD inex. (n = 22) | |
|---|---|---|---|---|---|---|
| RP (mV) | −65.0 ± 0.9 | −61.1 ± 0.4 | −64.0 | −68.8 ± 1.4 | −65.3 ± 1.0 | −61.4 ± 0.5 |
| Fast mid. (mV) | −71.6 ± 0.6 | −77.6 ± 1.0 | −84.6 | −72.0 ± 1.5 | −78.8 ± 2.3 | −83.2 ± 1.2 |
| Slope (mV) | 5.7 ± 0.2 | 5.9 ± 0.3 | 5.7 | 5.2 ± 0.2 | 5.6 ± 0.2 | 5.3 ± 0.2 |
The values for resting potential and the voltage dependence of Na+ channel fast inactivation are shown for SD and denervated fibres. RP, resting potential; Fast mid., the midpoint of fast inactivation; Slope, the slope of fast inactivation; Den., denervated; Excit., excitable; Indet., indeterminate; Inex., inexcitable. Values shown represent the means ±s.e.m. No standard error values are given for denervated inexcitable fibres since only two denervated inexcitable fibres were sampled.
Figure 3. The average voltage dependence of fast inactivation in control, denervated and SD muscle fibres.
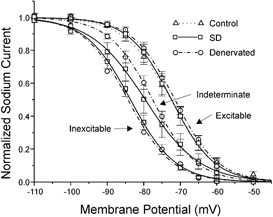
The normalized Na+ current evoked by a step to −20 mV is plotted versus the 50 ms prepulse potential for control, denervated and SD fibres. Both denervated and SD fibres have been categorized into 3 groups based on excitability (excitable, indeterminate and inexcitable). All control fibres are excitable. The inactivation curves for control, denervated excitable and SD excitable are very nearly superimposed and have the most positive voltage dependence. The inactivation curves for indeterminate denervated and SD fibres are shifted towards more hyperpolarized potentials relative to the curves for control and excitable fibres. The curves for denervated and SD indeterminate fibres are nearly superimposed in the voltage range of the resting potentials of these fibres (−60 to −70 mV). The inactivation curves for inexcitable denervated and SD fibres have the most hyperpolarized voltage dependence and are nearly identical. For all curves except for denervated inexcitable, error bars represent the standard error of the mean. No error bars are shown for denervated inexcitable fibres since only 2 such fibres were studied. The 3 curves for SD fibres are represented by open squares and continuous lines, the 3 curves for denervated fibres are represented by open circles and dashed-dotted lines, and the control curve is represented by open triangles and a dotted line.
Voltage dependence of slow inactivation is decreased in SD inexcitable muscle
Although the shift in the voltage dependence of fast inactivation contributes to an increase in the percentage of Na+ channels inactivated at the resting potential in SD fibres, it is also possible that an increase in slow inactivation of Na+ channels plays an important role. Since SD fibres remain at their resting potential for prolonged periods of time, both fast and slow inactivation must be included in any estimate of total Na+ channel inactivation. Slow inactivation of Na+ channels would increase if there was a shift in the voltage dependence of slow inactivation towards more hyperpolarized potentials similar to that which occurs for fast inactivation. To examine this possibility, we compared the voltage dependence of slow inactivation between SD and control fibres. No change in the midpoint of slow inactivation was observed in any category of SD fibres compared with control muscle (Fig.4, Table 2). However, the slope of the voltage dependence of slow inactivation was significantly lower in inexcitable and SD indeterminate muscle relative to control (P < 0.01vs. control for SD inexcitable, P = 0.02 vs. control for SD indeterminate). The decrease in the slope of the voltage dependence of slow inactivation in SD fibres was unexpected, and would tend to lessen the percentage of Na+ channels that are slow inactivated at the resting potential of these fibres (−60 to −68 mV). Thus, inexcitable SD fibres have reduced excitability despite a change in the voltage dependence of slow inactivation that increases excitability at the resting potential.
Figure 4. The average voltage dependence of slow inactivation in control and SD muscle.

The normalized Na+ current evoked by a step to −20 mV is plotted versus the holding potential for control and SD fibres. There is little difference in the membrane potential at which the normalized Na+ current is half-maximal between the 4 groups. However, there is a steeper voltage dependence of slow inactivation in control and SD excitable fibres relative to inexcitable and SD indeterminate fibres (Table 2). Because of the shallower voltage dependence of slow inactivation, inexcitable and SD indeterminate fibres have less slow inactivation at membrane potentials more positive than −80 mV. Error bars represent the s.e.m..
Table 2.
Voltage dependence of slow inactivation and activation in control and SD muscle
| Control | Excitable | Indeterminate | Inexcitable | |
|---|---|---|---|---|
| Midpoint of slow inactivation (mV) | −87.1 ± 2.7 | −91.5 ± 4.6 | −85.3 ± 5.6 | −88.4 ± 4.8 |
| Slope of slow inactivation (mV) | 9.8 ± 0.7 | 11.8 ± 0.7 | 14.6 ± 2.4 | 16.2 ± 0.8 |
| Midpoint of activation (mV) | −38.9 ± 1.4 | −37.5 ± 1.9 | −45.8 ± 1.9 | −51.4 ± 0.8 |
| Slope of activation (mV) | 6.6 ± 0.3 | 6.8 ± 0.2 | 6.6 ± 0.6 | 6.4 ± 0.3 |
The values for the midpoint of Na+ channel slow inactivation and activation are shown for control, inexcitable, indeterminate and SD excitable fibres. For measures of slow inactivation the number of control fibres = 10, SD excitable = 4, SD indeterminate = 4, SD inexcitable = 9. For measures of activation the number of control fibres = 10, SD excitable = 9, SD indeterminate = 10, SD inexcitable =17. All values shown represent the means ±s.e.m.
Fast and slow Na+ channel inactivation in SD and control fibres
To determine the relative importance of fast and slow inactivation in decreasing excitability we calculated the contribution of both fast and slow inactivation at the resting potential in SD and control fibres. In order to make a more meaningful comparison between SD and control fibres, we also included calculations of the percentage of Na+ channels inactivated at a resting potential of −64 mV in control fibres. This is the resting potential where control fibres become inexcitable and we wished to determine whether fast or slow inactivation was more important in the loss of excitability of control fibres.
To determine total Na+ channel inactivation the following measurements were made. First the maximal Na+ conductance was determined in each fibre by measuring the Na+ current density after holding at −130 mV to remove both fast and slow inactivation (see Methods). The voltage dependences of both fast and slow inactivation were then independently measured in each fibre. The percentage of Na+ channels inactivated at the resting potential (for SD and control fibres) or −64 mV (control fibres) was then calculated following fast inactivation, slow inactivation or both, using inactivation curves that were plotted for each fibre as shown in Fig. 5. For our analysis of both fast and slow inactivation we assumed the two processes were independent (Ruff, 1996a; see, however, Featherstone et al. 1996).
Figure 5. Determination of the voltage dependence of fast, slow and total inactivation in a control muscle fibre.

The curve representing fast inactivation is plotted using circles and the curve representing slow inactivation is plotted using squares. Both the fast and slow inactivation curves are plotted using continuous lines. When the percentage of Na+ channels inactivated from fast and slow inactivation is multiplied, the resultant curve represents total Na+ channel inactivation (dashed line). The 3 curves obtained can then be used to determine the percentage of Na+ channels inactivated at the resting potential (−86 mV in the fibre shown, ↑) or at −64 mV (↓).
Slow inactivation is the predominant cause of Na+ channel inactivation in control fibres both at the resting potential and when fibres are depolarized to −64 mV with elevated external K+ (Table 3). Similarly slow inactivation is responsible for the majority of inactivation of Na+ channels at the resting potential of SD excitable fibres. In contrast, in SD inexcitable fibres fast inactivation predominates at the resting potential. The switch from predominantly slow inactivation to predominantly fast inactivation in SD inexcitable fibres is the result of both an increase in fast inactivation (due to the hyperpolarized voltage dependence of fast inactivation) and a reduction in slow inactivation (due to the shallow voltage dependence) below the level expected at a resting potential of −61 mV in either control or SD excitable fibres.
Table 3.
Na+ conductance remaining following fast and slow inactivation
| Conductance | Control n = 10 | Control −64 mV n = 10 | SD excitable n = 4 | SD inexcitable n = 9 |
|---|---|---|---|---|
| RP(mV) | −82.5 ± 1.2 | −64 | −71.0 ± 1.4 | −61.2 ± 0.4 |
| % slow inactivated | 64.2 ± 4.8 | 91.1 ± 2.1 | 84.0 ± 6.2 | 81.7 ± 5.7 |
| % fast inactivated | 16.2 ± 2.9 | 79.9 ± 4.2 | 60.5 ± 7.9 | 97.3 ± 0.7 |
| Total % inactivated | 69.5 ± 4.4 | 98.1 ± 0.7 | 92.0 ± 4.5 | 99.5 ± 0.2 |
The mean available Na+ conductance at the resting potential of control fibres, control fibres depolarized to −64 mV with high external K+, SD excitable and SD inexcitable fibres at their resting potentials. RP, resting potential. The final row gives the percentage of Na+ channels fast or slow inactivated.
Voltage dependence of activation is shifted by −15 mV in SD inexcitable muscle
We showed previously that when all inactivation is removed by use of prolonged hyperpolarized (−130 mV) holding potentials, maximum Na+ currents evoked by steps to −20 mV were reduced nearly twofold in all categories of SD fibres compared with normal fibres (Rich & Pinter, 2001). Consistent with that finding, in this study the calculated maximum Na+ conductance available with identical holding and step voltage conditions was close to twice as large in control fibres (578 ± 36 mS; n = 10) relative to SD excitable (222 ± 17 mS; n = 4) and inexcitable fibres (309 ± 54 mS; n = 9). The twofold reduction in maximum Na+ current is a contributor to reduced excitability in SD fibres. One possible cause of this decrease in Na+ current is a depolarizing shift in the voltage dependence of activation.
To determine whether the voltage dependence of activation was shifted, we measured the voltage dependence of Na+ current activation in control fibres and SD fibres. Included in the SD fibre sample were 17 inexcitable, 10 indeterminate and 9 excitable fibres. The results of this analysis are shown in Fig. 6. In both the current–voltage (I–V) plot (Fig. 6 B) and the Boltzmann fit of the activation curve (Fig. 6 C), an average hyperpolarized shift of almost 15 mV was observed in the midpoint of the voltage dependence of activation in SD inexcitable fibres relative to SD excitable and control fibres (P < 0.01; Student's t test; Table 2). The shift in the activation midpoint in SD inexcitable fibres was less relative to indeterminate fibres (7 mV), but is still statistically significant (P < 0.01). The activation midpoint of SD excitable fibres was not statistically different from control muscle (P = 0.46).
Figure 6. The average voltage dependence of Na+ channel activation in control and SD muscle.

A, superimposed current traces evoked by stepping from −130 mV to voltages of −70 to −10 mV in 10 mV increments in a control fibre. The steps to −70 and −60 mV do not elicit an inward Na+ current. Steps from −50 to −20 mV elicit inward currents that increase in amplitude. With the final step to −10 mV, the inward current begins to decrease. Following the inward Na+ current there is an outward K+ current. The amplitude of this outward current continues to increase as the voltage steps become more positive. B, the normalized I–V relationship is plotted versus membrane potential for control and 3 categories of SD fibres. SD inexcitable fibres have inward currents that peak on average at membrane potentials between −30 and −40 mV. Peak current amplitude in indeterminate fibres occurred at −30 mV while SD excitable and control fibres had inward Na+ currents that peaked at −20 mV. C, the normalized Na+ conductance calculated from the data in B assuming a reversal potential of +45 mV is plotted versus membrane potential. The midpoint of activation of SD inexcitable fibres is shifted towards more negative voltages by almost 15 mV relative to control and SD excitable fibres (P < 0.01; Table 1). Error bars represent the s.e.m.
The hyperpolarizing shift of the voltage dependence of activation might increase excitability of affected SD fibres since it decreases the depolarization necessary to activate Na+ channels. However, it is also possible that the hyperpolarizing shift in activation might indirectly contribute to inexcitability by increasing the number of Na+ channels that are open at the resting potential. If a sufficient number of Na+ channels are open at the resting potential, a steady-state Na+ current would be generated that might cause depolarization and thus increase the percentage of inactivated Na+ channels in affected fibres. To test this possibility, we measured muscle fibre resting potentials in two SD muscles before and after a high dose of TTX (300 μm) that blocks the majority of both Nav1.4 and Nav1.5 Na+ channels (Hille, 1992), to determine whether application of TTX caused hyperpolarization of the resting potential. In both muscles the majority of fibres were inexcitable prior to application of TTX (6/10 in muscle 1, 3/4 in muscle 2). In muscle 1 the average resting potential pre-TTX was −62.1 ± 1.2 (n= 15) vs. 59.9 ± 1.5 mV post TTX (n= 17). Results from the second muscle were identical. Since resting potentials were not hyperpolarized in either muscle following application of TTX, it appears very unlikely that enough Na+ channels are open at the resting potential of SD fibres to cause any significant depolarization.
Correlated changes in Na+ channel properties in SD muscle
During determination of the voltage dependence of fast inactivation, activation and slow inactivation in control and SD muscle, it became evident that changes in these properties were correlated. Examples of these correlations can be seen in the relationship between the voltage dependence of activation and fast inactivation (Fig. 7A), the correlation between the voltage dependences of fast inactivation and slow inactivation (Fig. 7B) and the correlation between the voltage dependence of activation and slow inactivation (Fig. 7C). In all three cases the correlation was statistically significant (P < 0.01). The correlations shown in Fig. 7 include all three categories of SD fibres as well as control fibres. It appeared from the plots that the correlations existed primarily between groups of fibres rather than within groups. This impression was confirmed when we could find no consistent correlation within groups for the relationship between the voltage dependence of activation and fast inactivation. Not enough data were available to examine correlations between slow inactivation and other parameters within groups. The finding that all three parameters of Na+ channel gating that we examined changed in concert strongly suggests there is a single underlying cause of all the changes we found in the voltage dependence of Na+ channel gating.
Figure 7. Correlations between Na+ channel gating properties.
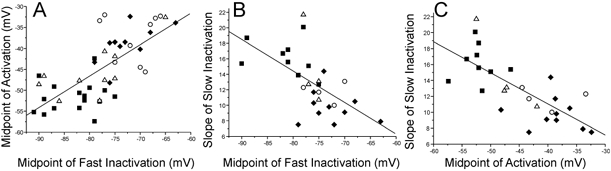
A-C, plots of correlations between activation, fast inactivation and slow inactivation in SD and control muscle fibres. A, the correlation between more positive voltage dependencies of activation and fast inactivation is shown (R= 0.72, P < 0.01). SD inexcitable and indeterminate fibres tend to have both more negative midpoints of both activation and fast inactivation than do SD excitable and control fibres. B, the correlation between a more positive voltage dependence of fast inactivation and a steeper voltage dependence of slow inactivation is shown (R=−0.61, P < 0.01). C, the correlation between a more positive voltage dependence of activation and a steeper voltage dependence of slow inactivation is shown (R=−0.74, P < 0.01). All fits are linear. More points are present in A than in B and C since fibres were included in which the voltage dependence of slow inactivation was not measured. ▪, SD inexcitable fibres; ▵, SD indeterminate fibres; ○, SD excitable fibres; ♦, control fibres.
DISCUSSION
A stereotyped pattern of changes in Na+ channel properties occurs in a subset of muscle fibres in the animal model of critical illness myopathy. The net result of these changes is that muscle fibres become inexcitable. The change which is most important in causing inexcitability of affected fibres is a hyperpolarizing shift in the voltage dependence of fast inactivation of Na+ channels. Depolarization of the resting potential also makes a contribution, but does not cause inexcitability by itself in control or denervated fibres not treated with corticosteroids. Changes in the voltage dependence of Na+ channel slow inactivation and activation also occur, but these changes increase rather than decrease excitability. These results highlight the unique importance of Na+ channel fast inactivation in causing inexcitability of SD fibres.
Resting membrane potential, fast inactivation and excitability
In order to gauge the relative importance of membrane depolarization and the voltage dependence of fast inactivation in causing inexcitability among SD fibres, we determined excitability in both control and denervated muscle fibres depolarized to the same degree as SD fibres. We found that in SD muscle, excitability was reduced at less depolarized resting potentials than in control fibres. Thus, although depolarization of the resting potential is clearly correlated with reduced excitability within each group, the resting potential correlated poorly with excitability when all three groups were considered together.
In contrast to the loose correlation between resting potential and excitability, in both denervated and SD fibres, a shift in the voltage dependence of fast inactivation was closely correlated with loss of excitability. Therefore it is the high percentage of SD fibres with a shift in the voltage dependence of fast inactivation that explains the increased frequency of SD fibres with reduced excitability. In denervated muscle fibres in which the voltage dependence of fast inactivation was normal, fibres retained excitability until the resting potential was quite depolarized. It is not clear what causes the shift towards more depolarized potentials in the relationship between resting potential and excitability in denervated fibres. The average voltage dependence of fast inactivation in denervated excitable fibres was similar to that in control and SD excitable fibres. Thus, increased excitability of denervated fibres does not appear to be due to a shift in the voltage dependence of fast inactivation towards more depolarized potentials. One factor contributing to increased excitability of denervated fibres is an increase in specific membrane resistance (Camerino & Bryant, 1976; Lorkovic & Tomanek, 1977; Rich et al. 1998). It is also possible that a reduction in the voltage dependence of slow inactivation (as is seen in SD inexcitable fibres) occurs in denervated fibres.
Slow inactivation and excitability
In this study we considered the possible contribution of slow inactivation of Na+ channels to inexcitability among SD fibres. Previous studies have yielded inconsistent information about the voltage dependence of slow inactivation of the Na+ channel isoform expressed in adult skeletal muscle (Nav1.4). In some studies, very negative midpoints for slow inactivation were found (Ruff et al. 1987; Simoncini & Stuhmer, 1987; Ruff, 1996a, 1999) while in other studies more positive midpoints have been reported (Cummins & Sigworth, 1996; Featherstone et al. 1996; Richmond et al. 1998; Bendahhou et al. 2002). In the present study, we found that in control fibres depolarized with external K+ and in SD excitable fibres, slow inactivation is the principle cause of Na+ channel inactivation. Although slow inactivation is less prominent in SD inexcitable fibres, it remains an important contributor to reduced excitability. For example, if the contribution of slow inactivation is ignored and only fast inactivation is considered, estimates of Na+ conductance at the resting potential are fourfold higher in SD inexcitable fibres. Thus, if slow inactivation was relieved, some SD inexcitable fibres might regain excitability. Despite the contribution of slow inactivation to inexcitability, the shallower slope of the voltage dependence of slow inactivation we found in SD inexcitable fibres tends to decrease the percentage of channels slow inactivated at the resting potential. Thus the change in the voltage dependence of slow inactivation in SD inexcitable fibres increases excitability.
The cause of reduced maximal Na+ current in SD fibres
We previously found that Na+ current density was reduced in SD fibres (Rich & Pinter, 2001). In the present study, we sought to determine whether a change in voltage dependence of Na+ channel activation underlies this decrease. However, we found that the voltage dependence of activation is shifted toward hyperpolarizing potentials (opposite of a shift that would reduce Na+ currents) and is thus not a factor contributing to reduction of Na+ current density. The shift in the voltage dependence of activation increases excitability of SD inexcitable fibres since it reduces the depolarization necessary to activate Na+ channels.
Another possible cause of a decrease in Na+ current density with inactivation removed is a reduction in Na+ equilibrium potential since this would reduce the driving force for Na+ current flow. In the present study we did not attempt to measure the Na+ equilibrium potential. However, it is unlikely that the twofold reduction in Na+ current density observed in this study and in our earlier study (Rich & Pinter, 2001) can be caused exclusively by a reduction in the Na+ equilibrium potential. To achieve this extent of current decrease, a 32 mV shift from the assumed normal value of +45 mV (Almers et al. 1984; Ruff, 1999) would be required. This level of change appears unlikely since over half of SD excitable fibres have action potentials that peak between +20 and +30 mV. These data suggest that the Na+ equilibrium potential in SD excitable fibres is not likely to be less than +30 mV. It remains possible that a change in the Na+ equilibrium potential occurs in SD inexcitable fibres. Other possible causes of a decrease in maximal Na+ current density include either a reduction in Na+ channel density or a reduction in single channel conductance. We have previously found that the density of Nav1.4 Na+ channels is reduced in SD muscle (Rich et al. 1998).
The role of denervation and steroid treatment in inexcitability
The primary effect of denervation in reducing excitability of SD muscle appears to be depolarization of the resting potential. The resting membrane potential of all SD fibres when averaged is similar to that of denervated fibres not treated with steroids (Rich et al. 1998). The cause of membrane depolarization following denervation is not well understood (for review see McArdle, 1983), but we and others have shown that corticosteroids do not cause further membrane depolarization of denervated muscle (Ruff et al. 1982; Rich et al. 1998). The main effect of corticosteroid treatment is to reduce the average excitability of fibres at a given resting potential by increasing the percentage of fibres in which the voltage dependence of fast inactivation is shifted in the hyperpolarizing direction. Because a small percentage of denervated fibres also exhibit this same shift in fast inactivation, it appears that corticosteroid treatment does not cause the emergence of a new phenomenon that underlies inexcitability. Rather, corticosteroid treatment seems to simply increase the percentage of fibres that exhibit this change. Our data suggests that inexcitability of muscle following denervation and corticosteroid treatment does not represent a unique disease state, but instead represents an exaggeration of the response to denervation. Our findings suggest that blockade of muscle activity (which induces denervation like changes in skeletal muscle) (Berg & Hall, 1975) in patients may cause most of the changes that underlie critical illness myopathy, but only in a small subset of muscle fibres. The role of corticosteroid treatment may be to increase the percentage of fibres affected to the point where the effect becomes clinically significant. How steroids do this remains unclear, but one possibility that is discussed below is that steroids alter muscle gene expression following denervation.
Expression of the Nav1.5 Na+ channel isoform in SD inexcitable fibres?
We have demonstrated that the symptoms of critical illness myopathy can be replicated by combining denervation and corticosteroid treatment in genetically normal rats. This suggests that the disorder in humans may be due to abnormal regulation of genetically normal channels, but the mechanisms that lead to changes in the voltage dependence of Na+ channel gating remain unclear. Possible causes of the shifts in the voltage dependence of Na+ channel gating include post-translational modification(s) of Na+ channels through processes such as phosphorylation or glycosylation (Bendahhou et al. 1995; Bennett et al. 1997; Zhang et al. 1999; Tyrrell et al. 2001).
An alternative mechanism that is consistent with our data involves the Nav1.5 Na+ channel isoform. In normal muscle fibres, only the adult skeletal muscle Na+ channel isoform is expressed (Nav1.4) (Yang et al. 1991). In SD muscle, however, mRNA for both the adult and an embryonic Na+ channel isoform (Nav1.5) is present at high levels (Rich et al. 1999). The voltage dependence of both activation and fast inactivation of the Nav1.5 Na+ channel isoform is shifted to more negative potentials relative to the adult isoform (Wang et al. 1996). Moreover, the Nav1.5 isoform has a shallower voltage dependence of slow inactivation than the Nav1.4 isoform (Richmond et al. 1998). These differences correspond to the differences we have observed between normal and SD inexcitable muscle fibres and thus may reflect re-expression of the Nav1.5 isoform and the resulting mixture of channel isoforms. Different levels of Nav1.5 isoform expression may explain the range of excitability among individual SD fibres. The Nav1.5 isoform is also re-expressed at lower levels following denervation of muscle in the absence of steroid treatment, and this may explain our observations of reduced excitability in a small percentage of denervated muscle fibres. The specific action of steroid treatment of denervated muscle may be to increase the percentage of Nav1.5 channels present in the membrane beyond that seen following denervation alone (Rich et al. 1999) and to thus increase the percentage of fibres that exhibit reduced inexcitability.
Acknowledgments
We would like to thank Kathrin Engisch for helpful comments. This work was supported by National Institutes of Health grant NS-40826 (M.M.R.).
REFERENCES
- Almers W, Roberts WM, Ruff RL. Voltage clamp of rat and human skeletal muscle: measurements with an improved loose-patch technique. J Physiol. 1984;347:751–768. doi: 10.1113/jphysiol.1984.sp015094. [DOI] [PMC free article] [PubMed] [Google Scholar]
- Bendahhou S, Cummins TR, Kula RW, Fu YH, Ptacek LJ. Impairment of slow inactivation as a common mechanism for periodic paralysis in DIIS4-S5. Neurology. 2002;58:1266–1272. doi: 10.1212/wnl.58.8.1266. [DOI] [PubMed] [Google Scholar]
- Bendahhou S, Cummins TR, Potts JF, Tong J, Agnew WS. Serine-1321-independent regulation of the mu 1 adult skeletal muscle Na+ channel by protein kinase C. Proc Natl Acad Sci U S A. 1995;92:12003–12007. doi: 10.1073/pnas.92.26.12003. [DOI] [PMC free article] [PubMed] [Google Scholar]
- Bennett E, Urcan MS, Tinkle SS, Koszowski AG, Levinson SR. Contribution of sialic acid to the voltage dependence of sodium channel gating. A possible electrostatic mechanism. J Gen Physiol. 1997;109:327–343. doi: 10.1085/jgp.109.3.327. [DOI] [PMC free article] [PubMed] [Google Scholar]
- Berg DK, Hall ZW. Increased extrajunctional acetylcholine sensitivity produced by chronic post-synaptic neuromuscular blockade. J Physiol. 1975;244:659–676. doi: 10.1113/jphysiol.1975.sp010818. [DOI] [PMC free article] [PubMed] [Google Scholar]
- Camerino D, Bryant SH. Effects of denervation and colchicine treatment on the chloride conductance of rat skeletal muscle fibers. J Neurobiol. 1976;7:221–228. doi: 10.1002/neu.480070305. [DOI] [PubMed] [Google Scholar]
- Cummins TR, Sigworth FJ. Impaired slow inactivation in mutant sodium channels. Biophys J. 1996;71:227–236. doi: 10.1016/S0006-3495(96)79219-6. [DOI] [PMC free article] [PubMed] [Google Scholar]
- Featherstone DE, Richmond JE, Ruben PC. Interaction between fast and slow inactivation in Skm1 sodium channels. Biophys J. 1996;71:3098–3109. doi: 10.1016/S0006-3495(96)79504-8. [DOI] [PMC free article] [PubMed] [Google Scholar]
- Hilber K, Sandtner W, Kudlacek O, Glaaser IW, Weisz E, Kyle JW, French RJ, Fozzard HA, Dudley SC, Todt H. The selectivity filter of the voltage-gated sodium channel is involved in channel activation. J Biol Chem. 2001;276:27831–27839. doi: 10.1074/jbc.M101933200. [DOI] [PubMed] [Google Scholar]
- Hille B. Ionic Channels of Excitable Membranes. Sunderland, MA, USA: Sinauer Associates; 1992. [Google Scholar]
- Lorkovic H, Tomanek RJ. Potassium and chloride conductances in normal and denervated rat muscles. Am J Physiol. 1977;232:C109–114. doi: 10.1152/ajpcell.1977.232.3.C109. [DOI] [PubMed] [Google Scholar]
- McArdle JJ. Molecular aspects of the trophic influence of nerve on muscle. Prog Neurobiol. 1983;21:135–198. doi: 10.1016/0301-0082(83)90001-1. [DOI] [PubMed] [Google Scholar]
- Noble D, Stein RB. The threshold conditions for intitiation of action potentials by excitable cells. J Physiol. 1966;195:185–214. doi: 10.1113/jphysiol.1966.sp008079. [DOI] [PMC free article] [PubMed] [Google Scholar]
- Rich MM, Bird SJ, Raps EC, McCluskey LF, Teener JW. Direct muscle stimulation in acute quadriplegic myopathy. Muscle Nerve. 1997;20:665–673. doi: 10.1002/(sici)1097-4598(199706)20:6<665::aid-mus2>3.0.co;2-6. [DOI] [PubMed] [Google Scholar]
- Rich MM, Kraner SD, Barchi RL. Altered gene expression in steroid-treated denervated muscle. Neurobiol Dis. 1999;6:515–522. doi: 10.1006/nbdi.1999.0257. [DOI] [PubMed] [Google Scholar]
- Rich MM, Pinter MJ. Sodium channel inactivation in an animal model of acute quadriplegic myopathy. Ann Neurol. 2001;50:26–33. doi: 10.1002/ana.1016. [DOI] [PubMed] [Google Scholar]
- Rich MM, Pinter MJ, Kraner SD, Barchi RL. Loss of electrical excitability in an animal model of acute quadriplegic myopathy. Ann Neurol. 1998;43:171–179. doi: 10.1002/ana.410430207. [DOI] [PubMed] [Google Scholar]
- Rich MM, Teener JW, Raps EC, Schotland DL, Bird SJ. Muscle is electrically inexcitable in acute quadriplegic myopathy. Neurology. 1996;46:731–736. doi: 10.1212/wnl.46.3.731. [DOI] [PubMed] [Google Scholar]
- Richmond JE, Featherstone DE, Hartmann HA, Ruben PC. Slow inactivation in human cardiac sodium channels. Biophys J. 1998;74:2945–2952. doi: 10.1016/S0006-3495(98)78001-4. [DOI] [PMC free article] [PubMed] [Google Scholar]
- Roberts WM. Sodium channels near end-plates and nuclei of snake skeletal muscle. J Physiol. 1987;388:213–232. doi: 10.1113/jphysiol.1987.sp016611. [DOI] [PMC free article] [PubMed] [Google Scholar]
- Ruff RL. Single-channel basis of slow inactivation of Na+ channels in rat skeletal muscle. Am J Physiol. 1996a;271:C971–981. doi: 10.1152/ajpcell.1996.271.3.C971. [DOI] [PubMed] [Google Scholar]
- Ruff RL. Sodium channel slow inactivation and the distribution of sodium channels on skeletal muscle fibres enable the performance properties of different skeletal muscle fibre types. Acta Physiol Scand. 1996b;156:159–168. doi: 10.1046/j.1365-201X.1996.189000.x. [DOI] [PubMed] [Google Scholar]
- Ruff RL. Effects of temperature on slow and fast inactivation of rat skeletal muscle Na(+) channels. Am J Physiol. 1999;277:C937–947. doi: 10.1152/ajpcell.1999.277.5.C937. [DOI] [PubMed] [Google Scholar]
- Ruff RL, Lennon VA. End-plate voltage-gated sodium channels are lost in clinical and experimental myasthenia gravis. Ann Neurol. 1998;43:370–379. doi: 10.1002/ana.410430315. [DOI] [PubMed] [Google Scholar]
- Ruff RL, Simoncini L, Stuhmer W. Comparison between slow sodium channel inactivation in rat slow- and fast-twitch muscle. J Physiol. 1987;383:339–348. doi: 10.1113/jphysiol.1987.sp016412. [DOI] [PMC free article] [PubMed] [Google Scholar]
- Ruff RL, Simoncini L, Stuhmer W. Slow sodium channel inactivation in mammalian muscle: a possible role in regulating excitability. Muscle Nerve. 1988;11:502–510. doi: 10.1002/mus.880110514. [DOI] [PubMed] [Google Scholar]
- Ruff RL, Stuhmer W, Almers W. Effect of glucocorticoid treatment on the excitability of rat skeletal muscle. Pflugers Arch. 1982;395:132–137. doi: 10.1007/BF00584726. [DOI] [PubMed] [Google Scholar]
- Simoncini L, Stuhmer W. Slow sodium channel inactivation in rat fast-twitch muscle. J Physiol. 1987;383:327–337. doi: 10.1113/jphysiol.1987.sp016411. [DOI] [PMC free article] [PubMed] [Google Scholar]
- Todt H, Dudley SC, Jr, Kyle JW, French RJ, Fozzard HA. Ultra-slow inactivation in mu1 Na+ channels is produced by a structural rearrangement of the outer vestibule. Biophys J. 1999;76:1335–1345. doi: 10.1016/S0006-3495(99)77296-6. [DOI] [PMC free article] [PubMed] [Google Scholar]
- Tyrrell L, Renganathan M, Dib-Hajj SD, Waxman SG. Glycosylation alters steady-state inactivation of sodium channel Nav1. 9/NaN in dorsal root ganglion neurons and is developmentally regulated. J Neurosci. 2001;21:9629–9637. doi: 10.1523/JNEUROSCI.21-24-09629.2001. [DOI] [PMC free article] [PubMed] [Google Scholar]
- Wang DW, George AL, Jr, Bennett PB. Comparison of heterologously expressed human cardiac and skeletal muscle sodium channels. Biophys J. 1996;70:238–245. doi: 10.1016/S0006-3495(96)79566-8. [DOI] [PMC free article] [PubMed] [Google Scholar]
- Yang JS, Sladky JT, Kallen RG, Barchi RL. TTX-sensitive and TTX-insensitive sodium channel mRNA transcripts are independently regulated in adult skeletal muscle after denervation. Neuron. 1991;7:421–427. doi: 10.1016/0896-6273(91)90294-a. [DOI] [PubMed] [Google Scholar]
- Zhang Y, Hartmann HA, Satin J. Glycosylation influences voltage-dependent gating of cardiac and skeletal muscle sodium channels. J Membr Biol. 1999;171:195–207. doi: 10.1007/s002329900571. [DOI] [PubMed] [Google Scholar]