

Abstract
Developmental changes in electrophysiological membrane properties of mouse cochlear inner hair cells (IHCs) were studied from just after terminal differentiation up to functional maturity. As early as embryonic day 14.5 (E14.5) newly differentiated IHCs express a very small outward K+ current that is largely insensitive to 4-aminopyridine (4-AP). One day later the inward rectifier, IK1, is first observed. These immature cells initially exhibit only slow graded voltage responses under current clamp. From E17.5 spontaneous action potentials occur. During the first week of postnatal development, the outward K+ current steadily increases in size and a progressively larger fraction of the current is sensitive to 4-AP. During the second postnatal week, the activation of the 4-AP-sensitive current, by now contributing about half of the outward K+ current, shifts in the hyperpolarizing direction. Together with an increase in size of IK1, this hyperpolarizes the cell, thus inhibiting the spontaneous spike activity, although spikes could still be evoked upon depolarizing current injection. Starting at about the onset of hearing (postnatal day 12, P12) immature IHCs make the final steps towards fully functional sensory receptors with fast graded voltage responses. This is achieved mainly by the expression of the large-conductance Ca2+-activated K+ current IK,f, but also of a current indistinguishable from the negatively activating IK,n previously described in mature outer hair cells (OHCs). The 4-AP-sensitive current continues to increase after the onset of hearing to form the major part of the mature delayed rectifier, IK,s. By P20 IHCs appear mature in terms of their complement of K+ conductances.
Inner hair cells (IHCs) are the primary sensory receptors in the mammalian cochlea. They are contacted by the vast majority (90–95 %) of the afferent fibres of the auditory nerve and in contrast to the 5–10 % of afferents contacting the outer hair cells (OHCs) these are myelinated (Ryugo, 1992). The IHCs are thus optimally configured for signalling the reception of sound to the brain. The afferent fibres contacting the IHCs are able to preserve the periodicity of an auditory stimulus in their firing pattern up to several kiloherz (phase locking), which requires the IHC to have a fast membrane time constant. The large and fast Ca2+-activated K+ current, IK,f, is expressed in IHCs at the onset of hearing in mice (around 10–12 days after birth) to make this possible (Kros et al. 1998). Before the onset of hearing IHCs can fire spontaneous or evoked action potentials, mainly due to the interplay of an inward Ca2+ current and the slowly activating delayed rectifier IK,neo (Kros et al. 1998). These action potentials might conceivably control the maturation of synaptic connections in the immature auditory system by initiating propagated activity, analogous to events in the immature retina (Shatz & Stryker, 1988; Maffei & Galli-Resta, 1990; Meister et al. 1991) which occur well before the photoreceptors become responsive to light (Ratto et al. 1991). This is plausible as mouse IHCs are already likely to release neurotransmitter from birth (Beutner & Moser, 2001), and considerable remodelling of auditory nerve fibre connections takes place between E18, when they first contact the IHCs, and the onset of hearing about 14 days later (Pujol et al. 1998).
Recent findings have shown developmental changes in the expression of a number of ionic currents in IHCs between birth and the onset of hearing: the inward rectifier IK1 (Marcotti et al. 1999) and the L-type Ca2+ current (Beutner & Moser, 2001). This suggests that the nature of the spiking activity might change over the same period. To gain more insight into the biophysical basis of this potentially important phenomenon we set out to investigate developmental changes in delayed rectifier K+ currents expressed by IHCs from when the cells can first be recognized just after terminal mitosis at E14 (Ruben, 1967) until maturity. We use the terms IK,emb and IK,neo to refer to the total delayed rectifier currents during embryonic and postnatal development up to the onset of hearing, and IK,s to refer to the classical delayed rectifier of functionally mature IHCs. In this study we found that each of these currents is composed of a varying mixture of at least two distinct conductances, one that is sensitive to block by 4-AP and one that is not. The changes in these conductances during development are described. We also report a contribution of IK,n, a slow delayed rectifier K+ current with an unusually hyperpolarized activation range hitherto only described in OHCs (Housley & Ashmore, 1992; Mammano & Ashmore, 1996; Marcotti & Kros, 1999), to maturation of IHCs.
METHODS
Tissue preparation
IHCs (n = 374) of CD-1 mice (Swiss CD-1; Charles Rivers, Margate, Kent, UK) were studied in acutely dissected organs of Corti from embryonic day 14.5 (E14.5) to postnatal day 30 (P30) where the day of birth (P0) corresponds to E19.5. For embryonic experiments only, mice were paired overnight and checked for vaginal plugs the following morning. Assuming ovulation occurs midway through the dark cycle, the mid-point of the light cycle of the day following mating is considered to be E0.5. Adult and neonatal mice were killed by cervical dislocation, and embryos were killed by decapitation, in accordance with UK Home Office regulations. The cochleae were dissected in extracellular solution composed of (mm): 135 NaCl, 5.8 KCl, 1.3 CaCl2, 0.9 MgCl2, 0.7 NaH2PO4, 5.6 d-glucose, 10 Hepes-NaOH, 2 sodium pyruvate. Amino acids and vitamins for Eagle's minimum essential medium (MEM) were added from concentrates (Invitrogen, Paisley, UK). The pH was adjusted to 7.5 and the osmolality was about 308 mmol kg−1. The entire organs of Corti (E14.5-P7) or individual apical and basal coils (P8-P30) were transferred to a microscope chamber containing extracellular solution in which they were immobilized with a nylon mesh fixed to a stainless steel ring. The chamber (volume 2 ml) was perfused at a flow of about 10 ml h−1 from a peristaltic pump and mounted on the stage of an upright microscope (Zeiss ACM, Germany, or Olympus, Japan). The organs of Corti were observed with Nomarski differential interference contrast optics (× 40 water immersion objectives). The position of cells along the cochlea was recorded as fractional distance from the extreme apex. In the immature cochlea, apical coil (Ac) cells were positioned at a fractional distance between 0.12 and 0.26, and basal coil (Bc) cells between 0.81 and 0.95. In some experiments cells from the mid-cochlea were studied, at a fractional distance ranging from 0.41 to 0.65. Mature IHCs studied were positioned between 0.06 and 0.19 (apex) and 0.72 and 0.86 (base), corresponding to approximate frequency ranges of 0.8–3.0 and 35–58 kHz, respectively (using eqn (13) in Ehret, 1975). To expose the basolateral surfaces of the cells, a small tear was made in the epithelium with a suction pipette (tip diameter about 3–4 μm) filled with extracellular solution. The cells were then cleaned by a stream of fluid from this pipette before patching. Only cells of healthy appearance, with well-preserved hair bundles were investigated.
Electrical recording
Membrane currents under voltage clamp were studied at room (20–25 °C) or near-body (35–37 °C) temperature by the whole-cell patch clamp technique using EPC-7, EPC-8 (HEKA, Lambrecht, Germany) or Optopatch (Cairn Research Ltd, Faversham, Kent, UK) amplifiers. To obtain realistic voltage responses, all current clamp experiments were performed near body temperature (35–37 °C). Patch pipettes were pulled from soda glass capillaries (Harvard Apparatus Ltd, Edenbridge, UK) and electrode resistances in extracellular solution were 2–3 MΩ. In order to reduce the electrode capacitance, the shank of the electrode was coated with surf wax (Mr Zoggs SexWax, CA, USA). The pipette filling solution contained (mm): 131 KCl, 3 MgCl2, 1 EGTA-KOH, 5 Na2ATP, 5 Hepes-KOH, 10 sodium phosphocreatine (pH 7.3, 292 mmol kg−1). Ca2+ currents in embryonic IHCs were recorded using the following intracellular solution to minimize contamination due to the K+ currents (mm): 147 caesium glutamate, 2.5 MgCl2, 2.5 Na2ATP, 1 Na2GTP, 0.3 EGTA-NaOH, 5 Hepes-CsOH (pH 7.3, 292 mmol kg−1). Data acquisition was performed using pClamp software (Axon Instruments, CA, USA) using either a LabMaster DMA or a Digidata 1320A data acquisition board. Data were filtered, depending on the protocols used, at 2.5 or 5 kHz (8-pole Bessel), sampled at 5 or 10 kHz and stored on computer. Offline data analysis was performed using Origin software (OriginLab, Northampton, MA, USA). For voltage clamp experiments, current recordings were corrected offline for leak conductance (gleak) and holding currents were plotted as zero current. Estimates of gleak were calculated between −84 and −94 mV, as the outward K+ currents activate positive to or around −70 mV. Values for gleak were 2.5 ± 0.1 nS (n = 260, E14.5–P12) for immature IHCs and 4.8 ± 0.3 nS (n = 62, P13–P24) for more mature cells after the onset of hearing. In the mature cells, this voltage was chosen as the best compromise to minimize the (small) contribution of IK,n to the estimates of the size of IK,s (the extrapolated size of IK,n at 0 mV was 325 ± 27 pA (n = 30 IHCs, P20–P30) compared to a measured size of around 10 nA (Fig. 5F) for IK,s). Our choice of potential for calculating gleak halved this contamination to about 150 pA, or 1.5 %. No correction was applied for any small reduction by the inward Ca2+ current of size estimates of outward K+ currents measured at 0 mV. The inward rectifier IK1 was studied from a holding potential of −64 mV and gleak was calculated from currents in response to −10 mV hyperpolarizing voltage steps from this potential. In the experiments in which IK,n was investigated, gleak was measured at very hyperpolarized potentials at which IK,n was deactivated (1.5 ± 0.2 nS, n = 52, P8–P30). Residual series resistance (Rs) after compensation (40–90 %) was 2.3 ± 0.1 MΩ (n = 374). Membrane potentials were corrected for residual series resistance and for a liquid junction potential, measured between pipette and bath solutions, of −4 mV for the KCl-based and −11 mV for the caesium glutamate-based intracellular solution. For current clamp experiments, offline series resistance correction was applied only if the voltage drop exceeded 1 mV. Voltage clamp protocols are referred to a holding potential of −84 mV unless specified.
Figure 5. Effect of 4-AP on the delayed rectifier K+ currents in IHCs during development.
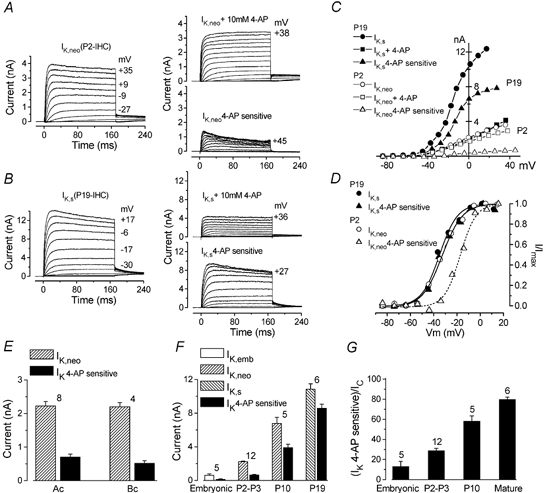
A and B, control current (IK,neo and IK,s), current in the presence of 10 mm 4-AP and 4-AP-sensitive current (obtained by trace-by-trace subtraction), recorded from one P2 and one P19 IHC from the apical coil of the cochlea. Membrane currents were elicited in response to depolarizing voltage steps (10 mV increments) from −84 mV to the various test potentials shown by some of the traces. C, steady-state I-V curves for the current traces shown in A and B. D, activation of IK,neo, IK,s and the current sensitive to 4-AP calculated from the tail currents at a constant potential of −44 mV for the cells shown in A and B. Lines are fits to eqn (2). Fitting parameters are as follows. P19: •, Imax 1848 pA, Vhalf−35.1 mV, S 7.7 mV; ▴, Imax 1484 pA, Vhalf−32.8 mV, S 8.1 mV. P2: ○, Imax> 505 pA, Vhalf−32.8 mV, S 8.7 mV; ▵, Imax 164 pA, Vhalf−17.3 mV, S 6.8 mV. P2 IHC: Vm−64 mV, Cm 7.1 pF, Rs 2.1 MΩ, gleak 1.6 nS. P19 IHC: Vm−73 mV, Cm 8.5 pF, Rs 2.4 MΩ, gleak 2.8 nS. E, size of the total and 4-AP-sensitive outward currents at 0 mV for IHCs positioned in the apical coil (Ac) and basal coil (Bc) of the P2 organ of Corti. F, development of the total delayed rectifier outward current and the 4-AP-sensitive current from embryonic to mature stages for apical coil IHCs. G, relative contribution of the 4-AP-sensitive current to the total delayed rectifier outward K+ current in apical IHCs during development. Ic, control current. Number of cells in E–G shown above each column or column pair.
The K+ channel blockers TEA (Fluka, Gillingham, UK), 4-AP (Aldrich, Gillingham, UK), iberiotoxin (IbTx; Tocris, Bristol, UK) and linopirdine (RBI; Natick, MA, USA) were used. Ca2+ currents in embryonic IHCs were recorded in the presence of 30 mm TEA in the extracellular solution to reduce contamination. In the nominally Ca2+-free version of this solution, Mg2+ was increased to 2.7 mm. The extracellular solutions containing drugs were applied through a multibarrelled pipette positioned close to the patched hair cell. When the blockers added to the external solution had a concentration > 1 mm, equimolar substitution of NaCl was used to keep osmolality constant.
Statistical comparisons of means were made by Student's two-tailed t test or, for multiple comparisons, using analysis of variance (one-way ANOVA followed by the Tukey test, or two-way ANOVA followed by the Bonferroni test). One-way ANOVA was used to evaluate developmental changes in either basal or apical cells and two-way ANOVA for comparing development between apical and basal cells. P < 0.05 was selected as the criterion for statistical significance. Unless specified, P values quoted refer to overall differences throughout development. Mean values are quoted in text and figures as means ±s.e.m.
RESULTS
Total outward K+ currents expressed in mouse IHCs during development
Typical examples of K+ currents recorded from embryonic and neonatal IHCs are shown in Fig. 1A and B, respectively. Depolarizing voltage steps from the holding potential of −84 mV caused slowly developing voltage-dependent outward K+ currents (a delayed rectifier-type K+ current named IK,emb for the embryonic cells and IK,neo (Kros, 1996) for the neonatal cells) in all IHCs investigated. In the basal coil of the cochlea, the first sign of IK,f, the fast activating Ca2+-dependent K+ current characteristic of mature IHCs (Kros & Crawford, 1990; Kros et al. 1998), was observed in two out of three cells at P10 (Fig. 1C). The steady-state values of the outward currents were measured at the end of the test pulses (170 ms) to generate current-voltage (I–V) curves (Fig. 1D).
Figure 1. Outward K+ currents in mouse cochlear inner hair cells (IHCs) during development.
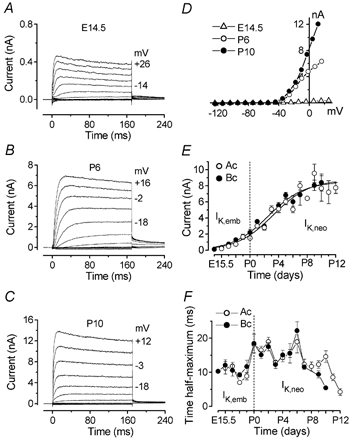
A–C, currents under voltage clamp from basal coil IHCs recorded at E14.5, P6 and P10. Currents were elicited by hyperpolarizing and depolarizing voltage steps (10 mV nominal increments) from −84 mV. Actual test potentials reached are shown by some of the traces. Note the different scales used for the ordinate at different ages to accommodate the large developmental increase in current size. In this and subsequent figures, all current recordings shown are single traces. D, steady-state current-voltage (I–V) curves of the currents shown in A–C. E14.5: resting membrane potential (Vm) −52 mV; cell capacitance (Cm) 3.8 pF; series resistance (Rs) 1.1 MΩ; leak conductance (gleak) 0.7 nS. P6: Vm−73 mV; Cm 7.6 pF; Rs 1.5 MΩ; gleak 2.0 nS. P10: Vm−65 mV; Cm 8.5 pF; Rs 1.1 MΩ; gleak 5.7 nS. E, development of the total, steady-state outward current measured at 0 mV from a holding potential of −84 mV (○, apical coil (Ac) hair cells; •, basal coil (Bc) hair cells). Fits to the data are according to eqn (1). Values for thalf and k are: Ac: P3.2, 0.40 day−1; number of cells measured at the various ages (E15.5–P12) 4, 4, 4, 3, 1, 4, 21, 19, 18, 2, 9, 5, 4, 2, 5, 3, 6. Bc: P2.6, 0.40 day−1; number of cells (E14.5–P10) 4, 5, 4, 6, 3, 3, 10, 19, 4, 11, 3, 5, 2, 3, 3. F, time to half-maximal activation of the outward K+ current measured at −20 mV as a function of age. Ac: number of cells (E15.5–P12) 4, 3, 1, 3, 1, 4, 20, 16, 20, 2, 8, 6, 4, 2, 3, 3, 6. Bc: number of cells (E14.5–P10) 1, 5, 4, 6, 3, 3, 11, 16, 7, 7, 3, 6, 2, 3, 3.
Reversal potentials of the outward currents were determined by applying a 170 ms conditioning pulse to about −4 mV, followed by a series of test pulses down to about −114 mV (data not shown). Reversal potentials were −67.3 ± 2.4 mV for embryonic IHCs (E18.5, n = 3), −73.3 ± 1.0 mV for immature postnatal IHCs (P0–P6, n = 16) and −70.8 ± 2.4 mV for mature IHCs (P18–P22, n = 5), all close to the K+ equilibrium potential under our experimental conditions (EK=−83 mV, 23 °C), confirming the outward currents' identity as K+ currents.
Development of IHC membrane properties before cell maturation
The development over time of outward K+ current amplitude in IHCs is shown in Fig. 1E. Steady-state currents were measured at 0 mV starting from a holding potential of −84 mV. The size of the outward K+ current increased significantly between E14.5 and P10 for basal IHCs, and E15.5 and P12 for apical IHCs (P < 0.0001). During development (E15.5 to P10), no significant difference in the K+ current amplitude was found between apical and basal IHCs. Consistent with previous findings (Kros et al. 1998), the total outward current showed a further rapid increase after P12 reaching a value at 0 mV of 14.6 ± 0.7 nA in apical coil IHCs (P17–P22, n = 35). Fits to the data in Fig. 1E are according to a sigmoidal logistic growth curve:
| (1) |
where I is the size of the current, k is a slope factor and thalf is the age where I is half-way between the maximal (Imax) and minimal (Imin) currents. To test whether a positional gradient in the expression of IK,neo was present in the organ of Corti, we recorded from the apical, middle and basal regions of the P2 mouse cochlea. The size of IK,neo at 0 mV did not vary significantly along the organ of Corti (apical coil: 2.80 ± 0.30 nA, n = 21; mid-cochlea: 2.36 ± 0.34 nA, n = 5; basal coil: 2.95 ± 0.31 nA, n = 19).
Time to half-maximal activation of the outward currents during development was investigated in IHCs positioned in the apical and basal regions of the cochlea. Figure 1F shows the variation of the time to half-maximal activation measured at a membrane potential of −20 mV from the embryonic stages of development to the onset of hair cell maturation. Significant differences in activation kinetics occurred in both apical and basal cells (P < 0.001 in both cases). Note that the time to half-maximum of IK,emb was faster than that of IK,neo recorded during the first few days after birth, indicating that the outward K+ currents undergo kinetic changes around birth. No significant difference was found between apical and basal hair cells.
Developmental changes in cell capacitance (Cm, measured from current transients in response to 10 mV hyperpolarizing steps from −84 mV) are shown in Fig. 2A. The graph shows that the increase in outward K+ current of immature IHCs during development (Fig. 1E) is not simply related to an increase in cell surface area since the capacitance increase is less than threefold compared to an increase in current size of the order of 50 times: in the apical coil from 200 pA at E15.5 to an Imax (Fig. 1E) of 8.8 nA, and in the basal coil from 130 pA at E14.5 to an Imax of 8.5 nA. Figure 2B shows the developmental variation in resting membrane potential (Vm, in some cases measured as zero-current potentials under voltage clamp). IHCs at first exhibit a gradual hyperpolarization of Vm probably due to a rapid increase of IK,emb and the inward rectifier K+ current (IK1) during embryonic development (see Fig. 8C). With postnatal development, after an initial depolarization of Vm (possibly due to an increase of inward Ca2+ and Na+ currents; W. Marcotti, S. L. Johnson & C. J. Kros, unpublished observations) between P0 and P5, an overall hyperpolarization occurred from about P6 in both apical and basal IHCs.
Figure 2. Development of membrane capacitance and resting membrane potential.
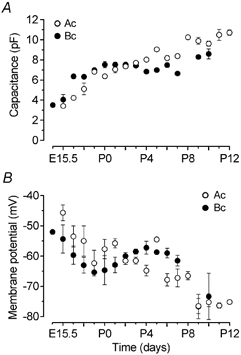
A, growth of the membrane capacitance of IHCs with age. Ac: number of cells (E15.5–P12) 4, 4, 4, 3, 5, 7, 21, 31, 21, 2, 14, 11, 5, 5, 5, 3, 6. Bc: number of cells (E14.5–P10) 4, 5, 4, 6, 3, 3, 14, 19, 8, 11, 3, 9, 2, 3, 3. B, changes in membrane potential during development. Ac: number of cells (E15.5–P12) 3, 2, 2, 3, 3, 4, 21, 18, 15, 2, 6, 5, 4, 2, 4, 3, 6. Bc: number of cells (E14.5–P10) 1, 3, 3, 6, 3, 3, 10, 19, 4, 10, 3, 4, 2, 3, 3.
Figure 8. Embryonic onset of the inward rectifier K+ current.
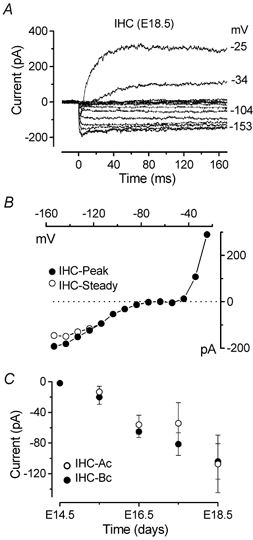
A, current responses from an E18.5 basal coil IHC, recorded using 10 mV voltage steps nominally between −24 and −154 mV starting from a holding potential of −64 mV. Membrane potentials are shown by some of the traces. The rapid activation of IK1 is evident by comparison with the outward K+ currents that activate slowly positive to −50 mV. B, I-V curves for the peak and steady-state current shown in A. Vm−64 mV; Cm 6.8 pF; Rs 1.6 MΩ; gleak 1.8 nS. C, embryonic development of IK1 was measured as steady-state currents at −153 mV. Number of cells measured at the various ages: ○, apical coil (E15.5–E18.5): 2, 2, 2, 3; •, basal coil (E14.5–E18.5): 5, 3, 3, 4, 3.
Steady-state activation and inactivation of the total K+ current in IHCs during development
Figure 3 shows typical examples of developmental changes in voltage-dependent activation and inactivation of the total outward K+ currents in IHCs. The activation curves were obtained by analysing tail currents at a fixed membrane potential. From the holding level of −84 mV, the membrane potential was stepped to a test potential of −44 mV after a series of conditioning depolarizing steps (170 ms in duration) in 10 mV increments from −84 or −104 mV depending on the age of the cell investigated. The activation curves in Fig. 3 were obtained by plotting the normalized instantaneous tail currents (measured 0.2–0.4 ms from stepping to the test potential, filled circles) against the different pre-pulse potentials. Data were fitted by a single first-order Boltzmann equation:
 |
(2) |
where I is the tail current, Imax is the maximal tail current, Vhalf is the potential of half-maximal activation, V is the membrane potential of the preceding voltage step and S describes the voltage sensitivity of activation.
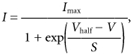
Figure 3. Activation and inactivation curves for the outward K+ currents during IHC maturation.
Typical examples of normalized steady-state activation (•) and inactivation (○) curves for the total outward currents from apical coil IHCs (A, E18.5; B, P3; C, P9; and D, P17). Activation curves were obtained by plotting tail currents at −44 mV shown in the lower insets in each panel. Tail currents at nominally +36 mV (upper insets) were used to derive the inactivation curves. Some of the values of the conditioning potentials are shown next to the traces. The continuous lines are fits using eqn (2) for steady-state activation and eqns (3) or (4) for steady-state inactivation (see text for details). 1st indicates the inactivation of the K+ current component present early on in development and 2nd indicates the additional, more depolarized, component that develops from just after birth. The vertical dashed lines are the average resting membrane potentials for each developmental age. Fitting parameters are as folllows. E18.5: •, Imax 543 pA, Vhalf−36.8 mV, S 6.8 mV; ○, Imax 2801 pA, Vhalf−66.2 mV, S 9.5 mV (Cm 6.8 pF, Rs 1.4 MΩ, gleak 1.8 nS). P3: •, Imax 763 pA, Vhalf−35.3 mV, S 6.9 mV; ○, Imax 4426 pA, Vhalf1−67.9 mV, S1 6.4 mV, Vhalf2−14.5 mV, S2 6.3 mV (with curve 1 contributing 60 % and curve 2 contributing 40 %) (Cm 8.1 pF, Rs 1.8 MΩ, gleak 1.8 nS). P9: •, Imax 1467 pA, Vhalf−47.1 mV, S 7.8 mV; ○, Imax 5811 pA, Vhalf1−68.1 mV, S1 3.7 mV, Vhalf2−6.8 mV, S2 8.9 mV (with curve 1 contributing 24 % and curve 2 contributing 76 %) (Cm 10.5 pF, Rs 1.1 MΩ, gleak 1.0 nS). P17: •, Imax 3630 pA, Vhalf−49.3 mV, S 7.6 mV (Cm 10 pF, Rs 1.2 MΩ, gleak 1.0 nS). ○, Imax 22784 pA, Vhalf−12.8 mV, S 12.9 mV (Cm 9.3 pF, Rs 0.8 MΩ, gleak 4.0 nS).
Steady-state inactivation was studied by using a two-pulse protocol. Inactivation curves were obtained by measuring the peak currents during a 90 ms test step to a nominal potential of +36 mV after 4 s conditioning pulses from the holding potential of −84 mV. The conditioning pulses were from either −124 or −104 mV to more depolarized voltage levels in 10 mV increments. Normalized peak currents were plotted against the different pre-pulse potentials (open circles) and fitted by a modified first-order Boltzmann equation:
 |
(3) |
or, where two inactivating components (1st and 2nd, Fig. 3B and C) were present, the sum of two first-order Boltzmann equations was used:
 |
(4) |
where Iconst is the amplitude of the non-inactivating component of the total outward current and the other parameters are as in eqn (2) for each of the two separate inactivating components.
The development of the different activation and inactivation parameters of the outward K+ currents expressed in apical and basal IHCs is shown in Fig. 4. Vhalf of activation changed during development (Ac: P < 0.0001; Bc: P < 0.0001), tending to become more hyperpolarized with increasing maturity (Fig. 4A). The slope factor (Fig. 4B) showed no clear trend with age. The inactivation parameters changed more markedly during development (Fig. 4C and D), with Vhalf becoming progressively more depolarized (Ac: P < 0.0001; Bc: P < 0.0001). Values of Vhalf, S and Iconst describing the inactivation curves and shown in Fig. 4C–E were obtained from the best fit using just a single first-order Boltzmann equation (eqn (3)) in order to compare the overall changes in the main components determining steady-state inactivation during IHC development. The constant, non-inactivating fraction of the total outward current increased between embryonic and postnatal development (Ac: P < 0.0001; Bc: P < 0.0001). During development, Vhalf of both activation (P < 0.01, E15.5-P10) and inactivation (P < 0.05, E18.5-P7) was significantly different between apical and basal cells, with activation more hyperpolarized and inactivation more depolarized in the base.
Figure 4. Development of activation and inactivation parameters for the outward K+ currents.
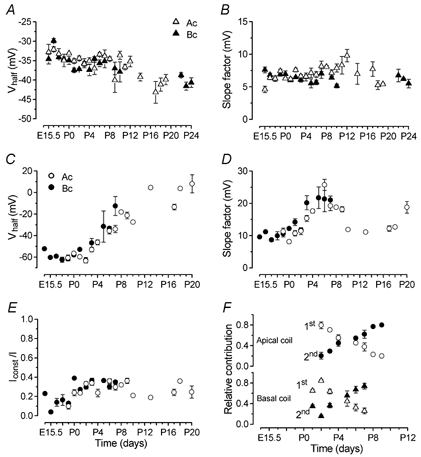
A and B, Vhalf and S for the activation curves measured at −44 mV of the total outward K+ current recorded in IHCs from E15.5–P24. Number of cells measured at the various ages, from left to right: ▵, apical coil (E15.5–P19) 4, 4, 4, 3, 1, 4, 20, 19, 18, 2, 9, 6, 4, 4, 10, 3, 7, 2, 3, 4, 8; ▴, basal coil (E15.5–P10 and P22–P24) 5, 4, 6, 3, 3, 10, 19, 4, 11, 3, 5, 2, 3, 3, 2, 3, 4. C and D, Vhalf and S of the steady-state inactivation measured at nominally +36 mV as a function of age. ○, apical coil (E18.5–P10 and P13, P17–P20) 3, 4, 3, 8, 10, 7, 10, 8, 1, 4, 1 and 1, 3, 1, 3. •, basal coil (E14.5–P7) 1, 1, 3, 2, 3, 1, 4, 6, 4, 2, 7, 4. E, size of the non-inactivating component (Iconst) plotted as a fraction of the maximum tail current at +36 mV. Number of cells as in C and D. F, maturation of the relative contribution of the two inactivating components plotted as a fraction of the total steady-state inactivation (open and filled symbols indicate the earlier 1st and the developing 2nd components of the outward K+ currents, respectively). Number of cells: apical IHCs (P2–P9) 6, 10, 7, 10, 8, 1, 4; basal IHCs (P1–P7) 4, 4, 4, 2, 7, 4.
From just after birth a new component of the outward K+ current, showing a more depolarized steady-state inactivation (2nd component) compared to that of earlier stages of development (1st component), became apparent (Fig. 3B). This new inactivating component gradually became predominant within 1 week. During the time window where the steady-state inactivation could be fitted by the sum of two Boltzmann equations, the contribution of the 1st and 2nd components relative to the total outward current is shown in Fig. 4F. Overall, the developmental maturation of the K+ currents produced a shift of the steady-state activation towards hyperpolarized potentials and inactivation towards depolarized potentials. This shift results in a different contribution of the outward K+ current at a given membrane potential as a function of development. As shown in Fig. 3A, early in development, less than 40 % of the K+ current is available around the resting membrane potential (indicated by the dashed lines) due to inactivation. This might contribute to the broad action potentials recorded in IHCs during embryonic stages of development compared to those at later stages (Fig. 10D). From about the second postnatal week the opposing shifts of the K+ current activation and inactivation curves (Fig. 3C) together with the more negative resting membrane potentials (Fig. 2B) ensure that all of the outward K+ current is fully available from rest.
Figure 10. IHC voltage responses during developmental maturation.
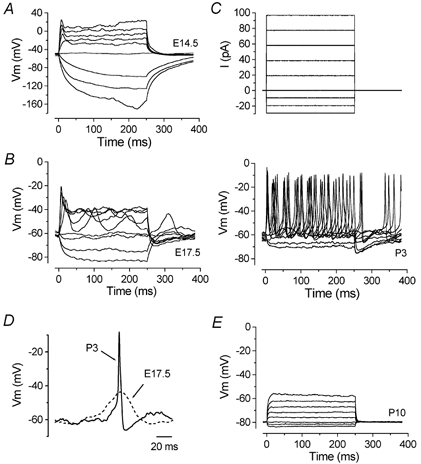
A–E, voltage responses under current clamp from basal coil IHCs just after terminal mitosis (E14.5), later in embryonic development (E17.5), early postnatally (P3) and just before the onset of hearing (P10). Current steps were applied from the resting potential in 10 pA increments between −30 and +100 pA and for clarity only responses to every other depolarizing current step are shown, as in the recorded current steps for the P3 cell (top panel in C). Note the larger range of potentials for the ordinate of A compared to B, C and E. Spontaneous action potentials occurred without current injection for the cells shown in B and C. D, comparison on an expanded time scale of spontaneous action potentials from the cells of B and C. E14.5: Vm−52 mV, Cm 3.8 pF, Rs 1.1 MΩ, gleak 0.7 nS. E17.5: Vm−64 mV, Cm 6.5 pF, Rs 2.6 MΩ, gleak 0.3 nS. P3: Vm−62 mV, Cm 6.9 pF, Rs 3.1 MΩ, gleak 2.1 nS. P10: Vm−76 mV, Cm 7.8 pF, Rs 5.1 MΩ, gleak 4.9 nS. The temperature in all cells investigated was between 35 and 37 °C.
Pharmacological separation of the developing delayed rectifier K+ currents
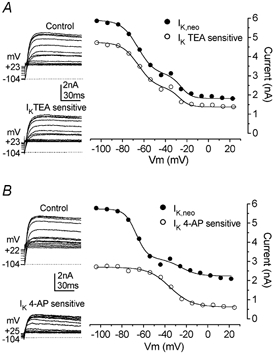
The K+ channel blockers 4-AP and TEA were applied to IHCs at different stages of cell maturation in an attempt to clarify whether the shifts in activation and particularly inactivation of the outward K+ currents were due to a developmental change in the expression of channel subtypes. In mature IHCs, the effects of TEA and 4-AP were tested after IK,f, the fast activating Ca2+-activated K+ current characteristic of these mature cells, had been blocked by 30 nm IbTx (Kros et al. 1998). To assess any voltage-dependent block by TEA and 4-AP, outward K+ currents were activated by a series of depolarizing voltage steps to potentials up to +50 mV, from a holding potential of −84 mV, and the current was measured at the end of the 170 ms depolarizing test pulses. Block by either 1 mm 4-AP (n = 9 P2 IHCs) or 10 mm TEA (n = 8 P2 IHCs) was not voltage dependent.
TEA was tested using a range of concentrations from 10 to 100 mm (19 IHCs, E15.5–P19). In all cells investigated, TEA reversibly reduced the amplitude of the outward current in a dose-dependent manner (data not shown). Reduction of steady-state IK,neo in P2 IHCs was 62 ± 1 % (n = 8) in 10 mm TEA and 87 ± 2 % (n = 3) in 50 mm TEA. The half-blocking concentration (KD) was 5.6 ± 0.6 mm. These values were not significantly different from those obtained for the peak current. At a concentration of 100 mm, TEA abolished the outward current almost completely. Consistent with previous observations (Kros et al. 1998) the sensitivity of the outward K+ current to TEA was reduced during IHC maturation. In adult IHCs (P19, n = 3) 50 mm TEA reduced the outward K+ current (IK,s) by 73 ± 1 %, significantly less than that in P2 cells (P < 0.005). The KD in mature cells was 22.3 ± 2.5 mm.
4-AP was tested on 28 IHCs (E15.5-P19). Extracellular application of 4-AP (1 or 10 mm in immature and 10 or 30 mm in mature IHCs) caused a reduction of the outward currents, with the peak currents being significantly more affected than the steady-state levels (P < 0.0001). The effect of 4-AP was almost completely reversible after washout but only at a concentration of 1 mm. No significant difference in the percentage reduction of the outward K+ current was found between applications of 1 and 10 mm of the drug in immature cells or between 10 and 30 mm in mature cells. The action of 4-AP on the outward K+ current in neonatal (IK,neo) and mature IHCs (IK,s) is shown in Fig. 5A and B, respectively. The 4-AP-sensitive current was obtained by subtracting the currents remaining after 4-AP treatment from the control currents. The I-V curves for the cells in Fig. 5A and B are shown in Fig. 5C. The steady-state activation curves for the control and 4-AP-sensitive currents were obtained by analysing tail currents at a fixed membrane potential of −44 mV as described for Fig. 3. The activation curves in Fig. 5D show that the activation of the 4-AP-sensitive component of IK,neo in P2 IHCs was about 20 mV more positive than that of the control currents at both ages as well as the 4-AP-sensitive current in mature cells. The half-activation and the slope factor of the total outward current expressed by neonatal IHCs and mature IHCs, in which IK,f had been blocked by IbTx, (IK,neo P2: Vhalf=−34.4 ± 0.6 mV and S = 7.6 ± 0.3 mV, n = 20; IK,s P19: Vhalf=−35.2 ± 2.1 mV and S = 6.5 ± 0.6 mV, n = 4) were not significantly different from the values found for the isolated 4-AP-sensitive current in mature IHCs (Vhalf=−33.1 ± 1.7 mV and S = 7.0 ± 0.6 mV, n = 4, P19). However, Vhalf (−20.3 ± 2.8 mV, n = 8) of the K+ current sensitive to 4-AP in neonatal IHCs was significantly different at P < 0.001 from that of the control currents (IK,neo and IK,s); S (6.3 ± 0.8 mV, n = 8) was not. It appears therefore that in IHCs the activation of the 4-AP-sensitive current shifts in the hyperpolarizing direction during postnatal development. This shift was already established before the onset of hearing: in four P10 apical IHCs Vhalf and S for the 4-AP-sensitive current were −33.3 ± 2.9 mV and 8.0 ± 0.8 mV, respectively. These values were not significantly different from those for the control currents in the same cells (Vhalf=−33.1 ± 2.2 mV and S = 6.6 ± 0.8 mV) or those for the control and 4-AP-sensitive currents at P19.
In immature IHCs (P2) the size of the control and 4-AP-sensitive currents, measured at 0 mV, was not significantly different between apical and basal cells (Fig. 5E). The size of the total outward K+ current and the 4-AP-sensitive current, again at 0 mV, increased considerably during development (Fig. 5F). The increase in total delayed-rectifier outward K+ current was mostly due to an increase in the 4-AP-sensitive component, as its fractional contribution increased gradually, becoming the larger current in mature cells (Fig. 5G).
Figure 6 shows the effects of TEA (A) and 4-AP (B) on the inactivation process of the total outward K+ currents at P3. Steady-state inactivation was studied by using the two-pulse protocol described above (see also Fig. 3). Inactivation curves for the control currents and TEA- or 4-AP-sensitive currents were obtained by plotting the peak currents (Fig. 6A and B, left-hand panels, respectively) against the different pre-pulse potentials. Data were fitted using eqn (3) or eqn (4) depending on whether one or two inactivating components could be discerned. TEA at 30 mm removed the outward current almost completely. The TEA-sensitive current exhibits both the 1st and 2nd inactivating components with no significant changes in their contribution to the total current compared to the control (Fig. 6A). By contrast, in the presence of 4-AP a component could be isolated from the total current showing a depolarized steady-state inactivation (Fig. 6B). It is likely, therefore, that this 4-AP-sensitive current represents the developing 2nd inactivating component described before (Fig. 3), or at least part of it. This component was almost completely inactivated for potentials more positive than −20 mV and the inactivation curves were well fitted using a single Boltzmann equation, eqn (3), with a Vhalf of −31.6 ± 1.3 mV, slope factor of 7.9 ± 0.9 mV and a residual non-inactivating fraction (Iconst/I) of 0.13 ± 0.04 (n = 5). Although the 4-AP-sensitive current could be isolated starting from embryonic stages (Fig. 5F–G), its presence in terms of steady-state inactivation was clearly observed from P1-P2 only (Fig. 3 and Fig. 4F). This may be explained by its very small fractional contribution (0.11 ± 0.05, n = 5) to the total outward K+ current at embryonic stages (Fig. 5G). So, during the first week after birth, a 4-AP-insensitive current with a hyperpolarized inactivation is gradually replaced by a 4-AP-sensitive current with a more depolarized inactivation, although the former current never completely disappears (Fig. 5G).
Figure 6. Effects of TEA and 4-AP on inactivation of outward K+ currents.
A, inactivation curves for the control (•) and TEA-sensitive (○) currents were obtained by plotting the peak currents measured at a test potential of +36 mV (insets) after a series of conditioning steps between −104 and +23 mV (4 s duration). The TEA-sensitive current (inset bottom panel) was obtained by subtracting the current remaining after superfusion of 30 mm TEA from the control current (inset top panel). Fitted curves are according to eqn (4). Fitting parameters are as follows. •, Vhalf1−65.6 mV, S1 7.6 mV, Vhalf2−25.7 mV, S2 4.9 mV (with curve 1 contributing 69 % and curve 2 contributing 31 % of the inactivating current); ○, Vhalf1−68.9 mV, S1 7.6 mV, Vhalf2−17.5 mV, S2 6.3 mV (with curve 1 contributing 71 % and curve 2 contributing 29 %). P3 apical IHC: Vm−63 mV, Cm 6.6 pF, Rs 2.0 MΩ, gleak 1.0 nS. B, membrane currents and steady-state inactivation curves for the control (inset top panel) and the 4-AP-sensitive current (inset bottom panel). Fits using eqn (4) for the control and eqn (3) for the 4-AP-sensitive current. Fitting parameters: •, Vhalf1−66.9 mV, S1 5.2 mV, Vhalf2−25.0 mV, S2 8.0 mV (with curve 1 contributing 74 % and curve 2 contributing 26 %); ○, Vhalf−35.3 mV, S 10.0 mV. P3 apical IHC: Vm−64 mV, Cm 7.5 pF, Rs 2.1 MΩ, gleak 1.2 nS.
A current similar to IK,n contributes to IHC maturation
When TEA and 4-AP were applied together in the presence of 30 nm IbTx, a small residual current that activated at considerably more hyperpolarized potentials remained in mature IHCs. In the absence of K+ channel blockers this component was dwarfed by the much larger and rapidly activating IK,f. However, when hyperpolarizing voltage steps were applied from a holding potential of −64 mV sizeable inward currents that commenced instantaneously and decayed slowly to a steady-state level, indicating channel deactivation, were seen even in the absence of any blockers (Fig. 7A). Depolarizing voltage steps can be seen to elicit IK,f and IK,s (Kros et al. 1998). These deactivating inward currents were reminiscent of IK,n previously found in OHCs (Housley & Ashmore, 1992; Mammano & Ashmore, 1996). This current could be selectively blocked by submicromolar concentrations of linopirdine (Marcotti & Kros, 1999). Upon application of 10 μm linopirdine, both the instantaneous inward current in response to hyperpolarizing voltage steps and the current active around the holding potential were strongly blocked (Fig. 7B, top panel). The linopirdine-sensitive current (Fig. 7B, bottom panel) was obtained by subtracting the currents remaining after linopirdine treatment (Fig. 7B, top) from the control currents (Fig. 7A). The peak I-V curves for the traces in Fig. 7A and B are shown in Fig. 7C. Note the nearly linear I-V relation for the linopirdine-sensitive current, indicating that it is almost fully activated at the holding potential of −64 mV. The residual current in the presence of linopirdine is due to the small fraction of IK,f and IK,s activated at −64 mV. A concentration-response curve (Fig. 7D) was constructed by testing the effects of a wide range of concentrations of linopirdine on a measure of the size of IK,n (Marcotti & Kros, 1999). Linopirdine proved a very effective blocker for this additional current in IHCs, with a KD of 0.6 μm. The effect of linopirdine was almost completely reversible after a long washout only at concentrations lower than 10 μm. The maximum slope conductance activated at the resting membrane potential (−74.4 ± 0.5 mV, n = 21, P17–P30) was 5.5 ± 0.4 nS.
Figure 7. Linopirdine-sensitive current in developing IHCs.
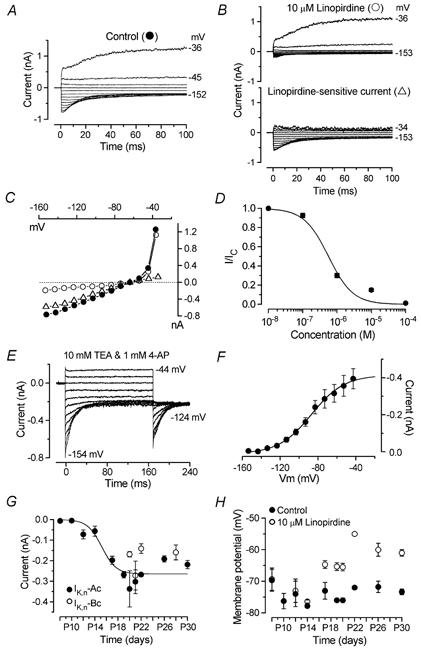
Membrane currents recorded from an IHC (P20) before (A) and during (B, top panel) superfusion of 10 μm linopirdine from a holding potential of −64 mV. The linopirdine-sensitive current (B, bottom panel) was obtained by subtraction. Holding currents: +109 pA (A) and +23 pA (B) plotted as zero current. Resting membrane potential: −77 mV (A) and −67 mV (B). Cm 9.9 pF; Rs 2.1 MΩ, gleak 1.0 nS. C, peak I-V curves for the traces shown in A and B. D, concentration-response curve for block of IK,n by linopirdine. Current size was measured as the difference between instantaneous and steady-state deactivating tail currents for voltage steps from −64 to −124 mV. Logistic curve: I/Icontrol= 1/(1 + ([D]/KD)nH) fitted with KD = 0.56 ± 0.15 μm and nH (Hill coefficient) = 1.2 ± 0.3. [D] is the drug concentration. Number of cells, from left to right: 4, 3, 3, 10, 3. E, membrane currents elicited by voltage steps in 10 mV decrements from −44 to −154 mV starting from −64 mV in 10 mm TEA and 1 mm 4-AP (apical IHC, P21). Holding current +38 pA. Cm 11.2 pF; Rs 1.9 MΩ, gleak 0.7 nS. F, average steady-state activation curve from tail currents measured at −124 mV in four different IHCs (P21, including the cell shown in E). G, development of IK,n in IHCs. Fit to the apical coil data is according to a sigmoidal logistic growth curve (eqn (1)). Values for thalf and k are: P15.2, 0.8 day−1; Number of apical coil IHCs from left to right: 3, 4, 4, 4, 3, 3, 4, 4, 1, 3, 3; basal coil IHCs: 5, 4, 2, 4. H, effects of linopirdine on resting membrane potential during IHC development. Number of cells measured at the various ages (P8–P30): 3, 4, 4, 5, 3, 3, 4, 1, 4, 3. All panels, except G, show data from apical coil IHCs only.
The steady-state activation curve for this current (Fig. 7F) was obtained by analysing tail currents at a fixed membrane potential of −124 mV, following depolarizing and hyperpolarizing voltage steps from the holding potential of −64 mV (Fig. 7E). Since the tail currents of the linopirdine-sensitive current obtained by subtraction (Fig. 7B) were not sufficiently well resolved, we isolated IK,n for these experiments by blocking the other two K+ currents (IK,s and IK,f) that might contaminate the kinetic analysis, since they already start to activate at about −70 mV (see Figs 5D, 7B and C, and Kros & Crawford, 1990). When 10 mm TEA and 1 mm 4-AP were superfused, a current could be isolated which did not show any trace of IK,s or IK,f for membrane potentials up to −44 mV (Fig. 7E). During superfusion of both drugs together, the resting membrane potential shifted from −74.5 ± 1.0 mV to −70.8 ± 1.1 mV (n = 4, P < 0.01, paired t test). Since superfusion of either 10 mm TEA (n = 6) or 30 nm IbTx (n = 4) alone, in order to block IK,f, shifted Vm by about 1 and 0 mV, respectively, the change in Vm observed when TEA and 4-AP were perfused together is likely to be due mainly to a block of IK,s. Data in Fig. 7F were fitted by a first-order Boltzmann function (eqn (2)). The mean values (P21 apical IHCs n = 4) for Vhalf and S were −87.2 ± 1.7 mV and 17.3 ± 1.7 mV, respectively. From the fit to Fig. 7F the maximum tail current at −124 mV was −415 ± 16 pA, corresponding to a conductance of 8.1 ± 0.3 nS (reversal potential of this negatively activating current was −73 ± 2 mV, n = 10). Vhalf and S, as well as the KD were not significantly different from those of IK,n found in OHCs (Marcotti & Kros, 1999). These results clearly suggest the presence in mature IHCs of a current that is indistinguishable from IK,n.
The developmental increase in IK,n was measured in isolation (either as linopirdine-sensitive current, Fig. 7B, or when 10 mm TEA and 1 mm 4-AP were added, Fig. 7E) as the deactivating tail currents at −124 mV (difference between instantaneous and steady-state inward currents) from the holding potential of −64 mV (Fig. 7G). The first sign of IK,n was seen at P12 (in three out of four apical IHCs). In a previous study this current was not detected in IHCs at P12, the latest age tested, due to its small size at this age and the more negative holding potential used (Marcotti & Kros, 1999). The mean maximum current from the fit to Fig. 7G of 264 pA corresponds to a conductance of 5.3 nS activated at −64 mV, a potential at which IK,n is approaching complete activation. There was a just significant difference in the size of IK,n between mature apical and basal IHCs (P20-P30: apical −270 ± 30 pA, n = 15; basal −190 ± 24 pA, n = 15). Their resting membrane potentials were similar: −74.3 ± 2.0 and −74.6 ± 2.1 mV for apical and basal IHCs, respectively. Since in OHCs IK,n, due to its very negative activation range, contributes to the resting membrane potential we looked for a such a role in IHCs. When IHCs (P8–P30) were superfused with 10 or 100 μm linopirdine, a shift of the resting membrane potential developed as IK,n increased in size, reaching statistical significance (two-way ANOVA) from P19 onwards (Fig. 7H).
Inward rectifier K+ current
The inward rectifier K+ current (IK1) is transiently expressed in cochlear hair cells before the onset of hearing (Marcotti et al. 1999). Since these cells already express IK1 at birth, we investigated its developmental onset during embryonic stages of maturation (Fig. 8). Starting from a holding potential of −64 mV, hyperpolarizing voltage steps between −24 and −154 mV (in nominally 10 mV decrements) elicited inward currents (Fig. 8A). The rapid activation kinetics of the inward currents can be appreciated by comparison with the slow, sigmoidal activation of the outward K+ current (IK,emb). The peak and steady-state I-V curves show that the current became inward negative to −80 mV (Fig. 8B), near the K+ equilibrium potential. Figure 8C shows that IK1 is expressed by embryonic IHCs as early as E15.5 and that it increases rapidly over the next few days, reaching an average size of just over 100 pA in both apical and basal cells the day before birth. After birth the size of IK1 continues to increase until P12 in apical coil IHCs before it rapidly decreases (Marcotti et al. 1999); in the present study we found evidence for a small residual IK1 up to P14 (Fig. 12).
Figure 12. Schematic representation of changes in K+ current expression during development in mouse IHCs.
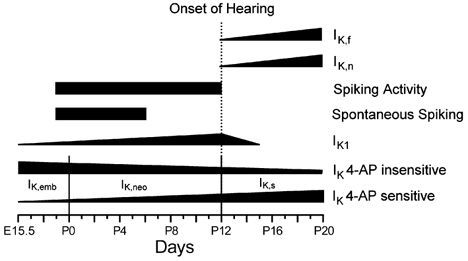
The diagram shows the timing of the appearance and disappearance of K+ currents and spike activity during maturation. The change in width of the horizontal bars gives an approximate indication of developmental changes in the size of the currents. The timing is valid for the apical coil (changes in basal coil IHCs were usually shifted forward by 1–2 days).
Embryonic onset of Ca2+ current
Action potentials in immature cochlear IHCs are primarily due to the interplay of a rapidly activating Ca2+ current and the slow delayed rectifier K+ current (Kros, 1996; Kros et al. 1998). Ca2+ currents have been previously described in early postnatal IHCs (Beutner & Moser, 2001). In this study we found that IHCs of the mouse cochlea produce broad action potentials as early as E17.5. Therefore, we investigated the timing of Ca2+ current appearance during embryonic development in order to correlate it with the onset of the spiking activity. In some of the embryonic hair cells a small inward Ca2+ current was clearly seen to precede the outward K+ current. This current was first observed at E16.5 (basal cells: −79 ± 17 pA, n = 5 of 6 IHCs; apical cells: −32 ± 4 pA, n = 2 of 4 IHCs). When recorded in isolation by blocking the K+ currents this current was seen to peak around −11 mV (Fig. 9B). Its identity as a Ca2+ current was confirmed in three basal IHCs (E16.5-E17.5) by extracellular superfusion of nominally Ca2+-free solution (Fig. 9).
Figure 9. Ca2+ currents in an embryonic IHC.
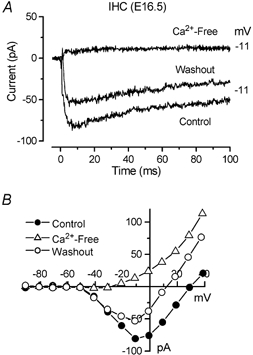
A, currents from an E16.5 basal coil IHC, in 1.3 mm extracellular Ca2+ (Control and Washout) and during superfusion of a nominally Ca2+-free solution, in response to voltage steps from −81 to −11 mV. B, peak I-V curves for the cell shown in A. Currents were elicited using 10 mV voltage steps nominally between −91 and +39 mV starting from a holding potential of −81 mV. Cm 4.8 pF, Rs 5.5 MΩ, gleak 0.3 nS.
Voltage responses under current clamp
Neonatal IHCs can generate repetitive action potentials spontaneously or during injection of small depolarizing currents starting from the resting potential (Kros et al. 1998). Since the kinetics and size of the outward K+ current vary with developmental maturation, we studied how these changes might influence the cells' voltage responses. Hyperpolarizing and depolarizing current steps in 10 pA increments were applied to IHCs from embryonic stages up to the onset of functional maturation. During early embryonic stages of development, hyperpolarizing current injection caused almost passive voltage responses (Fig. 10A: E14.5) due to the absence of IK1 (Fig. 8C). From E15.5, voltage responses to hyperpolarizing currents became progressively smaller (Fig. 10B and bottom panel of Fig. 10C). Before E16.5, depolarizing currents elicited large voltage responses that fairly slowly rose to a peak and then declined somewhat with a similar time course to a steady-state level, presumably due to activation of a small IK,emb. From E17.5 in the basal coil and E18.5 in the apical coil, IHCs were able to generate spontaneous and induced action potentials (Fig. 10B and C). During embryonic and early postnatal (P0) stages spikes were broader than those recorded in older cells (Fig. 10D). Spontaneous spiking activity was found in most IHCs between E17.5 and P6 in the base, and E18.5 and P6 in the apex. The disappearance of induced spiking in apical IHCs was previously correlated with the appearance of IK,f around P12 (Kros et al. 1998). Here we show that spiking disappears earlier in basal coil IHCs, at P10, where the voltage responses become faster and smaller (Fig. 10E), together with the earlier appearance of IK,f in this region (Fig. 1C).
Voltage responses in the presence and absence of the 4-AP-sensitive current
Direct information about the role of the 4-AP-sensitive K+ current in the spiking activity of immature IHCs was obtained under current clamp conditions at body temperature. Application of 10 mm 4-AP onto IHCs caused a depolarizing shift of the resting potential (from −65 ± 3 mV to −58 ± 3 mV, n = 5 apical P7 IHCs, significant at P < 0.001) and reduced the threshold for the firing of evoked action potentials (Fig. 11A–C), showing that as early as P7 the 4-AP-sensitive current is already partially activated at rest. A detailed examination of evoked spikes in the presence and absence of 4-AP showed that this current contributed to the timing of action potentials in IHCs. To do this, we used the smallest current injection for which trains of action potentials were elicited in all three conditions (either +40 or +50 pA). The effects of 4-AP on both the rising and falling phases of the action potentials were investigated. The maximum rate of rise (dV/dt) of the upstroke of the action potential in the presence of the drug was about 50 % slower than that both of the control and following washout (Fig. 11D, P < 0.001). The rate of action potential repolarization was also reduced in the presence of 4-AP (Fig. 11E, P < 0.05, reduced to 77 % of the mean before and after 4-AP). The height of the induced action potentials was measured as the difference between the peak of the spike (1) and the value reached after maximum membrane repolarization (2) as shown in Fig. 11F for the control trace. The height of the action potential (Fig. 11G, 50/48 mV before/after and 38 mV during 4-AP) was significantly different between control and 4-AP (P < 0.05), but not between 4-AP and wash, presumably due to the slow washout of the drug. We measured the width of the action potential at half its maximum height (Fig. 11F). We measured the width of both the rising (3) and the falling (4) side in order to gain more specific information about the contribution of the 4-AP-sensitive current to the timing of the action potential. The dashed trace in Fig. 11F shows how 10 mm 4-AP slows the timing of a single action potential. Width 3 of the action potentials increased from 5.3/6.4 ms before/after 4-AP to 11.1 ms in the presence of 4-AP, significant at P < 0.001/P < 0.01 (Fig. 11H). Width 4 was also increased during 4-AP application from 9.1/11.9 ms before/after to 15.2 ms in the presence of 4-AP, significant at P < 0.05 only between control and 4-AP (Fig. 11H). Finally, the peak of the action potential (−7/-9 mV before/after; −15 mV during 4-AP) was significantly different between control and 4-AP (P < 0.05), but not between 4-AP and wash. The analyses presented in Fig. 11D–H were also conducted by selecting voltage responses with the same spike frequency before, during and after 4-AP, with similar results. The differences in action potential shape were thus not simply a consequence of the more depolarized resting potentials in the presence of 4-AP.
Figure 11. Effects of 4-AP on action potential timing in IHCs.
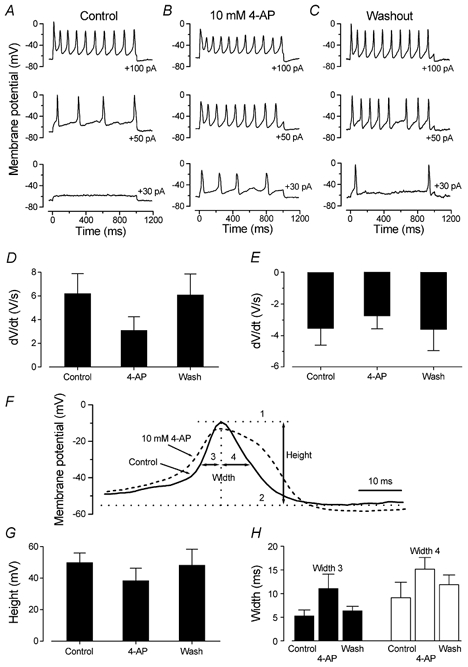
A–C, voltage responses from a P7 apical coil IHC before (Control), during and after (Washout) extracellular application of 10 mm 4-AP. Superfusion of 4-AP resulted in resting membrane potential depolarization from around −69 to −63 mV and broader action potentials in response to depolarizing current injection. Cm 8.2 pF, Rs 2.5 MΩ, temperature 36 °C. D and E, rate of rise and fall, respectively, of the action potentials in P7 apical coil IHCs before, during and after extracellular application of 10 mm 4-AP (n = 5). F, single action potential from a P7 IHC before (continuous line) and during (dashed line) superfusion of 4-AP. For the control spike we show how the height (level 1 minus level 2) and width (at half its maximum height) of the action potential were calculated. Separate measurements were made for widths 3 and 4. G and H, height and width of the action potentials, respectively, before, during and after application of 4-AP (n = 5).
DISCUSSION
In the present study we examined the biophysical properties and the distribution of K+ currents in IHCs as a function of age and position along the mouse organ of Corti. Hair cell precursors start to differentiate in the basal coil from about E14 (Anniko, 1983). Developing mouse IHCs and OHCs are recognizable by scanning electron microscopy just after E14 (Lim & Anniko, 1985). Using Nomarski differential interference contrast optics we were able to record from IHCs as early as E14.5. On the basis of the appearance and maturation of the different basolateral membrane currents and spiking activity we identified four main developmental stages during which IHCs change from functionally inactive cells to high-frequency sensory receptors. Comparisons of our findings with morphological observations quoted below refer to mouse or rat (which have a very similar time course for inner ear development) unless otherwise mentioned.
Just after terminal mitosis IHCs are electrically quiescent
Radial afferent fibres (Sher, 1971) have been shown to invade and spread within the cochlear epithelium just before terminal mitosis, a time in which hair cells are still undifferentiated. However, at this stage no synaptic contacts are formed. Our study shows that soon after terminal mitosis the newly differentiated IHCs mainly express a small, voltage-dependent, 4-AP-insensitive, outward K+ current, IK,emb (Fig. 12). The small current size recorded in early post-mitotic IHCs, mainly due to a low channel density, makes these cells respond to small current injections with large, slow, graded changes in membrane potential (Fig. 10A). The resting potential is stable and no spontaneous or induced action potentials occur. This would seem appropriate given that the newly differentiated IHCs are functionally isolated: they receive no sensory input and are not yet contacted by afferent or efferent nerve fibres (Pujol et al. 1998).
Late embryonic and early postnatal IHCs fire spontaneous action potentials
During late embryonic and early postnatal stages of development, substantial changes occur within the cochlea, i.e. maturation of hair cell membrane properties and a profound reorganization of the connections to and from the brain (Lenoir et al. 1980; Shnerson et al. 1982; Echteler, 1992 (gerbil); Pujol et al. 1998). By about E18 the afferent fibre endings that invaded the sensory epithelium early on, stop spreading and tend to concentrate around the base of the hair cells (Sobkowicz, 1992), forming the first synaptic-like contact with IHCs around the same time (Pujol et al. 1998). From E17.5 in the base and E18.5 in the apex the Ca2+ currents that first appeared at E16.5 have become sufficiently large to ensure that IHCs are capable of firing spontaneous action potentials. The outward K+ current responsible for repolarization is still mainly 4-AP insensitive in late embryonic (IK,emb) and early postnatal (IK,neo) IHCs. The depolarized activation range of the outward current and the small size of the developing inward rectifier IK1 make the ‘resting potential’ relatively positive. The spikes are broader at first and become much faster from P1 to P6 (Fig. 10D), probably mainly due to increases in size of the Ca2+ and outward K+ (IK,neo) currents.
Although in IHCs the function of spontaneous action potentials during maturation is unknown, the importance of spontaneous activity in the reorganization of early neuronal connections in various systems is well established (see for a review Moody, 1998). For example, in retinal ganglion cells, bursts of spontaneous action potentials occur before the onset of visual input and it has been proposed that this activity is important to mediate pruning of ganglion cell terminals, consequently refining neuronal connections in the visual system before maturation (Shatz & Stryker, 1988; Maffei & Galli-Resta, 1990; Meister et al. 1991). The possibility that spontaneous spiking activity in IHCs might control the remodelling of synaptic connections in the ear and auditory brainstem is supported by physiological and morphological observations. During the time window in which IHCs fire spontaneous action potentials (between E17.5 and P6), many changes occur at the auditory nerve afferent fibres. A characteristic of radial axosomatic afferents during embryonic stages of development is the sprouting of their dendritic endings. However, during the first postnatal week the fibre endings undergo extensive pruning that results in an unbranched conformation typical of adult mammalian IHCs (Echteler, 1992 (gerbil); Pujol et al. 1998). Little is known at present about any spontaneous activity that might occur in the auditory brainstem of rodents before the onset of hearing (Rübsamen & Lippe, 1998). However, neurones in auditory brainstem slices could already fire evoked action potentials by E18, the time of synapse formation at the IHCs (Kandler & Friauf, 1995). Provided synaptic function is already established, these neurones could propagate electrical activity originating in the embryonic IHCs, but thus far synaptic transmission in the rodent auditory brainstem has only been searched for and indeed observed in early postnatal animals (e.g. Wu & Oertel, 1987; Sanes, 1993 (gerbil)). Additional evidence in support of spontaneous spiking as an important step during early development of the neuronal connections comes from experiments in which deafferentation by surgical removal of the cochlea within the first postnatal week results in substantial loss of cochlear nucleus neurones (Tierney et al. 1997 (gerbil); Mostafapour et al. 2000).
Loss of spontaneous firing during the second postnatal week
From about P7 immature IHCs stop firing spontaneous action potentials although they retain the capability to spike in response to small depolarizing current injection of 10–50 pA (Fig. 11A). These changes in spike activity could be partially explained by the shift, during development, of the IHC resting membrane potential towards more hyperpolarized values (Fig. 2B), mainly due to a larger IK1 (Marcotti et al. 1999) but also due to the increasing contribution of a 4-AP-sensitive outward K+ current that activates progressively more negatively. Indeed, block of either this outward current by 4-AP (Fig. 11) or of IK1 by Cs+ or Ba2+ (Marcotti et al. 1999) produced similar effects under current clamp: a membrane depolarization of the order of 10 mV and a reduced threshold for the firing of evoked action potentials. The block of either of these currents also caused a broadening of the evoked action potentials and generally made the voltage responses similar to those of late embryonic IHCs.
Why should spontaneous (but not evoked) firing in immature IHCs stop well before the onset of hearing at P12? One possible explanation arises from morphological studies where removal of afferent input from animals older than P7 resulted in a considerably smaller loss of cochlear nucleus neurones than before this age (Tierney et al. 1997; Mostafapour et al. 2000). This result indicates that by the beginning of the second postnatal week the main architecture of the afferent auditory pathways is in place and the auditory afferents may be less dependent on IHC activity. In addition, by the end of the first postnatal week, medial efferent fibres have been shown to form transient axosomatic contacts with the IHCs (Lenoir et al. 1980; Shnerson et al. 1982) and hyperpolarizing inhibitory postsynaptic potentials could be recorded from IHCs during the second postnatal week (Glowatzki & Fuchs, 2000). In kittens it has been speculated that efferent activity might be important for rhythmic firing of immature auditory afferents (Walsh & McGee, 1988). However, given that the postsynaptic potentials in rat IHCs were inhibitory it is at present not clear how this would work in immature IHCs of rodents if the cells are not spontaneously active.
Functional maturation at the onset of hearing
From about the onset of hearing (P12) the one-to-one axosomatic configuration between afferent fibres and IHCs found in mature synapses is established and from this point in postnatal development no major changes in the innervation pattern or nature of synapses have been detected (Shnerson et al. 1982). At the same time (P12), IHCs undertake the final developmental step that will turn these immature spiking cells into high-frequency sensory receptors. This final change is mainly due to the acquisition of the fast activating IK,f that prevents the generation of action potentials at any level of current injection (Kros et al. 1998). A few days after the appearance of IK,f the inward rectifier IK1 is lost. Our results show that two other changes contribute to the building of functionally mature IHCs: a large 4-AP-sensitive current, which accounts for the larger component of IK,s (about 80 %, Fig. 5G) in mature IHCs, and a current similar to that of mature OHCs, IK,n, which is blocked by submicromolar concentrations of linopirdine (Marcotti & Kros, 1999). IK,n, although small compared to the other outward currents IK,f and IK,s, is relatively important close to the resting membrane potential since it is about 65 % active. A role in setting the membrane potential is also carried out by the 4-AP-sensitive current since it is partially active around −70 mV. As to the question of the nature of the transition between IK,neo and IK,s, a sharp transition does not occur, instead the results show a gradual change in the classical delayed rectifier currents during development, with a 4-AP-sensitive current progressively increasing and a 4-AP-insensitive current decreasing in size from early embryonic stages until maturity (Fig. 12). This may point to a developmental change in the balance of Kv channel subunit composition, which remains to be investigated by molecular or immunohistochemical methods. The terms IK,emb, IK,neo and IK,s remain useful to indicate the developmental time points at which the classical delayed-rectifier currents are observed.
The presence in mature IHCs of a current indistinguishable from the OHC conductance IK,n suggests that the form of non-syndromic dominant deafness found in humans (DFNA2), caused by a mutation in the KCNQ4 gene (Kubisch et al. 1999), is likely to be due to the lack of IK,n expression not only in OHCs (Marcotti & Kros, 1999), but also in IHCs. This supports recent in situ hybridization and immunofluorescence observations indicating that KCNQ4 is also expressed in IHCs (Beisel et al. 2000; Kharkovets et al. 2000). In guinea-pig OHCs IK,n becomes progressively larger towards the base of the cochlea (Mammano & Ashmore, 1996). In IHCs such a clear gradient is not evident, the currents being actually somewhat smaller in the base (Fig. 7G). As previously suggested for OHCs, IK,n may also be important in IHCs to provide an efficient exit route for K+ ions entering through the mechano-electrical transducer channels. The functional absence of these channels might lead to K+ accumulation in the hair cells. In addition, it is likely that the lack of IK,n in DFNA2 patients will cause IHCs to depolarize, increasing the activation of Ca2+ channels (Platzer et al. 2000; Moser & Beutner, 2000; Beutner & Moser, 2001) and, therefore, the resting discharge activity of the afferent nerve fibres. This may lead to excitotoxicity (Pujol et al. 1985). By comparing deactivating tail currents at −124 mV (−264 pA: asymptote of the fit in Fig. 7G) and scaling the OHC data, which were from a holding potential of −84 mV (−392 pA: asymptote of fit in Fig. 2B of Marcotti & Kros, 1999), to a holding potential of −64 mV (−584 pA: using the mean activation-curve parameters of IK,n as reported by Marcotti & Kros, 1999) we estimated the size of IK,n of IHCs to be 45 % of that of OHCs, nicely matching the respective sizes of the transducer conductance of IHCs and OHCs (Kros et al. 1992).
Acknowledgments
This work was supported by the Wellcome Trust and the MRC.
REFERENCES
- Anniko M. Cytodifferentiation of cochlear hair cells. Am J Otolaryngol. 1983;4:375–388. doi: 10.1016/s0196-0709(83)80043-x. [DOI] [PubMed] [Google Scholar]
- Beisel KW, Nelson NC, Delimont DC, Fritzsch B. Longitudinal gradients of KCNQ4 expression in spiral ganglion and cochlear hair cells correlate with progressive hearing loss in DFNA2. Mol Brain Res. 2000;82:137–149. doi: 10.1016/s0169-328x(00)00204-7. [DOI] [PubMed] [Google Scholar]
- Beutner D, Moser T. The presynaptic function of mouse cochlear inner hair cells during development of hearing. J Neurosci. 2001;21:4593–4599. doi: 10.1523/JNEUROSCI.21-13-04593.2001. [DOI] [PMC free article] [PubMed] [Google Scholar]
- Echteler SM. Developmental segregation in the afferent projections to mammalian auditory hair cells. Proc Natl Acad Sci U S A. 1992;89:6324–6327. doi: 10.1073/pnas.89.14.6324. [DOI] [PMC free article] [PubMed] [Google Scholar]
- Ehret G. Masked auditory thresholds, critical ratios, and scales of the basilar membrane of the housemouse (Mus musculus) J Comp Physiol. 1975;103:329–341. [Google Scholar]
- Glowatzki E, Fuchs PA. Cholinergic synaptic inhibition of inner hair cells in the neonatal mammalian cochlea. Science. 2000;288:2366–2368. doi: 10.1126/science.288.5475.2366. [DOI] [PubMed] [Google Scholar]
- Housley GD, Ashmore JF. Ionic currents of outer hair cells isolated from the guinea-pig cochlea. J Physiol. 1992;448:73–98. doi: 10.1113/jphysiol.1992.sp019030. [DOI] [PMC free article] [PubMed] [Google Scholar]
- Kandler K, Friauf E. Development of electrical membrane properties and discharge characteristics of superior olivary complex neurons in fetal and postnatal rats. Eur J Neurosci. 1995;7:1773–1790. doi: 10.1111/j.1460-9568.1995.tb00697.x. [DOI] [PubMed] [Google Scholar]
- Kharkovets T, Hardelin JP, Safieddine S, Schweizer M, El-Amraoui A, Petit C, Jentsch TJ. KCNQ4, a K+ channel mutated in a form of dominant deafness, is expressed in the inner ear and the central auditory pathway. Proc Natl Acad Sci U S A. 2000;97:4333–4338. doi: 10.1073/pnas.97.8.4333. [DOI] [PMC free article] [PubMed] [Google Scholar]
- Kros CJ. Physiology of mammalian cochlear hair cells. In: Dallos P, Popper AN, Fay RR, editors. The Cochlea. New York: Blackwell Science Inc; 1996. pp. 318–385. [Google Scholar]
- Kros CJ, Crawford AC. Potassium currents in inner hair cells isolated from the guinea-pig cochlea. J Physiol. 1990;421:263–291. doi: 10.1113/jphysiol.1990.sp017944. [DOI] [PMC free article] [PubMed] [Google Scholar]
- Kros CJ, Ruppersberg JP, Rüsch A. Expression of a potassium current in inner hair cells during development of hearing in mice. Nature. 1998;394:281–284. doi: 10.1038/28401. [DOI] [PubMed] [Google Scholar]
- Kros CJ, Rüsch A, Richardson GP. Mechano-electrical transducer currents in hair cells of the cultured neonatal mouse cochlea. Proc R Soc Lond B. 1992;249:185–193. doi: 10.1098/rspb.1992.0102. [DOI] [PubMed] [Google Scholar]
- Kubisch C, Schroeder BC, Friedrich T, Lütjohann B, El-Amraoui A, Marlin S, Petit C, Jentsch TJ. KCNQ4, a novel potassium channel expressed in sensory outer hair cells, is mutated in dominant deafness. Cell. 1999;96:437–446. doi: 10.1016/s0092-8674(00)80556-5. [DOI] [PubMed] [Google Scholar]
- Lenoir M, Shnerson A, Pujol R. Cochlea receptor development in the rat with emphasis on synaptogenesis. Anat Embryol. 1980;160:253–262. doi: 10.1007/BF00305106. [DOI] [PubMed] [Google Scholar]
- Lim DJ, Anniko M. Developmental morphology of the mouse inner ear. A scanning electron microscopic observation. Acta Otolaryngol Suppl. 1985;422:1–69. [PubMed] [Google Scholar]
- Maffei L, Galli-Resta L. Correlation in the discharges of neighboring rat retinal ganglion cells during prenatal life. Proc Natl Acad Sci U S A. 1990;87:2861–2864. doi: 10.1073/pnas.87.7.2861. [DOI] [PMC free article] [PubMed] [Google Scholar]
- Mammano F, Ashmore JF. Differential expression of outer hair cell potassium currents in the isolated cochlea of the guinea-pig. J Physiol. 1996;496:639–646. doi: 10.1113/jphysiol.1996.sp021715. [DOI] [PMC free article] [PubMed] [Google Scholar]
- Marcotti W, Géléoc GSG, Lennan GWT, Kros CJ. Developmental expression of an inwardly rectifying potassium conductance in inner and outer hair cells along the mouse cochlea. Pflugers Arch. 1999;439:113–122. doi: 10.1007/s004249900157. [DOI] [PubMed] [Google Scholar]
- Marcotti W, Kros CJ. Developmental expression of the potassium current IK,N contributes to maturation of the mouse outer hair cells. J Physiol. 1999;520:653–660. doi: 10.1111/j.1469-7793.1999.00653.x. [DOI] [PMC free article] [PubMed] [Google Scholar]
- Meister M, Wong RO, Baylor DA, Shatz CJ. Synchronous bursts of action potentials in ganglion cells of the developing mammalian retina. Science. 1991;252:939–943. doi: 10.1126/science.2035024. [DOI] [PubMed] [Google Scholar]
- Moody WJ. Control of spontaneous activity during development. J Neurobiol. 1998;37:97–109. doi: 10.1002/(sici)1097-4695(199810)37:1<97::aid-neu8>3.0.co;2-3. [DOI] [PubMed] [Google Scholar]
- Moser T, Beutner D. Kinetics of exocytosis and endocytosis at the cochlear inner hair cell afferent synapse of the mouse. Proc Natl Acad Sci U S A. 2000;97:883–888. doi: 10.1073/pnas.97.2.883. [DOI] [PMC free article] [PubMed] [Google Scholar]
- Mostafapour SP, Cochran SL, Del Puerto NM, Rubel EW. Patterns of cell death in mouse anteroventral cochlear nucleus neurons after unilateral cochlea removal. J Comp Neurol. 2000;426:561–571. doi: 10.1002/1096-9861(20001030)426:4<561::aid-cne5>3.0.co;2-g. [DOI] [PubMed] [Google Scholar]
- Platzer J, Engel J, Schrott-Fischer A, Stephan K, Bova S, Chen H, Zheng H, Striessnig J. Congenital deafness and sinoatrial node dysfunction in mice lacking class D L-type Ca2+ channels. Cell. 2000;102:89–97. doi: 10.1016/s0092-8674(00)00013-1. [DOI] [PubMed] [Google Scholar]
- Pujol R, Lavigne-Rebillard M, Lenoir M. Development of sensory and neural structures in the mammalian cochlea. In: Rubel EW, Popper AN, Fay RR, editors. Development of the Auditory System. New York: Blackwell Science Inc; 1998. pp. 146–192. [Google Scholar]
- Pujol R, Lenoir M, Robertson D, Eybalin M, Johnstone BM. Kainic acid selectively alters auditory dendrites connected with cochlear inner hair cells. Hear Res. 1985;18:145–151. doi: 10.1016/0378-5955(85)90006-1. [DOI] [PubMed] [Google Scholar]
- Ratto GM, Robinson DW, Yan B, McNaughton PA. Development of the light response in neonatal mammalian rods. Nature. 1991;351:654–657. doi: 10.1038/351654a0. [DOI] [PubMed] [Google Scholar]
- Ruben RJ. Development of the inner ear of the mouse: a radioautographic study of terminal mitosis. Acta Otolaryngol Suppl. 1967;220:1–44. [PubMed] [Google Scholar]
- R, übsamen R, Lippe WR. The development of cochlear function. In: Rubel EW, Popper AN, Fay RR, editors. Development of the Auditory System. New York: Blackwell Science Inc; 1998. pp. 193–270. [Google Scholar]
- Ryugo DK. The auditory nerve: peripheral innervation, cell body morphology, and central projections. In: Webster DB, Popper AN, Fay RR, editors. The Mammalian Auditory Pathway: Neuroanatomy. New York: Blackwell Science Inc; 1992. pp. 23–65. [Google Scholar]
- Sanes DH. The development of synaptic function and integration in the central auditory system. J Neurosci. 1993;13:2627–2637. doi: 10.1523/JNEUROSCI.13-06-02627.1993. [DOI] [PMC free article] [PubMed] [Google Scholar]
- Shatz CJ, Stryker MP. Prenatal tetrodotoxin infusion blocks segregation of retinogeniculate afferents. Science. 1988;242:87–89. doi: 10.1126/science.3175636. [DOI] [PubMed] [Google Scholar]
- Sher AE. The embryonic and postnatal development of the inner ear of the mouse. Acta Otolaryngol Suppl. 1971;285:1–77. [PubMed] [Google Scholar]
- Shnerson A, Devigne C, Pujol R. Age-related changes in the C57BL/6J mouse cochlea. II. Ultrastructural findings. Dev Brain Res. 1982;2:77–88. doi: 10.1016/0165-3806(81)90060-2. [DOI] [PubMed] [Google Scholar]
- Sobkowicz HM. The development of innervation in the organ of Corti. In: Romand R, editor. Development of Auditory and Vestibular Systems 2. Amsterdam: Blackwell Science Inc; 1992. pp. 59–100. [Google Scholar]
- Tierney TS, Russell FA, Moore DR. Susceptibility of developing cochlear nucleus neurons to deafferentation-induced death abruptly ends just before the onset of hearing. J Comp Neurol. 1997;378:295–306. doi: 10.1002/(sici)1096-9861(19970210)378:2<295::aid-cne11>3.0.co;2-r. [DOI] [PubMed] [Google Scholar]
- Walsh EJ, McGee J. Rhythmic discharge properties of caudal cochlear nucleus neurons during postnatal development in cats. Hear Res. 1988;36:233–247. doi: 10.1016/0378-5955(88)90065-2. [DOI] [PubMed] [Google Scholar]
- Wu SH, Oertel D. Maturation of synapses and electrical properties of cells in the cochlear nuclei. Hear Res. 1987;30:99–110. doi: 10.1016/0378-5955(87)90187-0. [DOI] [PubMed] [Google Scholar]