

Abstract
Synaptic potentiation induced by high frequency stimulation was investigated by recording field excitatory postsynaptic potentials (f-EPSPs) in rat hippocampal slices. Potentiation consisted of a transient period of decaying f-EPSPs (short-term potentiation, STP) that led to a plateau of continuously potentiated f-EPSPs (long-term potentiation, LTP). Here we show that a previously unknown type of transient, use-dependent, long-lasting potentiation (t-LTP) can account for STP. t-LTP could be stored for more than 6 h and its decay was caused by synaptic activation. Both the expression and the decay of t-LTP were input specific. t-LTP was induced differently from conventional LTP in that the amplitude of t-LTP was dependent upon the stimulation frequency, whereas the magnitude of LTP was dependent on the number of stimuli in the induction train. The decay of t-LTP could not be prevented by the blockage of glutamate receptors, but was prevented by the blockage of stimulus-evoked neurotransmitter release, suggesting that t-LTP is expressed presynaptically. Paired-pulse stimulation experiments showed that the decay of t-LTP was mediated by a decrease in the probability of neurotransmitter release. The decline of t-LTP could be prolonged by the activation of NMDA receptors. Hence, both single and paired-pulse stimuli prolonged the decline of the t-LTP. This decline could be prevented by high frequency burst stimulation (200 Hz). We conclude that t-LTP allows dynamic modulation of synaptic transmission by providing not only spatial association but also temporal convergence between synaptic inputs. Therefore, t-LTP might be a substrate for the encoding of synaptic memory.
Long-term potentiation (LTP), which was first described in 1973 (Bliss & Lomo, 1973), is currently the main model of long-lasting synaptic memory in the mammalian brain. Potentiation, defined as an increase in synaptic efficacy, is readily induced by high frequency stimulation (HFS) of the synapses between the Schaffer collaterals and the pyramidal cells in the hippocampus CA1 area (Collingridge & Bliss, 1995; Malenka & Nicoll, 1999). This increase can be evaluated in terms of changes in the rate of rise of extracellulary recorded field excitatory postsynaptic potentials (f-EPSPs, Andersen et al. 1980). Potentiation, induced by HFS, has three phases: (1) a second-long phase of decaying f-EPSPs termed post-tetanic potentiation (PTP) that is followed by (2) a longer lasting (30–60 min) period of a slow decrease in synaptic efficacy. The latter phase leads to (3) a plateau of potentiated field potentials (LTP). The slow decay of potentiation is usually termed short-term potentiation (STP) or early LTP (e-LTP) and has been considered to be an epiphenomenon of LTP induction.
Post-tetanic potentiation is caused by a presynaptic accumulation of Ca2+ during tetanisation and the rapid decay of PTP reflects the clearance of the Ca2+ from the presynaptic terminals (Stevens et al. 1994; Zucker, 1999). Differently from PTP, the induction of both STP and LTP can be blocked by N-methyl-D-aspartate (NMDA) receptor antagonists (Collingridge et al. 1983; Anwyl et al. 1989; Stevens et al. 1994; Tsien et al. 1996). Activation of NMDA receptors leads to a subsequent influx and rise in the postsynaptic levels of Ca2+, which is obligatory for the induction of both STP and LTP (Malenka et al. 1988; Anwyl et al. 1988; Malenka et al. 1992).
The nature of STP and its relationship to LTP remains under discussion. Two main hypotheses explaining STP have been put forward. According to the first view, the transient phase is an unstable phase of LTP that leads to a consolidation of potentiation (Gustafsson & Wigstrom, 1990; Hanse & Gustafsson, 1994). In contrast, it has also been suggested that the transient phase might be different from the stable phase of LTP (Kauer et al. 1988; Schulz & Fitzgibbons, 1997). Studies, which compare the two phenomena, imply that STP and LTP have a different threshold for their induction in that different numbers of high frequency stimuli are needed to induce STP and LTP (e.g. Schulz & Fitzgibbons, 1997). Nevertheless, the mechanistic nature of STP and its role in synaptic encoding are unknown. Notably, a phenomenon that resembles STP (and not LTP) has been observed after exploratory learning in rats (Moser et al. 1993, 1994) but no further attempts have been made to explain how STP can be involved in the formation of memories.
We have investigated potentiation induced by HFS in the CA1 area of rat hippocampal slices and demonstrate here that STP, the transient phase of synaptic potentiation, is a previously unknown type of long-lasting potentiation. This transient LTP (t-LTP) can be stored for many hours in an input-specific manner and its disappearance is caused by synaptic activation. t-LTP is induced differently from the sustained type of LTP (s-LTP) in that the amplitude of t-LTP is dependent on the frequency of tetanisation whereas the amplitude of s-LTP is dependent on the number of stimuli that are used during a tetanus. We further examined the site for synaptic expression of t-LTP and found that its induction depends on NMDA receptor activation during tetanisation. We also found that the induction of t-LTP decreases the ability of synapses to express paired-pulse facilitation and that the decline of t-LTP is accompanied by concomitant increases in the amount of paired-pulse facilitation in synaptic populations. The decay of t-LTP, furthermore, requires presynaptic influx of calcium, and blockage of glutamate receptors during test stimulation cannot prevent this decay. When taken together these results show that t-LTP, in a population of synapses, is a consequence of an increase in the probability of neurotransmitter release and that the decay of t-LTP is explained by a decrease in the probability of neurotransmitter release. We further show that the decay of t-LTP is dynamically regulated by NMDA- receptor activation during test stimulation. Therefore, the amount of t-LTP that is present at any given time after its induction depends on a balance between a use-dependent reduction in the probability of neurotransmitter release and a concurrent re-induction of potentiation via the activation of NMDA receptors.
METHODS
Subjects
One hundred and eighty-eight adult (73 ± 0.9 days old, 316 ± 3 g) male Wistar rats were used in the study and all experiments were conducted according to national and EU guidelines for animal care.
Slice preparation
The rats were deeply anaesthetised with halothane and killed by decapitation. The hippocampi were dissected from the brain and cooled down in Hepes-buffered saline solution (0–4 °C) consisting of (mM): 5 Hepes, 124 NaCl, 3.5 KCl, 1.25 NaH2PO4, 2 CaCl2, 2 MgSO4 and 26 NaHCO3, saturated with 95 % O2-5 % CO2. Slices of the septal end of the hippocampus (400 μm thick) were cut on a McIllwain tissue chopper and incubated at room temperature in the Hepes solution for at least 2 h before they were transferred to the recording chamber. During the experiments the slices were submerged in a medium that was heated to 33 °C. The medium consisted of (mM): 124 NaCl, 3.5 KCl, 1.25 NaH2PO4, 2 CaCl2, 2 MgSO4, 26 NaHCO3, equilibrated with 95 % O2-5 % CO2 at 37 °C. In the experiments in which a calcium-free medium (Ca2+-free) was used calcium was replaced by equimolar concentrations of MgSO4.
Chemicals and their application
The chemicals used were obtained from Sigma, with the exception of D(-)-2-amino-5-phosphonopentanoic acid (D-AP5), DL-2-amino-5-phosphonovaleric acid (DL-AP5), 2,3-dioxo-6-nitro-1,2,3,4-tetrahydrobenzo[f]quinoxaline-7-sulphonamide disodium (NBQX), (αS)-α-amino-α[(1S,2S)-2-carboxy -cyclopropyl-9H-xanthine-9-propanoic acid (LY341495), 4-hydroxyquinoline-2-carboxylic acid (kynurenate) and picrotoxin, which were obtained from Tocris. Kynurenate and picrotoxin were added directly to the perfusion medium before use. Other chemicals were prepared as stock solutions, stored frozen and added to the perfusion medium as indicated in Results.
Experimental procedures
The Schaffer collaterals were stimulated with a bipolar tungsten electrode placed on the border between the areas CA1 and CA2 using a stimulus isolation unit (A385, WPI) and a pulse generator (Master 8, A.M.P.I). The stimulus duration was always 100 μs and the stimulation current (150–450 μA) was fixed to three times threshold for evoking f-EPSPs in the CA1-B area of the stratum radiatum, if not stated otherwise. The f-EPSPs were recorded with glass electrodes that were filled with saline solution (3–5 MΩ). The signals were amplified using an Axoclamp 2B amplifier (Axon Instruments, Inc.) and filtered at 10 kHz (Cyber Amp 380, Axon Instruments, Inc.). Stimulus-evoked f-EPSPs were digitised (Digidata 1200b, Axon Instruments, Inc.) and recorded on a PC using pCLAMP software (Axon Instruments, Inc.).
Test stimulation during the control periods of the experiments was given once every 15 s. Tetanisation was given as theta-burst stimulation (four stimuli at 100 Hz, repeated 10 times, with a frequency of 5 Hz) that was routinely used to induce potentiation. Other induction protocols were used also and are described in the appropriate Results sections. Averages of four f-EPSPs were acquired at 2 min post-tetanus in order to estimate the maximal amounts of NMDA receptor-dependent potentiation (Pmax) in slices. The subsequent frequencies and patterns of the test stimulation were dependent on the experimental hypothesis. For convenience, low frequency test stimulation is given as a fraction of times per number of seconds (e.g. 1/15 s = 0.67 Hz). Field responses were recorded as averages of four responses to stimulation (four pairs when paired-pulse stimulation was applied).
'Two pathway' experiments were performed by placing an additional stimulation electrode in the CA1-C area of the Schaffer collaterals (on the border of the subiculum). The two stimulation electrodes were activated alternately once every 15 s with stimuli separated by 7.5 s in order to stimulate two separate synaptic populations. Crosstalk between synaptic populations was minimised by assuring that there was no paired-pulse facilitation when stimuli were separated by 80 ms.
Data analysis and plotting
In our analysis of the experiments the rates of rise of the f-EPSPs were measured as the deflections of the slopes of the f-EPSPs at the points after the termination of the afferent fibre volleys (AVs) divided by the time interval from the peaks of the AVs to the measured points on the f-EPSPs. Data, obtained in the individual experiments, were normalised to their respective control periods that were set to 100 %. The actual gain in synaptic transmission (potentiation) was expressed as the amplitude of potentiation by subtracting the control level (100 %) from the normalised rising rates of the f-EPSPs. This permitted direct comparison and statistical evaluation of the initial, the transient and the sustained amplitudes of potentiation.
Experimental results are visualised by charts of the amplitudes of potentiation, which are plotted over time. The data are presented in terms of experimental group averages. Single data points show the mean values of the groups and the error bars show the standard errors of the mean values (s.e.m.). The data are plotted with a time interval of 2 min after the induction of potentiation. Note that the average potentiation in the control periods is zero (no gain in synaptic transmission).
The amplitudes of the transient and of the sustained phases of potentiation, and the decay time constants of the transient phases, were determined by applying a mono-exponential fitting routine (Levenberg-Marquardt method) to data in the individual experiments. The mean estimated amplitudes of the different phases of potentiation and the mean decay time constants of the transient phases, which were obtained in different experimental groups, are summarised in histograms (±s.e.m.) throughout the Results. Dashed bars in the histograms indicate that an experimental group has been shown in one of the preceding figures and is now reproduced in the particular histogram for the purposes of comparison.
Analysis, statistical evaluation and graphical representation of the data were performed with Platin (a custom-built software package), Excel (Microsoft) and SPSS (SPSS Inc.). Student's (two-tailed, either paired or unpaired) t test, ANOVA and the Kolmogorov-Smirnov test were used for statistical comparisons. If not otherwise stated, unpaired t tests were used for the statistics. Significant differences are indicated in the histograms by asterisks (* P < 0.05; **P < 0.01; ***P < 0.001).
RESULTS
NMDA receptor-dependent potentiation in the CA1 area of the hippocampus
The field response in the stratum radiatum of the CA1 area of the hippocampus is a compound waveform. It consists of the sum of an afferent fibre volley (AV) and a f-EPSP. It also reflects somatic spiking in a form of an inverted population spike (PS). Therefore, the basic concern of any extracellular study of potentiation of synaptic transmission is the extent to which the rising phase of a f-EPSP can be isolated from both the AV and the population spike in order to quantify changes in synaptic transmission in a given experimental situation.
In order to investigate the above, field responses were evoked by stimulating the Schaffer collaterals and recorded in the stratum radiatum (st.r.) and the stratum pyramidale (st.p.) of the CA1 area (Fig. 1A). After a recording of a stable period of the control responses (Fig. 1Aa) synaptic transmission was potentiated by theta-burst stimulation (tetanisation, see inset, Fig. 1B). Potentiation did not affect the initial slopes of the AVs and their peaks did not change (Fig. 1Ab-d). However, potentiation increased the amplitudes and reduced the latencies of the f-EPSPs when compared with those of the control. Similarly, the amplitudes of the population spikes were enhanced and their latencies were reduced.
Figure 1. Potentiation in the CA1 area of the hippocampus.
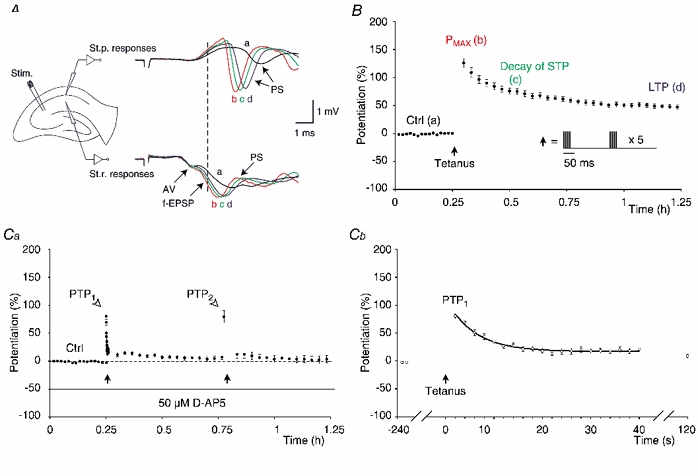
A, schematic illustration of the experimental situation that was used to study potentiation of synaptic transmission in the CA1 area of hippocampal slices. The stimulation electrode was placed in the Schaffer collaterals on the border between the areas CA1 and CA2. Recording electrodes were placed in the stratum pyramidale (St.p.) and the stratum radiatum (St.r.) of the CA1 area in order to record the population spikes and the field excitatory postsynaptic potentials, respectively. The waveforms, recorded before and after tetanisation of the Schaffer collaterals, are shown on the right of the corresponding recording electrodes. Their labelling and colours correspond to different time points before and after the tetanisation: ‘a’ before tetanisation (black), ‘b’ 2 min after the tetanisation (red), ‘c’ 15 min post-tetanus (green), ‘d’ 1 h post-tetanus (blue). Three components of the waveforms are indicated by the arrows: (1) the afferent fibre volley (AV), (2) the field excitatory postsynaptic potential (f-EPSP) and (3) the population spike (PS). The points of the initial rising phase of the f-EPSPs (indicated by the dashed line through the stratum radiatum responses) that were neither affected by the afferent volley nor by the population spikes were used to calculate changes in synaptic transmission. The calibration bar is shown in the inset. B, a group of experiments (n = 16, • mean estimates of potentiation, the error bars indicate s.e.m.) depicting the control level of synaptic transmission (Ctrl), the initial amounts of potentiation at 2 min post-tetanus (Pmax, 128 ± 8.8 %), the decay of STP (81 ± 6.7 %) and the LTP (47 ± 3.7 %). Potentiation of synaptic transmission was calculated by subtracting the 100 % level from the relative change in synaptic transmission. The amplitudes of STP were estimated by subtracting the amplitudes of the LTP from those of the Pmax in the individual experiments. Labelling and colours correspond to the sample waveforms in A. Filled arrow indicates the time of tetanisation and the tetanisation protocol, consisting of a number of theta-bursts, is depicted in the inset. Ca, in this group of experiments (n = 16) 50 μM D-AP5 (indicated by the continuous line) was applied in order to isolate the PTP. The amplitude of PTP (open arrowhead) was estimated at 2 s after the first tetanisation (left filled arrow) and amounted to 80 ± 4.9 % (PTP1). Twenty stimuli were then delivered at a frequency of 0.5 Hz. The stimulation was then resumed at 2 min post-tetanus (8 ± 3.9 %) and the decline in potentiation was followed for 30 min (6 ± 3.7 %). The slices were tetanised again (right filled arrow) and the amplitude of PTP2 was estimated after 2 s (80 ± 11.0 %). The stimulation was resumed at 2 min post-tetanus (9 ± 6.9 %) and the potentiation was followed for the next 30 min (3 ± 6.9 %). The dashed line indicates the control level. Cb, the decay of the PTP1 (from Ca) is shown on another time-scale (○). PTP1 declined in a mono-exponential manner (continuous line) with a time constant (τ) of 6.2 ± 0.5 s.
On the basis of the above we concluded that the post-tetanic population spikes might affect the peaks of the f-EPSPs rather than their initial phases (Fig. 1A, illustrated in Fig. 11 too). We knew also that AVs are nearly symmetrical around their peaks (see sample traces in Fig. 9 and Fig. 10). Hence, the efficacy of synaptic transmission can be quantified by measuring the deflection of the f-EPSP at the point immediately after the termination of the AV, which is not affected by the population spikes (indicated by the dashed line). To do that, we estimated the rate of rise of the control f-EPSP in terms of the deflection of the slope of the f-EPSP (at the point just after the termination of the AV). This amplitude was then divided by the time interval from the peak of the AV to the point that was measured on the f-EPSP. Relative changes in synaptic transmission were evaluated on a 100 % scale in this and all the subsequent experiments. This was done by normalising the initial rising rates of the post-tetanic f-EPSPs (Fig. 1A), which were calculated at the same latency as the control rising rates, to their respective pre-tetanic controls. The actual gain in synaptic transmission (potentiation) was calculated by subtracting the 100 % level (Fig. 1B).
Figure 11. Measurement of paired-pulse facilitation.
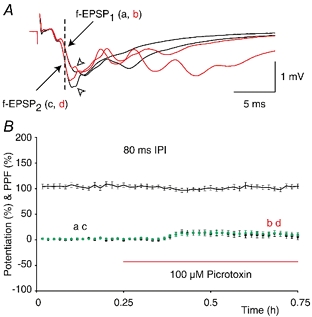
A, superimposed f-EPSPs (indicated by the two arrows) from an experiment in which paired-pulse (PP) stimulation was given with an inter-pulse interval (IPI) of 80 ms. Black waveforms show control f-EPSP1 (a) and f-EPSP2 (c) in standard medium. Red waveforms (b and d) show the respective potentials after the application of the GABAA receptor antagonist picrotoxin (100 μM). The dashed line indicates the point on the initial rising phase of the f-EPSPs that was used to analyse this and other experiments (as described in Fig. 1). The open arrowheads point to the decreases in amplitudes of the f-EPSPs that were caused by the application of picrotoxin. Calibration bar is shown in the inset. B, a group of experiments in which the effects of the picrotoxin on PPF were established (n = 16, IPI = 80 ms). Picrotoxin (100 μM) was applied at the time indicated by the red continuous line. The letter labels correspond to the sample waveforms presented in A. PPF, shown by the black continuous line (±s.e.m.), was 104 ± 3.6 % in control conditions and 103 ± 3.7 % after the application of picrotoxin (P = 0.8, paired t test). The • show potentiation of f-EPSP1 (9 ± 5.4 %) whereas the green circles show the potentiation of f-EPSP2 (11 ± 4.7 %). The two potentiations were similar (P = 0.6, paired t test).
Figure 9. Glutamate receptor antagonists do not prevent decay of transient LTP.
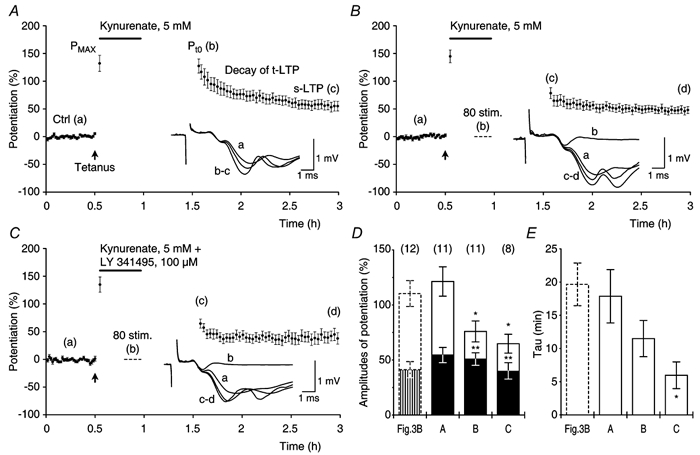
A, experiments (n = 12) in which t-LTP and s-LTP were induced by theta-burst stimulation (filled arrow). After the induction of potentiation Pmax was recorded (132 ± 14.6 %) and kynurenate (5 mM, continuous line) was applied for 25 min and then washed out (35 min). After the wash-out of kynurenate potentiations were: Pt0 = 121 ± 13.3 %, t-LTP = 67 ± 14.1 % and s-LTP = 55 ± 6.9 %. The τ of t-LTP was 18 ± 4.0 min. B, similar to A except that a series of 80 test stimuli (1/7.5 s, dashed line) were delivered in the presence of kynurenate. 5 mM kynurenate blocked f-EPSPs 15 min after its application (inset trace b). Note that the amplitude of t-LTP was reduced compared with that in A, when tested after the wash-out of kynurenate. Pmax = 145 ± 11.4 %, Pt0 = 76 ± 9.5 %, t-LTP = 26 ± 5.3 %, s-LTP = 51 ± 5.7 % and τ of t-LTP = 11.5 ± 2.7 min. C, similar to B except that the metabotropic glutamate receptor antagonist LY341495 (100 μM) was applied together with kynurenate. Pmax = 135 ± 13.8 %, Pt0 = 64 ± 8.5 %, t-LTP = 25 ± 8.2 %, s-LTP = 40 ± 7.5 % and τ of t-LTP = 6.0 ± 2.0 min. D, Pt0, t-LTP and s-LTP in the control experiments (Fig. 3B) were compared with the respective amplitudes of potentiation in A, B and C. Application of kynurenate in A (A) did not affect the amplitudes of potentiation (P > 0.2, all cases). The experimental groups B and C showed lower Pt0 and t-LTP (P < 0.05, all cases), whereas the amplitudes of s-LTP were similar to those of the control (P > 0.2, in both cases). E, decay time constants of t-LTP for the experimental groups in D. Decay time constants in A (A) and B (B) were similar to those of the control (P > 0.07). The τ in C (C) was smaller than that of the control (P < 0.01).
Figure 10. Decrease of transient and sustained LTP in calcium-free medium.
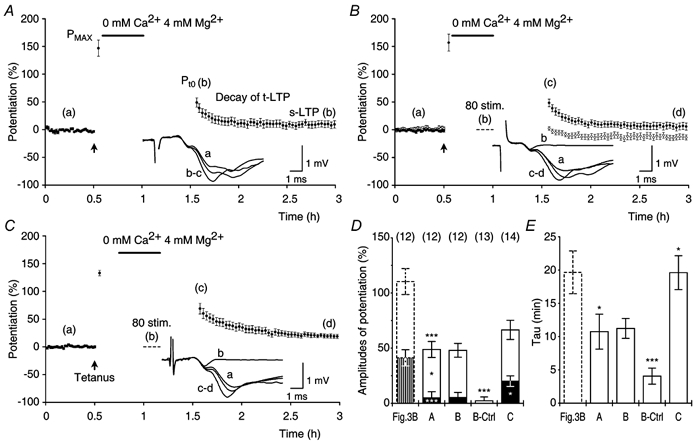
A, in a group of experiments (n = 12), potentiation was induced by theta-burst stimulation, Pmax (147 ± 14.6 %) was recorded and Ca2+-free medium was applied for 25 min (0 mM Ca2+, 4 mM Mg2+, filled bar). Potentiations, 35 min after returning to normal medium, were: Pt0 = 49 ± 7.2 %, t-LTP = 44 ± 6.0 %, s-LTP = 5 ± 5.6 % and τ of t-LTP = 10.7 ± 2.6 min. B, similar to A (•, n = 12) except that 80 stimuli (1/7.5 s) were delivered during the last 10 min of the exposure to Ca2+-free medium (dashed line, inset trace b). Pmax = 157 ± 15.3 %, Pt0 = 48 ± 6.3 %, t-LTP = 43 ± 4.2 %, s-LTP = 5 ± 4.6 % and τ of t-LTP = 11.2 ± 1.5 min. ○, experiments in which slices were not tetanised (n = 13). Testing, after returning to normal medium, revealed a small facilitation of f-EPSPs (2 ± 3.5 %) that decayed to a potentiation of −11 ± 5.1 % with a τ of 4.1 ± 1.2 min. C, a group of experiments (n = 14) in which, 15 min after tetanisation, Ca2+-free medium was applied for 25 min. Testing, 20 min after returning to normal medium, showed both t-LTP and s-LTP: Pmax = 133 ± 5.0 %, Pt0 = 67 ± 8.7 %, t-LTP = 46 ± 6.0 % and s-LTP = 20 ± 4.8 %. τ of t-LTP = 19.6 ± 2.5 min. D, the amplitudes of Pt0, t-LTP and s-LTP in A (A) were smaller than those in the standard experiments (Fig. 3B, P < 0.05, all cases). The amplitudes of potentiation after the application of 80 stimuli in B (B) were not different from those in A (A) (P ≥ 0.9, all cases). Estimates of the amount of potentiation in the experiments in which slices were not tetanised (B-Ctrl) were different from those recorded in B (B) (P < 0.0001, all cases). A later application of Ca2+-free medium in C (C) resulted in a larger s-LTP (P < 0.05) when compared with s-LTP in B (B), whereas Pt0 and t-LTP were not affected (P > 0.1, both cases). E, the τ of t-LTP in A (A) was smaller than that of the control (P < 0.05, Fig. 3B). Decay time constants in B (B) were similar to those in A (A) (P = 0.9) and larger than the decay time constants observed in experiments without tetanisation (P < 0.001, B-Ctrl). Decay time constants of t-LTP in C (C) were larger than those in A (A) and B (B) (P < 0.05, both cases).
Potentiation, measured 2 min after its induction by theta-burst stimulation in standard medium, was 128 ± 8.8 % (Pmax, n = 16, Fig. 1B). The potentiation declined hereafter and exposed the STP (81 ± 6.7 %). The decay of STP lasted for about 1 h before a sustained phase of potentiation was reached (LTP, 47 ± 3.7 %).
The main objective of this investigation was to describe STP and LTP, the induction of which is dependent on NMDA receptor activation during tetanisation. Post-tetanic potentiation (PTP) is another type of synaptic potentiation that can be induced in the CA1 area of the hippocampus by tetanisation. PTP is different from both STP and LTP in that its induction is independent of the NMDA receptor activation. It is observed immediately after tetanisation, declines over a relatively short period of time (Stevens et al. 1994) and reflects the clearance of Ca2+ that accumulates in the presynaptic terminals during the tetanisation (Zucker, 1999). Although it is believed that PTP declines rapidly we were interested in knowing the exact extent to which PTP might affect the measurements of STP and LTP in our experimental conditions.
The NMDA receptor antagonist D-AP5 (50 μM, Fig. 1Ca, n = 16) was applied in a group of experiments in order to investigate PTP in isolation from STP and LTP. After recording the control period, the slices were tetanised and 2 s after the tetanisation 20 stimuli were delivered at a frequency of 0.5 Hz. Then, the stimulation was stopped for 80 s and was resumed again at 2 min post-tetanus at the control frequency of 1/15 s. After a 30 min recording the slices were tetanised again (tetanus 2, Fig. 1Ca) and the amplitude of potentiation was estimated at 2 s after the tetanisation. The stimulation was then discontinued and resumed again at 2 min post-tetanus.
The results showed that 2 s after the first tetanisation, the amplitude of the PTP was 80 ± 4.9 % (PTP1, Fig. 1Ca). PTP declined in a mono-exponential fashion with a time constant of 6.2 ± 0.5 s (Fig. 1Cb) and 2 min after the tetanisation the amplitude of the potentiation was 8 ± 3.9 %. This amplitude was greater than the baseline (P = 0.05, paired t test) and, over the next 30 min, declined to 6 ± 3.7 %, which was not different from the baseline (P > 0.1). The second tetanisation induced PTP2 (80 ± 11.0 %), which was of a similar magnitude when compared with that of PTP1 (P > 0.9, paired t test, Fig. 1Ca). Two minutes after the second tetanisation, the amplitude of potentiation was 9 ± 6.9 % and similar to that induced by the first tetanisation (P = 1, paired t test). Potentiation declined to 3 ± 6.6 % after 30 min.
In summary, the data show that STP and LTP can be isolated from the PTP by delaying post-tetanic test stimulation for a few minutes and that little, if any, STP and LTP can be induced by tetanisation after blockage of NMDA receptors by AP5. The results also show that PTP declines rapidly and in a manner that is independent of the application of the test stimulation during the post-tetanic period.
Long-term storage of the transient phase of potentiation
We wanted to determine whether or not STP, like PTP, decayed over time. To do this, we estimated the amplitude of the initial potentiation (isolated from PTP) from an average of four f-EPSPs evoked 2 min after tetanisation (Pmax, Fig. 2A). We then introduced an additional delay in the post-tetanic test stimulation. Resuming the test stimulation after 1 h revealed a phase of potentiation that declined to a stable level of LTP. Both the transient phase of potentiation and the LTP were similar to those of the control (Fig. 2B). This indicates that, in contrast to PTP (Fig. 1Ca), both STP and LTP can be stored. It further suggests that the decay of STP is triggered by the application of the test stimulation. Because of this, terms such as short-term potentiation or early-LTP seem inadequate to describe the persistent nature of the transient phase of LTP. We have therefore decided to refer to this phase of LTP as ‘transient long-term potentiation' (t-LTP) throughout the rest of this article and refer to the stable phase of LTP as ‘sustained long-term potentiation' (s-LTP).
Figure 2. Transient and sustained phases of potentiation.
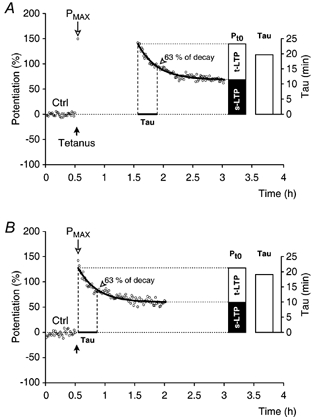
A, a single experiment (○) in which, after recording the control period (Ctrl), the slice was tetanised (theta-burst stimulation, filled arrow) and the mean amplitude of potentiation was recorded at 2 min post-tetanus (Pmax). Test stimulation (1/15 s) was then discontinued for a period of 1 h. After resuming the test stimulation, transient (t-LTP) and sustained (s-LTP) phases of synaptic potentiation were followed for a period of 1.5 h. Potentiation was fitted to a mono-exponential function (see text), which is shown superimposed on the data (thick line). Constants (Pt0, t-LTP, s-LTP and τ) that were estimated by the fitting are visualised in the histograms. B, an experiment similar to that in A except that the test stimulation was not delayed after the Pmax amplitude was recorded.
In a conventional analysis of LTP experiments, the amplitude of the sustained synaptic potentiation (s-LTP) is estimated from an average of its value at the end of a recording session (as in Fig. 1B). An estimate of this type is not suitable to describe the transient phase of long-term potentiation (t-LTP). From the individual experiments it appears that the transient phase of potentiation can be described by a mono-exponential function. The exponential decay function (P = s-LTP + t-LTP e-t/τ) could represent the individual data sets (Fig. 2A and B, thick line) given that t0 (time zero) was defined as the time when test stimulation was initiated (excluding the Pmax). A fitting routine was used to estimate the amplitude of the transient (t-LTP) and sustained (s-LTP) synaptic potentiation. Furthermore, it was also used to resolve the decay time constant of the transient phase (τ). The total amplitude of potentiation at time zero was Pt0 = t-LTP + s-LTP. Constants, which were derived by fitting the potentiation to the above function, are depicted in the histograms in Fig. 2A and B.
Groups of experiments, consisting of controls (i.e. 2 min delay before the test stimulation, Fig. 3A) and experiments with a delay of test stimulation after recording of Pmax (Fig. 3B and C, filled circles), were used to confirm the storage of the potentiation. Mean estimates of the constants obtained from fitting the mono-exponential function to the individual experiments (as in Fig. 2A and B) are summarised in Fig. 3D and E. These data and the mean estimates of Pmax were used to make statistical evaluations of different experimental situations.
Figure 3. Long-term storage of the transient phase of potentiation.
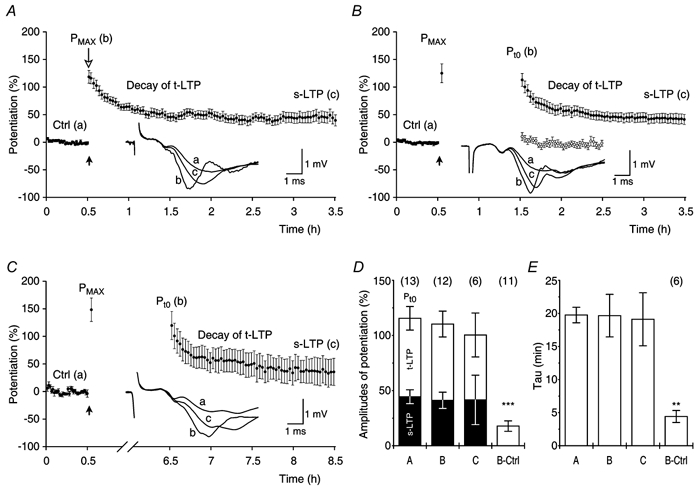
A, a group of 13 experiments in which potentiation of synaptic transmission was tested after a 2 min delay in test stimulation after tetanisation (as in Fig. 2B, ±s.e.m.). Mean amplitudes of potentiation that were estimated in the individual experiments were: Pmax = 118 ± 11.5 %, Pt0 = 116 ± 10.7 %, t-LTP = 71 ± 10.6 %, s-LTP = 44 ± 6.3 %. The τ of t-LTP was 20 ± 1.2 min. Averaged f-EPSPs, from the experiment in Fig. 2B, for the time periods as indicated by the letters, are displayed in the inset together with the calibration bar. B, in a group of 12 experiments the testing of potentiation was delayed for a period of 1 h (as in Fig. 2A) after recording the Pmax (•). Pmax = 125 ± 17.1 %, Pt0 = 110 ± 11.7 %, t-LTP = 69 ± 9.0 %, s-LTP = 41 ± 7.3 %. The τ of t-LTP was 20 ± 3.2 min. Averaged f-EPSPs, from the experiment in Fig. 2A, are displayed in the inset. ○, control experiments without tetanisation (n = 11). In these, resuming stimulation after 1 h revealed a small facilitation of the f-EPSPs (18 ± 4.7 %) that decayed (τ = 4.4 ± 0.9 min) to −6 ± 5.4 % of potentiation. C, experiments in which stimulation was discontinued for a period of 6 h (n = 6). In order to ensure a correct estimation of potentiation, single experiments in this group were adjusted for changes in the afferent fibre volley off-line. Pmax = 148 ± 21.3 %, Pt0 = 100 ± 19.9 %, t-LTP = 59 ± 9.7 %, s-LTP = 42 ± 22.4 % and τ of t-LTP = 19 ± 4.0 min. D, mean amplitudes of potentiation that were reached under the experimental conditions in A, B and C (±s.e.m.). Entire bars represent Pt0, filled bars s-LTP and open bars t-LTP (according to the histograms in Fig. 2). The amplitudes of potentiation in the experiments with either 1 h (B) or 6 h (C) delay in test stimulation after tetanisation, were not different from those in the control group (A, P ≥ 0.5, all cases). These amplitudes were different from those associated with facilitation of the f-EPSPs in the non-tetanised control (B-Ctrl, P < 0.0001, all cases). Group sizes are indicated in parentheses. E, decay time constants of t-LTP in B (B) or C (C) were not different from those in A (A, P ≥ 0.8, both cases) but were different from the τ values in experiments without tetanisation (B-Ctrl, P < 0.01, both cases). Note that only 6 of 11 non-tetanised experiments could be fitted by the mono-exponential function.
Initial potentiations (Pmax), recorded 2–4 min after tetanisation in the experimental groups (Fig. 3B and C), were similar to those of the control (Fig. 3A, P ≥ 0.2), indicating that the initial potentiations were uniformly expressed in the three experimental situations. In spite of the additional delay in the test stimulation in the experimental groups, the amplitudes of Pt0, t-LTP and s-LTP were not significantly different from those of the control (Fig. 3D). In addition, in all the groups t-LTP had a similar decay time constant of about 20 min (Fig. 3E). Varying the delay of test stimulation between 0.5 and 6 h did not change the expression of t-LTP.
It has been reported that a period without stimulation in magnesium-free medium can induce a transient form of synaptic potentiation (Niu et al. 1999). We therefore determined whether or not a silent period, under the experimental conditions used in our experiments, could induce potentiation. (Fig. 3B, open circles). In these experiments a small facilitation of the f-EPSPs was detected after a 1 h period without stimulation (18 ± 4.7 %, n = 11). In five out of the 11 experiments the fitting routine did not resolve a decay of potentiation. In the remaining six experiments the responses stabilised after 4.4 ± 0.9 min. Both the facilitation of the f-EPSPs and the decay time constants, which were estimated by the fitting routine, were different from the respective estimates of the tetanus-induced potentiation (P < 0.01, Fig. 3D and E).
We also determined whether or not the apparent decrease in the total amplitude of potentiation (Pt0, Fig. 3C) represented a true reduction of potentiation over time or, alternatively, could be explained as a run down. The reduction of potentiation was evaluated in terms of the difference between Pmax and the total potentiation obtained from our fitting routines (Pmax - Pt0) in the individual experiments. A slight decrease in Pt0 was observed in the standard experiments (2.9 ± 3.7 %) in which potentiation was tested with a 2 min delay in test stimulation. Pt0 was further reduced when potentiation was tested after a 1 h delay (14.7 ± 13.5 %, P = 0.4) and a significant decrease was seen in experiments in which testing was delayed for 6 h (47.9 ± 14.0 %, P < 0.001). In the experiments in which there was no tetanisation, the rate of rise of f-EPSPs was reduced by 6.0 ± 5 % to a potentiation of −6 % (Fig. 3B, open circles) during an experimental period of 2 h. The run down of approximately 3 % per hour, together with an increased variance in the long-lasting experiments, may account for some of the reduction of the total amplitude of potentiation.
In summary, our data show that the transient phase of LTP can be preserved over a relatively long period of time (> 6 h). This long-term storage of synaptic potentiation outlasts the time course of protein synthesis-dependent consolidation of the sustained phase of LTP (Frey et al. 1988; Frey & Morris, 1998).
Decay of transient long-term potentiation is dependent on post-tetanic control stimulation
The results of the above experiments demonstrate that t-LTP can be stored for long periods of time and imply that its decline is caused by post-tetanic test stimulation. In order to test the latter, the decay of t-LTP was investigated by applying test stimulation at frequencies of 1/7.5 s (Fig. 4A) and 1/30 s (Fig. 4B). The data were compared with those from the standard experiments in which the post-tetanic stimulation was given at 1/15 s (Fig. 3A).
Figure 4. Transient LTP decays in an activity dependent manner.
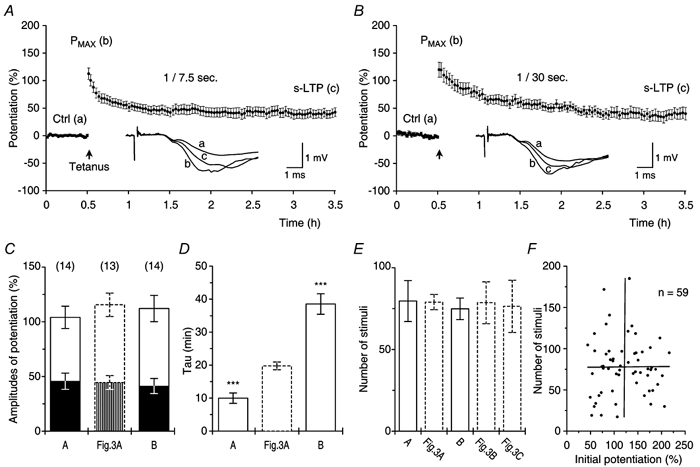
A, potentiation, induced by theta-burst stimulation (filled arrow), was investigated with test stimuli delivered once every 7.5 s (n = 14) and resulted in Pt0 = 104 ± 10.2 %, t-LTP = 58 ± 7.7 %, s-LTP = 46 ± 7.4 %. The τ of t-LTP was 10 ± 1.6 min. B, potentiation tested with test stimulation delivered once every 30 s (n = 14). Pt0 = 112 ± 12.0 %, t-LTP = 71 ± 8.6 %, s-LTP = 41 ± 6.9 %. The τ of t-LTP was 39 ± 3.1 min. C, no differences were found between the amplitudes of potentiation (Pt0, t-LTP and s-LTP) in A (A) and B (B) and those in standard experiments tested at 1/15 s (Fig. 3A, P ≥ 0.3 in all cases). Data, imported from the preceding figures, are presented as dashed bars in this and all the following histograms. D, the decay time of t-LTP, tested without a delay in stimulation, was inversely related to the frequency of test stimulation. The τ of t-LTP tested at 1/7.5 s (A), and the τ of t-LTP tested at 1/30 s (B), were different from the τ of t-LTP tested at 1/15 s (Fig. 3A, P < 0.0001, both cases). E, the mean numbers of stimuli that were needed to reduce t-LTP to 37 % of its amplitude were constant: A, 79.7 ± 12.6 stimuli at 1/7.5 s; Fig. 3A, 79.0 ± 4.7 stimuli at 1/15 s; B, 74.9 ± 6.6 stimuli at 1/30 s; t-LTP tested at 1/15 s, with a delay in test stimulation for either 1 h (Fig. 3B) or 6 h (Fig. 3C), was reduced to 37 % of its amplitude in response to 78.6 ± 12.9 stimuli and 76.4 ± 16.0 stimuli, respectively. F, the numbers of stimuli needed to decrease t-LTP to 37 % of its amplitude were not correlated (P = 0.9, ANOVA, R = 0.01) to the amount of initial potentiation (Pmax).
Analysis of the group with the faster test stimulation (1/7.5 s) showed that the decay time of t-LTP decreased twofold in comparison with that of the control group (P < 0.0001, Fig. 4D). We found no differences between the amplitudes of Pt0 or between the amplitudes of t-LTP and s-LTP when compared between the two groups (P > 0.3, all cases, Fig. 4C). The results from the experiments with slow test stimulation (1/30 s), in contrast to the preceding results, showed a twofold increase in the decay time of t-LTP, when compared with that of the control (P < 0.0001, Fig. 4D). Pt0, and the amplitudes of t-LTP and s-LTP were again not different from those of the control (P > 0.7, Fig. 4C). In conclusion, the results showed that the decay time of t-LTP was inversely related to the frequency of stimulation during the post-tetanic test period (Fig. 4D).
We estimated the number of stimuli that were needed to decay t-LTP to 37 % of its maximal amplitude (Fig. 4E). Irrespective of either the stimulation frequency (Fig. 3A, Fig. 4A and B) or the length of the time periods during which there was no stimulation (Fig. 3B and C), similar numbers of stimuli were needed to decrease t-LTP, when compared with those that were used in the control group, in which potentiation was tested at 1/15 s (Fig. 4E, P > 0.6 in all cases). Therefore, the decay of t-LTP was directly related to the number of the post-tetanic stimuli and, on average, 78 ± 4.5 stimuli were needed to decrease t-LTP to 37 % of its maximal amplitude.
It has been suggested that the decay time of STP depends upon the size of the initial potentiation (Pmax, Malenka, 1991). We tested this in our data set by examining the relationship between Pmax and the number of stimuli that were needed to reduce t-LTP to 37 % of its maximal amplitude. Linear regression analysis showed that Pmax and the decay of t-LTP were independent variables (Fig. 4F).
In spite of a change in either the frequency of the post-tetanic test stimulation or in the duration of the time periods during which there was no stimulation, the mean amplitudes of Pmax, t-LTP and s-LTP did not change. We were interested, therefore, in whether or not the amplitudes of Pmax, t-LTP and s-LTP were dependent on each other. Data from the single experiments (Fig. 3 and Fig. 4) were tested by a linear regression analysis (n = 59). The amplitudes of both t-LTP and s-LTP were linearly dependent on the initial amounts of potentiation in slice preparations (Fig. 5A and B, P < 0.001 for both cases). Notably, t-LTP and s-LTP were expressed independently of each other in the single experiments (P > 0.6, R = 0.06, Fig. 5C).
Figure 5. Dependence of transient and sustained LTP on the ability of slices to express potentiation.
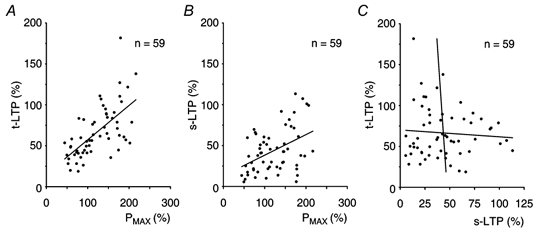
A, the amplitude of t-LTP in single experiments (Figs 3 and 4, n = 59) was positively correlated with the initial amount of potentiation (Pmax) induced in slice preparations (P < 0.0001, ANOVA, R = 0.63). B, the amplitude of s-LTP was dependent on the amplitude of Pmax (P < 0.001, ANOVA, R = 0.45). C, the amplitudes of t-LTP and s-LTP were expressed independently of each other (P > 0.6, ANOVA, R = 0.06).
Transient long-term potentiation is synapse specific
It is currently believed that changes of specific synaptic inputs underlie the encoding of memories in the brain (Martin et al. 2000). Both STP and LTP can be induced in axonal pathways that converge independently on the same neurons (Andersen et al. 1980). If t-LTP is involved in memory processes, this type of specificity might not only include its induction but also its storage and its decay. We tested this, in ‘two pathway' experiments (see Methods) by delaying test stimulation in the tetanised pathway for a period of 1 h (Fig. 6A). Our results showed that t-LTP could be induced and stored in an input-specific manner, despite continuous activation of synapses in the non-tetanised pathway. The amplitudes of Pt0, t-LTP and s-LTP were similar to those of the standard experiments, in which testing of potentiation was discontinued for a period of 1 h (Fig. 3B, P ≥ 0.2 for all cases). In contrast, t-LTP decreased faster when compared with the decay time constant of the control (Fig. 6D).
Figure 6. Transient LTP can be stored in synaptic sub-populations.
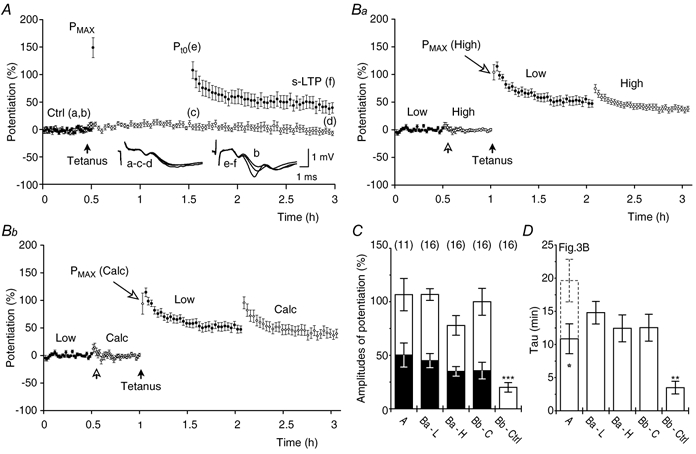
A, two-pathway experiments (n = 11) in which potentiation was induced in one of the pathways (•) with theta-burst stimulation (filled arrow). Potentiation was tested 1 h after tetanisation at a frequency of 1/15 s. In the tetanised pathway: Pt0 = 106 ± 15.0 %, t-LTP = 57 ± 6.4 %, s-LTP = 50 ± 11.2 % and the τ of t-LTP = 10.9 ± 2.2 min. The non-tetanised control pathway (○) showed little change. Average f-EPSPs from one of the experiments are shown in the inset. Ba, single-pathway experiments (n = 16) tested with two different stimulation intensities (Low = 2 × threshold and High = 4 × threshold for evoking f-EPSPs). The open arrow indicates intensity change. Tetanisation (filled arrow) was given at high intensity. Potentiation was tested at low intensity for 1 h followed by a 1 h test at high intensity. Data were normalised to their respective controls and presented as potentiation. Potentiation at low intensity (•) was: Pt0 = 107 ± 5.5 %, t-LTP = 62 ± 6.5 % and s-LTP = 45 ± 6.6 %. The τ of t-LTP was 14.8 ± 1.7 min. Potentiation at high intensity (○ was: Pt0 = 78 ± 9.2 %, t-LTP = 43 ± 9.9 % and s-LTP = 35 ± 4.5 %. The τ of t-LTP was 12.4 ± 2.0 min. Bb, subtraction (see text) was used to estimate t-LTP and s-LTP in synapses that were additionally recruited (Calc, ⋄) by the high intensity test stimulation. Pt0 = 99 ± 12.5 %, t-LTP = 64 ± 10.6 %, s-LTP = 36 ± 7.8 % and the τ of t-LTP = 12.5 ± 2.0 min. Potentiation that was tested with low intensity stimulation is reproduced from Ba for comparison (•). C, the amplitudes of Pt0, t-LTP and s-LTP from the tetanised pathway in A (A), from the low stimulation intensity (Ba-L) and the high stimulation intensity (Ba-H) pathways in Ba, and from the calculated pathway (Bb-C) in Bb. The changes in synaptic transmission that were caused by an increase in the stimulation intensity during the control periods (Bb-Ctrl) in Bb were different from the potentiations (Ba-L, Ba-H and Bb-C) obtained after the tetanisation (P < 0.001, all cases, paired t test). D, the decay time constants of t-LTP that were found in the experiments in A (A) were different from those of t-LTP that were tested 1 h after tetanisation in the control experiments (Fig. 3B, dashed bar, P < 0.05). The decay time constants of t-LTP from the experiments in B (Ba-L, Ba-H and Bb-C) were different from those that were caused by an increase in the stimulus intensity during the control periods (Bb-Ctrl, P < 0.01, in all cases, paired t test).
In another set of experiments, we attempted to determine whether or not t-LTP, once induced and stored, could be used in an input-specific manner. In order to achieve this, two synaptic populations were recruited with a single stimulation electrode. A first synaptic population was assessed with stimuli at low intensity (Low, Fig. 6Ba). Increasing the stimulus intensity recruited the first population and an additional synaptic population (High, Fig. 6Ba). Both synaptic populations were then tetanised, using the high intensity stimulation, and the Pmax was recorded. The potentiation was then tested using the low intensity stimulation. After a period of 1 h, the high intensity stimulation was applied in order to evaluate potentiation in synapses that remained untested during the period of low intensity stimulation.
The f-EPSPs that were evoked by the high intensity stimulation consisted of the summed responses from two synaptic populations. In order to separate the respective contributions of the two synaptic populations the f-EPSPs that were evoked by the low intensity stimulation were subtracted from the f-EPSPs that were evoked by the high intensity stimulation. This was done in the individual experiments. In the control period, the calculated synaptic response was estimated by subtracting the average of the low intensity responses from the individual responses obtained at high intensity. After the low intensity post-tetanic stimulation, t-LTP has almost completely decayed in the tested synapses. The potentiation in the untested synapses (Calc), therefore, could be calculated as the response at high intensity minus the average s-LTP at low intensity. The calculated data were normalised to the control periods set to 100 % and the amplitudes of the potentiation were calculated by subtracting the control level (100 %) from the normalised rising rate of f-EPSPs (Calc, Fig. 6Bb).
Statistical evaluation confirmed that t-LTP and s-LTP were present to the same extent in both the low and calculated synaptic populations (Fig. 6C, P ≥ 0.4, paired t test) and the decay time constants of t-LTP were not different when compared between the groups (Fig. 6D, P ≥ 0.3, paired t test). Changing the stimulation intensity during the control periods resulted in a brief facilitation of the f-EPSPs. This facilitation was in all respects different from the t-LTP that was induced by tetanisation (Fig. 6C and D). This indicates that t-LTP, after its induction, can be temporally separated and used in a synapse-specific manner.
Induction of transient and sustained long-term potentiation
Earlier studies have suggested that different numbers of high frequency stimuli are needed to induce STP and LTP (Schulz & Fitzgibbons, 1997). The effects of high frequency stimulation are dependent on various experimental conditions (Hanse & Gustafsson, 1992). Out of those, three basic factors have to be considered: (1) the intensity of stimulation, (2) the frequency of stimulation, and (3) the number of stimuli given in a train.
We investigated whether or not t-LTP and s-LTP could be separated in relation to their induction by using two different frequencies (30 or 200 Hz) and two different numbers of stimuli (8 or 200 stimuli) during tetanisation. Each experimental group comprised eight experiments and tetanisation was given as a single train of continuous stimuli (Fig. 7). The amplitude of s-LTP increased when the number of stimuli that were used for induction was increased from 8 (Fig. 7A and C) to 200 (Fig. 7B and D). In contrast, larger amplitudes of t-LTP were seen after stimulation at 200 Hz when compared with those after 30 Hz stimulation. Despite the difference in the expression of t-LTP and s-LTP in the four groups, the decline in t-LTP always followed a mono-exponential time course.
Figure 7. Induction of transient and sustained LTP.
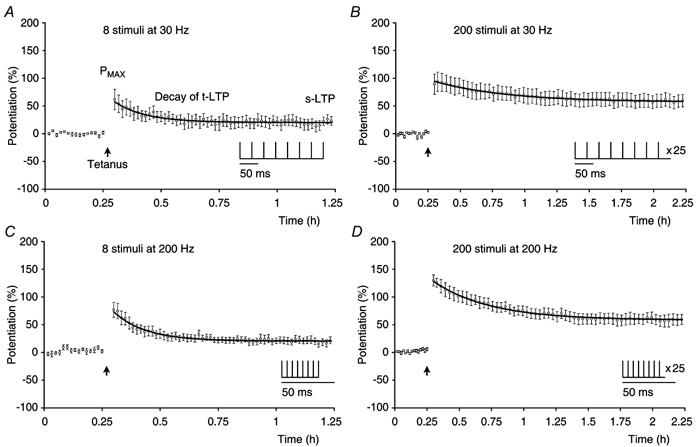
Experiments (n = 8, ○) showing t-LTP and s-LTP expressed after different patterns of induction as depicted in the insets. Tetanisation (filled arrow) was: A, 8 stimuli at 30 Hz; B, 200 stimuli at 30 Hz; C, 8 stimuli at 200 Hz and D, 200 stimuli at 200 Hz. Mono-exponential decaying functions were fitted to the mean potentiations in the experimental groups and are shown superimposed on the data (black lines). The calculated constants, given as best fit ± estimated error of constant were: A, t-LTP = 37.0 ± 9.3 %, s-LTP = 20.3 ± 1.7 % and τ = 8.2 ± 2.8 min. The correlation coefficient R was 0.93. B, t-LTP = 37.7 ± 5.12 %, s-LTP = 57.3 ± 3.1 %, τ = 32.9 ± 11.1 min and R = 0.99. C, t-LTP = 52.7 ± 7.2 %, s-LTP = 20.5 ± 1.2 %, τ = 8.32 ± 1.5 min and R = 0.98. D, t-LTP = 70.3 ± 3.7 %, s-LTP = 56.7 ± 2.1 %, τ = 29.3 ± 3.6 min and R = 0.99.
In order to quantify the effects of the induction parameters on the expression of t-LTP and s-LTP, we extended the data set by adding additional groups of experiments and depicted the results in 3D diagrams (Fig. 8). The relationships between the frequencies of stimulation and Pmax, t-LTP, s-LTP and τ were statistically evaluated using pooled data from the 30 Hz (n = 36) and the 200 Hz (n = 36) groups. The pooled data from groups with 8 (n = 24) and 200 stimuli (n = 24) were used to evaluate the effects of the number of stimuli per train on the expressions of potentiation. The data were tested for differences using a two-sample Kolmogorov-Smirnov test.
Figure 8. Relationships between tetanisation and potentiation.
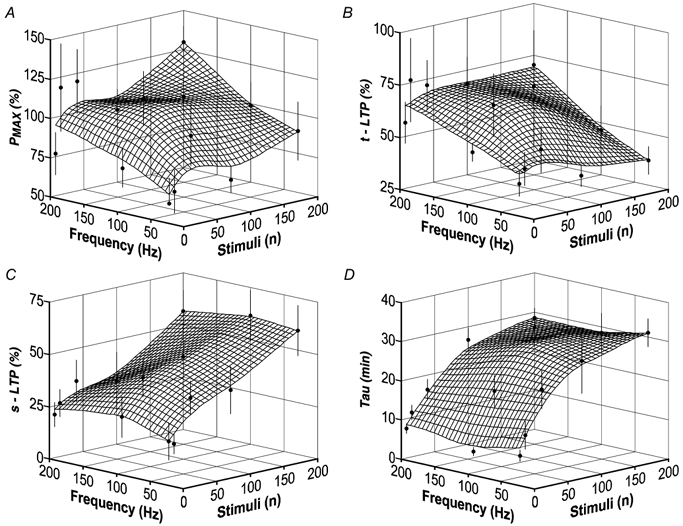
A, relationship between Pmax, frequency of tetanisation and the number of induction stimuli. •, mean estimates from single experiments in the separate groups (error bars = s.e.m.). The grid shows the mean functional relationship between expression of potentiation and the induction parameters. The numbers of experiments per group were: 8 stimuli at 30–200 Hz (n = 8), 16 stimuli at 30 and 200 Hz (n = 6), 40 stimuli at 30-200 Hz (n = 8), 100 stimuli at 30-200 Hz (n = 6) and 200 stimuli at 30-200 Hz (n = 8). B, similar to A, showing that the amplitude of t-LTP is dependent on the frequency of tetanisation and independent of the number of stimuli given. C, the amplitude of s-LTP is dependent on the number of induction stimuli and independent of the frequency of tetanisation. D, decay time constants of t-LTP (τ) are related to the number of induction stimuli and independent of the frequency of tetanisation.
Analysis showed that Pmax increased with both the number of stimuli per train (P < 0.05) and the frequency of tetanisation (P = 0.01, Fig. 8A). The expression of t-LTP was largely dependent on the frequency of the applied stimuli (P < 0.01, Fig. 8B) and appeared somewhat reduced after long trains of low frequency tetanisation. However, t-LTP was independent of the number of the induction stimuli (P = 0.9). The amplitude of s-LTP was, in contrast to that of t-LTP, strictly related to the number of stimuli in a train (P < 0.001, Fig. 8C). In the tested range of frequencies, this relationship was linear and independent of the frequency of tetanisation (P = 0.98). The decay of t-LTP (τ) was related to the number of stimuli that were applied in a train (P < 0.001, Fig. 8D), but was not related to the frequency of tetanisation (P = 0.9). A correlation analysis confirmed that the amplitudes of t-LTP and s-LTP were unrelated (R = 0.17). Expressions of t-LTP and s-LTP could therefore be separated in relation to their induction parameters.
Effects of glutamate receptor antagonists on the decline of transient long-term potentiation
Changes in the phosphorylation of α-amino-3-hydroxy-5-methyl-4-isoxolepropionic acid (AMPA) receptors (Stanton, 1996; Soderling & Derkach, 2000) and/or the insertion and recycling of the postsynaptic AMPA receptors (Nishimune et al. 1998; Noel et al. 1999; Hayashi et al. 2000) may be involved in the expression and maintenance of LTP (Mainen et al. 1998; Luscher et al. 1999, 2000; Carroll et al. 1999). Internalisation of AMPA receptors, mediated by glutamate binding, is also an attractive mechanistic explanation for the stimulation-dependent decay of t-LTP. This hypothesis was tested by investigating whether or not t-LTP would be preserved if test stimuli were applied in the presence of blockers of glutamate receptor-mediated synaptic transmission.
We first tested whether or not the blockage of ionotropic glutamate receptors, during maintenance of t-LTP, would affect its expression (Fig. 9A). After tetanisation, the initial potentiation (Pmax) was recorded and stimulation was stopped. The ionotropic glutamate receptor antagonist kynurenate (5 mM) was then applied for a period of 25 min followed by a 35 min washout of the drug. One hour after tetanisation, test stimulation was resumed and the expressions of t-LTP and s-LTP were recorded. Potentiations obtained in this group of experiments were compared with those observed in the experiments without kynurenate perfusion (Fig. 3B). There were no differences between the two groups (Fig. 9D and E). The speed of clearance of kynurenate from the perfusion chamber was tested in a separate set of control experiments (n = 2, not shown). In these experiments test f-EPSPs were blocked by application of 5 mM kynurenate for a period of 25 min. The f-EPSPs returned to their control values with a time constant of 11.6 ± 3.6 min during the washout of the antagonist.
In another group of experiments, we tested whether or not a series of 80 test stimuli (1/7.5 s), given after the blockage of the evoked f-EPSPs by kynurenate, would affect the amplitude of t-LTP (Fig. 9B). We chose to use 80 stimuli, because in the standard control experiments (Fig. 3B) this number of stimuli reduced the amplitude of t-LTP to 37 % of its initial amplitude (Fig. 4E). The amplitude of t-LTP, after washout of kynurenate, was 26 ± 5.3 % or only 38 % of the amplitude of t-LTP in the control experiments (69 ± 9.0 %, P < 0.001, Fig. 9D). The amplitude of t-LTP that was seen after 80 post-tetanic stimuli in the control experiments was, on average, 25 ± 5.2 % (Fig. 3B) and this amplitude of t-LTP was not significantly different from the reduced amplitude of t-LTP that was observed after stimulation in the presence of kynurenate (P = 0.9). The amplitude of s-LTP (Fig. 9B) was not affected by the application of the stimulation in the presence of kynurenate and similar to that of the control (Fig. 9D). When compared with that of the control the decay time constant of t-LTP was slightly, although not significantly, reduced after the stimulation in kynurenate (Fig. 9E). In conclusion, the reduction of t-LTP that was caused by presynaptic activation could not be prevented by blockage of the ionotropic glutamate receptors.
We tested whether or not the decay of t-LTP depended on an activation of the metabotropic glutamate receptors. To do this, we conducted a series of experiments in which 80 post-tetanic test stimuli were given in the presence of 5 mM kynurenate and 100 μM of the metabotropic glutamate receptor antagonist LY341495 (Fig. 9C). In these experiments, the amplitudes of t-LTP were reduced to an extent that was similar to that in Fig. 9B whereas the amplitudes of s-LTP were unaffected (Fig. 9D). The τ of t-LTP was reduced when compared with that of the controls (Fig. 9E). Since a combination of kynurenate (5 mM) and LY341495 (100 μM) blocks all identified glutamate receptors (Fitzjohn et al. 1998; Bortolotto et al. 1999), our data suggest that the dynamic decay of t-LTP occurs independently of glutamate receptor activation and may be mediated by a presynaptic mechanism.
Modulation of transient and sustained long-term potentiation by calcium-free medium
The above experiments demonstrated that testing, during blockage of glutamate receptors, could reduce t-LTP and suggested that t-LTP was expressed presynaptically. Therefore, the decline of t-LTP might be dependent on the vesicular release of glutamate. If this were true, then t-LTP should not be reduced by testing during a presynaptic blockage of synaptic transmission. Otherwise, t-LTP might be dependent on some other changes in the presynaptic terminals that might affect the probabilities for neurotransmitter release without being directly related to the release of a neurotransmitter per se. Stimulus-dependent neurotransmitter release can be blocked reversibly by perfusion of Ca2+-free medium. This procedure, however, has been shown to disrupt LTP when applied shortly after tetanisation (Katsuki et al. 1997). The degree to which t-LTP is affected by Ca2+-free medium is currently not known.
In the first group of experiments we determined whether or not the perfusion of Ca2+-free medium, during the period when t-LTP is maintained, would affect its expression (Fig. 10A). After tetanisation, the Pmax was recorded and the stimulation was stopped. Ca2+-free medium was then applied for a period of 25 min. Potentiation was tested 35 min after returning to the standard medium and the data were compared with those from the control experiments, which are presented in Fig. 3B. Analysis of the results, showed that the amplitudes of Pt0, t-LTP and s-LTP were reduced when compared with those of the control experiments (P < 0.05, all cases, Fig. 10D). The amplitude of t-LTP (44 ± 6.0 %), however, decreased to a lesser extent than the amplitude of s-LTP (5 ± 5.6 %) when compared with those of the control (69 ± 9.0 % and 41 ± 7.3 %, respectively). Hence, 64 % of t-LTP was still present after the treatment with Ca2+-free medium, whereas only 12 % of s-LTP remained preserved. The decay time constants of t-LTP (10.8 ± 2.6 min) were also affected by treatment with Ca2+-free medium and were significantly smaller than those of the control (20 ± 1.2 min, P < 0.05, Fig. 10E). These results confirm that an early application of Ca2+-free medium can reduce s-LTP (Katsuki et al. 1997) and demonstrate that a substantial amount of t-LTP is preserved in spite of the treatment with Ca2+-free medium.
In the second group of experiments we tested whether or not the amplitude of t-LTP could be reduced by stimulation during the blockage of stimulus-evoked neurotransmitter release (Fig. 10B, filled circles). In contrast to the control experiments, which are shown in Fig. 10A, 80 stimuli (1/7.5 s) were applied during the last 10 min of the exposure to the Ca2+-free medium. Analysis of the results showed that the stimulation did not reduce the amplitude of t-LTP (43 ± 4.2 %) relative to that observed in experiments that did not include the application of the stimuli (P = 0.9, Fig. 10D). The amplitude of s-LTP (5 ± 4.6 %) and the decay time constants of t-LTP (11.2 ± 1.5 min) were also not affected by the application of the stimuli (P ≥ 0.9, Fig. 10D and E).
In a group of control experiments, we investigated the extent to which perfusion of Ca2+-free medium affected the baseline responses (Fig. 10B, open circles). In those experiments, the slices were not tetanised and Ca2+-free medium was applied as in the two previous groups. During blockage of synaptic transmission 80 stimuli were delivered. Analysis of the results showed a small enhancement of the recorded f-EPSPs (2 ± 3.5 %) that declined rapidly (4.1 ± 1.2 min) to a potentiation of about −11 % (Fig. 10D and E). All those estimates were smaller when compared with the respective estimates that were found in experiments in which slices were tetanised and treated by stimulation in Ca2+-free medium (P < 0.001, all cases, Fig. 10D and E).
It has been reported that a late application of Ca2+-free medium reduces the amplitude of LTP to a lesser extent when compared with the reduction of LTP that is observed after an early application of Ca2+-free medium (Katsuki et al. 1997). We investigated how t-LTP was affected by this experimental situation. The slices were tetanised, Pmax was recorded and, 15 min later, Ca2+-free medium was applied for 25 min (Fig. 10C). After blocking of synaptic transmission, stimulation was applied in an attempt to reduce t-LTP. The late application of the Ca2+-free medium resulted in a greater amount of s-LTP (20 ± 4.8 %) when compared with that in the experiments in which Ca2+-free medium was applied early and stimulation was given during the blockage of neurotransmission (P < 0.05, Fig. 10D). However, the amplitude of s-LTP was still smaller than that which was found in experiments that did not involve the application of Ca2+-free medium (P < 0.05). The amplitude of t-LTP (46 ± 6.0 %) was not different (P > 0.6), whereas the τ of t-LTP (20 ± 2.5 min) was larger (P < 0.01) when compared with those in experiments in which Ca2+-free medium was applied earlier (Fig. 10D and E). The decay time constants of t-LTP, in this group of experiments, were not different from those found in experiments that did not involve the application of Ca2+-free medium (P = 1).
In summary, our results confirm that the application of Ca2+-free medium can disrupt LTP and that treatment with Ca2+-free medium is most effective when applied shortly after tetanisation (Katsuki et al. 1997). In contrast, a substantial amplitude of t-LTP is preserved in spite of the treatment with Ca2+-free medium. This amplitude of t-LTP is resistant to stimulation during blockage of stimulus-evoked neurotransmitter release. t-LTP declines with a small decay time constant when Ca2+-free medium is applied shortly after tetanisation. However, a later application of Ca2+-free medium does not affect the decay kinetics of t-LTP. The findings from the experiments in which Ca2+-free medium was used support the hypothesis that both the expression and the decline of t-LTP involve changes in the intracellular Ca2+-mediated dynamics of the transmitter release, rather than some other types of change in the presynaptic terminals that do not involve the release of the neurotransmitter. The data furthermore suggest that t-LTP and s-LTP are different in that the two phenomena can be modulated independently of each other when Ca2+-free medium is applied.
Paired-pulse facilitation in the CA1 area of the hippocampus
The studies described above suggest that t-LTP is expressed presynaptically in that the decay of t-LTP can be evoked by stimulation, in spite of a full blockage of glutamate receptors (Fig. 9). In support of this, the stimulus-induced decay of t-LTP is prevented in the presence of Ca2+-free medium, which blocks stimulus-evoked neurotransmitter release, suggesting that intracellular Ca2+-mediated dynamics of neurotransmitter release might be involved in the decay of t-LTP (Fig. 10). The decay of t-LTP is dependent upon the number of stimuli given during the post-tetanic test period (Fig. 4 and Fig. 9). We therefore hypothesised that facilitating synaptic release, by means of increasing the presynaptic levels of [Ca2+]i during the post-tetanic test period, would accelerate the decay of t-LTP.
When two pulses are given with a short inter-pulse interval (IPI), the synaptic release of transmitter, in a population of synapses, can be modulated in a predictable fashion (Stevens & Wang, 1995; Hjelmstad et al. 1997). The gain in synaptic transmission, from the first to the second pulse, can be evaluated as a paired-pulse facilitation (PPF). PPF, expressed as a percentage, is equal to (f-EPSP2/f-EPSP1 - 1) × 100 %. PPF is dependent on the IPI used during PP stimulation and is determined by: (1) the average release probability in a synaptic population, (2) the refractoriness of the synapses that have released a neurotransmitter and (3) the stimulation-dependent accumulation of Ca2+ in the presynaptic terminals. At very short IPIs (< 5 ms), PPF is negative because f-EPSP2 is reduced due to a large number of refractory synapses. Synapses become capable of release after about 30 ms (Stevens & Wang, 1995; Hjelmstad et al. 1997). Maximal PPF is usually recorded at longer IPIs (40–100 ms) and is primarily dependent on the speed with which Ca2+ is cleared from the presynaptic terminals (Zucker, 1999; Emptage et al. 2001). These features of PPF provide a probe for investigating the relationship between the decay of t-LTP and the intracellular Ca2+-mediated dynamics of neurotransmitter release.
In order to evaluate the dependency of t-LTP on paired pulse (PP) stimulation we wanted to ensure that the rising phases of f-EPSPs, recorded in the stratum radiatum of the CA1 area, could be used reliably to estimate the amounts of PPF. More specifically, we were concerned about the ability of postsynaptic spiking to affect the rising rate of the second f-EPSP (f-EPSP2) in a non-linear fashion when compared with that of the first f-EPSP (f-EPSP1).
The above was tested in experiments in which PP stimulation was delivered with an IPI of 80 ms (Fig. 11A). After recording the control f-EPSPs (black waveforms ‘a’ and ‘c’, Fig. 11A) a perfusion medium that contained the GABAA receptor antagonist picrotoxin (100 μM) was applied to the slices. Blockage of the GABAA receptors increased the decay times of f-EPSP1 and f-EPSP2 and led to an enhancement of the population spikes, which were seen reflected in both potentials (red waveforms ‘b’ and ‘d’, Fig. 11A). The amplitudes of the f-EPSPs appeared to be reduced by the population spikes when compared with those before the application of the picrotoxin (as indicted by the open arrowheads in Fig. 11A). However, the initial parts of the rising phases of the f-EPSPs were not affected by the application of the antagonist indicating that the rising rates of the two potentials can be reliably quantified (as described in Fig. 1).
In a group of experiments, f-EPSP1 was potentiated to a mean value of 9 ± 5.4 % when measured 20–30 min after the application of picrotoxin (black circles, n = 16, Fig. 11B). This enhancement of f-EPSP1 was not reliably observed in all the experiments (e.g. Fig. 11A) and was not significantly different from the baseline (P > 0.1, paired t test). Potentiation of f-EPSP2 was evaluated as that of f-EPSP1, by normalising the rising rates of the f-EPSPs after the application of picrotoxin to their control values (green circles, Fig. 11B). f-EPSP2 showed a similar amount of increase, when compared with that of f-EPSP1 (11 ± 4.7 %, P = 0.6, paired t test). In support of this, the PPF (continuous line in Fig. 11B) before the application of picrotoxin was 104 ± 3.6 %, and this did not differ significantly from PPF after the application of GABAA receptor antagonist (102 ± 3.7 %, P = 0.8, paired t test).
In conclusion, the initial rising phases of f-EPSP1 and f-EPSP2 and the corresponding measurement of PPF were not affected by the increase in postsynaptic spiking caused by picrotoxin.
Expression of transient and sustained long-term potentiation in paired-pulse facilitation experiments
In order to investigate the effects of PPF on the decline of t-LTP, PP stimulation was given once every 15 s with an IPI of either 20 ms (Fig. 12A) or 80 ms (Fig. 12B) during the control and during the post-tetanic periods of the experiments. Responses that were evoked by the first pulse were measured in terms of the rising rate of f-EPSP1 and were presented as mean amplitudes of potentiation, in the same way as in the previous experiments (filled circles, Fig. 12A and B). The responses to the second pulse before tetanisation were amplified by PPF. However, after tetanisation they were affected both by expression of potentiation and by PPF. In order to present the dynamic changes in the responses to the second pulse, the rising rate of f-EPSP2 was normalised to the control rising rate of f-EPSP1 and the degree of the facilitated potentiation was determined by subtracting the control level of f-EPSP1 (100 %). Note that in the control periods the facilitated potentiation of f-EPSP2 is equal to the actual gain in synaptic transmission, which was caused by PPF (open triangles, Fig. 12A and B).
Figure 12. Paired-pulse facilitation in relation to the expression of transient and sustained LTP.
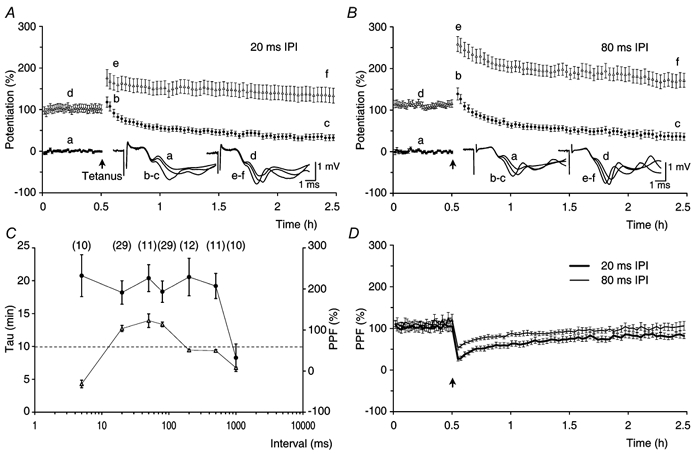
A, experiments in which slices were tested with paired-pulse (PP) stimulation (n = 16) delivered once every 15 s with an inter-pulse interval (IPI) of 20 ms. The figure shows the mean potentiation of f-EPSP1 (•) and the mean facilitated potentiation of f-EPSP2 (▵). The filled arrow indicates the time of tetanisation. The amplitudes of potentiation of f-EPSP1 were: Pt0 = 102 ± 9.9 %, t-LTP = 62 ± 5.8 % and s-LTP = 39 ± 6.2 %. The τ of t-LTP was 18.7 ± 2.2 min. Averaged f-EPSPs from a single experiment are shown in the inset. B, a group of experiments in which t-LTP and s-LTP were tested with an IPI of 80 ms (n = 16). Pt0 = 124 ± 11.5 %, t-LTP = 76 ± 11.2 %, s-LTP = 48 ± 6.3 % and τ of t-LTP = 20.0 ± 2.5 min. C, the τ of t-LTP (•), in the IPI range from 5 to 500 ms, was not dependent on the amount of PPF in the control periods of the experiments (▵) and was greater when compared with the τ of t-LTP at 1/7.5 s (from Fig. 4A, indicated by the dashed line, P < 0.01, all cases). The τ of t-LTP in experiments in which PP stimulation was given with an IPI of 1000 ms, was similar to that of t-LTP at 1/7.5 s (P > 0.5). The numbers of experiments are indicated in parentheses. D, PPF (±s.e.m.) before and after tetanisation for the experimental groups in A (20 ms IPI, thick line) and B (80 ms IPI, thin line). When PP stimulation was given with an IPI of 20 ms the PPF was reduced from a pre-tetanic control value of 103 ± 9.4 % to 26 ± 4.9 % after the tetanisation (P < 0.0001, paired t test). It increased progressively to 80 ± 6.2 % over a period of 2 h and remained different from the control PPF (P < 0.01, paired t test). In PP experiments, in which IPI was 80 ms, the PPF decreased from a baseline value of 111 ± 7.0 % to 61 ± 4.8 % after tetanisation (P < 0.0001, paired t test). The PPF increased to 102 ± 8.1 % over a period of 2 h, and was not different from the control PPF (P = 0.4, paired t test).
The amount of PPF (≈100 %) recorded in the control periods of the experiments, in which PP stimulation was given with an IPI of either 20 or 80 ms, was similar (Fig. 12A and B, n = 16 in both groups). In both situations PP stimulation resulted in a release that was about three times larger than that which was seen with a single stimulus. PP stimulation, after the tetanisation, revealed that t-LTP, which was measured at pulse one, declined with a τ value of about 20 min in both of the groups. The results were compared with those of the control group, in which the same number of stimuli as used in the PP stimulation conditions were applied as single stimuli with a frequency of 1/7.5 s (Fig. 4A). The estimates of τ in the PP experiments were about two times larger than the decay time constants of the control group (10 ± 1.6 min, P < 0.01 for both cases). Similarly, the decay of t-LTP was longer than expected in the experiments in which the post-tetanic PP stimulation was delayed for a period of 30 min. In these experiments, the estimates of τ were 18 ± 3.0 min and 16 ± 2.0 min when t-LTP was tested with an IPI of either 20 ms (n = 13) or 80 ms (n = 13), respectively. The amplitudes of t-LTP and s-LTP and the estimates of τ in the experiments in which there was a 30 min delay in test stimulation, were similar to the respective estimates in the experiments without a delay in the test stimulation (P ≥ 0.3, all cases).
The relationship between the decay kinetics of t-LTP and the amount of pre-tetanic PPF was investigated in experimental groups in which PP stimulation was given with IPIs that ranged from 5 to 1000 ms (Fig. 12C). In the range of IPIs from 5 to 500 ms the decay time constants of t-LTP were all similar, that is about two times larger than the decay time constants that were observed in the controls (indicated by the dashed line in Fig. 12C). Furthermore, the τ of t-LTP did not correlate with the amounts of PPF that were expressed in these experiments (Fig. 12C). In contrast, PP stimulation that was given with an IPI of 1000 ms showed little PPF (8.2 ± 1.4 %). In this case the τ of t-LTP was 8.3 ± 2.1 min and was not different from that of the control experiments (P > 0.5). This indicates that the decline of t-LTP is not a simple function of the number of stimuli given, but can be modulated by both the frequency and the pattern of the test stimulation during the post-tetanic period.
In spite of similar amounts of PPF (≈100 %, P = 0.5), the amplitude of the facilitated potentiation after tetanisation was smaller in the group in which PP stimulation was given with an IPI of 20 ms (Fig. 12A) than it was in the experiments in which PP stimulation was given with an IPI of 80 ms (Fig. 12B). This difference was reflected by changes in PPF after the induction of potentiation (Fig. 12D). The amount of PPF 2 min after the tetanisation was smaller in the PP experiments tested with an IPI of 20 ms when compared with that in the experiments in which potentiation was tested with an IPI of 80 ms (26 ± 4.9 % and 61 ± 4.8 %, respectively, P < 0.0001). In both groups the decay of t-LTP was accompanied by a progressive increase in the PPF towards its control values. However, 2 h after the tetanisation, the amount of PPF at 20 ms IPI remained smaller when compared with the amount of PPF at 80 ms IPI (P < 0.05, Fig. 12D). At this time after the tetanisation, the amount of PPF at 80 ms IPI was slightly, although not significantly, reduced when compared with the respective amount of PPF before the tetanus (Fig. 12D). In contrast, the amount of PPF at 20 ms IPI was smaller than the baseline amount of PPF (P < 0.01, paired t test). Persistent differences in the amounts of PPF (Fig. 12D) and of facilitated potentiation (Fig. 12A and B), between the groups that were tested with an IPI of 20 and 80 ms, can be explained by a post-tetanic increase in the proportion of refractory synapses at pulse two in the experimental group that was tested with an IPI of 20 ms. These observations indicate that there is an enhanced probability of neurotransmitter release after tetanisation (Stevens & Wang, 1995; Hjelmstad et al. 1997). They support the finding that t-LTP is expressed presynaptically (Fig. 9 and Fig. 10) and suggest that an enhanced probability of neurotransmitter release is also involved in the expression of s-LTP.
It has been shown previously that the expression of LTP depends on the amount of PPF before tetanisation, suggesting that LTP is dependent on the initial probability of neurotransmitter release in slice preparations (Kleschevnikov et al. 1997). It is not known if t-LTP shows a similar dependency, however. In order to investigate the dependencies of Pmax, t-LTP, s-LTP and the τ of t-LTP on the amount of pre-tetanic PPF, we analysed the data from experimental groups in which potentiation was tested with PP stimulation that showed a substantial amount of PPF (IPI from 20 to 500 ms, Fig. 12C). In each group, the PPF during the control period of the individual experiments was normalised to the mean PPF observed in that group. All single experiments were binned with respect to the normalised PPF (Fig. 13). Statistical analysis of this data set confirmed that the amplitudes of Pmax and s-LTP were linearly dependent on the amount PPF that was seen before tetanisation (P < 0.02, Fig. 13A and C). The amplitude of t-LTP was largest in the group that showed the highest PPF (Fig. 13B). However, the amplitude of t-LTP was not linearly related to the amount of PPF (P > 0.05) and this relationship was more complex than that of s-LTP (Fig. 13C). In the group with the highest PPF the amplitude of s-LTP was about five times larger than that in the group with the lowest PPF. In contrast, in the group with the highest PPF, t-LTP increased by only about 1.5 times when compared with that expressed in the group with the lowest PPF. This indicates that the expressions of s-LTP and t-LTP are differentially dependent on the initial probability of neurotransmitter release in slice preparations. The τ of t-LTP was not dependent on the amount of initial PPF (Fig. 13D).
Figure 13. Initial probability of neurotransmitter release and expression of transient and sustained LTP.
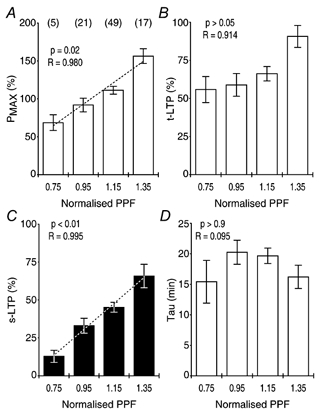
A, Pmax was positively correlated (R = 0.980) to the amount of PPF in the control periods of the experiments. It was also linearly dependent on the amount of PPF (P < 0.02, ANOVA). B, t-LTP was positively correlated to the amount of PPF (R = 0.914), but not linearly dependent on the amount of PPF (P > 0.05, ANOVA). C, s-LTP was both positively correlated (R = 0.995) to the amount of PPF and linearly dependent on the amount of PPF (P < 0.01, ANOVA). D, the τ of t-LTP was neither correlated to PPF (R = 0.095) nor dependent on its amount (P > 0.9, ANOVA).
Decay of transient long-term potentiation depends on activation of NMDA receptors
The unexpected slow decay of t-LTP that was observed in experiments involving PP stimulation suggested that the decay kinetics of t-LTP might be modulated by an unknown mechanism (Fig. 12C). NMDA receptors are activated during low frequency test stimulation (Andreasen et al. 1989) and provide calcium influx and release of calcium from internal stores during single synaptic events (Emptage et al. 1999). On the basis of this, we hypothesised that PP stimulation, which enhances synaptic release of neurotransmitter (Clark et al. 1994), might prolong the decay of t-LTP through a frequency-dependent calcium signal that is mediated by NMDA receptor activation.
Two groups of experiments, in which the test stimulation consisted of PP stimuli with an IPI of 80 ms, were used to investigate whether or not the activation of NMDA receptors prolonged the decay kinetics of t-LTP. The post-tetanic test stimulation was delayed for 30 min in both the control group (Fig. 14A) and in the group in which NMDA receptors were blocked after tetanisation by application of 100 μM DL-AP5 (Fig. 14B). Statistical analysis showed that, in the presence of AP5, the amplitude of t-LTP was reduced to half that of the control values (P < 0.05) whereas the amplitude of s-LTP was similar to that of the control group (P = 0.2, Fig. 14D). The decay time constants of t-LTP, in the presence of DL-AP5 (5.7 ± 1.1 min), were about three times faster than those of the control (16 ± 2.0 min, Fig. 14E). These data show that the decay of t-LTP, in the experiments with PP stimulation, was prolonged by an NMDA receptor-mediated signal.
Figure 14. Effects of DL-AP5 on the decline of transient LTP.
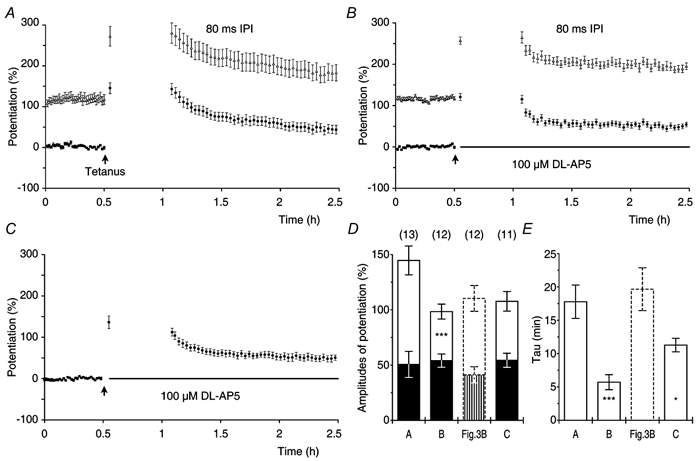
A, control experiments (n = 13) in which potentiation was tested 30 min after tetanisation (theta-burst, indicated by the filled arrow) using paired pulses (1/15 s, 80 ms IPI). • show potentiation of f-EPSP1, whereas the ▵ show the facilitated potentiation of f-EPSP2. Pt0 = 145 ± 13.3 %, t-LTP = 91 ± 8.4 %, s-LTP = 54 ± 11.5 % and τ of t-LTP = 16 ± 2.0 min. B, an experimental group (n = 12) which is similar to that in A, except that DL-AP5 (100 μM) was applied after the tetanisation as indicated by the bar. Pt0 = 98 ± 6.8 %, t-LTP = 44 ± 3.9 %, s-LTP = 54 ± 6.0 % and τ of t-LTP = 5.7 ± 1.1 min. C, effect of DL-AP5 (100 μM) on t-LTP, which was tested with single pulses, applied with a frequency of 1/15 s. Pt0 = 108 ± 8.9 %, t-LTP = 53 ± 3.7 %, s-LTP = 54 ± 6.4 % and τ of t-LTP = 11.3 ± 1.0 min. D, the amplitudes of Pt0 and t-LTP, tested with paired pulses in AP5 (B), were smaller (P < 0.01, both cases) than those of the control (A). s-LTP was similar to that of the control (P > 0.9). Amplitudes of Pt0, t-LTP and s-LTP, tested with single pulses (Fig. 3B), were similar to those seen after application of AP5 in the single-pulse experiments (C, P > 0.1, in all cases). E, decay time constants of t-LTP, for the experimental groups in D. The τ of t-LTP, after the application of AP5 (B) was smaller than that of the control (A, P < 0.0001). The τ of t-LTP, tested with single pulses in the AP5 experiments (C), was also smaller than that of the control (Fig. 3B, P < 0.05).
We investigated whether or not single stimuli could also activate the NMDA receptor-dependent mechanism and prolong the decay of t-LTP. Single test stimuli, in the control and in the post-tetanic periods, were given at a frequency of 1/15 s and 100 μM DL-AP5 was applied after tetanisation (Fig. 14C). Potentiation was tested 30 min after tetanisation and the results were compared with those of a control group in which AP5 was not applied (Fig. 3B). In this case, the amplitudes of t-LTP and s-LTP were similar to those of the control (Fig. 14D). Decay time constants of t-LTP were 11 ± 1.0 min and different from those for the controls (20 ± 1.2 min, P < 0.05, Fig. 14E). This demonstrates that single stimuli, given at a low frequency after tetanisation (1/15 s), are sufficient to activate the NMDA receptor-dependent mechanism that is involved in prolonging the decline of t-LTP.
Decline of transient long-term potentiation is mediated by a decrease in the probability of neurotransmitter release
Our data show that t-LTP is expressed presynaptically (Figs 9, 10 and 12) and that the decline of t-LTP can be prolonged by stimulation-mediated activation of NMDA receptors (Fig. 14). Furthermore, the decay of t-LTP is accompanied by a progressive increase in the PPF towards its control values (Fig. 12D). We were interested, therefore, in whether or not the decline of t-LTP is mediated by an activity-dependent decrease in the probability of neurotransmitter release (PR). PP stimulation can be used to probe changes in PR (Stevens & Wang, 1995; Hjelmstad et al. 1997). An increase in PR can be expected to reduce PPF of f-EPSPs evoked by PP stimulation (as seen in Fig. 12D). In contrast, a change in the excitatory postsynaptic conductance can be expected to result in a linear amplification of both the potentials (as seen in Fig. 11B). However, the non-linear relationship between the number of stimulated fibres and the f-EPSPs (Andersen et al. 1980) limits the interpretation of the PPF calculations.
We tested the effect of stimulation intensity on PPF in a group of PP experiments (80 ms IPI, Fig. 15A). In these experiments the baseline responses were evoked at three times the threshold for f-EPSPs. PPF was then tested by changing the stimulation intensity from 1.5 to 10 times the threshold for evoking the f-EPSPs. This input/output (i/o) experiment showed that PPF was reflecting changes in the stimulus intensity. PPF was maximal at the lower stimulation intensities and decreased with the higher stimulation intensities. This shows that a change in the stimulation intensity can affect the extracellular estimate of PPF and demonstrates that a dynamic change in PR cannot be directly inferred from changes in the PPF alone. Therefore, we were concerned about whether or not presynaptic changes in neurotransmission can affect the relationship between f-EPSP1 and f-EPSP2 in a manner that differs from postsynaptic changes.
Figure 15. Decline of transient LTP is mediated by a decrease in the probability of neurotransmitter release.
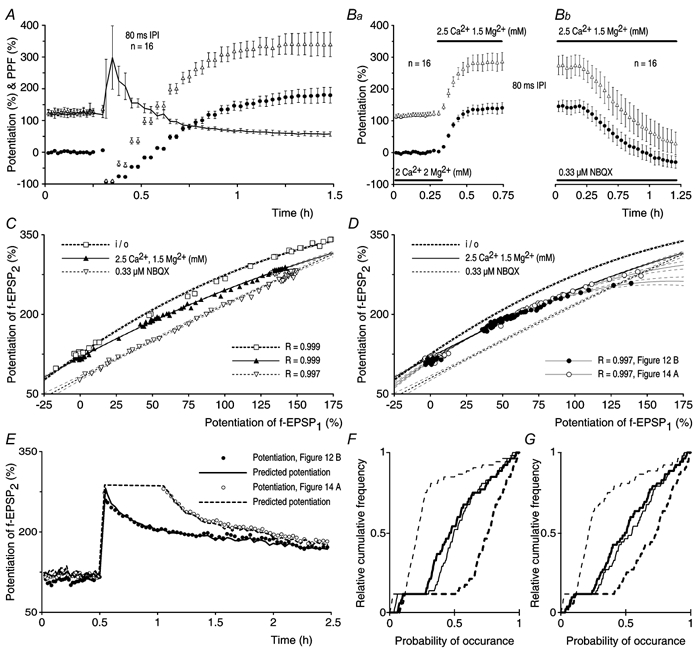
A, the mean input/output (i/o) relationship of responses to PP stimulation applied with an IPI of 80 ms (n = 16). Baseline responses were recorded at three times the threshold for evoking f-EPSPs. Responses were then sampled in the range from 1.5 to 10 times the threshold, in steps of 0.5 times the threshold. Data are presented as amplitudes of potentiation. • show the potentiation of f-EPSP1 and ▵ show the facilitated potentiation of f-EPSP2. The line shows the mean PPF ± s.e.m. Ba, after recording the baseline in standard medium, f-EPSPs were potentiated by a medium containing 2.5 mM Ca2+ and 1.5 mM Mg2+ (n = 16, 80 ms IPI). Bb, application of NBQX (0.33 μM), in a separate group of experiments, resulted in a decrease of the potentiated response. C, the relationship between the potentiation of f-EPSP1 and the facilitated potentiation of f-EPSP2 in the three conditions shown in A, Ba and Bb. The lines, as indicated in the top corner of the panel, show the fit of the data to the following function: Pf-EPSP2 = a + b × Pf-EPSP1 + c × (Pf-EPSP1)2. Thin lines show the confidence intervals of the fit. Regression coefficients are shown in the inset to the right. D, facilitated potentiation of f-EPSP2, from experiments in which t-LTP and s-LTP were tested either with (○, Fig. 14A) or without (•, Fig. 12B) a delay in the test stimulation, were plotted as the functions of the respective potentiations of the f-EPSP1 that were recorded in those experiments. The data were fitted to a polynomial function as in C. The calibration functions from C are superimposed on the data. E, the function that resulted from a change in the Ca2+:Mg2+ ratio was used to predict the facilitated potentiations of f-EPSP2 (lines) on the basis of the two potentiations of f-EPSP1 that were recorded in the experiments in which t-LTP and s-LTP were tested using PP stimulation (from Figs 12B and 14A). Circles show the two potentiations of f-EPSP2 that were recorded in those experiments. F, the three calibration functions, from the experiments presented in C were used to predict the amounts of facilitated potentiation of f-EPSP2 that were observed in PP stimulation experiments in which there was no delay in the post-tetanic control stimulation (Fig. 12B). The relative cumulative frequency distributions of the resulting single data sets, in the time period from 25 min to 1.5 h, are plotted against the relative cumulative occurrence of all data that were sorted in an ascending order by the amplitude of the facilitated potentiation of f-EPSP2. The heavy continuous line shows the distribution of the experimental data that have been plotted for comparison. The light line shows the distribution of f-EPSP2 which was predicted on the basis of the change in the Ca2+:Mg2+ ratio. The light dashed line shows the f-EPSP2 that was predicted on the basis of blockage of AMPA receptors. The heavy dashed line shows the f-EPSP2 that was predicted on the basis of the i/o relationship. G, recorded facilitated potentiation of f-EPSP2 (heavy continuous line) from experiments in which t-LTP and s-LTP were tested with a delay in PP stimulation (Fig. 14A). Other lines represent the three corresponding predictions of f-EPSP2. Data are plotted in a similar manner as in F.
In two groups of PP experiments (80 ms IPI) we tested whether or not changes in PR could affect the relationship between f-EPSP1 and f-EPSP2 differently from changes in postsynaptic excitatory conductance. To do this, in the first group of experiments (Fig. 15Ba), PR was increased by shifting from the standard medium to a medium with a larger Ca2+: Mg2+ ratio. The induced increase in PR resulted in a potentiation of both field responses. In the other group of experiments, after increasing PR, we blocked AMPA receptors by application of 0.33 μM NBQX (Fig. 15Bb). This blockage of postsynaptic receptors resulted in a decrease in neurotransmission.
We plotted the facilitated potentiation of f-EPSP2 as a function of the potentiation of f-EPSP1, for each of the three experiments in Fig. 15A, Ba and Bb (Fig. 15C). Notably, the relationship between f-EPSP1 and f-EPSP2 was close to linear when affected by blockage of AMPA receptors. In contrast, changes in both PR and stimulation intensity affected the relationship between f-EPSP1 and f-EPSP2 in a non-linear fashion. The three relationships were fitted by a second-order polynomial function. The slopes of the fitted functions were different in that their confidence intervals did not overlap. This demonstrates that changes in neurotransmission, in the three experimental situations, could be differentiated on the basis of the relationships between f-EPSP1 and f-EPSP2.
We then examined to see if any of the three functions in Fig. 15C would coincide with data from experiments in which potentiation was induced by tetanisation and tested with PP stimulation (Fig. 15D, 80 ms IPI). Evaluations were made of both the data from experiments in which t-LTP and s-LTP were tested without (Fig. 12B) and with (Fig. 14A) a delay in test stimulation. The two data sets seemed to be well matched to a change in PR, whereas functions caused by changes in the stimulation intensity or blockage of AMPA receptors did not match the data (Fig. 15D).
To make a quantitative evaluation of this observation, we took the two recorded potentiations of f-EPSP1 from the experiments in Fig. 12B and Fig. 14A. These potentiations of f-EPSP1 were then used to predict the amounts of the facilitated potentiations, on the basis of the three different functions from Fig. 15C. This resulted in six predictions of f-EPSP2 (three for each of the experimental situations in Fig. 12B and Fig. 14A) that were compared with the two respective experimental measurements of f-EPSP2. Analyses showed that a change in PR could be related to the decay of t-LTP (Fig. 15E). Potentiations of f-EPSP2, which were predicted on the basis of a change in the PR, were not statistically different from the experimental data when compared by a two-sample Kolmogorov-Smirnov test (P > 0.8 both cases, Fig. 15F and G). In contrast, predictions of f-EPSP2 based on a change in either the excitatory postsynaptic conductance or in the stimulation intensity were both different from the recorded data (P < 0.01 for all cases, Fig. 15F and G).
The facilitated potentiation of the f-EPSP2 that was tested with PP stimulation at 20 ms IPI (Fig. 12A) was different from the facilitated potentiation of the f-EPSP2 that was tested with PP stimulation at 80 ms IPI (Fig. 12B). Therefore, we were interested in whether or not calibration functions, acquired with PP stimulation at 20 ms IPI, could predict the observed potentiation of the f-EPSP2. The data from experiments in which t-LTP and s-LTP were tested either with (n = 13, not shown) or without (Fig. 12A) a delay in PP stimulation (20 ms IPI) were evaluated. Predictions of f-EPSP2, based on a function from experiments in which PR was changed (n = 16, R = 0.997), were similar to the measured f-EPSP2 at 20 ms IPI in the two experimental situations (P = 0.6, both cases). In contrast, the function resulting from blockage of AMPA receptors (n = 16, R = 0.995) could not account for the changes in the potentiation of the f-EPSP2. Predictions, based on this function, were different from the recorded data (P < 0.001, both cases).
In conclusion, the above analyses confirm that t-LTP is expressed presynaptically as an increase in PR and show that the declining phase of t-LTP can be explained in terms of a use-dependent decrease in PR. Furthermore, the data strengthen the claim (Fig. 12) that s-LTP, under our experimental conditions, is accompanied by a sustained increase in PR.
Modulation of transient and sustained long-term potentiation by burst stimulation
Our results show that the decline of t-LTP is dependent upon the pattern of presynaptic stimulation (Fig. 4 and Fig. 12). The concurrent activation of NMDA receptors counteracted this process without affecting the amplitude of s-LTP (Fig. 14). NMDA receptor-mediated signals are also essential for the induction of t-LTP. These observations suggest that the amount of t-LTP that is present at any given time after its induction might be explained in terms of a balance between a stimulus-dependent reduction and a NMDA receptor-mediated re-induction of potentiation. Therefore, we thought that there might exist some patterns of post-tetanic stimulation that permit t-LTP to be stored in synapses inspite of a continuous synaptic activation, by favouring the process of re-induction of potentiation. High frequency tetanisation was more potent in inducing t-LTP than tetanisation at a lower frequency (Fig. 7 and Fig. 8), suggesting that patterned stimuli, including high frequency rather than low frequency bursts, might prevent t-LTP from decaying.
The above hypothesis was tested in PP stimulation experiments. PP stimulation, with an IPI of 80 ms, was used to provide a baseline during the pre-tetanic control period. Potentiation was induced by theta-burst stimulation and Pmax was recorded. The decay of t-LTP was tested using a protocol consisting of PP stimulation (80 ms IPI) in which the second pulse was replaced by a burst of four stimuli. Identical paired-pulse bursts (PPB) were repeated once every 15 s for a period of 30 min. The expressions of t-LTP and s-LTP were then tested with PP stimulation (80 ms IPI).
The effects of PPB stimulation, with an in-burst frequency (IBF) of either 200 or 30 Hz, on the decay of t-LTP are shown in Fig. 16A and B, respectively. In the group (Fig. 16A) in which high frequency PPB stimulation was given, t-LTP did not decline until it was tested with PP stimulation. In contrast, t-LTP decreased in response to PPB stimulation at the lower frequency (Fig. 16B). We estimated the amounts of t-LTP and s-LTP in the PPB experiments and compared them with those from the standard control experiments in which potentiations were tested with PP stimulation (Fig. 12B). t-LTP and s-LTP, in experiments with high frequency PPB stimulation, were similar in all respects to those of the control (Fig. 16F and G). However, when PPB stimulation was given at a lower frequency the amplitude of t-LTP was smaller than that of the control (Fig. 16F). The amplitude of s-LTP was slightly, although not significantly, lower than that of the control (Fig. 16F). The decay time constants of t-LTP were not different from those of the control (Fig. 16G).
Figure 16. Modulation of t-LTP and LTP by burst activity.
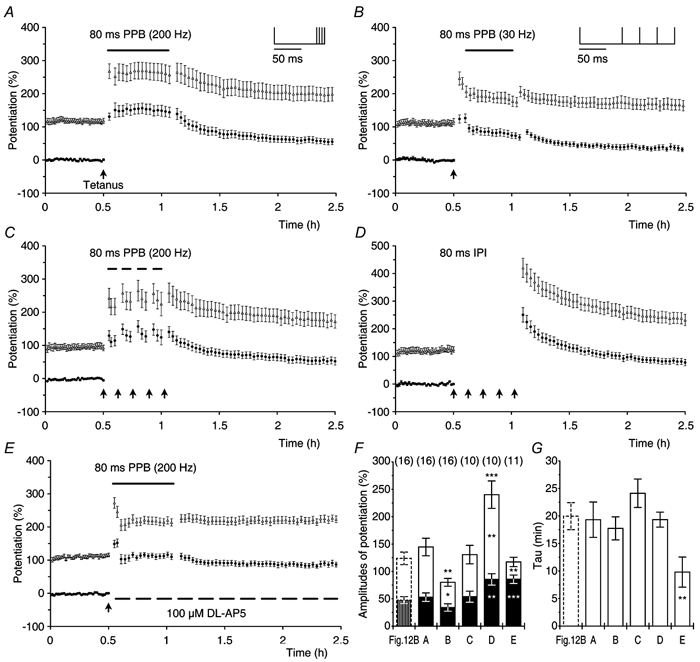
A, after a control period (PP stimulation, IPI = 80 ms, n = 16) the slices were tetanised (theta-burst, filled arrow). Subsequently, a paired-pulse and burst protocol (PPB) was given at intervals of 1/15 s. The PPB consisted of a stimulus that was 80 ms later followed by a burst (four stimuli at 200 Hz, see inset). PPB stimulation was applied for 30 min (indicated by horizontal bar) and was followed by PP stimulation, which was used to test the expression of potentiation. •, potentiation of f-EPSP1 and ▵ facilitated potentiation of f-EPSP2. Pt0 = 144 ± 16.0 %, t-LTP = 92 ± 13 %, s-LTP = 53 ± 7.7 % and τ of t-LTP 19 ± 3.2 min. B, similar to the experiments in A, except that PPB stimulation consisted of a single pulse that was followed by a burst at a frequency of 30 Hz (n = 16). Pt0 = 80 ± 7.2 %, t-LTP = 46 ± 6.1 %, s-LTP = 34 ± 6.8 % and τ of t-LTP = 18 ± 2.1 min. C, PP experiments (IPI = 80 ms, n = 10) show the effect of five subsequent tetanisations (indicated by the arrows, spaced by 7 min). The tetani were interposed (indicated by the bars) by high frequency PPB stimulation (200 Hz) that was given once every 15 s. Pt0 = 131 ± 16.9 %, t-LTP = 77 ± 8.7 %, s-LTP = 54 ± 10.1 % and τ of t-LTP 24 ± 2.6 min. D, PP experiments that are similar to the experiments in C except that PPB stimulation was omitted (n = 10). Note the difference in the y axis scaling also. Pt0 = 240 ± 25.0 %, t-LTP = 155 ± 22.1 %, s-LTP = 85 ± 10.4 % and τ of t-LTP 19 ± 1.4 min. E, experiments that are similar to those in A, except that DL-AP5 (100 μM, indicated by the dashed line, n = 11) was applied together with the high frequency PPB stimulation (indicated by the horizontal bar). Pt0 = 118 ± 8.7 %, t-LTP = 32 ± 3.5 %, s-LTP = 87 ± 7.7 % and τ of t-LTP = 8.6 ± 2.7 min. F, the amplitudes of Pt0, t-LTP and s-LTP from the standard PP experiments (Fig. 12B) were compared with those in A, B, C, D and E. Potentiations that were reached with theta-burst stimulation and PPB in A (A) were not different from the controls (P > 0.3, in all cases). In the experiments in which 30 Hz PPB was used (B), Pt0 and t-LTP were smaller (P < 0.05, both cases) and s-LTP was not different (P > 0.1) when compared with those of the control. The potentiations in experiments in which five tetanisations were interposed with PPB stimulations (C) were similar to those of the control (P ≥ 0.6, in all cases). Five tetanisations without PPB stimulation (D) resulted in greater amplitudes of potentiation when compared with the controls (P < 0.01, in all cases). The t-LTP that was observed after PPB stimulation in AP5 (E) was reduced (P < 0.01) while the s-LTP was upregulated (P < 0.001) without a change in the Pt0 (P > 0.7) when compared with those of the control. G, decay times for the experimental groups in F. t-LTP in the AP5 experiments (E) decayed faster when compared with that of the control (P < 0.01).
In conclusion, PPB stimulation, repeated at a low frequency (1/15 s), can sustain t-LTP induced by theta-burst stimulation. High frequency bursts can hinder the decay of t-LTP, whereas bursts at a lower frequency cannot prevent the decrease of t-LTP. In spite of the sustained t-LTP, in experiments with the high frequency bursts, the amplitude of s-LTP did not increase. This suggests that the expression of s-LTP is not affected by PPB stimulation under these particular experimental conditions.
On the basis of the above, we investigated whether or not post-tetanic burst stimulation could interact with the induction of s-LTP (Fig. 16C). Here, five concurrent tetanisations (theta-bursts) were applied every 7 min and interposed with the high frequency PPB stimulation (200 Hz IBF). The expressions of t-LTP and s-LTP were tested with PP stimulation (80 ms IPI) after 30 min of PPB stimulation. Statistical analysis showed that t-LTP and s-LTP were not different from those observed in the standard PP experiments (Fig. 16F and G). This indicates that the four ‘extra’ episodes of tetanisation are not effective in inducing additional s-LTP when high frequency bursts are applied in between the tetani.
In another group of experiments, we attempted to determine whether or not the apparent block of s-LTP induction was caused by the PPB stimulation (Fig. 16D). In these experiments, slices were tetanised (five times, once every 7 min) and PPB stimulation was omitted. The expressions of t-LTP and s-LTP were evaluated with PP stimulation (80 ms IPI). The amplitudes of t-LTP and s-LTP were much greater when compared with those observed in experiments in which only a single tetanisation was applied (Fig. 16F). The five tetani increased the amplitude of t-LTP to 203 % of the control values whereas the amplitude of s-LTP was increased to a smaller extend (to 180 %). The decay time constants of t-LTP were not different from those of the controls (Fig. 16G). The amplitudes of t-LTP and s-LTP were also larger when compared with those from experiments in which tetani were interspersed with PPB stimulation (P < 0.05). In conclusion, continuous high frequency post-tetanic activation suspends the decline of t-LTP and prevents a further induction of both t-LTP and s-LTP. This unexpected result indicates that in addition to t-LTP, s-LTP is also subject to modulation by post-tetanic stimulation.
Finally, in experiments with PPB stimulation, we determined whether or not NMDA receptor activation was necessary for re-induction of t-LTP. In a group of experiments similar to the one described in Fig. 16A, 100 μM DL-AP5 was applied after tetanisation together with the application of high frequency PPB stimulation (200 Hz IBF, Fig. 16E). AP5 was present throughout the rest of the experiment. In the presence of AP5, PPB stimulation resulted in a rapid decrease of potentiation, which stabilised at about 100 %. The amounts of t-LTP and s-LTP expressed after PPB stimulation were tested by PP stimulation and compared with those obtained in the standard control experiments (Fig. 12B). The amplitude of t-LTP was, if anything, much smaller than that of the control (Fig. 16F). In contrast, the amplitude of the s-LTP (87 %) was larger than that of the control and similar in amplitude to the s-LTP that was found after five tetanisations and no PPB stimulation (P > 0.9). This finding suggests that, in contrast to t-LTP, the amplitude of s-LTP can be upregulated by PPB stimulation during blockage of NMDA receptors by AP5.
Induction of transient and sustained long-term potentiation by burst stimulation
The above experiments show that t-LTP can be re-induced by post-tetanic burst stimulation. In the presence of functional NMDA receptors, PPB appears to suppress further induction of s-LTP. When NMDA receptors are blocked, the effects of PPB stimulation are reversed. That is, re-induction of t-LTP is disabled and additional s-LTP is induced. These results indicate that a single PPB stimulation is sufficient to exceed the threshold for the induction of potentiation and that NMDA receptors play a significant role in modulating the expression of both t-LTP and s-LTP.
We tested the extent to which PPB stimulation could induce potentiation in a series of PP stimulation experiments (80 ms IPI, Fig. 17A). In these experiments, PPB stimulation was not preceded by tetanisation. High frequency PPB stimulation (200 Hz IBF) was given at a frequency of 1/15 s for 30 min after the control period was recorded. PPB stimulation resulted in an increase of potentiation that reached a plateau after about 15 min (Fig. 17A). The presence of t-LTP and s-LTP was then tested with PP stimulation for a period of 1.5 h. The results were compared with those of the standard PP experiments, in which potentiation was induced by theta-burst stimulation (Fig. 12B). The amplitudes of both t-LTP (147 ± 23.2 %) and s-LTP (80 ± 7.3 %) were enhanced (P < 0.01, Fig. 17D) whereas the decay time constants of t-LTP were similar (P = 0.1, Fig. 17E) when compared with those of the control experiments. The amplitudes of t-LTP and s-LTP, which were induced by PPB stimulation, were also larger than those recorded in experiments in which the high frequency bursts were preceded by tetanisation (P < 0.05, both cases, Fig. 16A). Notably, the amounts of t-LTP and s-LTP that were induced by the high frequency PPB stimulation in Fig. 17A were similar to those that were induced by the five theta-bursts in Fig. 16D (P > 0.6, both cases).
Figure 17. Induction of t-LTP and LTP by PPB stimulation.
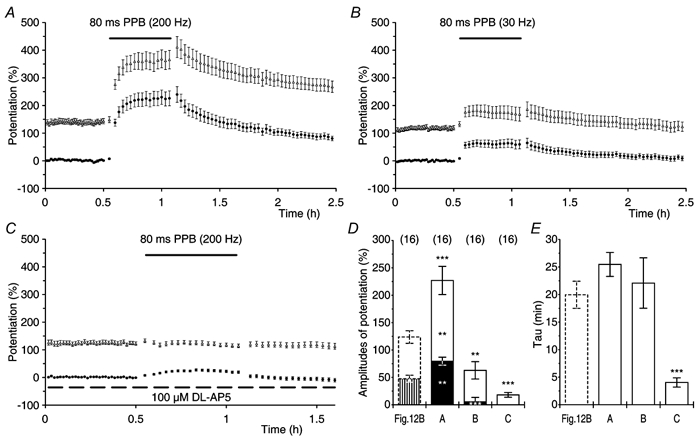
A, experiments in which potentiation was induced by PPB stimulation (IPI = 80 ms, burst = 4 stimuli at 200 Hz, indicated by horizontal bar) that was applied once every 15 s for a period of 30 min (n = 16). PP stimulation (IPI = 80 ms, 1/15 s) was used both in the control and in the test periods of the experiments. •, potentiation of f-EPSP1, ▵ potentiation of f-EPSP2. Pt0 = 227 ± 25.8 %, t-LTP = 147 ± 23.2 %, s-LTP = 80 ± 7.3 % and τ of t-LTP = 26 ± 2.2 min. B, experimental situation similar to that shown in A, but the burst frequency was 30 Hz (n = 16). Pt0 = 63 ± 15.9 %, t-LTP = 57 ± 13.3 %, s-LTP = 6 ± 7.9 % and τ of t-LTP = 22 ± 4.6 min. C, 100 μM DL-AP5 was present throughout the recording time (indicated by the dashed line) in a group of experiments (n = 16) that were otherwise similar to those shown in A. Application of high frequency PPB stimulation (horizontal bar) caused a small potentiation of the f-EPSPs (18 ± 4.3 %), which decayed to a potentiation of −5 ± 5.7 % with a τ value of 4.0 ± 0.8 min. D, potentiations (Pt0, t-LTP and s-LTP), induced by theta-burst stimulation in the experiments tested with paired pulses (Fig. 12B) were compared with those induced by PPB stimulation in the experiments shown in A, B and C. Induction with PPB stimulation at 200 Hz resulted in larger amplitudes of Pt0, t-LTP and s-LTP when compared with the controls (P < 0.01, in all cases). Differently, PPB stimulation at 30 Hz resulted in smaller amplitudes of Pt0 and s-LTP when compared with those of the control (P < 0.01, in both cases). However, t-LTP was similar to that of the control (P > 0.2). The induction of potentiation was blocked by DL-AP5 (P < 0.0001, in all cases). E, the decay time constants of t-LTP for the experimental groups shown in D. Decay time constants in AP5 were smaller than those observed in other experiments (P < 0.0001).
Bursts at a lower frequency (30 Hz) were given in another group of experiments (Fig. 17B). Here, potentiation stabilised faster, although at a lower amplitude, when compared with that induced by the high frequency PPB stimulation (Fig. 17A). t-LTP was smaller than that induced by the high frequency bursts (P < 0.01) and s-LTP was not induced at all (P < 0.0001). However, t-LTP was similar to that induced by theta-burst stimulation (P > 0.2, Fig. 17D) and decreased with a similar decay time constant (P > 0.6, Fig. 17E).
Finally, we investigated the extent to which NMDA receptors were involved in the induction of potentiation during high frequency PPB stimulation (Fig. 17C). Here, DL-AP5 (100 μM) was present in the bath throughout the experiments. A small potentiation of the f-EPSPs could be recorded when PPB stimulation (200 Hz IBF) was given in the presence of AP5. PP stimulation showed that this increase (18 ± 4.3 %) decreased rapidly (4.0 ± 0.8 min) to a potentiation of about −5 % (Fig. 17D and E).
In conclusion, both t-LTP and s-LTP can be induced by application of PPB stimulation at a low frequency (1/15 s) and this induction is dependent on NMDA-receptor activation during the PPB stimulation. Low frequency bursts are sufficient to induce t-LTP although the amplitude of t-LTP is largest after the application of high frequency bursts. In contrast to the results presented in Fig. 8, in which the expression of s-LTP was independent of the frequency of tetanisation, high frequency PPB stimulation appears to be necessary for the induction of s-LTP.
Transient long-term potentiation and dynamic modulation of synaptic transmission
We have presented evidence that shows that excitatory synapses are able to express a previously unknown type of LTP (e.g. Fig. 3). We chose to call this type of LTP ‘transient long-term potentiation' (t-LTP). t-LTP is temporal in its nature and its persistence is determined by synaptic activation. High frequency patterns of presynaptic activation are necessary to induce t-LTP (Figs 7, 8 and 17). The induction of t-LTP is therefore use dependent. The decline of t-LTP is use dependent also in that synaptic activation in the low frequency range reduces the amplitude of t-LTP (Figs 3, 4, 12 and 16). In contrast, synaptic inactivity suspends t-LTP once it is induced (e.g. Fig. 3) whereas synaptic activation in the high frequency range either prolongs the decay of t-LTP (Figs 12, 14 and 16) or prevents it, even from decaying (Fig. 16). Thereby, both the expression and the maintenance of t-LTP are use dependent. The most remarkable feature of t-LTP is, therefore, its use-dependent temporality, which can provide a basis for dynamic upregulation and downregulation of synaptic transmission. This feature makes t-LTP fundamentally different from s-LTP. s-LTP, like t-LTP, is also induced in a use-dependent manner. It is more static in its nature, however, and provides a constant level of neurotransmission. Notably, t-LTP-mediated modulation of synaptic efficacy is independent of s-LTP (Figs 5, 8 and 13), although t-LTP can be expressed in combination with s-LTP also.
Figure 18 depicts a hypothesis about dynamic modulation of synaptic transmission that is based on our knowledge of t-LTP and s-LTP. In addition, the figure provides an explanation of the mechanisms by which t-LTP and s-LTP might be expressed in a synapse and shows the consequences of their expression on synaptic transmission.
Figure 18. Transient LTP as a basis for dynamic modulation of synaptic transmission.
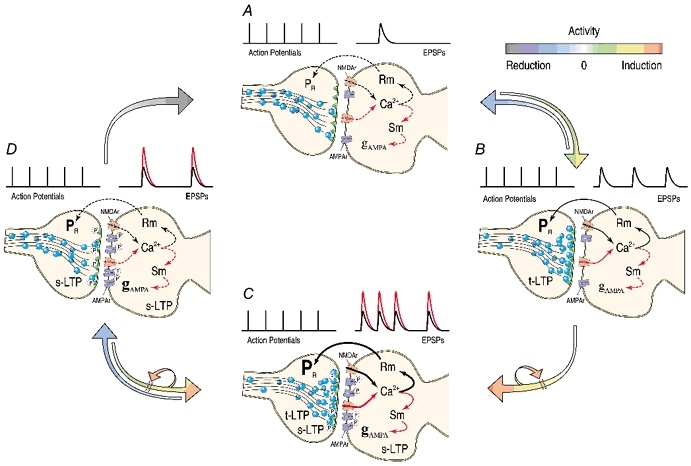
A, a non-potentiated synapse. The efficacies of this and following synapses are depicted at the top of the respective synapses in terms of the input/output relationships of the numbers of presynaptic action potentials and the corresponding numbers and amplitudes of EPSPs. The black arrows in the synapse indicate the hypothetical pathway that involves the production of a retrograde messenger (Rm) and leads to an upregulation of the probability of neurotransmitter release (PR). Red arrows show the second messenger (Sm) pathway that leads to an upregulation of AMPA receptor conductance (gAMPA). Potentiation can be induced by activation of each of the two pathways, depending on the potency of synaptic events. The ability of the synaptic events to either induce or reduce potentiation is depicted by the activity arrows, which correspond in their colour to the activity scale at the right top corner of the figure. B, a synapse in which t-LTP was induced presynaptically by an increase in PR (depicted by an increase in the numbers of docked vesicles). C, t-LTP and two forms of s-LTP can be induced by a potent synaptic activation. s-LTP can be expressed both presynaptically (presynaptic phosphorylation) and postsynaptically (phosphorylation and externalisation of AMPA receptors). D, usage of t-LTP by a sparse synaptic activation leads to a state in which only s-LTP is present.
A non-potentiated synapse is shown in Fig. 18A. The input/output relationship, which is visualised above this synapse, illustrates the hypothetical steady state of the synapse. The synapse can become potentiated through an upregulation of the probability of neurotransmitter release (PR) and/or through an increase in the AMPA receptor conductance (gAMPA). Induction of potentiation depends on high frequency pre- and postsynaptic events that increase [Ca2+]i through NMDA-receptor activation (Figs 1, 14 and 17). Our data suggest that t-LTP is induced postsynaptically (Fig. 1 and Fig. 17) and show that it is expressed presynaptically as an increase in PR (Figs 9, 10, 12 and 15). On the basis of this we suggest that the induction of t-LTP might involve a postsynaptic production of a retrograde messenger (Rm). The putative Rm would then signal back to the presynaptic terminal and enhance its PR through a promotion of the docking, priming and fusion of vesicles (black pathway, Fig. 18A). More permanent changes in the release machinery can also be induced by the Rm, which would lead to a stable upregulation of PR and to expression of s-LTP presynaptically (Fig. 12 and Fig. 15). s-LTP can also be expressed postsynaptically. In this case [Ca2+]i would activate second messengers (Sm), which lead to an upregulation of gAMPA (red pathway, Fig. 18A).
The activity bar in the upper right corner of Fig. 18 illustrates the patterns of presynaptic activation in terms of their ability to either reduce and/or induce potentiation. Synaptic activity (as in Fig. 17B), which supersedes the threshold for the induction of t-LTP, activates Rm and leads (green arrow) to an expression of t-LTP (depicted as an increase in the number of docked vesicles in Fig. 18B). The increase in PR caused by t-LTP enhances the frequency of successful synaptic releases as reflected in the input/output relationship shown above the synapse. Synaptic events that reduce t-LTP (blue arrow) eventually will reverse the synapse to the non-potentiated state (Fig. 18A). The amount of t-LTP expressed in the synapse will depend on a balance (Fig. 14 and Fig. 16) between activity-dependent reduction and re-induction of potentiation (illustrated by the blue and the green activity arrows).
A more potent inductive activation of the synapse in Fig. 18B (orange arrow) causes a greater activation of the Rm system (Fig. 18C). As a consequence, not only t-LTP but also s-LTP would be induced presynaptically (visualised by presynaptic phosphorylation, Fig. 18C). This would cause a further increase in the frequency of successful synaptic releases (as reflected by an increase in the number of black EPSPs). A postsynaptic increase in [Ca2+]i, which results from a potent inductive activation of the synapse, might also induce s-LTP caused by upregualtion of gAMPA (depicted by phosphorylation of AMPA receptors and an increase in their number, Fig. 18C). An increase in gAMPA would act as a postsynaptic amplifier of the upregulated PR (red EPSPs in the input/output relationship). Such a synapse would not only be highly reliable with regard to signal transduction but would also have a more efficient transmission of signals. It has to be noted, however, that the amounts of t-LTP, and the amounts of the two different forms of s-LTP that can be induced in a synapse, are strongly dependent on the patterns of synaptic activation and that a relaxation of a synapse, between clusters of potent inductive activity, plays an important role in the processes of their induction (Figs 16 and 17). This indicates that synaptic activity is not only able to change the reliability and efficiency of signal transduction, but is also able to constrain such changes (symbolised by the negative feedback arrows on the activity arrows). The two forms of s-LTP are not as readily reversible as t-LTP and a reduction of s-LTPs requires a prior reduction of t-LTP.
Reductive activation (blue arrow) of the synapse in Fig. 18C, will lead to a dynamic loss of t-LTP depending on the potency of synaptic activation (Fig. 18D, visualised by a decrease in the number of docked vesicles). The loss of t-LTP will decrease the reliability of synaptic transmission and the state of this synapse will be determined by the form of s-LTP that was induced. The steady state, with only presynaptic s-LTP present, would permit a greater synaptic reliability when compared with the non-potentiated synapse, whereas the postsynaptic presence of s-LTP would amplify the effects of a successful release. Inductive activation of such a synapse will re-induce t-LTP and reverse the synapse to the state that is shown in Fig. 18C.
s-LTP can be depotentiated by prolonged 1 Hz stimulation (Barrionuevo et al. 1980) and such reductive activation (grey arrow) will remove the s-LTPs (Fig. 18D) and lead the synapse to a non-potentiated state (Fig. 18A).
In conclusion, reductive and inductive patterns of synaptic activity modify the efficacy of synaptic transmission by adding and/or removing t-LTP and two forms of s-LTP in a synapse. Thereby, t-LTP allows dynamic changes in the synaptic efficacy through transient storage and synaptic activity-dependent usage of potentiation whereas s-LTP appears to be responsible for a more constant level of neurotransmission in a synapse.
DISCUSSION
NMDA receptor-dependent types of potentiation
The excitatory synapse in the stratum radiatum of the CA1 area of the hippocampus has a number of features that have been attributed to various aspects of memory encoding (Martin et al. 2000). One of the most studied of those features today is the NMDA receptor-dependent potentiation of synaptic transmission. High frequency tetanisation of the Schaffer collaterals induces two phases of such potentiation. Short-term potentiation (STP) and long-term potentiation (LTP) are names that are usually used to refer to the declining and stable phases of the NMDA receptor-dependent potentiation, respectively. In this study we have extended the definition of STP in that we have found that the decline of STP is use dependent and that STP can be stored for long periods of time after its induction. Therefore, we have called this type of potentiation ‘transient long-term potentiation' (t-LTP) and used the term ‘sustained long-term potentiation' (s-LTP) to describe the steady phase of potentiation. On the basis of our findings, t-LTP can be defined as NMDA-receptor dependent and synapse-specific change in the PR that is always modulated by synaptic activity. t-LTP can be separated from s-LTP on the basis of: (1) its induction, (2) its expression and (3) its maintenance. Although the properties of t-LTP can account for the existence of STP, we will use the term STP when referring to the original descriptions of the phenomenon that can be found in the literature.
Induction
It has been reported previously that the threshold for the induction of STP is lower than that for the induction of LTP (Hanse & Gustafsson, 1992; Schulz & Fitzgibbons, 1997). We extended these studies and found that the induction t-LTP depends on the frequency of tetanisation, whereas the induction of s-LTP is strictly related to the number of stimuli that are applied during a tetanus (Fig. 7 and Fig. 8). A substantial expression of both phenomena could be detected with various types of train tetanisation (Fig. 7 and Fig. 8). PPB stimulation, in contrast to train stimulation, could clearly distinguish between the thresholds for induction of t-LTP and s-LTP in that PPB stimulation with an in-burst frequency of 30 Hz permitted induction of t-LTP without an expression of s-LTP (Fig. 17). On the basis of the findings described above, it is tempting to suggest that t-LTP might be a phenomenon that encodes the frequency of the synaptic events whereas s-LTP might be responsible for encoding the numbers of events during patterns of high frequency synaptic activation.
It has been shown previously that STP and LTP share some common induction steps (Collingridge et al. 1983; Anwyl et al. 1989; Stevens et al. 1994; Tsien et al. 1996). Induction of STP and LTP in the CA1 area of hippocampus requires NMDA receptor activation (Fig. 1 and Fig. 17; Collingridge et al. 1983; Anwyl et al. 1989) and subsequent influx of Ca2+ postsynaptically (Anwyl et al. 1988; Malenka et al. 1992). Thereby, STP and LTP appear to be different from PTP (Fig. 1). However, the induction of STP differs from that of LTP also in that different levels of postsynaptic Ca2+ are needed for the initiation of the two phenomena (Malenka, 1991; Malenka et al. 1992).
Mice that lack CaMKII have deficient STP and LTP (Stevens et al. 1994; though see Hinds et al. 1998). However, pharmacological blockage of CaMKII blocks the expression of LTP but spares a phenomenon that resembles STP (Bortolotto & Collingridge, 1998; Toni et al. 1999). STP, in contrast to LTP, is expressed independently of CaMKIV (Ho et al. 2000). In general, STP-like phenomena seem to be less sensitive to the manipulation of second messengers and are often observed in experimental conditions that block expression of LTP (Malinow et al. 1988; Abel et al. 1997; Bortolotto & Collingridge, 1998; Nguyen et al. 2000). Whether or not all STP-like phenomena that are described above are equivalent to t-LTP is currently not known. It can be concluded nevertheless that t-LTP is induced differently from s-LTP, although a number of uncertainties are hindering a precise description of the mechanisms that are involved in their induction.
Phenomenology of expression
Historically, STP has been related to an early phase of LTP consolidation (Gustafsson & Wigstrom, 1990; Malenka, 1991; Colino et al. 1992) and it has been suggested that synapses in which induction of LTP has not been successful express STP (Xie et al. 1996). However, there exists no agreement about whether or not STP and LTP are reflections of a single process of potentiation that includes multiple phases of consolidation (Gustafsson & Wigstrom, 1990; Hanse & Gustafsson, 1994), or whether STP and LTP are reflections of two distinct phenomena that are independent of each other (Kauer et al. 1988; Schulz & Fitzgibbons, 1997).
In addition to the finding that t-LTP is induced differently from s-LTP we have presented a number of pieces of evidence, all of which indicate that t-LTP is expressed differently from s-LTP. We have shown that although both t-LTP and s-LTP can be stored for prolonged periods of time (e.g. Fig. 3), t-LTP is transient in its nature and decays inevitably during low frequency synaptic activation (e.g. Figs 3, 14 and 16). Furthermore, t-LTP can be stored for periods of time that are longer than the time periods needed for the protein synthesis-dependent consolidation of s-LTP (Fig. 3, Frey et al. 1988; Frey & Morris, 1998), indicating that the mechanisms for the expression of t-LTP and s-LTP are different. In spite of the finding that both t-LTP and s-LTP are dependent on the maximal amounts of potentiation (Pmax, Fig. 5) we were unable to show a direct correlation between the expression (amplitude) of t-LTP and that of s-LTP (Fig. 5 and Fig. 8). Similarly, the expressions of both t-LTP and s-LTP were not similar in their dependence on the pre-tetanic amounts of PPF slice preparations (Fig. 13). In addition, t-LTP could be reduced by stimulation during blockage of glutamate receptors without affecting the expression of s-LTP (Fig. 9) and the amplitudes of t-LTP and s-LTP were differently affected by Ca2+-free medium (Fig. 10). Blockage of NMDA receptors, after induction of both t-LTP and s-LTP, prevented the re-induction of t-LTP without affecting the expression of s-LTP (Fig. 14). In contrast, t-LTP was reduced while s-LTP was upregulated by the post-tetanic application of PPB stimulation in the presence of AP5 (Fig. 16). Thereby, these results indicate that t-LTP and s-LTP are subjected to constraints that are determined by both the history and the pattern of synaptic activation. It has been suggested previously that synaptic activity is able to inhibit the induction of LTP and that the history of NMDA-receptor activation plays a major role in the mechanisms of such inhibition (Huang et al. 1992). Although the data that are presented in this article support this view, the precise mechanisms that are involved in synaptic activity-mediated modulation of t-LTP and s-LTP remain to be determined. Nevertheless, on the basis of the above observations, t-LTP and s-LTP can be considered to be two independent phenomena that function as a continuum during dynamic modulation of synaptic transmission (Fig. 18). In support of this, STP and LTP can be either co-expressed or expressed independently of each other when studied in single synapses (Debanne et al. 1999).
The synaptic sites for expression of potentiation
The site of expression of potentiation in excitatory synapses is controversial (Davies et al. 1989; Squire & Kandel, 1999; Malinow & Malenka, 2002). Evidence suggests that synaptogenesis is involved in the expression of LTP (Geinisman et al. 1991, 1993; Geinisman, 1993; Toni et al. 1999). In contrast, changes in existing synapses may involve both presynaptic (Bekkers & Stevens, 1990; Kullmann et al. 1996; Antonova et al. 2001) and postsynaptic (Lynch & Baudry, 1984; Hjelmstad et al. 1997; Malinow & Malenka, 2002) sites. Presynaptically, LTP has been explained as an upregulation of release probability (Bekkers & Stevens, 1990; Kullmann et al. 1996; Fitzjohn et al. 2001; Sokolov et al. 2002). As the induction of LTP depends on the activation of the postsynaptic NMDA receptors, retrograde messengers have been suggested to be involved in the mechanisms that upregulate synaptic reliabilities (Williams et al. 1989; O'Dell et al. 1991). Data that support a postsynaptic expression of LTP indicate that changes in AMPA receptor phosphorylation (Stanton, 1996; Soderling & Derkach, 2000) may follow the expression of LTP. Furthermore, the finding of postsynaptic AMPA-receptor recycling (Nishimune et al. 1998; Noel et al. 1999), description of their trafficking (Shi et al. 1999, 2001; Hayashi et al. 2000), together with the finding of ‘silent’ synapses (Isaac et al. 1995) has revived an earlier view (Lynch & Baudry, 1984) that changes in the AMPA-receptor numbers may be involved in LTP (Nishimune et al. 1998; Luscher et al. 1999, 2000; Carroll et al. 1999; Hayashi et al. 2000). Other structural changes, such as alignment of the pre- and postsynaptic sites, have also been suggested (Xie et al. 1996, 1997).
One of the aims of our investigation has been to localise the site of t-LTP expression. We provide three lines of evidence, all of which suggest that t-LTP is expressed presynaptically as an enhanced PR. First, the experiments with kynurenate and LY341495 show that the stimulation-dependent decay of t-LTP does not involve the activation of ionotropic and metabotropic glutamate receptors (Fig. 9). Second, the expression of t-LTP is not affected by presynaptic activation when the release of vesicles is blocked in Ca2+-free medium (Fig. 10), and third, our PP stimulation experiments suggest that PR increases and is maximal just after tetanisation (Fig. 12). This enhanced PR seems to be stored together with the expression of t-LTP in the experiments in which testing of the phenomenon is delayed (Fig. 14).
The increases in PPF that were observed during the decay of t-LTP could be explained by changes in PPF caused by presynaptic alteration of PR (Fig. 15). In support of this, the increases in PPF could not be accounted for by a change in such factors as: (1) an increase in postsynaptic spiking (Fig. 11), (2) a change in stimulation intensity (Fig. 15), or (3) a decrease in the AMPA receptor-mediated conductance (Fig. 15). The results of these experiments, taken together with the three lines of evidence that were mentioned above, show that t-LTP is expressed presynaptically and that the reduction of t-LTP can be explained by a gradual decrease in PR in a population of synapses.
In the model that describes t-LTP and s-LTP-mediated dynamic regulation of synaptic transmission, we have suggested that s-LTP might be expressed both pre- and postsynaptically (Fig. 18). Our investigation of PPF suggests that expression of s-LTP involves a sustained upregulation of PR (Fig. 12 and Fig. 15). However, in two experiments, in which large amounts of s-LTP were induced by either repetitive tetanisation or PPB stimulation, the expression of t-LTP was also upregulated (Fig. 16 and Fig. 17). The latter might be explained by a postsynaptic expression of s-LTP, which magnifies the presynaptic expression of t-LTP, although the extent of such amplification remains to be determined.
In conclusion, our results show that t-LTP is expressed presynaptically and demonstrate that presynaptic factors have a substantial role in the expression of s-LTP. We believe, however, that the overwhelming evidence (reviewed in Malinow & Malenka, 2002), which points to the AMPA-receptor involvement in the modulation of synaptic transmission, provides additional clues for resolving the mysteries of synaptic and neuronal plasticity.
Maintenance
The decay of t-LTP (its maintenance) depends on the way in which it is induced and on the subsequent pattern of synaptic activation. When tested with single pulses, the decay of t-LTP depends on the number of stimuli applied during the post-tetanic period (Fig. 4). PP stimulation protocols when IPI < 1 s prolong the decay of t-LTP independently of the inter-pulse interval used. This shows that the decay of t-LTP is not a simple function of the number of vesicles released (Fig. 12). Furthermore, the process of decay is not correlated to the presynaptic changes in [Ca2+]i that underlie PP facilitation. Increasing the number of clustered high frequency stimuli (PPB stimulation) prevents the decay of t-LTP after its induction and can induce and maintain t-LTP in non-tetanised preparations (Fig. 16 and Fig. 17). These results indicate that short bursts of high frequency activity (from 30 to 200 Hz) within the physiological range of neuronal firing in the hippocampus (Dobrunz & Stevens, 1999) can induce, maintain and modulate t-LTP.
One of the notable findings of this study is that the decaying phase of t-LTP can be modulated by application of the NMDA-receptor antagonist AP5 (Fig. 14). This finding, taken together with the use-dependent decay of t-LTP, provides a framework within which the maintenance of t-LTP can be explained (Fig. 18). Clustered high frequency patterns of activity are well suited to activate NMDA receptors that lead to an elevation of the postsynaptic calcium concentration (Emptage et al. 1999). In order to maintain the enhanced release probability that underlies t-LTP, the NMDA receptor-mediated Ca2+ signal most probably operates a putative retrograde messenger system, similar to that which has been proposed for LTP (Williams et al. 1989; O'Dell et al. 1991). The induction and maintenance of t-LTP, unlike those of s-LTP, can hardly be separated from each other in that synaptic activity that induces t-LTP will also have a tendency to reduce it. Furthermore, the activation of the NMDA receptors will favour the induction of t-LTP (Fig. 14 and Fig. 16). Thereby, the amount of t-LTP which is present at any given time after its induction depends on a balance between a use-dependent reduction in PR and a concurrent re-induction of potentiation via the activation of NMDA receptors.
Synapse specificity is thought to be an important feature of various phenomena of synaptic transmission that might be involved in the encoding and the maintenance of memory (Martin et al. 2000). The induction, expression and maintenance of LTP are all input specific, although the extent of their true synapse specificity is presently under discussion (Frey & Morris, 1997; Engert & Bonhoeffer, 1997; Nishiyama et al. 2000). Our data show that both t-LTP and s-LTP are expressed in an input-specific manner (Fig. 6). Furthermore, t-LTP appears to be synapse specific in that it can be used and maintained in a sub-population of synapses after its induction (Fig. 6).
In conclusion, t-LTP and s-LTP differ in a large number of ways, including differences in induction, expression and maintenance of the two phenomena. On the basis of these differences we suggest that two substantially different types of NMDA receptor-dependent potentiation are co-existing in the excitatory synapses of the CA1 area of the Schaffer collaterals in the hippocampus and that these two types of potentiation might have different physiological functions in the regulation of synaptic transmission.
Final remarks
In spite of reports that the biochemical mechanisms underlying short- and long-term memories (Izquierdo et al. 1998, 2000) are different, a clear correlation between various types of synaptic phenomena and different types of memory has not yet been established (Stevens, 1998). It is perhaps too much to expect that any single phenomenon, such as t-LTP or s-LTP, can explain all the animate types of memory (Albright et al. 2000). Nevertheless, a phenomenon that resembles t-LTP has been observed during exploratory learning in rats (Moser et al. 1993; Moser et al. 1994) suggesting that transient types of potentiation might be involved in memory encoding.
To date, s-LTP has been the only phenomenon that has been used to explain the storage of memory in the mammalian brain and the issue about how STP could be involved in memory formation remained unclear. t-LTP may be a substrate for synapse-specific, use- and activity-dependent temporal associations, through the transient storage of potentiation. t-LTP might be an important factor that enables the formation of transient and temporally independent memory-maps in the brain. These maps may be used and forgotten, re-initiated or converted to a more permanent memory. Therefore, transient long-term potentiation may be the missing link in the theories of memory retention and encoding (Albright et al. 2000).
Acknowledgments
Some of the data that are presented in this article have been used in A. V.'s PhD dissertation at the Faculty of Medical Sciences, University of Aarhus, Denmark. Inquiries may be addressed to av@neuro.au.dk. We thank Professors P. Andersen, J. D. C. Lambert and H. Wigström for their comments on the data. We thank Professor M. West for his advice during the preparation of this manuscript and L. Munkøe for excellent technical assistance. Carlsbergfondet, Danish Medical Research Council, Grosserer L.F. Foghts fond and Lægeforeningens fond have provided financial support for this study. A. V. is currently supported by the Danish Medical Research Council.
REFERENCES
- Abel T, Nguyen PV, Barad M, Deuel TA, Kandel ER, Bourtchouladze R. Genetic demonstration of a role for PKA in the late phase of LTP and in hippocampus-based long-term memory. Cell. 1997;88:615–626. doi: 10.1016/s0092-8674(00)81904-2. [DOI] [PubMed] [Google Scholar]
- Albright TD, Jessell TM, Kandel ER, Posner MI. Neural science: a century of progress and the mysteries that remain. Cell. 2000;100:S1–55. [PubMed] [Google Scholar]
- Andersen P, Sundberg SH, Sveen O, Swann JW, Wigstrom H. Possible mechanisms for long-lasting potentiation of synaptic transmission in hippocampal slices from guinea-pigs. J Physiol. 1980;302:463–482. doi: 10.1113/jphysiol.1980.sp013256. [DOI] [PMC free article] [PubMed] [Google Scholar]
- Andreasen M, Lambert JD, Jensen MS. Effects of new non-N-methyl-D-aspartate antagonists on synaptic transmission in the in vitro rat hippocampus. J Physiol. 1989;414:317–336. doi: 10.1113/jphysiol.1989.sp017690. [DOI] [PMC free article] [PubMed] [Google Scholar]
- Antonova I, Arancio O, Trillat AC, Wang HG, Zablow L, Udo H, Kandel ER, Hawkins RD. Rapid increase in clusters of presynaptic proteins at onset of long-lasting potentiation. Science. 2001;294:1547–1550. doi: 10.1126/science.1066273. [DOI] [PubMed] [Google Scholar]
- Anwyl R, Lee WL, Rowan M. The role of calcium in short-term potentiation in the rat hippocampal slice. Brain Res. 1988;459:192–195. doi: 10.1016/0006-8993(88)90304-6. [DOI] [PubMed] [Google Scholar]
- Anwyl R, Mulkeen D, Rowan MJ. The role of N-methyl-D-aspartate receptors in the generation of short-term potentiation in the rat hippocampus. Brain Res. 1989;503:148–151. doi: 10.1016/0006-8993(89)91716-2. [DOI] [PubMed] [Google Scholar]
- Barrionuevo G, Schottler F, Lynch G. The effects of repetitive low frequency stimulation on control and ‘potentiated’ synaptic responses in the hippocampus. Life Sci. 1980;27:2385–2391. doi: 10.1016/0024-3205(80)90509-3. [DOI] [PubMed] [Google Scholar]
- Bekkers JM, Stevens CF. Presynaptic mechanism for long-term potentiation in the hippocampus. Nature. 1990;346:724–729. doi: 10.1038/346724a0. [DOI] [PubMed] [Google Scholar]
- Bliss TV, Lomo T. Long-lasting potentiation of synaptic transmission in the dentate area of the anaesthetized rabbit following stimulation of the perforant path. J Physiol. 1973;232:331–356. doi: 10.1113/jphysiol.1973.sp010273. [DOI] [PMC free article] [PubMed] [Google Scholar]
- Bortolotto ZA, Collingridge GL. Involvement of calcium/calmodulin-dependent protein kinases in the setting of a molecular switch involved in hippocampal LTP. Neuropharmacology. 1998;37:535–544. doi: 10.1016/s0028-3908(98)00058-6. [DOI] [PubMed] [Google Scholar]
- Bortolotto ZA, Fitzjohn SM, Collingridge GL. Roles of metabotropic glutamate receptors in LTP and LTD in the hippocampus. Curr Opin Neurobiol. 1999;9:299–304. doi: 10.1016/s0959-4388(99)80044-0. [DOI] [PubMed] [Google Scholar]
- Carroll RC, Beattie EC, Xia H, Luscher C, Altschuler Y, Nicoll RA, Malenka RC, von Zastrow M. Dynamin-dependent endocytosis of ionotropic glutamate receptors. Proc Natl Acad Sci U S A. 1999;96:14112–14117. doi: 10.1073/pnas.96.24.14112. [DOI] [PMC free article] [PubMed] [Google Scholar]
- Clark KA, Randall AD, Collingridge GL. A comparison of paired-pulsed facilitation of AMPA and NMDA receptor-mediated excitatory postsynaptic currents in the hippocampus. Exp Brain Res. 1994;101:272–278. doi: 10.1007/BF00228747. [DOI] [PubMed] [Google Scholar]
- Colino A, Huang YY, Malenka RC. Characterization of the integration time for the stabilization of long-term potentiation in area CA1 of the hippocampus. J Neurosci. 1992;12:180–187. doi: 10.1523/JNEUROSCI.12-01-00180.1992. [DOI] [PMC free article] [PubMed] [Google Scholar]
- Collingridge GL, Bliss TV. Memories of NMDA receptors and LTP. Trends Neurosci. 1995;18:54–56. [PubMed] [Google Scholar]
- Collingridge GL, Kehl SJ, McLennan H. Excitatory amino acids in synaptic transmission in the Schaffer collateral- commissural pathway of the rat hippocampus. J Physiol. 1983;334:33–46. doi: 10.1113/jphysiol.1983.sp014478. [DOI] [PMC free article] [PubMed] [Google Scholar]
- Davies SN, Lester RA, Reymann KG, Collingridge GL. Temporally distinct pre- and post-synaptic mechanisms maintain long-term potentiation. Nature. 1989;338:500–503. doi: 10.1038/338500a0. [DOI] [PubMed] [Google Scholar]
- Debanne D, Gahwiler BH, Thompson SM. Heterogeneity of synaptic plasticity at unitary CA3-CA1 and CA3-CA3 connections in rat hippocampal slice cultures. J Neurosci. 1999;19:10664–10671. doi: 10.1523/JNEUROSCI.19-24-10664.1999. [DOI] [PMC free article] [PubMed] [Google Scholar]
- Dobrunz LE, Stevens CF. Response of hippocampal synapses to natural stimulation patterns. Neuron. 1999;22:157–166. doi: 10.1016/s0896-6273(00)80687-x. [DOI] [PubMed] [Google Scholar]
- Emptage N, Bliss TV, Fine A. Single synaptic events evoke NMDA receptor-mediated release of calcium from internal stores in hippocampal dendritic spines. Neuron. 1999;22:115–124. doi: 10.1016/s0896-6273(00)80683-2. [DOI] [PubMed] [Google Scholar]
- Emptage NJ, Reid CA, Fine A. Calcium stores in hippocampal synaptic boutons mediate short-term plasticity, store-operated Ca2+ entry, and spontaneous transmitter release. Neuron. 2001;29:197–208. doi: 10.1016/s0896-6273(01)00190-8. [DOI] [PubMed] [Google Scholar]
- Engert F, Bonhoeffer T. Synapse specificity of long-term potentiation breaks down at short distances [published erratum appears in Nature, August 14th 1997; (vol. 388 (6643), p. 698] Nature. 1997;388:279–284. doi: 10.1038/40870. [DOI] [PubMed] [Google Scholar]
- Fitzjohn SM, Bortolotto ZA, Palmer MJ, Doherty AJ, Ornstein PL, Schoepp DD, Kingston AE, Lodge D, Collingridge GL. The potent mGlu receptor antagonist LY341495 identifies roles for both cloned and novel mGlu receptors in hippocampal synaptic plasticity. Neuropharmacology. 1998;37:1445–1458. doi: 10.1016/s0028-3908(98)00145-2. [DOI] [PubMed] [Google Scholar]
- Fitzjohn SM, Pickard L, Duckworth JK, Molnar E, Henley JM, Collingridge GL, Noel J. An electrophysiological characterisation of long-term potentiation in cultured dissociated hippocampal neurones. Neuropharmacology. 2001;41:693–699. doi: 10.1016/s0028-3908(01)00128-9. [DOI] [PubMed] [Google Scholar]
- Frey U, Krug M, Reymann KG, Matthies H. Anisomycin, an inhibitor of protein synthesis, blocks late phases of LTP phenomena in the hippocampal CA1 region in vitro. Brain Res. 1988;452:57–65. doi: 10.1016/0006-8993(88)90008-x. [DOI] [PubMed] [Google Scholar]
- Frey U, Morris RG. Synaptic tagging and long-term potentiation. Nature. 1997;385:533–536. doi: 10.1038/385533a0. [DOI] [PubMed] [Google Scholar]
- Frey U, Morris RG. Weak before strong: dissociating synaptic tagging and plasticity-factor accounts of late-LTP. Neuropharmacology. 1998;37:545–552. doi: 10.1016/s0028-3908(98)00040-9. [DOI] [PubMed] [Google Scholar]
- Geinisman Y. Perforated axospinous synapses with multiple, completely partitioned transmission zones: probable structural intermediates in synaptic plasticity. Hippocampus. 1993;3:417–433. doi: 10.1002/hipo.450030404. [DOI] [PubMed] [Google Scholar]
- Geinisman Y, De Toledo ML, Morrell F, Heller RE, Rossi M, Parshall RF. Structural synaptic correlate of long-term potentiation: formation of axospinous synapses with multiple, completely partitioned transmission zones. Hippocampus. 1993;3:435–445. doi: 10.1002/hipo.450030405. [DOI] [PubMed] [Google Scholar]
- Geinisman Y, de Toledo ML, Morrell F. Induction of long-term potentiation is associated with an increase in the number of axospinous synapses with segmented postsynaptic densities. Brain Res. 1991;566:77–88. doi: 10.1016/0006-8993(91)91683-r. [DOI] [PubMed] [Google Scholar]
- Gustafsson B, Wigstrom H. Long-term potentiation in the hippocampal CA1 region: its induction and early temporal development. Prog Brain Res. 1990;83:223–232. doi: 10.1016/s0079-6123(08)61252-2. [DOI] [PubMed] [Google Scholar]
- Hanse E, Gustafsson B. Postsynaptic, but not presynaptic, activity controls the early time course of long-term potentiation in the dentate gyrus. J Neurosci. 1992;12:3226–3240. doi: 10.1523/JNEUROSCI.12-08-03226.1992. [DOI] [PMC free article] [PubMed] [Google Scholar]
- Hanse E, Gustafsson B. Onset and stabilization of NMDA receptor-dependent hippocampal long-term potentiation. Neurosci Res. 1994;20:15–25. doi: 10.1016/0168-0102(94)90018-3. [DOI] [PubMed] [Google Scholar]
- Hayashi Y, Shi SH, Esteban JA, Piccini A, Poncer JC, Malinow R. Driving AMPA receptors into synapses by LTP and CaMKII: requirement for GluR1 and PDZ domain interaction. Science. 2000;287:2262–2267. doi: 10.1126/science.287.5461.2262. [DOI] [PubMed] [Google Scholar]
- Hinds HL, Tonegawa S, Malinow R. CA1 long-term potentiation is diminished but present in hippocampal slices from alpha-CaMKII mutant mice. Learn Mem. 1998;5:344–354. [PMC free article] [PubMed] [Google Scholar]
- Hjelmstad GO, Nicoll RA, Malenka RC. Synaptic refractory period provides a measure of probability of release in the hippocampus. Neuron. 1997;19:1309–1318. doi: 10.1016/s0896-6273(00)80421-3. [DOI] [PubMed] [Google Scholar]
- Ho N, Liauw JA, Blaeser F, Wei F, Hanissian S, Muglia LM, Wozniak DF, Nardi A, Arvin KL, Holtzman DM, Linden DJ, Zhuo M, Muglia LJ, Chatila TA. Impaired synaptic plasticity and cAMP response element-binding protein activation in Ca2+/calmodulin-dependent protein kinase type IV/Gr-deficient mice. J Neurosci. 2000;20:6459–6472. doi: 10.1523/JNEUROSCI.20-17-06459.2000. [DOI] [PMC free article] [PubMed] [Google Scholar]
- Huang YY, Colino A, Selig DK, Malenka RC. The influence of prior synaptic activity on the induction of long-term potentiation. Science. 1992;255:730–733. doi: 10.1126/science.1346729. [DOI] [PubMed] [Google Scholar]
- Isaac JT, Nicoll RA, Malenka RC. Evidence for silent synapses: implications for the expression of LTP. Neuron. 1995;15:427–434. doi: 10.1016/0896-6273(95)90046-2. [DOI] [PubMed] [Google Scholar]
- Izquierdo I, Barros DM, Mello, de Souza MM, Izquierdo LA, Medina JH. Mechanisms for memory types differ. Nature. 1998;393:635–636. doi: 10.1038/31371. [DOI] [PubMed] [Google Scholar]
- Izquierdo LA, Barros DM, Ardenghi PG, Pereira P, Rodrigues C, Choi H, Medina JH, Izquierdo I. Different hippocampal molecular requirements for short- and long-term retrieval of one-trial avoidance learning. Behav Brain Res. 2000;111:93–98. doi: 10.1016/s0166-4328(00)00137-6. [DOI] [PubMed] [Google Scholar]
- Katsuki H, Izumi Y, Zorumski CF. Removal of extracellular calcium after conditioning stimulation disrupts long-term potentiation in the CA1 region of rat hippocampal slices. Neuroscience. 1997;76:1113–1119. doi: 10.1016/s0306-4522(97)80003-6. [DOI] [PubMed] [Google Scholar]
- Kauer JA, Malenka RC, Nicoll RA. NMDA application potentiates synaptic transmission in the hippocampus. Nature. 1988;334:250–252. doi: 10.1038/334250a0. [DOI] [PubMed] [Google Scholar]
- Kleschevnikov AM, Sokolov MV, Kuhnt U, Dawe GS, Stephenson JD, Voronin LL. Changes in paired-pulse facilitation correlate with induction of long-term potentiation in area CA1 of rat hippocampal slices. Neuroscience. 1997;76:829–843. doi: 10.1016/s0306-4522(96)00342-9. [DOI] [PubMed] [Google Scholar]
- Kullmann DM, Erdemli G, Asztely F. LTP of AMPA and NMDA receptor-mediated signals: evidence for presynaptic expression and extrasynaptic glutamate spill-over. Neuron. 1996;17:461–474. doi: 10.1016/s0896-6273(00)80178-6. [DOI] [PubMed] [Google Scholar]
- Luscher C, Nicoll RA, Malenka RC, Muller D. Synaptic plasticity and dynamic modulation of the postsynaptic membrane. Nat Neurosci. 2000;3:545–550. doi: 10.1038/75714. [DOI] [PubMed] [Google Scholar]
- Luscher C, Xia H, Beattie EC, Carroll RC, Von Zastrow M, Malenka RC, Nicoll RA. Role of AMPA receptor cycling in synaptic transmission and plasticity. Neuron. 1999;24:649–658. doi: 10.1016/s0896-6273(00)81119-8. [DOI] [PubMed] [Google Scholar]
- Lynch G, Baudry M. The biochemistry of memory: a new and specific hypothesis. Science. 1984;224:1057–1063. doi: 10.1126/science.6144182. [DOI] [PubMed] [Google Scholar]
- Mainen ZF, Jia Z, Roder J, Malinow R. Use-dependent AMPA receptor block in mice lacking GluR2 suggests postsynaptic site for LTP expression. Nat Neurosci. 1998;1:579–586. doi: 10.1038/2812. [DOI] [PubMed] [Google Scholar]
- Malenka RC. Postsynaptic factors control the duration of synaptic enhancement in area CA1 of the hippocampus. Neuron. 1991;6:53–60. doi: 10.1016/0896-6273(91)90121-f. [DOI] [PubMed] [Google Scholar]
- Malenka RC, Kauer JA, Zucker RS, Nicoll RA. Postsynaptic calcium is sufficient for potentiation of hippocampal synaptic transmission. Science. 1988;242:81–84. doi: 10.1126/science.2845577. [DOI] [PubMed] [Google Scholar]
- Malenka RC, Lancaster B, Zucker RS. Temporal limits on the rise in postsynaptic calcium required for the induction of long-term potentiation. Neuron. 1992;9:121–128. doi: 10.1016/0896-6273(92)90227-5. [DOI] [PubMed] [Google Scholar]
- Malenka RC, Nicoll RA. Long-term potentiation - a decade of progress. Science. 1999;285:1870–1874. doi: 10.1126/science.285.5435.1870. [DOI] [PubMed] [Google Scholar]
- Malinow R, Malenka RC. AMPA receptor trafficking and synaptic plasticity. Annu Rev Neurosci. 2002;25:103–126. doi: 10.1146/annurev.neuro.25.112701.142758. [DOI] [PubMed] [Google Scholar]
- Martin SJ, Grimwood PD, Morris RG. Synaptic plasticity and memory: an evaluation of the hypothesis. Annu Rev Neurosci. 2000;23:649–711. doi: 10.1146/annurev.neuro.23.1.649. [DOI] [PubMed] [Google Scholar]
- Moser E, Moser MB, Andersen P. Synaptic potentiation in the rat dentate gyrus during exploratory learning. Neuroreport. 1993;5:317–320. doi: 10.1097/00001756-199312000-00035. [DOI] [PubMed] [Google Scholar]
- Moser EI, Moser MB, Andersen P. Potentiation of dentate synapses initiated by exploratory learning in rats: dissociation from brain temperature, motor activity, and arousal. Learn Mem. 1994;1:55–73. [PubMed] [Google Scholar]
- Nguyen PV, Abel T, Kandel ER, Bourtchouladze R. Strain-dependent differences in LTP and hippocampus-dependent memory in inbred mice. Learn Mem. 2000;7:170–179. doi: 10.1101/lm.7.3.170. [DOI] [PMC free article] [PubMed] [Google Scholar]
- Nishimune A, Isaac JT, Molnar E, Noel J, Nash SR, Tagaya M, Collingridge GL, Nakanishi S, Henley JM. NSF binding to GluR2 regulates synaptic transmission. Neuron. 1998;21:87–97. doi: 10.1016/s0896-6273(00)80517-6. [DOI] [PubMed] [Google Scholar]
- Nishiyama M, Hong K, Mikoshiba K, Poo MM, Kato K. Calcium stores regulate the polarity and input specificity of synaptic modification. Nature. 2000;408:584–588. doi: 10.1038/35046067. [DOI] [PubMed] [Google Scholar]
- Niu YP, Xiao MY, Karpefors M, Wigstrom H. Potentiation and depression following stimulus interruption in young rat hippocampi. Neuroreport. 1999;10:919–923. doi: 10.1097/00001756-199904060-00005. [DOI] [PubMed] [Google Scholar]
- Noel J, Ralph GS, Pickard L, Williams J, Molnar E, Uney JB, Collingridge GL, Henley JM. Surface expression of AMPA receptors in hippocampal neurons is regulated by an NSF-dependent mechanism. Neuron. 1999;23:365–376. doi: 10.1016/s0896-6273(00)80786-2. [DOI] [PubMed] [Google Scholar]
- O'Dell TJ, Hawkins RD, Kandel ER, Arancio O. Tests of the roles of two diffusible substances in long-term potentiation: evidence for nitric oxide as a possible early retrograde messenger. Proc Natl Acad Sci U S A. 1991;88:11285–11289. doi: 10.1073/pnas.88.24.11285. [DOI] [PMC free article] [PubMed] [Google Scholar]
- Schulz PE, Fitzgibbons JC. Differing mechanisms of expression for short- and long-term potentiation. J Neurophysiol. 1997;78:321–334. doi: 10.1152/jn.1997.78.1.321. [DOI] [PubMed] [Google Scholar]
- Shi S, Hayashi Y, Esteban JA, Malinow R. Subunit-specific rules governing AMPA receptor trafficking to synapses in hippocampal pyramidal neurons. Cell. 2001;105:331–343. doi: 10.1016/s0092-8674(01)00321-x. [DOI] [PubMed] [Google Scholar]
- Shi SH, Hayashi Y, Petralia RS, Zaman SH, Wenthold RJ, Svoboda K, Malinow R. Rapid spine delivery and redistribution of AMPA receptors after synaptic NMDA receptor activation. Science. 1999;284:1811–1816. doi: 10.1126/science.284.5421.1811. [DOI] [PubMed] [Google Scholar]
- Soderling TR, Derkach VA. Postsynaptic protein phosphorylation and LTP. Trends Neurosci. 2000;23:75–80. doi: 10.1016/s0166-2236(99)01490-3. [DOI] [PubMed] [Google Scholar]
- Sokolov MV, Rossokhin AV, Astrelin AV, Frey JU, Voronin LL. Quantal analysis suggests strong involvement of presynaptic mechanisms during the initial 3 h maintenance of long-term potentiation in rat hippocampal CA1 area in vitro. Brain Res. 2002;957:61–75. doi: 10.1016/s0006-8993(02)03600-4. [DOI] [PubMed] [Google Scholar]
- Squire LR, Kandel ER. Memory: From Mind to Molecules. New York: Scientific American Library; 1999. [Google Scholar]
- Stanton PK. LTD, LTP, and the sliding threshold for long-term synaptic plasticity. Hippocampus. 1996;6:35–42. doi: 10.1002/(SICI)1098-1063(1996)6:1<35::AID-HIPO7>3.0.CO;2-6. [DOI] [PubMed] [Google Scholar]
- Stevens CF. A million dollar question: does LTP = memory. Neuron. 1998;20:1–2. doi: 10.1016/s0896-6273(00)80426-2. [DOI] [PubMed] [Google Scholar]
- Stevens CF, Wang Y. Facilitation and depression at single central synapses. Neuron. 1995;14:795–802. doi: 10.1016/0896-6273(95)90223-6. [DOI] [PubMed] [Google Scholar]
- Toni N, Buchs PA, Nikonenko I, Bron CR, Muller D. LTP promotes formation of multiple spine synapses between a single axon terminal and a dendrite. Nature. 1999;402:421–425. doi: 10.1038/46574. [DOI] [PubMed] [Google Scholar]
- Tsien JZ, Huerta PT, Tonegawa S. The essential role of hippocampal CA1 NMDA receptor-dependent synaptic plasticity in spatial memory. Cell. 1996;87:1327–1338. doi: 10.1016/s0092-8674(00)81827-9. [DOI] [PubMed] [Google Scholar]
- Williams JH, Errington ML, Lynch MA, Bliss TV. Arachidonic acid induces a long-term activity-dependent enhancement of synaptic transmission in the hippocampus. Nature. 1989;341:739–742. doi: 10.1038/341739a0. [DOI] [PubMed] [Google Scholar]
- Xie X, Barrionuevo G, Berger TW. Differential expression of short-term potentiation by AMPA and NMDA receptors in dentate gyrus. Learn Mem. 1996;3:115–123. doi: 10.1101/lm.3.2-3.115. [DOI] [PubMed] [Google Scholar]
- Xie X, Liaw JS, Baudry M, Berger TW. Novel expression mechanism for synaptic potentiation: alignment of presynaptic release site and postsynaptic receptor. Proc Natl Acad Sci U S A. 1997;94:6983–6988. doi: 10.1073/pnas.94.13.6983. [DOI] [PMC free article] [PubMed] [Google Scholar]
- Zucker RS. Calcium- and activity-dependent synaptic plasticity. Curr Opin Neurobiol. 1999;9:305–313. doi: 10.1016/s0959-4388(99)80045-2. [DOI] [PubMed] [Google Scholar]