Abstract
Recent studies have suggested that aquaporin-1 (AQP1) as well as the HCO3−–Cl− transporter may be involved in CO2 transport across biological membranes, but the physiological importance of this route of gas transport remained unknown. We studied CO2 transport in human red blood cell ghosts at physiological temperatures (37 °C). Replacement of inert with CO2-containing gas above a stirred cell suspension caused an outside-to-inside directed CO2 gradient and generated a rapid biphasic intracellular acidification. The gradient of the acidifying gas was kept small to favour high affinity entry of CO2 passing the membrane. All rates of acidification except that of the approach to physicochemical equilibrium of the uncatalysed reaction were restricted to the intracellular environment. Inhibition of carbonic anhydrase (CA) demonstrated that CO2-induced acidification required the catalytic activity of CA. Blockade of the function of either AQP1 (by HgCl2 at 65 μM) or the HCO3−–Cl− transporter (by DIDS at 15 μM) completely prevented fast acidification. These data indicate that, at low chemical gradients for CO2, nearly the entire CO2 transport across the red cell membrane is mediated by AQP1 and the HCO3−–Cl− transporter. Therefore, these proteins may function as high affinity sites for CO2 transport across the erythrocyte membrane.
Because of its lipophilic nature, it is generally assumed that CO2 transport across biological membranes occurs by diffusion through the lipid bilayer. The discovery that apical membranes of gastric glands have an extremely low permeability to CO2 (Waisbren et al. 1994) questioned this common view and initiated a quest for additional routes of membrane CO2 transport. In 1998, Boron and coworkers (Cooper & Boron, 1998; Nakhoul et al. 1998) demonstrated that the expression of the water channel aquaporin-1 (AQP1) in Xenopus oocyte membranes, which display a low endogenous CO2 permeability, increased their permeability to CO2, suggesting that AQP1 may also function as a gas channel (for review see Cooper et al. 2002). In addition, studies in human red blood cell membranes showed that blockade of the HCO3−–Cl− transporter by 4,4′-diisothiocyanato- stilbene-2,2′-disulfonic acid (DIDS) reduced the CO2 permeability of the human red blood cell membrane (Forster et al. 1998) indicating that the erythrocyte HCO3−–Cl− transport protein could also be involved in CO2 exchange (Fig. 1). Interestingly, the function of AQP1 and the HCO3−–Cl− transporter, which make up a large fraction of total erythrocyte membrane protein and cover a substantial portion of its surface, appear to be coupled. The water transport inhibitor p-chloromercuriphenyl-sulfonic acid (pCMBS) has been shown to inhibit the binding site of the specific anion exchange inhibitor 4,4′-dibenzoamido-2,2′-disulfonic stilbene (DBDS; Lukacovic et al. 1984). Furthermore, red blood cell urea and water transport seem to occur in parallel (Toon & Solomon, 1986; Ojcius & Solomon, 1988). These observations support the concept that water transport may be structurally coupled to other membrane transport processes.
Figure 1. Schematic diagram illustrating possible routes of CO2 entry into the human erythrocyte and secondary transport processes.
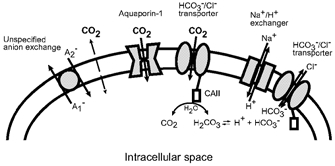
CO2 may enter the erythrocyte either by directly diffusing through the lipid bilayer or by passing through membrane proteins (aquaporin-1, HCO3−–Cl− transporter) which would function as gas channels. Once CO2 has entered the erythrocyte, it will be hydrated by CAII bound to the carboxyl terminus of the HCO3−–Cl− transporter. Intracellular carbonic acid then dissociates into a proton and bicarbonate. Both reaction products can be eliminated from the intracellular space by specific transporters, the Na+-H+ exchanger and the HCO3−–Cl− transporter. These processes will further increase the entry of CO2 and therefore intracellular acidification. Net proton fluxes may also be linked to anion exchange activity (unspecified anion exchange with substrates A1− and A2−).
Taken together, these findings raise the question whether CO2 transport through AQP1 and the HCO3−–Cl− transporter may be a general physiological route for CO2 exchange (Fig. 1). The aim of this study was to test this hypothesis in human red blood cell membranes, which express AQP1 and the HCO3−–Cl− transporter at very high levels (Jennings, 1984; Denker et al. 1988).
METHODS
Ghost preparation
Blood from healthy volunteers (age 22-45 years) was drawn into K+-EDTA tubes (S-Monovette, Sarstedt, Germany) and immediately subjected to the preparation of ghosts, which was performed according to Dodge et al. (1963). Erythrocytes were washed twice prior to haemolysis (lysis in 30 volumes of phosphate buffered saline (PBS), 20 mosmol kg−1, pH = 7.35 ± 0.2). Lysed cells were washed one to three times under the same conditions and then resealed at 37 °C for 1 h in 10 mM PBS, 300 mosmol kg−1, pH = 7.35 ± 0.2. The cells were loaded with 2′,7′-bis(carboxyethyl)-5(6)-carboxyfluorescein (BCECF) by incubation with the corresponding acetoxymethyl ester (BCECF-AM) for 30 min. Dye-loaded ghosts were washed twice, suspended in 25 volumes PBS, and routinely analysed for concentration of haemoglobin in a Beckman DU 70 spectrophotometer (Beckman Instruments Inc., USA). Supernatants were assayed for haemoglobin and BCECF to control cell leakiness. Possible leakage of dye from the ghosts was also checked for by (i) evaluating the signal to noise ratio with time and (ii) by following the emission signal (at 530 nm) with excitation at 440 nm. Neither method indicated substantial (≤ 5 %) leakage of dye from the ghosts. Within the indicated error all signals were stable for periods > 60 min.
All procedures conformed with the Declaration of Helsinki and written informed consent was given by the subjects.
Experimental set-up
Samples (1.5 ml) were incubated in fluorescence cells for 10 min to achieve temperature equilibrium. Except where otherwise stated, the temperature was held at 37 °C. The samples were stirred at fixed speed (950 r.p.m.) and exposed to a constant gas flow at a rate of 2.5 l h−1, which was controlled and set with a calibrated Rotameter (Rota Yokogawa, Germany). The gas passed through a stopper and was blown onto the surface of either a suspension of ghosts in 300 mosmol kg−1 PBS or onto plain PBS ('ghost free'), dependent on the type of assay. Tubing, connections and valves were of the capillary type to keep dead space at a minimum. A capillary bore in the stopper granted pressure relief.
Nitrogen (N2) was used as an inert, non-acidifying gas while carbogen (5 % CO2, 95 % O2) was used as a normal gas mixture to acidify the cells. In some experiments lower fractions of CO2 were administered, which was achieved by compensating a reduced carbogen flow with N2 to yield a total flow of 2.5 l h−1.
Standard protocol
Samples were gassed with N2. After an appropriate time (≈5–10 min) the inert gas was replaced with carbogen and acidification, as a result of the reaction CO2 + H2O ⇄ H+ + HCO3−, was calculated from the fluorescence signals of BCECF. Some of the experiments were performed with a switch back to N2 after acidification. Replacement of CO2 with N2 showed that acidification was reversible but pH recovery was not symmetrical (Fig. 2A). This was confirmed by gassing ghost free buffer (Fig. 2B). Steady state of the intracellular pH (pHi) was achieved after ≈1 h (Fig. 3) but usually not recorded.
Figure 2. Asymmetry of acidification and pHi recovery.
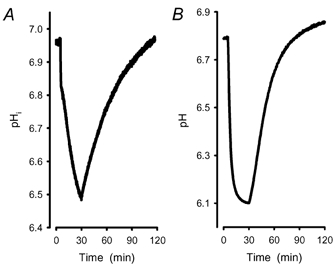
A, intracellular acidification in ghosts under exposure to carbogen. After 30 min, carbogen was replaced by N2. The initial pHi was regained after ∼90 min gassing with N2. The rate of acidification is greater than the rate of pHi recovery. B, recording of an acidification of ghost free buffer (10 mM Tris, pH 6.8). At this pH there is no buffer capacity left in a Tris–HCl buffer system. Therefore the steady state was reached after ∼30 min and pH is down to 6.1. Replacement of CO2 with N2 also showed an asymmetric pH recovery.
Figure 3. Steady state of pHi after prolonged exposure to CO2.
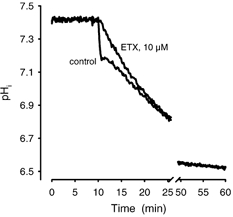
Gassing a ghost suspension in PBS with carbogen (control) showed an initial fast acidification and then a slow approach to the physicochemical equilibrium, which was reached after ∼60 min. Addition of ETX (10 μM) to the ghost suspension blocked the initial fast component. The physicochemical equilibrium was not affected by the addition of ETX.
Measurement of fluorescence
Fluorescence was measured in a Hitachi F2000 spectrophotometer (Hitachi Scientific Instruments, Japan). Excitation scans were used to assay for the amount of BCECF in the suspension or solution. Measurement of pH for ratio calibration was performed either by using nigericin (final concentration: 1 μM) in 10 mM phosphate buffered 154 mM potassium chloride (300 mosmol kg−1, pH = 7.4 ± 0.15) on dye-loaded cells or with BCECF (free acid) in PBS. HCl (100 mM) was added in 10 μl steps and the suspension or solution was allowed to equilibrate to provide a stable signal. Then pH was measured and correlated to the ratio of the emission signals at 530 nm with excitation set to 502 and 440 nm, respectively. An excitation wavelength of 502 was chosen after the calculation of average peak excitation of 30 recordings at an emission wavelength of 530 nm. We found that under our experimental conditions peak excitation was 501.6 ± 1.2 nm (n = 30).
No statistically relevant differences could be detected using either calibration method. Curve fitting for non-linear regression gave r2 values close to 1 (Fig. 4A), (BCECF, nigericin, in phosphate buffered potassium chloride: r2 > 0.999 for a sigmoidal fit; y = a + b/(1+ e(-(x - c)/d)), with: a = 0.360 ± 0.112, b = 10.515 ± 0.221, c = 7.035 ± 0.011 and d = 0.454 ± 0.015; n = 5).
Figure 4. BCECF calibration curve and dependency of acidification rates on the concentration of CO2.
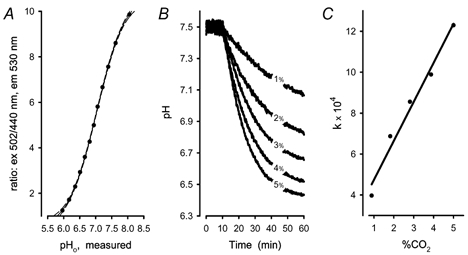
A, BCECF calibration curve measured in a ghost suspension at 1 μM nigericin in 10 mM phosphate buffered potassium chloride (154 mM, 300 mosmol kg−1, pH 7.4 ± 0.15). Data were fitted to a sigmoidal mechanism (y = a + b/(1+e(-(x - c)/d))), with r2 > 0.999. Filled circles: pHo, measured; continuous line: fit results; dashed lines: 95 % confidence. B, recordings of acidification in ghost free buffer with ∼1, 2, 3, 4 and 5 % CO2 in the feeding gas. Values corrected for density differences were 0.884, 1.82, 2.81, 3.87, and 5 % CO2, respectively. C, rates of acidification were obtained by fitting the recordings of acidification (B) to a mono exponential mechanism. Filled circles: calculated velocity constants (k) of a mono-exponential fit; continuous line: linear regression curve (r2 > 0.975).
To assess whether the uncatalysed acidification rate was proportional to the CO2 fraction in the feeding gas, PBS was gassed with different fractions of CO2 in the gas mixture (5, 4, 3, 2, and 1 %, respectively). Since actually the number of particles or molar amounts of CO2 had to be considered, values were corrected for pressure and temperature. The equilibration curves for each fraction of CO2 (Fig. 4B) were subjected to regression analysis and revealed regression coefficients with r2 > 0.995 for mono-exponential fits. The resulting velocity constants were plotted as a function of CO2 and regression analysis was performed again. When assayed for linear relationship the analyses showed regression coefficients indicating a statistical error < 2.5 % (Fig. 4C, r2 > 0.975). Fits to sigmoidal equations gave only slightly better coefficients (r2 > 0.998).
Materials
Human carbonic anhydrase II (CAII, E.C. 4.2.1.1), 6-ethoxy-2-benzothiazolesulfon-amide (ETX), p-chloromercuriphenyl-sulfonic acid (pCMBS), p-chloromercuribenzoic acid (pCMBenzA), and nigericin were obtained from Sigma-Aldrich Co. (Taufkirchen, Germany), 5-(N-ethyl-N-isopropyl)-amiloride (EIPA) was from Molecular Probes (Eugene, OR, USA) and BCECF, BCECF-AM and 4,4′-diisothiocyanato-stilbene-2,2′-disulfonic acid (DIDS) were obtained from Calbiochem (Bad Soden, Germany). All other chemicals were of analytical grade.
Curve fitting procedures and statistics
Curve fitting was performed using TableCurve by SPSS Inc. Values are expressed as means ± S.D. Statistical evaluation was done by one-way ANOVA followed by the Bonferroni procedure; P < 0.05 was taken as the level of significance.
RESULTS
The time course of acidification in control experiments could be dissected into several segments, which, taken separately, could be approximated by quasi first-order functions (Fig. 5). The intracellular pH fell at a high rate immediately after CO2 flow had been turned on (a in Fig. 5). Average velocity constant derived from a mono-exponential fit to the fast component of the acidification curve (kin,a) was (3.71 ± 0.93) × 10−2 s−1 and average decrease in pH after switching from inert to acidifying gas (ΔpHa) was 0.35 ± 0.09 (n = 41). This was followed by a much more slower decrease of pH (b in Fig. 5), with velocity constant derived from a mono-exponential fit to the slow component of the acidification curve (kin,b) = (6.40 ± 2.00) × 10−4 s−1 (n = 41). In ≈35 % of the experiments pH transiently returned towards the baseline value after its initial fall, before the second, slower decrease commenced. This indicates that transport processes are activated, which eliminate acid equivalents from the red blood cell.
Figure 5. General protocol of an intracellular acidification of a ghost suspension under exposure to CO2.
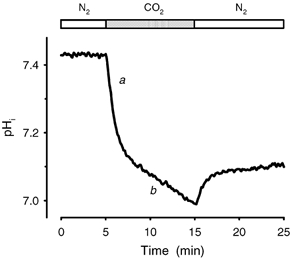
Acidification was measured with the fluorescent dye BCECF. Excitation wavelengths were set to 502 and 440 nm, emission to 530 nm. The samples (1.5 ml) were incubated in fluorescence cells for 10 min, at 37 °C. Gas flow through a stopper was 2.5 l h−1. The suspension was stirred at 950 r.p.m. First, inert gas (N2) was used (open bars); then after an appropriate time (here 5 min), gas supply was switched to acidifying gas (carbogen, grey bar). If necessary the cycle was repeated. The graph can be fitted by several mono-exponential functions. a denotes the fast process of acidification, b the slow approach to physicochemical equilibrium.
Data obtained in the presence of the Na+-H+ exchange inhibitor EIPA (10 μM) showed that Na+-H+ exchange participates to a lesser extent in the elimination of H+ into the extracellular space. The hindrance of H+ back flux was not very pronounced but led to a more distinct transient (Fig. 6C). The time course of acidification could be fitted with a (horizontally) mirrored Bateman function, to which a mono-exponential (part b in Fig. 5) was added. Several experiments (n = 4) in which ghosts were resealed in different buffer systems (PBS, Tris–HCl and Mops each at 10 mM) showed that the elimination of acidic equivalents also depends on the availability of the buffer anion to the anion exchanger (PBS > Tris–HCl > Mops). Furthermore, the elimination of acidic equivalents was markedly decreased at lower temperature (25 °C), at which the overshoot was more prominent (Fig. 6D).
Figure 6. Influence of the proton net back flux capacity on the extent of the fast acidification process.
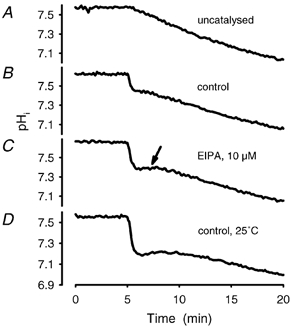
Comparison of the uncatalysed acidification (A) with a control assay (B) and experiments with retarded back flux (C and D). The samples were incubated under conditions as described in Fig. 5. A, a typical uncatalysed reaction. An uncatalysed reaction is achieved either by adding ETX (10 μM) to the ghost suspension or by gassing PBS to which BCECF (free acid) had been added (see Fig. 7A and B). B, a control experiment, which is the time course of acidification according to the standard protocol. C, a retarded back flux under conditions that inhibit the Na+-H+ antiporter (10 μM EIPA, incubated for 30 min prior to acidification). The arrow indicates the more pronounced plateau phase (kinetic data of acidification using a mono-exponential fit, see Table 1). D demonstrates that a temperature-sensitive transport mechanism is involved in the back flux of acidic equivalents. The temperature was lowered to 25 °C and caused a significant drop in acidification after the onset of CO2, since the elimination of acidic equivalents is retarded (kinetic data of acidification using a mono-exponential fit, see Table 1).
The second, slower decrease in pH (b in Fig. 5) represents the approach to physicochemical equilibrium. A pure approach to the physicochemical equilibrium, without a fast phase, should also result either (1) if ghost-free PBS is gassed according to the standard protocol, or (2) if carbonic anhydrase is blocked, e.g. by adding the carbonic anhydrase inhibitor ETX (10 μM) to the experimental preparation. As shown in Fig. 7, both predictions could be confirmed experimentally (n = 14).
Figure 7. Gassing of ghost-free buffer and gassing CAII-blocked ghost suspensions reveal identical time courses.
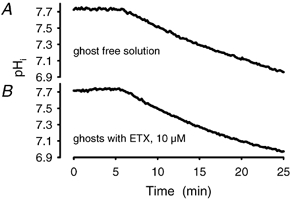
Approach to the physicochemical equilibrium: comparison of the time course of acidification of uncatalysed reactions. A, time course of a ghost-free buffer (PBS: 10 mM, 300 mosmol kg−1, pH: 7.4) solution to which BCECF (free acid) has been added. B, typical time course of acidification with blocked CAII activity through addition of the membrane-permeant ETX (10 μM). The time constants of both assays were not statistically different.
The abolition of the fast acidification process by ETX indicates that the catalytic activity of CA is required for the fast component of the pH response. Loading of ghosts under resealing conditions with increasing amounts of human CAII did not significantly affect fast acidification (n = 3, see Fig. 8A). When CAII was added to either plain PBS buffer or to ghost suspension and subsequently inhibited by ETX, the acidification curves were identical to those of the approach to uncatalysed physicochemical equilibration. The time course and shape were not different from those in Fig. 7A. Without inhibition by ETX the assays with CAII added to plain PBS buffer or to ghost suspension showed nearly identical rates of acidification. The acidification rates in the presence of CAII were higher than those of the slow process (b in Fig. 9B), but they were still considerably lower compared to that of the fast response (a in Fig. 9B). The same was true if cells in a ghost suspension had undergone lysis by dilution into 6 volumes of hyposmotic (20 mosmol kg−1) buffer (Fig. 8B). Data were subjected to curve fitting and gave results with r2 > 0.95 when assayed for bi-exponential mechanisms.
with (1) addition of CAII (n = 5):
 |
and (2) after lysis (n = 5):
 |
Figure 8. CAII activity in a ghost preparation is not rate limiting under experimental conditions.
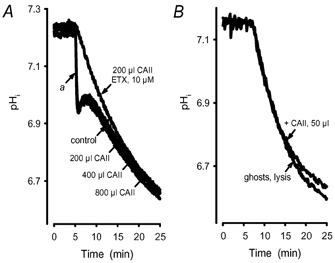
A, under the condition of resealing, ghosts were incubated with different amounts of human CAII (0, 200, 400 and 800 μl of 2.5 mg ml−1 CAII). a denotes the fast acidification for the four assays. The statistical error of the initial rates is < 5 %, i.e. CAII load of a ghost preparation does not increase the rate or the ΔpHi of the fast acidification. B, the rate of acidification after addition of CAII (50 μl) to a ghost suspension was very similar to the rate of acidification calculated for ghosts that had undergone lysis by a 1:6 dilution into hyposmotic (20 mosmol kg−1) PBS.
Figure 9. Intracellular CAII is required for fast and biphasic acidification.
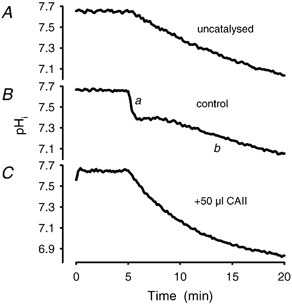
Addition of CAII (50 μl of 2.0 mg ml−1 human CAII) to the extracellular compartment of a ghost suspension (C) yields higher rates than the uncatalysed approach to the physicochemical equilibrium (A) (by addition of 10 μM ETX to the ghost suspension). No difference from Fig. 6A and Fig. 7B regarding the velocity constants could be detected. B, a control experiment with a fast (a) and a slow (b) acidification response.
In the presence of pCMBS (1 mM), which blocks AQP1, we found a moderate decrease in the amount of initial acidification in the range of 10–15 % (n = 8), and likewise in the rate constant (Fig. 10 and Table 1). Almost identical results were obtained with the similar chemical pCMBenzA at 1 mM (data not shown). A much more pronounced inhibition than after pCMBS was observed after addition of the AQP1 blocker HgCl2, which completely suppressed the fast process at a concentration of approximately 65 μM. At this concentration of HgCl2 the time course of acidification was identical to that of the chemical equilibrium curve. The IC50 of HgCl2 at 37 °C was 39 ± 6 μM (n = 16; Fig. 11).
Figure 10. Comparison of the effect of the AQP1 blocker pCMBS and HgCl2.
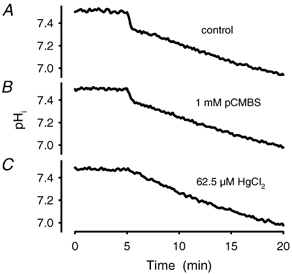
A, a control experiment. B, the sample has been incubated for 15 min with pCMBS at a final concentration of 1 mM. The change of pH in the fast phase is less and the time constant of that process is smaller compared to control. C represents the time course of an acidifying process measured in ghosts with HgCl2 at a concentration of 62.5 μM. After onset of CO2 the time course is not distinguishable from an uncatalysed reaction.
Table 1.
Effects of experimental interventions on the time course of intracellular acidification
| ΔpHa (% of control) | kin,a (% of control) | kin,b (% of control) | n | |
|---|---|---|---|---|
| Control (25 °C) | 199 ± 18* | 77 ± 6* | 65 ± 27* | 7 |
| EIPA (10 μm) | 131 ± 16* | 98 ± 13 | 112 ± 20 | 8 |
| PCMBS (1 mm) | 85 ± 10* | 87 ± 6* | 76 ± 9* | 8 |
| DIDS (1.5 μm) | 74 ± 7* | 89 ± 10* | 96 ± 12 | 25 |
| DIDS (7.5 μm) | 30 ± 5* | 102 ± 12 | 123 ± 12* | 25 |
| DIDS (15 μm) | n.d. | n.d. | 213 ± 25* | 25 |
Quantitative analysis of the effects of temperature (25 °C), pharmacological blockade of the Na+-H+ transporter (EIPA), pharmacological blockade of AQP1 (PCMBS), and pharmacological blockade of the HCO3−–Cl− transporter (DIDS). ΔpHa represents the initial rapid decrease in pH after switching from inert to acidifying gas. Values were derived from a curve fit to a mono-exponential mechanism and are given as relative change from the paired control assay. kin,a represents the velocity constant derived from a mono-exponential fit to the fast component of the acidification curve (see a in Fig. 5), expressed as relative value of the paired control assay; kin,b represents the velocity constant derived from a mono-exponential fit to the slow component of the acidification curve (see b in Fig. 5), expressed as relative value of the paired control assay, n.d., not determined; n, number of experiments
P < 0.05 vs. control.
Figure 11. Establishment of a dose–response curve for the AQP1 inhibitor HgCl2.
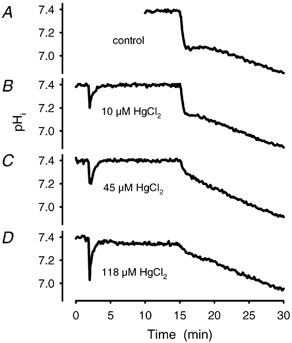
A dose–response curve has been derived from acidification experiments in the presence of various concentrations of HgCl2. Incubation time was 13 min. A, control with vehicle (PBS) added. B, time course at 10 μM HgCl2. C, time course at 45 μM HgCl2 and D, at 118 μM HgCl2. The IC50 calculated from the velocity constants was 39 ± 6 μM, n = 16.
Since HgCl2 has been suggested to slow acidification in reconstituted proteoliposomes by inhibiting CA rather than AQP1 (Yang et al. 2000; Fang et al. 2002; Verkman, 2002), we measured CAII-catalysed acidification in ghost free PBS in the presence of HgCl2. At 15 μM HgCl2 the rate was slowed down by 1.8 % (n = 3, P > 0.05), and at 150 μM by 16.6 % (n = 3, P < 0.05). These results indicate that, at least in our ghost preparation, only a small fraction of the inhibitory effect of HgCl2 on the fast initial acidification can be explained by an inhibition of CAII by HgCl2, because the fast process was already totally blocked at HgCl2 concentrations > 65 μM.
DIDS, an inhibitor of the HCO3−–Cl− transporter, also inhibited the intracellular acidification of red blood cell ghosts exposed to CO2. The extent of inhibition was concentration dependent (Fig. 12, Table 1) and highly influenced by incubation conditions like duration and exposure to light sources. (The light-sensitive compound was also sensitive to photometric light.) The fast process was completely abolished after 15 min of incubation at a DIDS concentration of 15 μM (n = 25; IC50: 5.6 ± 1.2 μM). Inhibition by DIDS was temperature sensitive, but to a lesser extent than that by HgCl2 (data not shown).
Figure 12. Establishment of a dose–response curve for the HCO3−–Cl− transport inhibitor DIDS.
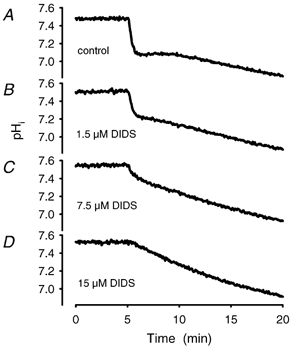
A dose–response curve has been derived from acidification experiments in the presence of various concentrations of DIDS. The time course of acidification was registered after incubation with DIDS for 10 min. A, control with vehicle (PBS) added. B, time course at 1.5 μM DIDS. C, time course in the presence of 7.5 μM DIDS and D, at 15 μM DIDS. The IC50 calculated from the velocity constants was 5.6 ± 1.2 μM, n = 25.
At 37 °C, a combination of DIDS (10 μM) and HgCl2 (40 μM) completely blocked fast acidification (3–5 % ghost-volume; n = 11, Fig. 13). If DIDS was administered first, the drop of the fluorescence ratio, which occurred immediately after the addition of HgCl2, did not recover completely within the next 10–15 min (b in Fig. 13C). Regaining of a normal pH is obviously linked to a high capacity exchange mechanism, which can be inhibited with DIDS (Gros & Moll, 1974; Gros et al. 1976; Bisognano et al. 1993).
Figure 13. Comparison of acidification in the intracellular and extracellular compartment in control and inhibition experiments.
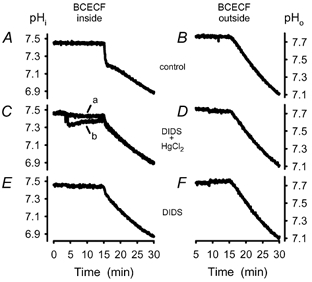
Fluorescence inside the cell was measured as usual on BCECF-loaded cells. To measure outside the cells, ghosts were used that were not loaded with dye and added membrane-impermeant BCECF (free acid) to the outer compartment. A, control experiment (vehicle: PBS). B, same as A but with BCECF outside the cells. C, a, HgCl2 (10 μM) was added prior to DIDS (8 μM); b, DIDS (8 μM) was added prior to HgCl2 (10 μM). D, same as C a, but with BCECF outside the cells. E, DIDS (10 μM) present in the preparation, incubation 10 min. F, same as E, but with BCECF outside the cells.
The net H+ flux capacity of ghost preparations was assessable by analysing the time course of pH recovery after acidification of ghosts with the sodium salt of propionic acid (30 mM). Immediately after the compound was added to a ghost suspension a significant drop of the pH in the intracellular space was recorded. The pH recovery was determined at temperatures between 4 and 37 °C (data not shown) and fitted to bi-exponential equations. Both exponential terms of the regression analysis were characterized by low activation energy in the range of 2.2 to 4.5 kcal mol−1 (9.2–18.8 kJ mol−1). EIPA (10 μM) suppressed the rate of pH recovery after acidification by 15 % (P < 0.05, n = 3), while DIDS (15 μM) caused a 80 % inhibition (P < 0.05, n = 3) (data not shown). These experiments confirm that only a small portion of net H+ flux across the membrane was mediated by the Na+-H+ exchanger.
To rule out that fast acidification processes as recorded with intracellular BCECF could be the result of a fast extracellular formation of protons, which would then be transported into the intracellular space (Norris & Powell, 1992), we compared rates of acidification inside to outside the cells. To measure proton concentration in the extracellular environment we used a ghost preparation as described in Methods except that the cells were not loaded with dye. Membrane-impermeant BCECF (free acid) was then added to this cell suspension. In contrast to an intracellular acidification caused by the addition of sodium propionate (30 mM) no significant change in proton concentration could be detected outside the cells (data not shown). All experiments with fluorescence indicator in the extracellular compartment that followed the standard protocol including those in the presence of the inhibitors DIDS and/or HgCl2 resulted in a time course of acidification with time constants identical to those of the uncatalysed reaction (P < 0.05; n = 18, Fig. 13B, D and F).
DISCUSSION
The results of the studies presented here with inhibitors of integral erythrocytic proteins indicate that, at low partial pressure differences, a major part of CO2 entry into red blood cell ghosts is dependent on an intact structure and/or function of the HCO3−–Cl− transporter and AQP1. Thus, these proteins may function as high affinity sites for CO2 transport across the erythrocyte membrane (see Fig. 1).
The fast component of the intracellular acidification response, which describes the rapid CO2 entry into the red blood cell, was completely suppressed if the concentration of DIDS was kept high enough to inhibit any anion exchange activity of the HCO3−–Cl− transporter. Under these conditions the entire intracellular acidification followed the uncatalysed approach to the physicochemical equilibrium. This effect of DIDS was not due to an inhibition of CA, as shown in separate experiments in which human CAII was added to ghost-free PBS. To confirm that an intact function of the HCO3−–Cl− transporter is required for the fast acidification process, we performed experiments with the most potent known inhibitor of the HCO3−–Cl−transporter, the oxonol dye bis(1,3-dibutylbarbituric acid)pentamethine oxonol (diBA) (Knauf et al. 1995). At 15 μM diBA completely suppressed the fast acidification process (data not shown). Since the inhibitors DIDS and diBA are not competing for the same binding site (Knauf et al. 1995), it is very likely that both cause specific conformational changes in the protein strong enough to hinder the passage of CO2.
It has been discussed that DIDS may disturb the lipid bilayer directly (Forster et al. 1998) and thus reduce membrane permeability of CO2. From the present experiments it cannot be excluded that DIDS may interact with the lipid bilayer. However, the estimated number of molecules per cell in our assays in the case of a complete inhibition of the fast acidification response argues for a specific effect on the HCO3−–Cl− transporter: a fraction of 5 % ghosts in 1.5 ml PBS, ≈90 fl of mean ghost volume and a concentration of DIDS of 15 μM result in ≈16 × 106 molecules per cell. With ≈1.5 × 10⁶ copies of HCO3−–Cl− transporter per cell (Ship et al. 1977) and assuming no other binding sites for DIDS, this corresponds to a number of ≈10 inhibitor molecules per HCO3−–Cl− transporter protein. Considering the size and chemical properties of DIDS it seems unlikely that these few molecules could have a profound effect on the lipid bilayer in such a way that a lipophilic compound would be completely hindered from passing through the lipids.
Inhibition of the fast acidification by DIDS could possibly also be explained by a blockade of HCO3− extrusion out of the red blood cell (Sterling et al. 2001a,b). In this case, CO2 would enter the cell through the lipid bilayer where intracellular CA converts it to H+ and HCO3−. The anion would then serve as a substrate for the HCO3−–Cl− transporter and the proton would remain in the cell, thus acidifying it. An inhibition of the HCO3−–Cl−transporter, e.g. by DIDS, would then slow down this process through a feedback mechanism (see Fig. 1). It seems, however, rather unlikely that blockage of HCO3− extrusion will suppress any rate of acidification faster than the pure approach to the physicochemical equilibrium. Since we did not detect any non-passive acidification at 15 μM DIDS we would favour the idea that DIDS is inhibiting fast acidification by hindrance of CO2 entry into the cells, either across the HCO3−–Cl− transporter itself, or through a membrane pathway which requires a functionally intact HCO3−–Cl−transporter.
Inhibition of AQP1 by the mercuric compounds pCMBS and HgCl2 also inhibited rapid intracellular acidification. This indicates that in the human erythrocyte membrane AQP1 functions as a gas channel (see Fig. 1), confirming previous observations on cloned AQP1 protein expressed in Xenopus oocytes (Cooper & Boron, 1998; Nakhoul et al. 1998) and on reconstituted AQP1 in proteoliposomes (Prasad et al. 1998). While both inhibitors target the same chemical group (sulfhydryl group of cysteine), HgCl2 proved to be > 100-fold as potent as pCMBS. A possible explanation of this difference is that the inhibition of AQP1 by pCMBS requires an intact cytoskeleton (Ojcius et al. 1988), e.g. by making or keeping specific binding site(s) available to the inhibitor. Since haemoglobin participates in the normal structure of the red blood cell cytoskeleton, the cytoskeleton is probably organized in a different way in ghosts compared to intact red blood cells. As a consequence the availability of binding sites to pCMBS may be severely impaired in ghosts. This may also explain why rapid acidification induced by CO2 was only moderately impaired (10–15 %) at a concentration of pCMBS (1 mM) which completely blocks AQP1 mediated water flux in red blood cells (Preston et al. 1992). Since the CO2 molecule is linear and its cross-sectional area is considerably smaller than that of the water molecule, a passage of CO2 may still occur with a partial block of AQP1 by pCMBS at a concentration which on the other hand is sufficient to completely prevent the transport of water through the protein pore.
At 37 °C the fast acidification of a 5 % ghost suspension was found to be completely suppressed in the presence of ≈65 μM HgCl2, which results in ≈70 × 106 molecules per cell. If HgCl2 would only bind to AQP1, which has one binding site for HgCl2 and is present at a total number of ≈0.25 × 10⁶ copies per cell, this concentration would yield 280 molecules of inhibitor per AQP1. HgCl2, however, shares chemical binding characteristics with pCMBS, which has been shown to bind to six reactive sulfhydryl groups of the HCO3−–Cl− transporter (Lukacovic et al. 1984). Given a total estimate of ≈1.5 × 10⁶ molecules of the HCO3−–Cl− transporter per cell and similar binding constants of HgCl2 for AQP1 and the HCO3−–Cl− transporter, this results in a corrected number of ≈10–12 molecules per AQP1 binding site. This number is in the same low range as that for DIDS. Importantly, previous studies indicate that the reaction of pCMBS with sulfhydryl groups of the HCO3−–Cl− transporter has no effect on its anion exchange activity (Zhang & Solomon, 1992). Accordingly, the interaction of HgCl2 with integral ghost proteins may be rather specific to impair the function of AQP1 (Preston et al. 1992, 1993).
Interestingly, sub-maximal concentrations of both inhibitors were sufficient to completely inhibit fast acidification, when they were administered concurrently. This observation supports the concept of a close interaction between the HCO3−–Cl− transporter and AQP1 in CO2 transport.
Thus, AQP1 and the HCO3−–Cl− transporter may be part of or form a molecular complex that bundles metabolic processes, hence forming a functional complex that optimizes CO2 transport across the erythrocyte membrane. The concept of such a complex is also supported by results obtained with the phlorizin analogue p-azidobenzylphlorizin (pAzBenzPhz), which selectively photolabels AQP1 and the HCO3−–Cl− transporter of the human red blood cell (Hoefner et al. 1997) without inserting significantly into the membrane (Wyse et al. 1988). Labelling of AQP1 is enhanced in the presence of DIDS and suppressed competitively by the mercuric compounds pCMBS and HgCl2 (Hoefner et al. 1997).
Addition of CAII to the extracellular space of an intact ghost suspension caused higher rates of intracellular acidification than that of the approach to the physicochemical equilibrium (Fig. 9A and C) but rates were still slower than those of the normal fast response (a in Fig. 9B). This observation may be explained by an accelerated H+ exchange if CAII is present in the intracellular space. The low activation energy (< 4.5 kcal mol−1; < 18.8 kJ mol−1) we calculated for pH recovery after acidification with sodium propionate (see Results) would be in favour of such a fast mechanism. The fact that in the presence of DIDS (15 μM) the rate of pH recovery was suppressed by 80 % suggests that the HCO3−–Cl− transporter participates in the pH recovery (Gros et al. 1976).
An important question is how CA activity remains in the ghost preparation, even though the cells have been lysed. The preparation of ghosts was performed with the same technique as described by Dodge et al. (1963). Spectrophotometric measurements (see Methods) demonstrated that in the present study most preparations contained some haemoglobin. Most previous investigations did not detect CA activity in ghosts (Enns, 1967; Rosenberg & Guidotti, 1968; Tappan, 1968; Randall & Maren, 1972), but recently it could be demonstrated that CAIV is localized on the extracellular surface of human erythrocytes (Wistrand et al. 1999). Moreover, CAII can bind to the carboxyl terminus of the HCO3−–Cl− transporter (Vince & Reithmeier, 1998), suggesting that at least a fraction of the highly active CAII is still associated with the membrane of the ghost preparation. This interpretation is supported by the observation that adding the membrane-permeant CA inhibitor ETX (10 μM) reduced any catalysed rate of acidification to the uncatalysed approach towards the physicochemical equilibrium. Finally, preparations of lysed ghosts exhibited high activity of CA, which may be due to the enhanced CA activity in the presence of erythrocyte membranes (Wistrand, 1981; Parkes & Coleman, 1989).
The potential physiological significance of AQP1 and HCO3−–Cl− transporter-mediated CO2 fluxes remains to be established in further studies. One important limitation is the relative lack of specificity of the chemical blockers used in this study to inhibit protein-mediated CO2 transport. Moreover, further experiments under equilibrium exchange conditions will be necessary to allow for an adequate calculation of CO2 permeability in normal erythrocytes. It will be interesting to compare these permeabilities with those measured in erythrocytes from AQP1-deficient mice (Yang et al. 2000; Fang et al. 2002) or humans carrying a mutation in the AQP1 gene (Preston et al. 1994). Such experiments should help to assess whether protein-mediated CO2 transport across biological membranes may attain a major role under physiological or pathophysiological stress conditions, like heavy exercise, high altitude, or a thickening of the blood-gas barrier.
In summary, we interpret our data in terms of CO2 exchange across the red blood cell membrane in the following way:
The rate of acidification in a ghost suspension in the presence of a completely inhibited CA activity by ETX is identical to that of the uncatalysed reaction towards the physicochemical equilibrium. Thus, any rate of acidification greater than that of an uncatalysed reaction requires the catalytic activity of CA.
The observation, that lysed ghosts and ghosts with CAII added to the extracellular compartment reveal sub-maximal rates of acidification, suggests that integer membranes and/or complex structures are essential for the fast acidification process in ghosts.
Measurements with BCECF outside the ghosts yielded acidification rates identical to that of an uncatalysed reaction. Thus, all effects besides the approach to the physicochemical equilibrium are caused by intracellular events.
The complete inhibition of the fast acidification by HgCl2 and DIDS indicate that the HCO3−–Cl− transporter and APQ1 mediate CO2 transport over the human red cell membrane.
Thus, at low concentration gradients for CO2 the HCO3−–Cl− transporter and AQP1 may be considered as high affinity sites and as a main route for CO2 entry into the human red blood cell.
Acknowledgments
We are especially grateful to Mrs Kornelia Anders for her excellent help with the preparation of ghosts and her general technical assistance.
REFERENCES
- Bisognano JD, Dix JA, Pratap PR, Novak TS, Freedman JC. Proton (or hydroxide) fluxes and the biphasic osmotic response of human red blood cells. J Gen Physiol. 1993;102:99–123. doi: 10.1085/jgp.102.1.99. [DOI] [PMC free article] [PubMed] [Google Scholar]
- Cooper GJ, Boron WF. Effect of pCMBS on CO2 permeability of Xenopus oocytes expressing aquaporin 1 or its C189S mutant. Am J Physiol. 1998;275:C1481–1486. doi: 10.1152/ajpcell.1998.275.6.C1481. [DOI] [PubMed] [Google Scholar]
- Cooper GJ, Zhou Y, Bouyer P, Grichtchenko II, Boron WF. Transport of volatile solutes through AQP1. J Physiol. 2002;542:17–29. doi: 10.1113/jphysiol.2002.023218. [DOI] [PMC free article] [PubMed] [Google Scholar]
- Denker BM, Smith BL, Kuhajda FP, Agre P. Identification, purification, and partial characterization of a novel Mr 28,000 integral membrane protein from erythrocytes and renal tubules. J Biol Chem. 1988;263:15634–15642. [PubMed] [Google Scholar]
- Dodge JT, Mitchell C, Hanahan DJ. The preparation and chemical characteristics of hemoglobin-free ghosts of human erythrocytes. Arch Biochem Biophys. 1963;100:119–130. doi: 10.1016/0003-9861(63)90042-0. [DOI] [PubMed] [Google Scholar]
- Enns T. Facilitation by carbonic anhydrase of carbon dioxide transport. Science. 1967;155:44–47. doi: 10.1126/science.155.3758.44. [DOI] [PubMed] [Google Scholar]
- Fang X, Yang B, Matthay MA, Verkman AS. Evidence against aquaporin-1-dependent CO2 permeability in lung and kindney of mice. J Physiol. 2002;542:63–69. doi: 10.1113/jphysiol.2001.013813. [DOI] [PMC free article] [PubMed] [Google Scholar]
- Forster RE, Gros G, Lin L, Ono Y, Wunder M. The effect of 4,4′-diisocyocynato-stilbene-2,2′-disulfonate on CO2 permeability of the red blood cell membrane. Proc Natl Acad Sci U S A. 1998;95:15815–15820. doi: 10.1073/pnas.95.26.15815. [DOI] [PMC free article] [PubMed] [Google Scholar]
- Gros G, Moll W. Facilitated diffusion of CO2 across albumin solutions. J Gen Physiol. 1974;64:356–371. doi: 10.1085/jgp.64.3.356. [DOI] [PMC free article] [PubMed] [Google Scholar]
- Gros G, Moll W, Hoppe H, Gros H. Proton transport by phosphate diffusion: a mechanism of facilitated CO2 transfer. J Gen Physiol. 1976;67:773–790. doi: 10.1085/jgp.67.6.773. [DOI] [PMC free article] [PubMed] [Google Scholar]
- Hoefner DM, Blank ME, Diedrich DF. The anion transporter and a 28 kDa protein are selectively photolabeled by p-azidobenzylphlorizin under conditions that alter RBC morphology, flexibility, and volume. Biochim Biophys Acta. 1997;1327:231–241. doi: 10.1016/s0005-2736(97)00068-0. [DOI] [PubMed] [Google Scholar]
- Jennings ML. Oligomeric structure and the anion transport function of human erythrocyte band 3 protein. J Membr Biol. 1984;80:105–117. doi: 10.1007/BF01868768. [DOI] [PubMed] [Google Scholar]
- Knauf PA, Law FY, Hahn K. An oxonol dye is the most potent known inhibitor of band 3-mediated anion exchange. Am J Physiol. 1995;269:C1073–1077. doi: 10.1152/ajpcell.1995.269.4.C1073. [DOI] [PubMed] [Google Scholar]
- Lukacovic MF, Verkman AS, Dix JA, Solomon AK. Specific interaction of the water transport inhibitor, pCMBS, with band 3 in red blood cell membranes. Biochim Biophys Acta. 1984;778:253–259. doi: 10.1016/0005-2736(84)90366-3. [DOI] [PubMed] [Google Scholar]
- Nakhoul NL, Davis BA, Romero MF, Boron WF. Effect of expressing the water channel aquaporin-1 on the CO2 permeability of Xenopus oocytes. Am J Physiol. 1998;274:C543–548. doi: 10.1152/ajpcell.1998.274.2.C543. [DOI] [PubMed] [Google Scholar]
- Norris FA, Powell GL. Characterization of CO2/carbonic acid mediated proton flux through phosphatidylcholine vesicles as model membranes. Biochim Biophys Acta. 1992;1111:17–26. doi: 10.1016/0005-2736(92)90269-r. [DOI] [PubMed] [Google Scholar]
- Ojcius DM, Solomon AK. Sites of p-chloromercuribenzene-sulfonate inhibition of red cell urea and water transport. Biochim Biophys Acta. 1988;942:173–182. doi: 10.1016/0005-2736(88)90276-3. [DOI] [PubMed] [Google Scholar]
- Ojcius DM, Toon MR, Solomon AK. Is an intact cytoskeleton required for red cell urea and water transport. Biochim Biophys Acta. 1988;944:19–28. doi: 10.1016/0005-2736(88)90312-4. [DOI] [PubMed] [Google Scholar]
- Prasad GV, Coury LA, Finn F, Zeidel ML. Reconstituted aquaporin 1 water channels transport CO2 across membranes. J Biol Chem. 1998;273:33123–33126. doi: 10.1074/jbc.273.50.33123. [DOI] [PubMed] [Google Scholar]
- Preston GM, Carroll TP, Guggino WB, Agre P. Appearance of water channels in Xenopus oocytes expressing red cell CHIP28 protein. Science. 1992;256:385–387. doi: 10.1126/science.256.5055.385. [DOI] [PubMed] [Google Scholar]
- Preston GM, Jung JS, Guggino WB, Agre P. The mercury-sensitive residue at cysteine 189 in the CHIP28 water channel. J Biol Chem. 1993;268:17–20. [PubMed] [Google Scholar]
- Preston GM, Smith BL, Zeidel ML, Moulds JJ, Agre P. Mutations in aquaporin-1 in phenotypically normal humans without functional CHIP water channels. Science. 1994;265:1585–1587. doi: 10.1126/science.7521540. [DOI] [PubMed] [Google Scholar]
- Randall RF, Maren TH. Absence of carbonic anhydrase in red cell membranes. Biochim Biophys Acta. 1972;268:730–732. doi: 10.1016/0005-2744(72)90277-x. [DOI] [PubMed] [Google Scholar]
- Rosenberg SA, Guidotti D. The protein of human erythrocyte membranes. J Biol Chem. 1968;243:1985–1992. [PubMed] [Google Scholar]
- Ship S, Shami Y, Breuer W, Rothstein A. Synthesis of tritiated 4,4′-diisothiocyano-2,2′-stilbene disulfonic acid ([3H]DIDS) and its covalent reaction with sites related to anion transport in human red blood cells. J Membr Biol. 1977;33:311–323. doi: 10.1007/BF01869522. [DOI] [PubMed] [Google Scholar]
- Sterling D, Reithmeier RAF, Casey JR. Carbonic anhydrase: In the driver's seat for bicarbonate transport. J Pancreas. 2001a;2:165–170. [PubMed] [Google Scholar]
- Sterling D, Reithmeier RAF, Casey JR. A transport metabolon. Functional interaction of carbonic anhydrase II and chloride/bicarbonate exchangers. J Biol Chem. 2001b;276:47886–47894. doi: 10.1074/jbc.M105959200. [DOI] [PubMed] [Google Scholar]
- Tappan DV. Carbonic anhydrase activity of erythrocyte ghosts. Experientia. 1968;24:127. doi: 10.1007/BF02146936. [DOI] [PubMed] [Google Scholar]
- Toon MR, Solomon AK. Control of red cell urea and water permeability by sulfhydryl reagents. Biochim Biophys Acta. 1986;860:361–375. doi: 10.1016/0005-2736(86)90533-x. [DOI] [PubMed] [Google Scholar]
- Verkman AS. Does aquaporin-1 pass gas? An opposing view. J Physiol. 2002;542:31. doi: 10.1113/jphysiol.2002.024398. [DOI] [PMC free article] [PubMed] [Google Scholar]
- Vince JW, Reithmeier RAF. Carbonic anhydrase II binds to the carboxyl terminus of human band 3, the erythrocyte Cl−/HCO3− exchanger. J Biol Chem. 1998;273:28430–28437. doi: 10.1074/jbc.273.43.28430. [DOI] [PubMed] [Google Scholar]
- Waisbren SJ, Geibel JP, Modlin IM, Boron WF. Unusual permeability properties of gastric gland cells. Nature. 1994;368:332–335. doi: 10.1038/368332a0. [DOI] [PubMed] [Google Scholar]
- Wistrand PJ. The importance of carbonic anhydrase B and C for the unloading of CO2 by the human erythrocyte. Acta Physiol Scand. 1981;113:417–426. doi: 10.1111/j.1748-1716.1981.tb06918.x. [DOI] [PubMed] [Google Scholar]
- Wistrand PJ, Carter ND, Conroy CW, Mahieu I. Carbonic anhydrase IV activity is localized on the exterior surface of human erythrocytes. Acta Physiol Scand. 1999;165:211–218. doi: 10.1046/j.1365-201x.1999.00478.x. [DOI] [PubMed] [Google Scholar]
- Wyse JW, Blank ME, Maynard CL, Diedrich DF, Butterfield DA. Electron spin resonance investigation of the interaction of the anion and glucose transport inhibitor, p-azidobenzylphlorizin, with the human red cell membrane. Biochim Biophys Acta. 1988;979:127–131. doi: 10.1016/0005-2736(89)90532-4. [DOI] [PubMed] [Google Scholar]
- Yang B, Fukuda N, Van Hoek A, Matthay MA, Ma T, Verkman AS. Carbon dioxide permeability of aquaporin-1 measured in erythrocytes and lung of aquaporin-1 null mice and in reconstituted proteoliposomes. J Biol Chem. 2000;275:2686–2692. doi: 10.1074/jbc.275.4.2686. [DOI] [PubMed] [Google Scholar]
- Zhang ZH, Solomon AK. Effect of pCMBS on anion transport in human red cell membranes. Biochim Biophys Acta. 1992;1106:31–39. doi: 10.1016/0005-2736(92)90218-b. [DOI] [PubMed] [Google Scholar]


