

Abstract
Before the onset of hearing at postnatal day 12, mouse inner hair cells (IHCs) produce spontaneous and evoked action potentials. These spikes are likely to induce neurotransmitter release onto auditory nerve fibres. Since immature IHCs express both α1D (Cav1.3) Ca2+ and Na+ currents that activate near the resting potential, we examined whether these two conductances are involved in shaping the action potentials. Both had extremely rapid activation kinetics, followed by fast and complete voltage-dependent inactivation for the Na+ current, and slower, partially Ca2+-dependent inactivation for the Ca2+ current. Only the Ca2+ current is necessary for spontaneous and induced action potentials, and 29 % of cells lacked a Na+ current. The Na+ current does, however, shorten the time to reach the action-potential threshold, whereas the Ca2+ current is mainly involved, together with the K+ currents, in determining the speed and size of the spikes. Both currents increased in size up to the end of the first postnatal week. After this, the Ca2+ current reduced to about 30 % of its maximum size and persisted in mature IHCs. The Na+ current was downregulated around the onset of hearing, when the spiking is also known to disappear. Although the Na+ current was observed as early as embryonic day 16.5, its role in action-potential generation was only evident from just after birth, when the resting membrane potential became sufficiently negative to remove a sizeable fraction of the inactivation (half inactivation was at −71 mV). The size of both currents was positively correlated with the developmental change in action-potential frequency.
Inner hair cells (IHCs) are the primary sensory receptors in the mammalian cochlea, signalling the reception of sound to the brain. To do so, IHCs are contacted by the vast majority of afferent fibres entering the cochlear neuroepithelium (Ryugo, 1992). Before the onset of hearing, around postnatal day (P)12 in mice (Mikaelian & Ruben, 1965; Shnerson & Pujol, 1982; Romand, 1983), immature IHCs can fire spontaneous or evoked action potentials (Kros et al. 1998; Marcotti et al. 2003). The spiking activity persists until P12, whereupon the fast, Ca2+-activated outward K+ conductance that is characteristic of mature IHCs (IK,f) first appears (Kros et al. 1998). IHCs appear to be presynaptically competent well before the onset of hearing (Beutner & Moser, 2001). These suggestions are confirmed by recordings from auditory nerve and brainstem nuclei where neuronal activity, probably driven by cochlear IHCs, has been observed in vivo before the onset of sound-evoked responses in mammals (Gummer & Mark, 1994; Kotak & Sanes, 1995). Similarly, spontaneous activity in the auditory pathway was observed in prehatch chicks (embryonic day (E)13–18, Lippe, 1994; Jones et al. 2001) during the time at which the embryos are only weakly sensitive to low-frequency sound (Saunders et al. 1973). By E19, 2 days prior to hatching, the disappearance of firing activity in tall hair cells (analogous in terms of innervation and function to mammalian IHCs) coincides with the expression of a Ca2+-activated K+ current (Fuchs & Sokolowski, 1990). These physiological changes lead to a marked improvement in the chick's cochlear function (Saunders et al. 1973). Although the role of action potentials in IHCs is unknown, the possibility that spontaneous spiking activity might control the remodelling of synaptic connections in the ear and auditory brainstem is supported by correlations between physiological and morphological observations (Marcotti et al. 2003). A similar role for spiking activity has been suggested for the immature retina (Shatz & Stryker, 1988; Maffei & Galli-Resta, 1990; Meister et al. 1991) well before the photoreceptors become responsive to light (Ratto et al. 1991).
Action potentials in neonatal IHCs are mainly due to the interplay between an inward Ca2+ current (ICa) and the slowly activating, delayed rectifier, IK,neo (Kros et al. 1998). Evoked, but not spontaneous, Ca2+ spikes have also been described in hair cells from other species (Hudspeth & Corey, 1977; Art & Fettiplace, 1987; Fuchs & Evans, 1990). Immature IHCs from the mouse express, in addition to an inward L-type Ca2+ current containing the α1D (Cav1.3) subunit (Platzer et al. 2000), a large Na+ current (INa; Kros et al. 1993; Kros, 1996). Although Na+ currents have been reported in vestibular and cochlear hair cells of other vertebrates including mammals (Evans & Fuchs 1987; Sugihara & Furukawa, 1989; Sokolowski et al. 1993; Witt et al. 1994; Oliver et al. 1997; Lennan et al. 1999; Masetto et al. 2003), little is known about whether and how they contribute to the physiological responses of the hair cells. To gain more insight into the biophysical basis of the action potential, we set out to investigate the relative contribution of both ICa and INa to action potentials at body temperature and using a physiological extracellular Ca2+ concentration.
METHODS
Tissue preparation
Apical-coil IHCs (n = 325) of CD-1 mice (Swiss CD-1, Charles Rivers, Margate, UK) were studied in acutely dissected organs of Corti from E16.5 to P20, where the day of birth (P0) corresponds to E19.5. For embryonic experiments only, mice were paired overnight and checked for vaginal plugs the following morning. Assuming ovulation occurs midway through the dark cycle, the midpoint of the light cycle of the day following mating is considered to be E0.5. Adult and neonatal mice were killed by cervical dislocation and embryos by decapitation, in accordance with UK Home Office regulations. The cochleae were dissected in extracellular solution composed of (mm): 135 NaCl, 5.8 KCl, 1.3 CaCl2, 0.9 MgCl2, 0.7 NaH2PO4, 5.6 d-glucose, 10 Hepes-NaOH, 2 sodium pyruvate. Amino acids and vitamins for Eagle's minimum essential medium (MEM) were added from concentrates (Invitrogen, Paisley, UK). The pH was adjusted to 7.5 and the osmolality was about 308 mmol kg−1. The organs of Corti were transferred to a microscope chamber containing extracellular solution, in which they were immobilized with a nylon mesh fixed to a stainless steel ring. The chamber (volume 2 ml) was perfused at a flow rate of about 10 ml h−1 from a peristaltic pump and mounted on the stage of an upright microscope (Zeiss ACM, Germany or Olympus, Japan). The organs of Corti were observed with Nomarski differential interference contrast optics (× 40 water-immersion objectives). To expose the basolateral surfaces of the cells, a small tear was made in the epithelium with a suction pipette (tip diameter about 2–4 μm) filled with extracellular solution. The cells were then cleaned by a stream of fluid from this pipette before patching. Only cells of healthy appearance were selected for electrophysiological recordings. Criteria included an intact hair bundle, cell membranes with a smooth surface, absence of vacuoles in the cytoplasm and lack of Brownian motion of mitochondria. The position of cells along the cochlea was recorded as fractional distance from the extreme apex. In the immature cochlea, cells were positioned at a fractional distance of between 0.16 and 0.24. Mature IHCs were positioned between 0.06 and 0.19 corresponding to a frequency range of approximately 0.8–3.0 kHz (using eqn (13) in Ehret, 1975).
Electrical recording
Voltage- and current-clamp recordings were performed at near body temperature (34–37°C) by the whole-cell patch clamp technique using EPC-7, EPC-8 (HEKA, Lambrecht, Germany) or Optopatch (Cairn Research, Faversham, UK) amplifiers. Only a few experiments (those illustrated in Fig. 2A and Fig. 6D) were conducted at room temperature (22–24°C). Patch pipettes were pulled from soda glass capillaries (Harvard Apparatus, Edenbridge, UK) and electrode resistances in extracellular solution were 2–3 MΩ. In order to reduce the electrode capacitance, the shank of the electrode was coated with surf wax (Mr Zogs SexWax, Carpinteria, CA, USA).
Figure 2. Action potentials in immature IHCs are Ca2+ dependent.
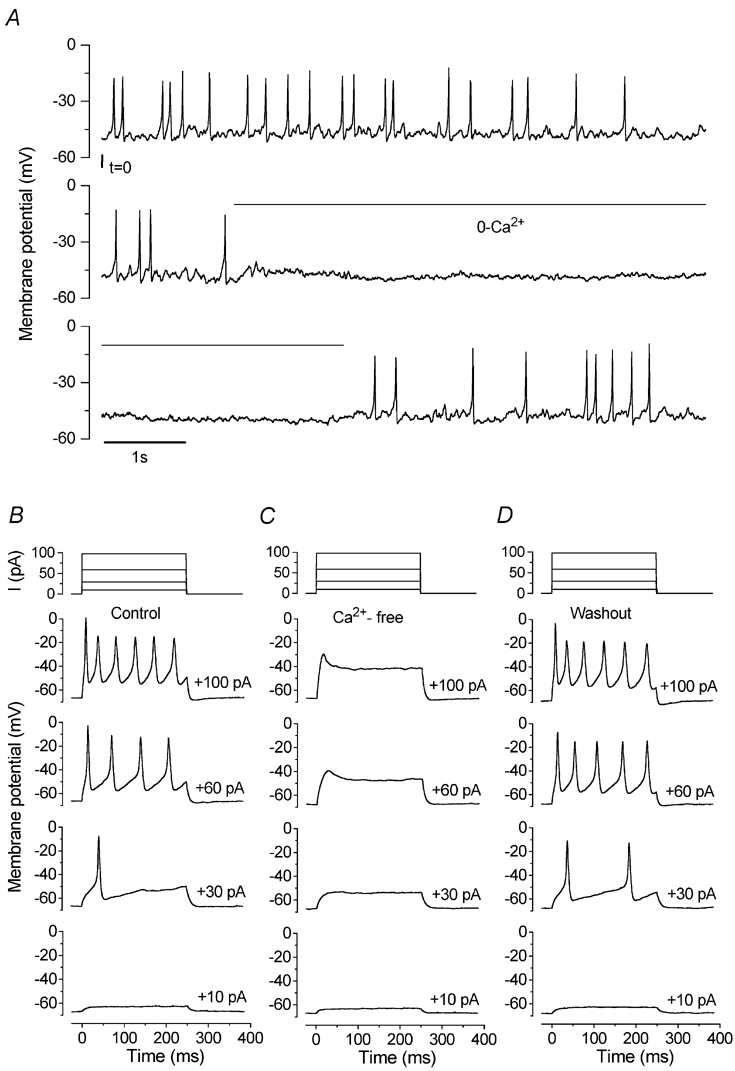
A, spontaneous action potentials are reversibly abolished in the absence of extracellular Ca2+. The recording conditions were: Vm−62 mV; temperature 23°C. B, depolarizing current steps trigger action potentials in a P7 IHC. Current steps were applied from the resting potential in 10 pA increments between 0 and +100 pA, and for clarity only a few voltage responses are shown. The interval between spikes decreased with increasing current size. C, superfusion of the cell in B with nominally Ca2+-free solution completely suppressed the regenerative responses to depolarizing current injection. D, action potentials after washout. Current recordings in B-D at the top of each column show the good quality of the current clamp. All voltage responses in this and the following figures are single traces. The recording conditions were: Vm−68 mV; Cm 8.0 pF; Rs 2.3 MΩ, gleak 1.2 nS; temperature 36°C.
Figure 6. INa in immature IHCs.
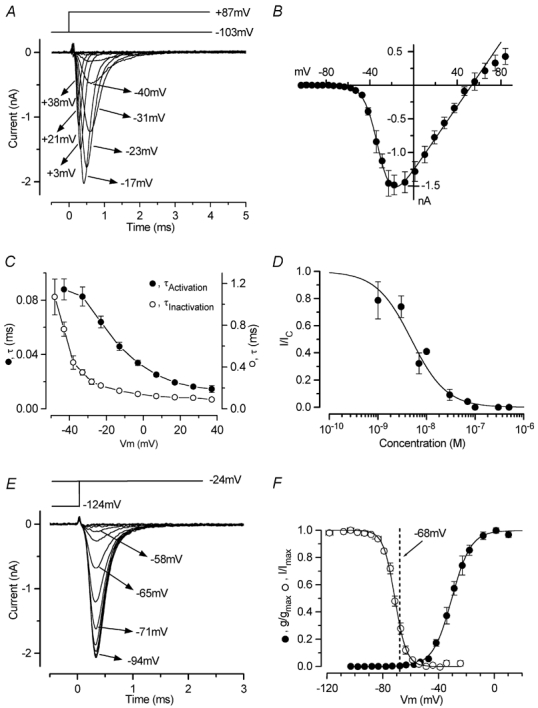
A, INa recorded from a P6 IHC by applying depolarizing voltage steps from a holding potential of −103 mV. For clarity, only some of the traces are shown and some of the potentials are shown next to the traces. INa was isolated by subtracting the current during superfusion of TTX (300 nm) from the control current (also for the inactivation in E). Current recordings are averages of five repetitions. B, peak I-V curve for INa recorded in eleven P6-P7 IHCs (including the cell shown in A). The fitting parameters are: gmax 23.8 nS, Vrev+53.0 mV, V1/2−31.3 mV, S 6.3 mV. C, time constants of activation (•) and inactivation (○) for INa measured in nine and six IHCs, respectively. D, dose-response curve for block of INa by TTX. IHCs were superfused with a range of concentrations of TTX (between 1 and 500 nm), which reversibly blocked INa. Logistic curve: I/Icontrol= 1/(1 + ([D]/KD)nH), fitted with KD= 4.8 ± 0.6 nm and nH= 1.2 ± 0.2. [D] is the drug concentration. The number of cells from left to right: 2, 2, 3, 1, 3, 1, 1, 2, 4. The temperature was 22–24°C. E, peak INa at a membrane potential of −24 mV, following a series of 50 ms conditioning steps from −124 mV to more positive values in 5 or 10 mV increments, from a holding potential of −84 mV. Time zero is the start of the test step; the currents at the end of the preceding conditioning steps are also shown. Some of the values of the conditioning potentials are shown next to the traces. Recordings are averages of four repetitions. Recordings from A and E are from the same IHC, and the recording conditions were: Cm 8.6 pF; Rs 1.5 MΩ; gleak 1.8 nS; temperature 36°C. F, activation (•) and inactivation (○) curves for INa, from eleven P6-P7 and six P6 IHCs, respectively. The dashed line is −68 mV, the average resting membrane potential for P6-P7 apical-coil IHCs. The fitting parameters are: •, gmax 23.8 nS, V1/2−30.5 mV, S 6.9 mV; ○, Imax−1550 pA, V1/2−71.4 mV, S 4.2 mV.
For voltage recordings made under current-clamp conditions, the pipette filling solution contained (mm): 131 KCl, 3 MgCl2, 1 EGTA-KOH, 5 Na2ATP, 5 Hepes-KOH, 10 sodium phosphocreatine (pH 7.3, 292 mmol kg−1). Currents were recorded under voltage-clamp conditions using either this KCl-based intracellular solution or, to minimize contamination due to the K+ currents, one of the following Cs+-based solutions. For ICa, the composition was (mm): 140 caesium glutamate or CsCl, 3 MgCl2, 5 Na2 ATP, 0.3 Na2 GTP, 1 EGTA-NaOH, 5 Hepes-CsOH (pH 7.3, 290 mmol kg−1); for INa: 131 CsCl, 3 MgCl2, 5 Na2 ATP, 1 EGTA-KOH, 5 Hepes-KOH, 10 sodium phosphocreatine (pH 7.3, 292 mmol kg−1). Data acquisition was performed using pClamp software (Axon Instruments, Union City, CA, USA) with a LabMaster DMA or a Digidata 1320A data-acquisition board. Data were filtered, depending on the protocols used, at 2.5, 5 or 10 kHz (eight-pole Bessel), sampled at 5, 10, 50 or 100 kHz and stored on computer. Offline data analysis was performed using Origin software (OriginLab, Northampton, MA, USA). For voltage-clamp experiments, currents were corrected offline for leak conductance calculated from 10 mV depolarizing or hyperpolarizing steps from the holding potential (2.4 ± 0.4 nS, n = 235, E16.5-P20). Holding currents are plotted as zero current. Residual series resistance (Rs) after compensation (0–80 %) was 4.9 ± 0.1 MΩ (n = 235), resulting in an average voltage-clamp time constant of 35 μs. An extremely low Rs was particularly important for accurate measurements of the very rapid kinetics near body temperature of INa and ICa. In these cases, the voltage-clamp time constant averaged 15 μs (range 6–25 μs) for INa and 22 μs (range 8–39 μs) for ICa recordings. Membrane potentials were corrected for the voltage drop across the residual Rs and for a liquid junction potential, measured between pipette and bath, of −4 mV for the KCl- and CsCl-based intracellular solutions, and −11 mV for the caesium-glutamate-based solution. For current-clamp experiments, offline Rs correction was applied only if the voltage drop exceeded 1 mV.
Extracellular superfusion
One set of experiments was designed to determine the specific roles of both INa and ICa on the voltage responses of immature IHCs. This involved primarily current-clamp recordings using KCl-based intracellular solutions, but the same cells were also studied under voltage-clamp conditions to assess the presence and size of INa and ICa. In some of these experiments, 100–500 nm TTX (Sigma, Gillingham, UK) was used to block INa. To investigate the function of ICa, in some cases a Ca2+-free solution was used in which MgCl2 was increased to 3.9 mm to keep membrane charge screening approximately constant (Blaustein & Goldman, 1968), and 0.5 mm EGTA was added.
A second set of experiments in which caesium-based intracellular solutions were used was designed to study the activation and inactivation properties of ICa and INa in isolation. Extracellular superfusion of 30 mm TEA (Fluka, Gillingham, UK) was used in these experiments to further reduce contamination by K+ currents. In addition, 200 nm TTX or 30 μm nifedipine (Sigma) was added to the extracellular solution to help isolate either ICa or INa, respectively. ICa inactivation was measured with the additional presence of 1 μm apamin (Calbiochem, Nottingham, UK) in the extracellular solution to block an SK current that interfered with the measurements, especially when long conditioning steps (100–500 ms) were used or in 5 mm extracellular Ca2+. For determining the dose-response curve for the block of INa by TTX, various concentrations of the drug between 1 nm and 500 nm were applied. In all experiments, when TEA or 5 mm Ca2+ or Ba2+ were added to the external solution, equimolar substitution of NaCl was used to keep osmolality constant. The different superfused solutions were applied through a multibarrelled pipette positioned close to the patched hair cell.
Capacitance measurements
Real-time changes in membrane capacitance (ΔCm) were measured using the track-in mode of the Optopatch amplifier (Johnson et al. 2002). Simultaneous recordings of ΔCm and ICa were performed using the caesium glutamate intracellular solution and 30 mm TEA in the extracellular solution. IHCs (P1, apical coil) were voltage clamped at a holding potential of −71 mV. A 2.5 kHz sine wave of 37 mV peak-to-peak was superimposed upon the holding potential using the amplifier's internal oscillator. The sine wave was interrupted for the duration of the stimulus so that membrane currents could be uncovered. IHCs were stimulated using an action potential waveform recorded from a spontaneously active P3 IHC under current-clamp conditions at 37°C. ΔCm was estimated by subtracting the average of the Cm record over 300 ms after the spike stimulus from the average of 200 ms before the spike (Fig. 1B-D).
Figure 1. Spontaneous action potentials in immature IHCs are sufficient to induce exocytosis.
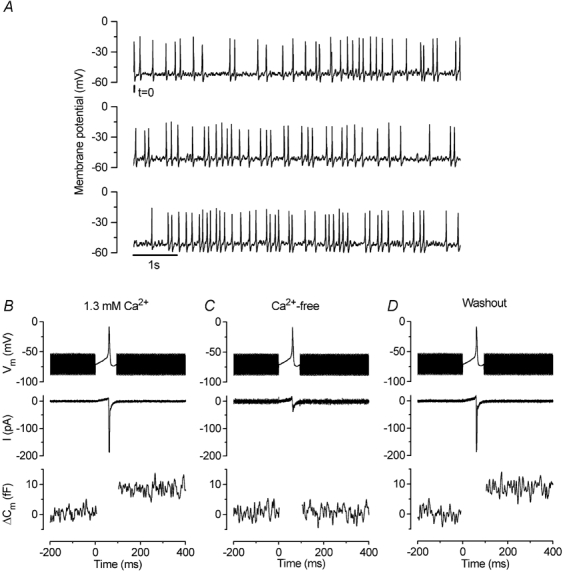
A, continuous recording of voltage responses from an apical-coil P3 IHC using 1.3 mm Ca2+ in the extracellular solution. The total duration of the recording is 22.5 s and the recording conditions were: resting membrane potential (Vm) −54 mV; Cm 7.4 pF; Rs 7.1 MΩ; leak conductance (gleak) 1.0 nS; temperature 37°C. B-D, current and ΔCm responses of a P1 apical IHC to a voltage-clamp action potential protocol before, during and after superfusion of a Ca2+-free solution. Holding potential −71 mV. Command protocols (top panels) consisted of a 2.5 kHz sinusoidal waveform (used to track Cm) that was interrupted for the duration of the action potential. Inward ICa (middle panels) elicited by the action-potential protocol. Peak inward currents were: −187 pA in A; −37 pA in B; −186 pA in C. The lower panels show the corresponding ΔCm (the region during the action potential is omitted as the track-in circuitry is not operational during this period). The ΔCm values are: 8.6 fF in A; 0.6 fF in B; 8.7 fF in C. The recording conditions were: Cm 7.8 pF; Rs 5.2 MΩ; gleak 0.8 nS; temperature 37°C.
Statistical analysis
Statistical comparisons of means were made by Student's two-tailed t test or, for multiple comparisons, using ANOVA, usually one-way, followed by the Tukey test. The two-way ANOVA, followed by the Bonferroni test, was used to compare the frequency of action potentials (Fig. 3G) and the time constant of activation of ICa (Fig. 4D) in the presence of 1.3 and 5 mm Ca2+. P < 0.05 was used as the criterion for statistical significance. Data are presented as mean ±s.e.m. in the text and figures. In Fig. 3 and Fig. 8, statistically significant differences are indicated by a star symbol.
Figure 3. Ca2+ speeds up the upstroke of the action potential.
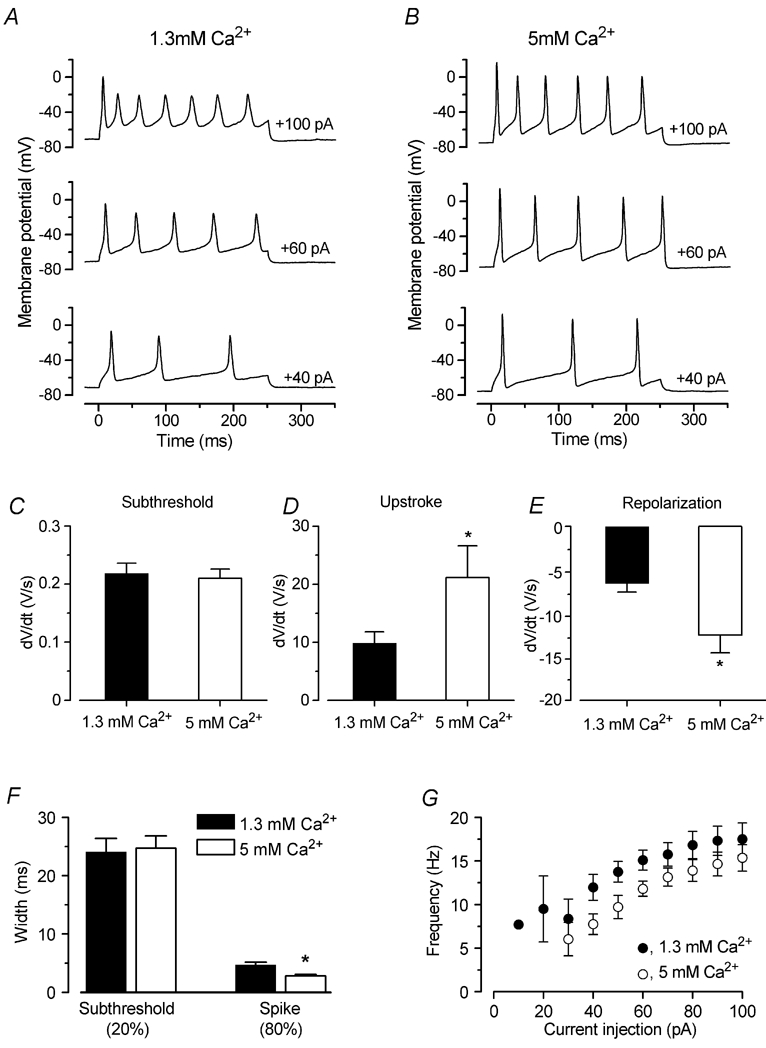
A and B, voltage responses from an IHC before and during superfusion of 1.3 and 5 mm extracellular Ca2+, respectively. Current steps were applied in 10 mV increments up to +100 pA, and for clarity only a few examples are shown. Note that in the presence of 5 mm Ca2+ the action potentials became faster and reached a more depolarized potential. The recording conditions were: P7, Cm 8.4 pF; Rs 5.0 MΩ; temperature 37°C. C-E, rate of the subthreshold depolarization, and the rise and fall of the action potentials, respectively, during superfusion of 1.3 and 5 mm Ca2+ (P7, n = 8). F, widths measured at the subthreshold (20 %) and spike (80 %) level as shown in Fig. 8A (dashed lines). G, frequency of evoked action potentials before and during superfusion of 5 mm Ca2+ as a function of depolarizing current injection (P7, n = 8).
Figure 4. ICa in immature IHCs.

A and B, inward ICa recordings from a P6 IHC during superfusion of 1.3 mm (A) and 5 mm (B) extracellular Ca2+, in response to voltage steps from −113 mV to more depolarized potentials in 5 or 10 mV increments. The holding potential was −103 mV. A schematic representation of the voltage protocol is shown above the current traces. For clarity, only some of the traces are shown and some of the potentials are shown next to the traces. Residual capacitative transients have been blanked. The extracellular solution contained 30 mm TEA and 200 nm TTX. Currents in A and B are averages from six and four repetitions, respectively. The recording conditions were: Cm 7.7 pF; Rs 4.8 MΩ; gleak 1.3 nS; temperature 37°C. C, average peak I-V curves for seven P6-P7 IHCs during extracellular superfusion of 1.3 (•) and 5 mm (○) Ca2+ (including the cell shown in A and B). The continuous lines are fits calculated using eqn (1) (see text for details). The fitting parameters are: in 1.3 mm Ca2+, gmax 7.0 nS, Vrev 45 mV, V1/2−32.8 mV, S 6.9 mV; in 5 mm Ca2+, gmax 13.0 nS, Vrev 45 mV, V1/2−26.7 mV, S 6.9 mV. D, time constants of activation for ICa measured in the same seven IHCs.
Figure 8. Quantitative effects of TTX on action-potential timing.
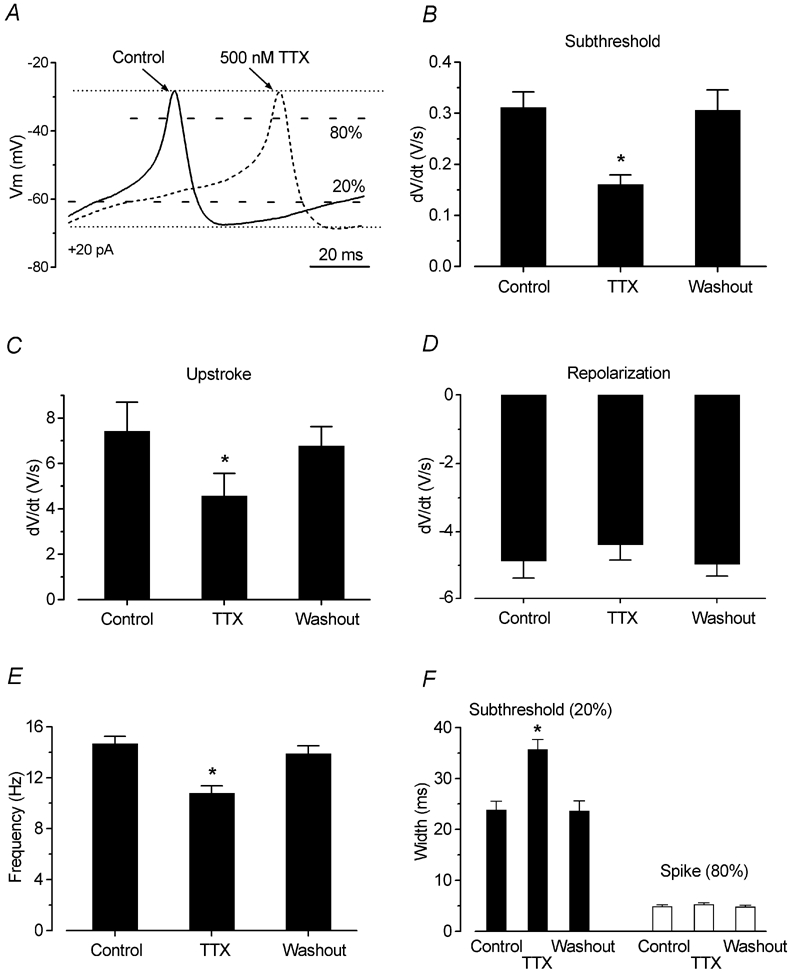
A, enlarged representation of voltage responses from Fig. 7F before (continuous line) and during (dashed line) superfusion of TTX. The 20 % and 80 % labels indicate the height at which the widths of the action potentials were measured, between the peak and the maximum repolarization levels (dotted lines). B, C and D, rate of subthreshold depolarization, upstroke and repolarization, respectively, of the action potentials before, during and after extracellular application of 300–500 nm TTX (n = 14). E, change in spike frequency during extracellular superfusion of TTX. F, width of the action potentials measured at the two levels shown in A.
RESULTS
A single action potential is sufficient to induce exocytosis from neonatal IHCs
From the resting membrane potential, repetitive spontaneous action potentials, with a frequency of 4.9 ± 0.7 Hz (n = 12, P2-P4), were recorded from immature IHCs at body temperature (Fig. 1A). Although spontaneous action potentials could be recorded only up to the end of the first postnatal week, older IHCs retain the capability to spike in response to injection of small depolarizing currents up to the onset of hearing (Marcotti et al. 2003). It has been suggested that these action potentials are important for afferent neuron remodelling (Kros et al. 1998; Marcotti et al. 2003). If so, the influx of Ca2+ into the cell during a single action potential needs to be sufficiently large to induce exocytosis, which is generally interpreted as a sign of neurotransmitter release from presynaptic cells, including those with ribbon synapses (Parsons et al. 1994; Von Gersdorff et al. 1998; Moser & Beutner, 2000). A study on developing mouse IHCs showed that single action potentials did indeed trigger exocytosis at P6, but these experiments were performed at room temperature and used an unphysiological extracellular Ca2+ concentration of 10 mm (Beutner & Moser, 2001). Therefore, we tested our hypothesis at body temperature and using a physiological extracellular Ca2+ concentration (1.3 mm). A voltage command mimicking a real action potential recorded from a spontaneously active IHC was used (Fig. 1B-D, top panels). Figure 1B-D (middle and bottom panels) shows membrane current and ΔCm, respectively, in response to a single action potential in a P1 IHC before (A), during (B) and after (C) superfusion of a Ca2+-free solution. The inward current evident during the action potential was mostly ICa, as it was substantially reduced in Ca2+-free solution. The remaining small current (Fig. 1C) is likely to be INa (see below). In nine P1 IHCs the spike-induced ICa (−148 ± 12 pA) was able to elicit a ΔCm of 6.1 ± 0.5 fF. This implies that just after birth, IHCs are already able to respond to a single action potential with exocytosis, releasing about 165 synaptic vesicles (assuming 37 aF per vesicle; Lenzi et al. 1999).
ICa is necessary for generating action potentials in immature IHCs
Since the action potentials recorded from immature IHCs were slow, lasting over 10 ms, they are likely to have been mainly Ca2+ dependent. We tested this hypothesis by superfusing, under current-clamp conditions, five P7 IHCs with a Ca2+-free solution. Spontaneous action potentials were reversibly abolished in the absence of extracellular Ca2+ (Fig. 2A). When depolarizing current steps in 10 pA increments were applied to IHCs, single or repetitive spikes were elicited (Fig. 2B). Superfusion of a Ca2+-free solution (Fig. 2C) also rapidly and reversibly (Fig. 2D) abolished the evoked action potentials in all cells investigated.
ICa affects the speed and size of the action potential
The above results show that ICa is essential for spikes to occur. The next step was to investigate whether the extracellular Ca2+ concentration affects action potential timing. We therefore studied the effects of 1.3 and 5 mm Ca2+ on the action potentials (P7, n = 8). Figure 3A and B shows typical voltage responses from an IHC during the superfusion of 1.3 and 5 mm Ca2+, respectively. During the application of 5 mm Ca2+, we always observed a small hyperpolarizing shift of the resting membrane potential (from −69.1 ± 2.2 mV in 1.3 mm Ca2+ to −73.8 ± 2.1 mV in 5 mm Ca2+, n = 8, significant at P < 0.001). This shift is likely to be due to the activation of an SK current (see below). Note that although the spikes in the presence of 5 mm Ca2+ were faster, the distance between two neighbouring action potentials was almost unchanged and actually increased somewhat in 5 mm Ca2+. These effects were completely reversible after washout with 1.3 mm Ca2+. The following analysis has been carried out using the smallest current injection for which trains of action potentials were elicited (from +20 to +50 pA). In the presence of 5 mm Ca2+, the rate of rise of the subthreshold depolarization, measured halfway between successive action potentials, did not vary significantly from that of the control condition (Fig. 3C). However, the maximum rate of the upstroke and falling phase of the action potential increased significantly (P < 0.005) when extracellular Ca2+ was increased to 5 mm (Fig. 3D and E, respectively). The width of the action potential (Fig. 3F) at the subthreshold level (20 % of the spike height, Fig. 8A, corresponding to a membrane potential of −52.4 ± 1.2 mV in 1.3 mm Ca2+; −51.4 ± 0.9 mV in 5 mm Ca2+, n = 8) was found to be not significantly different between the two experimental conditions (Fig. 3F, left columns). However, the width of the action potential proper (80 % of the spike height: −24.4 ± 1.6 mV in 1.3 mm Ca2+; −11.3 ± 1.7 mV in 5 mm Ca2+) decreased from 4.7 ms (1.3 mm Ca2+) to 2.8 ms (5 mm Ca2+), values that are significantly different at P < 0.001 (Fig. 3F, right columns). During superfusion of 5 mm Ca2+, the height of the induced action potentials increased from 45.7 ± 1.9 mV (1.3 mm Ca2+) to 65.8 ± 2.0 mV, again values that are significantly different at P < 0.001 (n = 8). The maximum membrane potential reached was significantly (P < 0.0001) more depolarized in 5 mm Ca2+ (+2.0 ± 1.9 mV, n = 8) than in 1.3 mm Ca2+ (−15.3 ± 2.0 mV, n = 8). This larger depolarization in the presence of 5 mm Ca2+ would increase the amount of outward K+ current recruited for repolarizing the action potential, thus explaining why in high Ca2+ not only the depolarization, but also the spike repolarization was faster than that in 1.3 mm Ca2+. Therefore it is likely that developmental changes in the size of ICa could affect the shape of the action potential waveform in immature IHCs. Finally, we measured the frequency of the evoked action potentials elicited by depolarizing current injections from +10 pA to +100 pA, using both extracellular Ca2+ concentrations (Fig. 3G). The spike frequency was found to become significantly faster with increasing current injection in both 1.3 mm (P < 0.005, from +20 to +100 pA) and 5 mm Ca2+ (P < 0.0001, from +30 to +100 pA). In 5 mm Ca2+, action-potential frequency was lower at all levels of injected current (P < 0.0001) than in 1.3 mm Ca2+, most likely due to the more hyperpolarized resting membrane potential of IHCs when high Ca2+ was present.
Activation and inactivation of ICa in immature IHCs
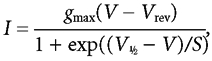
Since ICa is essential for action potentials to occur, we investigated the availability and kinetics of this current around the resting membrane potential of spiking IHCs. We attempted to isolate ICa by blocking K+ currents and INa using Cs+-based intracellular solutions and extracellular TEA (30 mm) and TTX (200 nm). ICa recordings from the same P6 IHC in the presence of 1.3 and 5 mm Ca2+ are shown in Fig. 4A and B, respectively, from a holding potential of −103 mV. The peak ICa at different membrane potentials, for both extracellular Ca2+ concentrations, recorded in seven P6-P7 IHCs was plotted to generate the current-voltage (I-V) curves shown in Fig. 4C, fitted with the following equation:
 |
(1) |
where I is the current, V is the membrane potential, Vrev is the reversal potential, gmax is the maximum chord conductance, V1/2 is the membrane potential at which the conductance is half activated and S describes the voltage sensitivity of activation. The maximum size of ICa increased (P < 0.0005) from −395 ± 28 pA in 1.3 mm Ca2+ at around −19 mV to −635 ± 39 pA at around −13 mV in 5 mm Ca2+. The potential of the maximum inward current was obtained from the fits to eqn (1) (Fig. 4C). The time constant of activation of ICa was obtained by fitting:
| (2) |
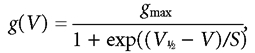
where I(t) is the current at time t, Imax is the peak ICa, τ is the time constant of activation and α is 2, which gives a better fit than a power of 3, consistent with a Hodgkin-Huxley model with two opening gating particles (Hodgkin & Huxley, 1952). Figure 4D shows the activation time constants at different membrane potentials measured in the same seven IHCs, and they were significantly faster in 1.3 mm than in 5 mm Ca2+ (P < 0.0005). The activation curves shown in Fig. 5D (closed and open circles) were obtained from the normalized chord conductance, using a reversal potential of +45 mV, obtained from the fits in Fig. 4C for both Ca2+ concentrations. Activation curves were approximated by first-order Boltzmann fits:
 |
(3) |
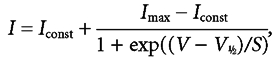
where g is the chord conductance at membrane potential V and the other parameters are as in eqn (1). In 1.3 mm Ca2+, the current activated positive to −65 mV (defined as 1 % of gmax). During superfusion of 5 mm Ca2+ we observed a positive shift of the activation curve by about 6 mV, with V1/2 changing from −32.3 ± 0.2 mV in 1.3 mm Ca2+ to −26.4 ± 0.2 mV in 5 mm Ca2+ (P6-P7 IHCs, n = 7, P < 0.0001). This shift is likely to contribute to the different relationship between τ activation and membrane potential in the two different Ca2+ concentrations (Fig. 4D). The slope factor of the activation curves at about 7 mV was the same at the two Ca2+ concentrations. ICa also showed inactivation, which was more prominent in 5 mm Ca2+ than in 1.3 mm Ca2+. When 5 mm Ba2+ was used instead of 1.3 mm Ca2+ in the extracellular solution, inactivation was still present, but was substantially reduced despite a 2.4 times increase in maximum current (data not shown). The inactivation of ICa was studied in the presence of apamin in order to remove contamination by an SK current (Tucker & Fettiplace, 1996; Schnee & Ricci, 2003). This current became evident for depolarizing steps longer than 10–20 ms, and in particular when 5 mm Ca2+ was used. Figure 5A shows an example of inward current recorded over a period of 500 ms before and during extracellular application of 1 μm apamin, a concentration that fully blocked the SK current. Inactivation curves (Fig. 5D, closed and open triangles) were obtained by measuring the peak currents (Fig. 5B and C) during a 20 ms test step to −14 mV following a series of 500 ms conditioning steps from a holding potential of −84 mV. For a simplified description of inactivation in the physiological range, a modified first-order Boltzmann equation was fitted up to the potential of maximum inactivation:
 |
(4) |
where Iconst is the amplitude of the non-inactivating component of ICa and the other parameters are as in eqn (1). Apical-coil IHCs have a mean resting membrane potential of −66 mV at P5-P7 (Marcotti et al. 2003), thus ICa is fully available when IHCs are depolarized from the resting potential. Increasing the Ca2+ concentration shifted the inactivation in the positive direction by about 13 mV, with V1/2 changing from −39.2 ± 0.4 mV in 1.3 mm Ca2+ to −26.1 ± 0.7 mV in 5 mm Ca2+ (P5 IHCs, n = 5, P < 0.001). The relationship between inactivation and conditioning voltage broadly resembles the I-V curve of ICa, and the degree of inactivation was larger in 5 mm Ca2+. Both findings are indicative of a Ca2+-dependent inactivation process (Brehm & Eckert, 1978; Schnee & Ricci, 2003). Figure 5E shows the percentage of ICa that inactivated (left panel) and the V1/2 of inactivation (right panel) for conditioning steps of different duration (20 ms, 100 ms and 500 ms) and using 1.3 and 5 mm extracellular Ca2+.
Figure 5. Activation and inactivation of ICa in immature IHCs.
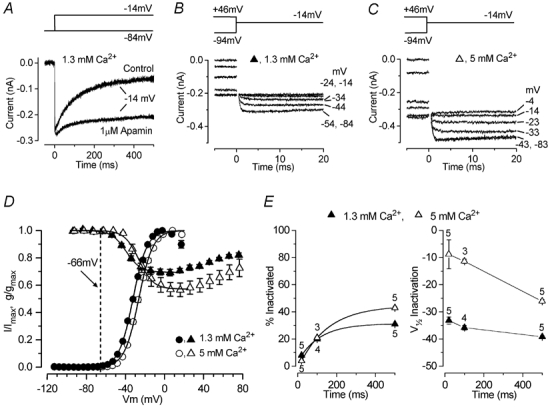
A, inward currents in a P5 IHC during 500 ms depolarizing steps to −14 mV from a holding potential of −84 mV, before and during extracellular application of 1 μm apamin. Extracellular Ca2+ was 1.3 mm throughout the experiment. Recordings are single traces. B and C, tail currents at a membrane potential of −14 mV were used to derive the inactivation curves (see text for details). Some of the conditioning voltages are shown next to the traces. Residual capacitative transients were blanked. Conditioning steps were 500 ms in duration from −94 mV to more positive values in 10 mV increments. The holding potential was −84 mV. B and C are both averages from two repetitions. Recordings in A-C are from the same IHC, and the recording conditions were: Cm 7.0 pF; Rs 7.2 MΩ; gleak 1.7 nS; temperature 37°C. D, activation of ICa from seven P6-P7 IHCs (circles),including the cell shown in Fig. 4A and B, and inactivation of ICa from five P5 IHCs (triangles), including the cell shown in B and C, in 1.3 and 5 mm extracellular Ca2+. Inactivation followed 500 ms conditioning steps. The dashed line is −66 mV, the average resting membrane potential for P5-P7 apical-coil IHCs. The continuous lines are fits calculated using eqn (3) for activation and eqn (4) for inactivation (see text for details). The fitting parameters for activation are: in 1.3 mm Ca2+ (•), gmax7.0 nS, V1/2-32.3 mV, S 7.2 mV; in 5 mm Ca2+ (○), gmax 13.0 nS, V1/2−26.4 mV, S 7.3 mV. Parameters for inactivation were: in 1.3 mm Ca2+ (▴), Imax−316 pA, Iconst 0.69 Imax, V1/2−39.2 mV, S 7.4 mV; in 5 mm Ca2+ (▵), Imax−510 pA, Iconst 0.57 Imax, V1/2−26.1 mV, S 7.3 mV. E, percentage of inactivation and V1/2 of inactivation (derived from the fit of the inactivation curves using eqn (4)) when 20, 100 and 500 ms conditioning pulses were applied in the same P5 IHCs using 1.3 and 5 mm extracellular Ca2+.
Activation and inactivation of INa in immature IHCs
Patch-clamp recordings indicated that in addition to ICa, INa is expressed in IHCs from just after birth (Kros et al. 1993; Kros, 1996). The voltage range over which INa is available was investigated at body temperature. Figure 6A shows an example of INa recorded using voltage steps of 5 or 10 mV increments from a holding potential of −103 mV. INa was isolated by subtracting the current during superfusion of 300 nm TTX from the control current recorded before. The average peak INa recorded at different membrane potentials in 11 P6-P7 IHCs was plotted to generate the I-V curve shown in Fig. 6B. The peak INa was measured either from the subtracted current (Fig. 6A) or directly from the current recorded in the presence of 30 μm nifedipine and 30 mm TEA. The fit to the I-V curve was obtained using eqn (1). The maximum inward INa was reached at around −17 mV, from the fit in Fig. 6B. The time constant of activation of INa was measured using eqn (2) with α set as 3, which gave a better fit than powers of either 2 or 4, consistent with a Hodgkin-Huxley model with m3 kinetics (Hodgkin & Huxley, 1952). Figure 6C (closed circles) shows the τ of activation at different membrane potentials measured in nine IHCs. The time course of inactivation of INa (six P6 IHCs) was best fitted using a single exponential. Average values for the time constants of inactivation studied over a range of membrane potentials are shown in Fig. 6C (open circles).
The sensitivity of INa to TTX appears to differ between hair cell types. TTX (100 nm) was sufficient to block INa in rat utricular hair cells (Lennan et al. 1999), auditory hair cells from alligators (Evans & Fuchs, 1987), mouse IHCs (Kros et al. 1993) and guinea pig outer hair cells (OHCs; Witt et al. 1994). However, INa in mouse utricular hair cells (Rüsch & Eatock, 1997) and rat OHCs (Oliver et al. 1997) were less sensitive (KD: 348 nm and 474 nm, respectively). For IHCs, the KD for the block of INa by TTX was 4.8 nm (Fig. 6D).
The steady-state inactivation curve (Fig. 6F, open symbols) was obtained by measuring the peak currents (Fig. 6E) during a 10 ms test step to −24 mV following 50 ms conditioning steps to a range of potentials from a holding potential of −84 mV. Normalized peak currents from six P6 IHCs were plotted against the different conditioning potentials and fitted by a first-order Boltzmann equation:
 |
(5) |
where I is the peak current, Imax the maximal peak current and the other parameters are as in eqn (1). Half inactivation occurred at about −71 mV. Apical-coil IHCs have a mean resting membrane potential of −68 mV at P6-P7 (Marcotti et al. 2003) and 31 % of INa is available at the resting potential. The activation curve (Fig. 6F, closed symbols) was obtained by calculating the normalized chord conductance (using a reversal potential of +53 mV obtained from the fit in Fig. 6B) and approximated by a single, first-order Boltzmann equation, using eqn (3). Note that INa is activated at membrane potentials positive to about −60 mV (1 % of gmax).
INa modulates the spike frequency in immature IHCs
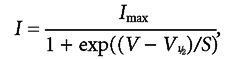
The presence of a large INa in immature IHCs raises the question that if the spikes are Ca2+ dependent, what (if anything) is the role of INa? To evaluate whether INa might contribute to the action potential, we studied IHCs under current-clamp conditions before and after the extracellular application of TTX. Extracellular application of a fully blocking concentration of TTX (up to 1 μm) did not prevent spontaneous (Fig. 7A) or induced (Fig. 7F) spiking activity in immature IHCs. Moreover, voltage-clamp experiments showed that 29 % of immature IHCs (44 out of 151 cells, E16.5-P11) did not express INa. Therefore, we also investigated whether these cells without INa were capable of firing action potentials. Since eight IHCs (P2-P6) that clearly had no INa fired spontaneous action potentials, we conclude that INa is not essential for spike generation, as shown for a P2 IHC in Fig. 7B.
Figure 7. Contribution of INa to IHC action potentials.
A, spontaneous action potentials from a P4 IHC before and during superfusion of 500 nm TTX. The recording conditions were: Vm−61 mV; Cm 7.1 pF; Rs 5.9 MΩ, gleak 0.7 nS; temperature 37°C. B, currents recorded under voltage-clamp conditions (top) and spontaneous action potentials (below) recorded from a P2 IHC. This cell lacked INa. The recording conditions were: Vm−64 mV; Cm 6.5 pF; Rs 5.6 MΩ, gleak 2.4 nS; temperature 35°C. C and D, membrane currents elicited by using nominally 10 mV voltage steps, from a P4 IHC before (C) and during (D) superfusion of 500 nm TTX from a holding potential of −84 mV. Actual membrane potentials corrected for the voltage drop across Rs are shown for the peak inward current only. In C, note the presence of both inward INa and ICa and the much slower outward IK,neo. During superfusion of TTX, the fast INa was completely blocked (D). Recordings in C and D are single traces. E, peak I-V curve (•) for the inward currents shown in C. The current values for the traces in D (○) were obtained at the same time point used for values in C. F, voltage responses from the same cell shown in C and D before, during and after superfusion of 500 nm TTX. Note that in the presence of the drug the spike frequency is reduced. All current and voltage responses are single traces. The recording conditions were: Vm−74 mV; Cm 6.8 pF; Rs 3.1 MΩ, gleak 2.2 nS; temperature 36.5°C.
Although not essential, we observed that blocking INa could influence the time course of action potentials and therefore modulate their frequency. For example, Fig. 7A shows one of five cells that had a reduced frequency of spontaneous action potentials in the presence of TTX. To study the contribution of INa to action-potential generation, we investigated 14 IHCs (age range P3-P10) from the apical coil of the cochlea both under voltage-clamp conditions and with injections of small depolarizing currents. Figure 7C-F shows a typical example in a P4 IHC. Under voltage-clamp conditions, depolarizing voltage steps in 10 mV increments, from a holding potential of −84 mV, elicited a fast inward current followed by a sustained component (Fig. 7C). A large but much slower outward K+ current (IK,neo) was also present. When a full blocking concentration of TTX (100–500 nm) was superfused, the large INa was completely abolished and the inward ICa was revealed (Fig. 7D). The block was reversible after washout. The peak of INa (Fig. 7C) and the size of the current remaining in the presence of 500 nm TTX (Fig. 7D), measured at exactly the same time points for each membrane potential (i.e. those of the peak INa), were plotted to generate the I-V curves shown in Fig. 7E. Direct information about the role of the TTX-sensitive INa in spiking activity was obtained by recording voltage responses before, during and after block of INa. Figure 7F shows the effects of 500 nm TTX when 20 pA of depolarizing current was applied to the same cell shown in Fig. 7C-E. A detailed examination of evoked spikes (Fig. 8A) showed that blocking INa appears to slow down the subthreshold depolarization in between successive action potentials, effectively increasing the time necessary for the membrane potential to reach the action-potential threshold.
The following analysis has been carried out using the smallest current injection for which trains of action potentials were elicited (from +10 to +100 pA) in 14 P3-P10 IHCs. In the absence of INa, the subthreshold depolarization was significantly slowed (P < 0.001 for both control versus TTX and washout versus TTX) to 48 % of its mean rate of rise (dV/dt) before and after TTX (Fig. 8B). The lack of INa also had a significant effect (P < 0.001 control-TTX and P < 0.01 TTX-washout) on the maximum rate of rise of the upstroke of the action potential (Fig. 8C). However, the rate of action-potential repolarization was not significantly reduced in the presence of TTX (Fig. 8D). The slower subthreshold depolarization in the presence of TTX suggests a possible reduction in spike frequency in the absence of INa. Indeed, in the presence of TTX, the spike frequency was about 27 % slower than that of both control and washout (Fig. 8E), significant at P < 0.001 for both control versus TTX and washout versus TTX. The action potential height (control 38.6 ± 1.3 mV; TTX 36.6 ± 1.4 mV; washout 38.3 ± 1.5 mV, n = 14) was not significantly affected by TTX. Finally, we measured the width of the action potential at the subthreshold (20 % of the spike height (Fig. 8A), corresponding to a membrane potential of −54.8 ± 1.3 mV, n = 14) and the action potential proper (80 %, corresponding to −32.5 ± 1.4 mV) levels. Using this approach, the effects of TTX on the two distinct processes could be evaluated in isolation. At the subthreshold level, the width was larger in TTX (P < 0.001 for both control versus TTX and washout versus TTX, Fig. 8F, left columns). On the other hand, the width of the actual spike was not found to vary significantly (Fig. 8F, right columns). These results suggest that INa has a role in spacing the action potentials by reducing the time necessary for reaching the threshold.
Developmental maturation of action potentials and INa and ICa
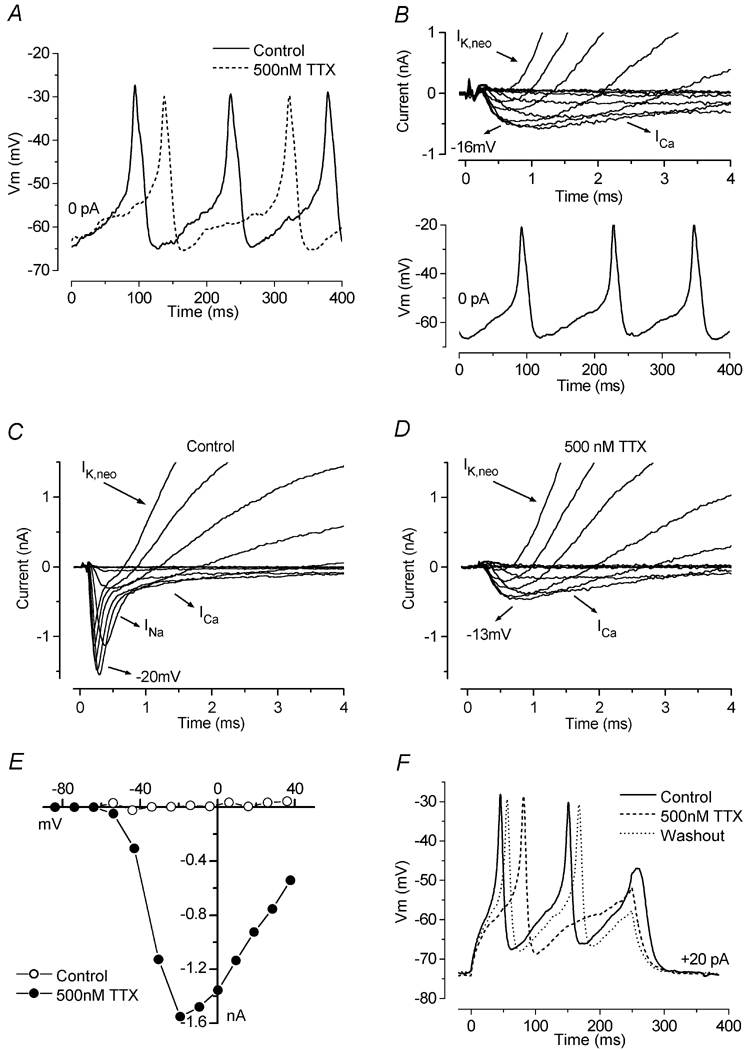
IHCs begin to fire action potentials from E17.5 (Marcotti et al. 2003), but up to about P0 they are broader than those recorded in older cells (Fig. 9A and B). From a direct comparison between embryonic and postnatal spikes (Fig. 9C), it is clear that both the depolarizing and repolarizing phases of the spikes speed up during development. The slow repolarization of embryonic spikes is likely to be due to the smaller outward K+ current expressed by these cells compared to that of postnatal cells (Marcotti et al. 2003). In addition, since embryonic spikes reach significantly (P < 0.01) less depolarized peaks (E17.5-E18.5: −33.4 ± 3.5 mV, n = 4) than neonatal spikes (P3-P6: −22.7 ± 1.7 mV, n = 11) measured for current injections between 0 pA and + 40 pA, possibly due to the small ICa (Fig. 9E), the amount of repolarizing K+ current recruited by embryonic IHCs during an action potential is likely to be small.
Figure 9. Changes in spike frequency and INa and ICa during IHC maturation.
A and B, voltage responses from IHCs at E18.5 (A) and P4 (B). C, single action potential from recordings in A and B. The recording conditions for A were: Vm−57 mV; Cm 7.1 pF; Rs 3.7 MΩ, gleak 0.8 nS; temperature 37°C. Those for B were: Vm−74 mV; Cm 7.5 pF; Rs 6.6 MΩ, gleak 1.2 nS; temperature 37°C. D, developmental changes of the width measured at both the subthreshold (•, width at 20 %) and spike (○, 80 %) levels. Numbers of cells (E17.5-P10): 1, 2, 2, 2, 7, 18, 15, 4, 6, 14, 4, 3, 5. E, development of the peak INa and ICa in apical-coil IHCs. Numbers of cells showing INa/total number of cells investigated at the various ages: •, (E16.5-P20) 3/5, 1/4, 3/3, 4/5, 4/5, 11/12, 12/13, 15/17, 20/25, 18/22, 5/5, 4/14, 4/12, 3/9, 0/5, 0/4, 0/1, 0/3, 0/4, 0/3. Only cells exhibiting the INa are included in the averages. Numbers of cells for ICa (○, E16.5-P20): 3, 2, 3, 7, 11, 22, 28, 12, 4, 10, 15, 9, 5, 4, 3, 4, 3. F, changes in spike frequency under current-clamp conditions from apical-coil IHCs during development. Values were measured at +40 and +80 pA current injection from the resting potential in order to follow the changes in spike frequency during early and later stages of development, respectively. The temperature in all cells investigated was between 35 and 37°C. Numbers of cells: ▵ (E17.5-P6, +40 pA) 1, 2, 2, 2, 7, 18, 15, 3, 6; ▴ (P1-P10, +80 pA) 2, 7, 18, 15, 4, 6, 14, 4, 3, 5.
In order to investigate the relative contribution of both ICa and INa to the changes in action-potential timing during development, we measured both the subthreshold and spike width of action potentials as a function of age. The widths were measured (as shown in Fig. 8A) up to P10 only, since at P11-P12 only a single spike was elicited even using very large depolarizing current injections. As shown in Fig. 9D, embryonic to P0 IHCs exhibited action potentials with much larger widths than those of neonatal cells (significant at P < 0.0001). The large subthreshold and spike widths of embryonic cells could be explained by INa and ICa, respectively, being very small. This small INa in embryonic and P0 IHCs is unlikely to be available under physiological conditions, since the more depolarized membrane potential of these cells (−58.6 ± 1.8 mV, n = 10, E17.5-P0) compared to that of older postnatal cells (−65.5 ± 0.8 mV, n = 71, P1-P12, significant at P < 0.005) will inactivate it. It is important to mention that the larger width of the spike, as stated previously, is also a consequence of the small contribution, at this stage in development, of the repolarizing outward delayed-rectifier K+ current. If the K+ current was playing a major role in setting the action potential waveform, one would expect a gradual developmental reduction in spike width, since this current steadily increases in amplitude with postnatal maturation until well after the onset of hearing (Kros et al. 1998; Marcotti et al. 2003). However, the spike widths suddenly decreased from just after birth (P < 0.001, Fig. 9D) and then followed more closely the changes in ICa and INa (Fig. 9E) than the K+ current amplitudes (Fig. 1E in Marcotti et al. 2003). In fact, during the first postnatal week, both widths decreased slightly, and then from P9 (at the 20 % width) and P10 (at 80 % width) they became again significantly larger (P < 0.001). This increased width coincides with a decrease in the size of both ICa and INa, suggesting a role for both currents in determining the waveform of the action potentials. The sizes of INa and ICa were measured from apical-coil IHCs from embryonic stages up to maturity (P20). The currents were measured at the peak, near −20 mV for both INa and ICa, from holding potentials of −84 and −81 mV, respectively (Fig. 9E). At these potentials, 95 % of INa and 100 % of ICa are available for activation. A few cells were held at −103 mV. Although very small, both currents were present in immature IHCs as early as E16.5, and from just after birth their size rapidly increased, reaching a maximum value around the end of the first postnatal week. During the second postnatal week, both currents decreased in amplitude. However, although INa was completely downregulated around the onset of hearing, ICa was still present in mature IHCs, with an average size of about 100 pA. Figure 9F shows the variation in spike frequency as a function of developmental maturation. Spikes could be elicited from E17.5 and then promptly disappeared around P12 (Kros et al. 1998). Since the amount of current needed to elicit action potentials increased with development, we selected both +40 and +80 pA levels as reasonable values to compare spiking during most of the period investigated. P11-P12 IHCs are not shown since only a single action potential was elicited even for depolarizing current injections larger than 100 pA. Spike frequency in P1-P8 IHCs was significantly higher than in embryonic (P < 0.01) and P9-P10 (P < 0.001) cells. The changes in spike frequency in immature IHCs appear to be fairly well correlated with the variation, during the same time window, in the sizes of INa and ICa.
DISCUSSION
ICa and INa shape the action-potential waveform in immature IHCs in different ways
In this paper we describe the main activation and inactivation properties of ICa and INa in immature IHCs of the mouse cochlea and their role in shaping action potentials. Action potentials in IHCs start just before birth (Marcotti et al. 2003) and last until the large and rapidly activating Ca2+-activated K+ current IK,f first appears around the onset of hearing (P12; Kros et al. 1998). Spikes can either be recorded spontaneously, up to about P6 (Marcotti et al. 2003), or elicited by depolarizing current injection, the required size of which varies depending on the developmental age of the cells investigated.
The present findings show that action potentials in immature IHCs are due mainly to the interplay of immature K+ currents and ICa. ICa is necessary for action potential generation, as neither spontaneous nor evoked spikes can be elicited when extracellular Ca2+ is omitted (Fig. 2). Increasing extracellular Ca2+ from 1.3 to 5 mm increases the height and reduces the width of the action potentials, presumably due to the increased size of ICa (Fig. 4). ICa, together with the immature outward K+ currents, speeds up both the depolarization and the falling phase of the spike. In IHCs, both ICa and K+ currents are expressed at all stages of development, although their size varies with age. However, while the amplitude of K+ currents gradually increases with maturation (Marcotti et al. 2003), that of ICa (Fig. 9E) matches more closely the changes in action potential waveform (Fig. 9D) and frequency (Fig. 9F) that occur during development. ICa in immature IHCs, mainly carried by L-type Ca2+ channels containing the α1D (Cav1.3) subunit (Platzer et al. 2000; Koschak et al. 2001), is available around the resting membrane potential and over the entire physiological membrane potential range. It starts to activate at around −65 mV, has its maximum inward current at −19 mV and shows up to 30 % Ca2+-dependent inactivation (Brehm & Eckert, 1978) in 1.3 mm extracellular Ca2+ (Fig. 5D). The activation time constants in 1.3 mm Ca2+ measured at near body temperature (Fig. 4D) were about twice as fast as those of IHCs at room temperature (data not shown), as well as time constants fitted with the m2 kinetics reported for other hair cells (Art & Fettiplace, 1987; Zidanic & Fuchs, 1995). The inactivation of ICa is more substantial than reported previously for IHCs (Platzer et al. 2000), but is comparable to recent findings in turtle auditory hair cells (Schnee & Ricci, 2003).
In addition to ICa, embryonic and neonatal IHCs also express an inward TTX-sensitive INa, known to generate action potentials in most neurons (Hille, 2001). Action-potential generation by IHCs, however, required ICa but not INa. A TTX-sensitive INa has been reported in the hair cells of vestibular and cochlear organs of various other vertebrates (Evans & Fuchs 1987; Sugihara & Furukawa, 1989; Sokolowski et al. 1993; Witt et al. 1994; Oliver et al. 1997; Lennan et al. 1999; Masetto et al. 2003) with a surprisingly large range of steady-state inactivation properties. In most of these studies the very negative steady-state inactivation for INa puts into question its role around the physiological resting membrane potential. Since the IHC INa is only partially inactivated at the resting potential, we were interested in finding whether it has a distinct role, different from that played by ICa, in shaping the spikes. Up to now, clear evidence of the involvement of INa in action potential activity has been shown only in goldfish hair cells, where the rising phase of induced spikes was slower in the presence of TTX (Sugihara & Furukawa, 1989). Our results show that this is also the case in immature IHCs, but, in addition, INa shapes action potentials by speeding up the time necessary for the membrane potential to reach threshold, and therefore it could potentially make the generation of spontaneous action potentials more robust and could play a role in setting their frequency.
A somewhat similar role for INa in subthreshold depolarization has been suggested for small dorsal root ganglion (DRG) neurons (Blair & Bean, 2002). In these neurons, although the shape of the action potential is determined mainly by a TTX-resistant INa and by ICa, the faster, TTX-sensitive INa contributes to the spike waveform by speeding up the time to reach threshold. This TTX-sensitive INa is carried by the peripheral nerve type 1 Na+ channel (PNI), now known as the Nav1.7 isoform, which is highly expressed in the peripheral nervous system (Sangameswaran et al. 1997) and especially in small DRG neurons (Djouhri et al. 2003). Of the nine Na+ channel isoforms with known function (Nav1.1-Nav1.9, reviewed by Goldin, 2001), Nav1.7 is a potential candidate for INa in IHCs as it is the closest match in terms of the KD for block by TTX (4 nm, Sangameswaran et al. 1997), hyperpolarized steady-state activation and inactivation, and very fast kinetics (Ogata & Tatebayashi, 1993; Sangameswaran et al. 1997; Blair & Bean, 2002).
The effects of INa on the subthreshold depolarization preceding the action potentials are likely to be dependent on the resting membrane potential, as the current exhibits steady-state inactivation. In IHCs, at body temperature, INa activates positive to −60 mV. Half-inactivation occurs at −71 mV and the current is fully inactivated (defined as 99 % inactivation) at potentials positive to −52 mV (Fig. 6F). Over the age range at which they express a sizeable INa (P1-P11), the mean resting potential of apical-coil IHCs varies between −56 and −76 mV (Marcotti et al. 2003), and from 2.5 to 75 % of INa should be non-inactivated and thus available to shape the voltage responses. The presence of a functional INa at the IHC resting membrane potential is confirmed by our current-clamp experiments in which postnatal IHCs were superfused with TTX (Fig. 7A and F). Since extracellular superfusion of TTX increased the time to threshold for an action potential, INa is at least partially available around the resting membrane potential. Our results also suggest that the more depolarized resting membrane potential of embryonic IHCs would largely inactivate the small INa, which might contribute to the very slow subthreshold depolarization of the action potentials observed in these cells.
It should be kept in mind that our recordings were conducted in vitro with intra- and extracellular solutions designed to be physiological, but which may nevertheless be different from the in vivo situation. The resting potentials or the position of the INa inactivation curve may thus be subtly different in vivo. Neonatal IHCs already have a large mechanoelectrical transducer current (Kros et al. 1992). The fraction of this depolarizing current that is activated at rest is likely to become larger in vivo by the time the endolymph becomes adult-like in ionic composition and the endocochlear potential is established (Crawford et al. 1991; Ricci & Fettiplace, 1998). In mice, these changes are likely to occur sometime during the second postnatal week (reviewed by Rübsamen & Lippe, 1998), potentially affecting the nature of the action-potential activity: one possibility is that spontaneous activity might in vivo persist beyond P6 up to the onset of hearing.
In developing IHCs, by decreasing the time to threshold and the spike width, INa and ICa are together capable of modulating the spike waveform and the frequency of spontaneous and induced action potentials. It is worth noting that although both inward currents appear to reduce in size starting from the second postnatal week, INa seems to disappear at around the same time as the action potentials (P12; Fig. 9), suggesting that it may have a specifically developmental role. However, the lack of detection of INa in mature IHCs might conceivably be due to inactivation being shifted towards more hyperpolarized potentials in older cells, as observed previously in mature OHCs (Witt et al. 1994). If this is the case, INa is unlikely to have a functional role in mature IHCs as it will be fully inactivated around the resting potential and in the voltage range of the receptor potentials.
The frequency and shape of spontaneous action potentials might control specific activity-dependent developmental events
Spontaneous spiking by IHCs could potentially act at two levels: it could contribute postsynaptically to the remodelling of afferent synaptic connections, with the auditory nerve and further on in the auditory brainstem, but it could also act presynaptically to affect the development of the IHCs themselves. Spontaneous action potentials are thought to be important for the maturation and refinement of synaptic connections in the developing nervous system, including the visual system (for a review see Zhang & Poo, 2001). A similar role for spontaneous spiking activity has also been suggested for immature IHCs of the mouse cochlea (Kros et al. 1998; Marcotti et al. 2003). A number of physiological and morphological observations support this hypothesis. The maturation of most of the auditory neural connections to and from the brain (Shnerson et al. 1982; Echteler, 1992; Tierney et al. 1997; Pujol et al. 1998; Sanes & Walsh, 1998; Mostafapour et al. 2000) is observed well before the onset of sound-evoked responses. Deafferentation by surgical removal of the cochlea, when performed within the first postnatal week, a period in which spontaneous spikes occur in IHCs, results in substantial loss of cochlear nucleus neurons (Tierney et al. 1997; Mostafapour et al. 2000). Moreover, during the same time window, IHCs appear physiologically competent to send information to the developing afferent system by synaptic transmission. Presynaptic active zones in mouse IHCs are already present at birth, and although their morphology changes during development (Sobkowicz et al. 1982, 1986), exocytosis (in a physiological extracellular Ca2+ concentration) was observed in neonatal IHCs as early as P1 when a single action potential was used as a protocol (Fig. 1B). Provided the exocytosis we observe is indeed due to fusion of neurotransmitter-filled vesicles, the IHCs are potentially capable of relaying some information, such as the developmental or the functional state of the cell, to the afferent auditory pathways and may thus influence their maturation. Glutamate receptors are already present at P1 in afferent nerve endings contacting IHCs in rats (Knipper et al. 1997), which have a time course for inner ear development similar to mice, and there is indirect evidence for glutamate release from rat IHCs at P3 (Pujol et al. 1998). In the first postnatal week, mouse spiral ganglion neurons are already capable of firing Na+-dependent action potentials (Mo & Davis, 1997; Lin & Chen, 2000) and form functional afferent synapses in the brainstem (Wu & Oertel, 1987).
Embryonic IHCs exhibit smaller and broader spikes than postnatal cells (Fig. 9C) and the spikes occur at a lower frequency (Fig. 9F). In other cell types, broader action potentials of lower frequency have been observed early in development compared to those at later stages (Moody, 1998) as a consequence of a low density and slow activation kinetics of the underlying channels. It remains to be established to what extent the precise spike frequency or duration are important for postsynaptic maturation. The best evidence that frequency may be important comes from experiments on primary auditory afferents of prehatch chicks, where the frequency of spontaneous spiking was of the order of that reported here for IHCs and increased steadily during development (Jones et al. 2001).
In addition, Ca2+ entry during spontaneous spiking activity might influence the expression and the developmental maturation of ion channels and other proteins in the hair cells themselves, as found previously in other systems (Moody 1998; Spitzer, 2002). If this is the case in IHCs, the spontaneous action potentials might be relevant for the correct maturation of IK,neo into IK,s (Marcotti et al. 2003) as well as for the expression of IK,n and the Ca2+-activated K+ current IK,f around the onset of hearing (Kros et al. 1998; Marcotti et al. 2003). The latter prevents further action potentials, thus changing the immature cells into fully functional high-frequency sensory receptors (Kros et al. 1998). In a similar scenario, in ascidian muscle a period of spontaneous Ca2+ action potentials is required for the developmental appearance of a Ca2+-activated K+ current, which in turn terminates the spontaneous activity (Dallman et al. 1998). Different shapes or frequencies of action potentials might lead to different levels of intracellular Ca2+, possibly boosted by Ca2+-induced Ca2+ release (Kennedy & Meech, 2002), but we have not measured this. The importance of the frequency of spontaneous Ca2+ spikes on transcription regulation has been reported in developing spinal neurons (Watt et al. 2000). Indirectly, the absence of action potentials during development may affect cell survival as IHCs progressively degenerate after the onset of hearing in α1D (Cav1.3)-knockout mice (Platzer et al. 2000).
Acknowledgments
This work was supported by the MRC and the Royal Society. This paper is dedicated to the memory of our friend and colleague Alfons Rüsch who died in 2002. A.R. started this study together with C.J.K. while at the University of Sussex and made important contributions.
REFERENCES
- Art JJ, Fettiplace R. Variation of membrane properties in hair cells isolated from the turtle cochlea. J Physiol. 1987;385:207–242. doi: 10.1113/jphysiol.1987.sp016492. [DOI] [PMC free article] [PubMed] [Google Scholar]
- Beutner D, Moser T. The presynaptic function of mouse cochlear inner hair cells during development of hearing. J Neurosci. 2001;21:4593–4599. doi: 10.1523/JNEUROSCI.21-13-04593.2001. [DOI] [PMC free article] [PubMed] [Google Scholar]
- Blair NT, Bean BP. Roles of tetrodotoxin (TTX)-sensitive Na+ current, TTX-resistant Na+ current, and Ca2+ current in the action potentials of nociceptive sensory neurons. J Neurosci. 2002;22:10277–10290. doi: 10.1523/JNEUROSCI.22-23-10277.2002. [DOI] [PMC free article] [PubMed] [Google Scholar]
- Blaustein MP, Goldman DE. The action of certain polyvalent cations on the voltage-clamped lobster axon. J Gen Physiol. 1968;51:279–291. doi: 10.1085/jgp.51.3.279. [DOI] [PMC free article] [PubMed] [Google Scholar]
- Brehm P, Eckert R. Calcium entry leads to inactivation of calcium channel in Paramecium. Science. 1978;202:1203–1206. doi: 10.1126/science.103199. [DOI] [PubMed] [Google Scholar]
- Crawford AC, Evans MG, Fettiplace R. The actions of calcium on the mechanoelectrical transducer current of turtle hair cells. J Physiol. 1991;434:369–398. doi: 10.1113/jphysiol.1991.sp018475. [DOI] [PMC free article] [PubMed] [Google Scholar]
- Dallman JE, Davis AK, Moody WJ. Spontaneous activity regulates calcium-dependent K+ current expression in developing ascidian muscle. J Physiol. 1998;511:683–693. doi: 10.1111/j.1469-7793.1998.683bg.x. [DOI] [PMC free article] [PubMed] [Google Scholar]
- Djouhri L, Fang X, Okuse K, Wood JN, Berry CM, Lawson S. The TTX-resistant sodium channel Nav1. 8 (SNS/PN3): expression and correlation with membrane properties in rat nociceptive primary afferent neurons. J Physiol. 2003;546:565–576. doi: 10.1113/jphysiol.2003.042127. [DOI] [PMC free article] [PubMed] [Google Scholar]
- Echteler SM. Developmental segregation in the afferent projections to mammalian auditory hair cells. Proc Natl Acad Sci U S A. 1992;89:6324–6327. doi: 10.1073/pnas.89.14.6324. [DOI] [PMC free article] [PubMed] [Google Scholar]
- Ehret G. Masked auditory thresholds, critical ratios, and scales of the basilar membrane of the house mouse (Mus musculus) J Comp Physiol. 1975;103:329–341. [Google Scholar]
- Evans MG, Fuchs PA. Tetrodotoxin-sensitive, voltage-dependent sodium currents in hair cells for the alligator cochlea. Biophys J. 1987;52:649–652. doi: 10.1016/S0006-3495(87)83256-3. [DOI] [PMC free article] [PubMed] [Google Scholar]
- Fuchs PA, Evans MG. Potassium currents in hair cells isolated from the cochlea of the chick. J Physiol. 1990;429:529–551. doi: 10.1113/jphysiol.1990.sp018271. [DOI] [PMC free article] [PubMed] [Google Scholar]
- Fuchs PA, Sokolowski BH. The acquisition during development of Ca-activated potassium currents by cochlear hair cells of the chick. Proc R Soc Lond B. 1990;241:122–126. doi: 10.1098/rspb.1990.0075. [DOI] [PubMed] [Google Scholar]
- Goldin AL. Resurgence of sodium channel research. Annu Rev Physiol. 2001;63:871–94. doi: 10.1146/annurev.physiol.63.1.871. [DOI] [PubMed] [Google Scholar]
- Gummer AW, Mark RF. Patterned neural activity in brain stem auditory areas of a prehearing mammal, the tammar wallaby (Macropus eugenii) Neuroreport. 1994;5:685–688. doi: 10.1097/00001756-199402000-00006. [DOI] [PubMed] [Google Scholar]
- Hille B. Ionic Channels of Excitable Membranes. 3. Sunderland, MA: Blackwell Science Inc; 2001. [Google Scholar]
- Hodgkin AL, Huxley AF. A quantitative description of membrane current and its application to conduction and excitation in nerve. J Physiol. 1952;117:500–544. doi: 10.1113/jphysiol.1952.sp004764. [DOI] [PMC free article] [PubMed] [Google Scholar]
- Hudspeth AJ, Corey DP. Sensitivity, polarity, and conductance change in the response of vertebrate hair cells to controlled mechanical stimuli. Proc Natl Acad Sci U S A. 1977;74:2407–2411. doi: 10.1073/pnas.74.6.2407. [DOI] [PMC free article] [PubMed] [Google Scholar]
- Johnson SL, Thomas MV, Kros CJ. Membrane capacitance measurement using patch clamp with integrated self-balancing lock-in amplifier. Pflugers Arch. 2002;443:653–663. doi: 10.1007/s00424-001-0763-z. [DOI] [PubMed] [Google Scholar]
- Jones TA, Jones SM, Paggett KC. Primordial rhythmic bursting in embryonic cochlear ganglion cells. J Neurosci. 2001;21:8129–8135. doi: 10.1523/JNEUROSCI.21-20-08129.2001. [DOI] [PMC free article] [PubMed] [Google Scholar]
- Kennedy HJ, Meech RW. Fast Ca2+ signals at mouse inner hair cell synapse: a role for Ca2+-induced Ca2+ release. J Physiol. 2002;539:15–23. doi: 10.1113/jphysiol.2001.013171. [DOI] [PMC free article] [PubMed] [Google Scholar]
- Knipper M, Kopschall I, Rohbock K, Kopke AK, Bonk I, Zimmermann U, Zenner H. Transient expression of NMDA receptors during rearrangement of AMPA-receptor-expressing fibers in the developing inner ear. Cell Tissue Res. 1997;287:23–41. doi: 10.1007/s004410050729. [DOI] [PubMed] [Google Scholar]
- Koschak A, Reimer D, Huber I, Grabner M, Glossmann H, Engel J, Striessnig J. alpha 1D (Cav1. 3). subunits can form l-type Ca2+ channels activating at negative voltages. J Biol Chem. 2001;276:22100–22106. doi: 10.1074/jbc.M101469200. [DOI] [PubMed] [Google Scholar]
- Kotak VC, Sanes DH. Synaptically evoked prolonged depolarizations in the developing auditory system. J Neurophysiol. 1995;74:1611–1620. doi: 10.1152/jn.1995.74.4.1611. [DOI] [PubMed] [Google Scholar]
- Kros CJ. Physiology of mammalian cochlear hair cells. In: Dallos P, Popper AN, Fay RR, editors. The Cochlea. New York: Blackwell Science Inc; 1996. pp. 318–385. [Google Scholar]
- Kros CJ, Ruppersberg JP, Rüsch A. Expression of a potassium current in inner hair cells during development of hearing in mice. Nature. 1998;394:281–284. doi: 10.1038/28401. [DOI] [PubMed] [Google Scholar]
- Kros CJ, Rüsch A, Richardson GP. Mechano-electrical transducer currents in hair cells of the cultured neonatal mouse cochlea. Proc R Soc Lond B. 1992;249:185–193. doi: 10.1098/rspb.1992.0102. [DOI] [PubMed] [Google Scholar]
- Kros CJ, Rüsch A, Richardson GP, Russell IJ. Sodium and calcium currents in cultured cochlear hair cells of neonatal mice. J Physiol. 1993;473:231P. [Google Scholar]
- Lennan GW, Steinacker A, Lehouelleur J, Sans A. Ionic currents and current-clamp depolarisations of type I and type II hair cells from the developing rat utricle. Pflugers Arch. 1999;438:40–46. doi: 10.1007/s004240050877. [DOI] [PubMed] [Google Scholar]
- Lenzi D, Runyeon JW, Crum J, Ellisman MH, Roberts WM. Synaptic vesicle populations in saccular hair cells reconstructed by electron tomography. J Neurosci. 1999;19:119–132. doi: 10.1523/JNEUROSCI.19-01-00119.1999. [DOI] [PMC free article] [PubMed] [Google Scholar]
- Lin X, Chen S. Endogenously generated spontaneous spiking activities recorded from postnatal spiral ganglion neurons in vitro. Dev Brain Res. 2000;119:297–305. doi: 10.1016/s0165-3806(99)00169-8. [DOI] [PubMed] [Google Scholar]
- Lippe WR. Rhythmic spontaneous activity in the developing avian auditory system. J Neurosci. 1994;14:1486–1495. doi: 10.1523/JNEUROSCI.14-03-01486.1994. [DOI] [PMC free article] [PubMed] [Google Scholar]
- Maffei L, Galli-Resta L. Correlation in the discharges of neighboring rat retinal ganglion cells during prenatal life. Proc Natl Acad Sci U S A. 1990;87:2861–2864. doi: 10.1073/pnas.87.7.2861. [DOI] [PMC free article] [PubMed] [Google Scholar]
- Marcotti W, Johnson SL, Holley MC, Kros CJ. Developmental changes in the expression of potassium currents of embryonic, neonatal and mature mouse inner hair cells. J Physiol. 2003;548:383–400. doi: 10.1113/jphysiol.2002.034801. [DOI] [PMC free article] [PubMed] [Google Scholar]
- Masetto S, Bosica M, Correia MJ, Ottersen OP, Zucca G, Perin P, Valli P. Na+ currents in vestibular type I and type II hair cells of the embryo and adult chicken. J Neurophysiol. 2003;90:1266–1278. doi: 10.1152/jn.01157.2002. [DOI] [PubMed] [Google Scholar]
- Meister M, Wong RO, Baylor DA, Shatz CJ. Synchronous bursts of action potentials in ganglion cells of the developing mammalian retina. Science. 1991;252:939–943. doi: 10.1126/science.2035024. [DOI] [PubMed] [Google Scholar]
- Mikaelian D, Ruben RJ. Development of the hearing in the normal CBA-J mouse. Acta Otolaryngol. 1965;59:451–461. [Google Scholar]
- Mo Z-L, Davis RL. Endogenous firing patterns of murine spiral ganglion neurons. J Neurophysiol. 1997;77:1294–1305. doi: 10.1152/jn.1997.77.3.1294. [DOI] [PubMed] [Google Scholar]
- Moody WJ. Control of spontaneous activity during development. J Neurobiol. 1998;37:97–109. doi: 10.1002/(sici)1097-4695(199810)37:1<97::aid-neu8>3.0.co;2-3. [DOI] [PubMed] [Google Scholar]
- Moser T, Beutner D. Kinetics of exocytosis and endocytosis at the cochlear inner hair cell afferent synapse of the mouse. Proc Natl Acad Sci U S A. 2000;97:883–888. doi: 10.1073/pnas.97.2.883. [DOI] [PMC free article] [PubMed] [Google Scholar]
- Mostafapour SP, Cochran SL, Del Puerto NM, Rubel EW. Patterns of cell death in mouse anteroventral cochlear nucleus neurons after unilateral cochlea removal. J Comp Neurol. 2000;426:561–571. doi: 10.1002/1096-9861(20001030)426:4<561::aid-cne5>3.0.co;2-g. [DOI] [PubMed] [Google Scholar]
- Ogata N, Tatebayashi H. Kinetic analysis of two types of Na+ channels in rat dorsal root ganglia. J Physiol. 1993;466:9–37. [PMC free article] [PubMed] [Google Scholar]
- Oliver D, Plinkert P, Zenner HP, Ruppersberg JP. Sodium current expression during postnatal development of rat outer hair cells. Pflugers Arch. 1997;434:772–778. doi: 10.1007/s004240050464. [DOI] [PubMed] [Google Scholar]
- Parsons TD, Lenzi D, Almers W, Roberts WM. Calcium-triggered exocytosis and endocytosis in an isolated presynaptic cell: capacitance measurements in saccular hair cells. Neuron. 1994;13:875–883. doi: 10.1016/0896-6273(94)90253-4. [DOI] [PubMed] [Google Scholar]
- Platzer J, Engel J, Schrott-Fischer A, Stephan K, Bova S, Chen H, Zheng H, Striessnig J. Congenital deafness and sinoatrial node dysfunction in mice lacking class D L-type Ca2+ channels. Cell. 2000;102:89–97. doi: 10.1016/s0092-8674(00)00013-1. [DOI] [PubMed] [Google Scholar]
- Pujol R, Lavigne-Rebillard M, Lenoir M. Development of sensory and neural structures in the mammalian cochlea. In: Rubel EW, Popper AN, Fay RR, editors. Development of the Auditory System. New York: Blackwell Science Inc; 1998. pp. 146–192. [Google Scholar]
- Ratto GM, Robinson DW, Yan B, McNaughton PA. Development of the light response in neonatal mammalian rods. Nature. 1991;351:654–657. doi: 10.1038/351654a0. [DOI] [PubMed] [Google Scholar]
- Ricci AJ, Fettiplace R. Calcium permeation of the turtle hair cell mechanotransducer channel and its relation to the composition of endolymph. J Physiol. 1998;506:159–173. doi: 10.1111/j.1469-7793.1998.159bx.x. [DOI] [PMC free article] [PubMed] [Google Scholar]
- Romand R. Development of the cochlea. In: Romand R, editor. Development of Auditory and Vestibular Systems. New York: Blackwell Science Inc; 1983. pp. 47–88. [Google Scholar]
- Rübsamen R, Lippe WR. The development of cochlear function. In: Rubel EW, Popper AN, Fay RR, editors. Development of the Auditory System. New York: Blackwell Science Inc; 1998. pp. 193–270. [Google Scholar]
- Rüsch A, Eatock RA. Sodium currents in hair cells of the mouse utricle. In: Lewis ER, Long GR, Lyon RF, Narins PM, Steele CR, Hecht-Poinar E, editors. Diversity in Auditory Mechanics. Singapore: Blackwell Science Inc; 1997. pp. 549–555. [Google Scholar]
- Ryugo DK. The auditory nerve: peripheral innervation, cell body morphology, and central projections. In: Webster DB, Popper AN, Fay RR, editors. The Mammalian Auditory Pathway: Neuroanatomy. New York: Blackwell Science Inc; 1992. pp. 23–65. [Google Scholar]
- Sanes DH, Walsh EJ. The development of central auditory processing. In: Rubel EW, Popper AN, Fay RR, editors. Development of the Auditory System. New York: Blackwell Science Inc; 1998. pp. 271–314. [Google Scholar]
- Sangameswaran L, Fish LM, Koch BD, Rabert DK, Delgado SG, Ilnicka M, Jakeman LB, Novakovic S, Wong K, Sze P, Tzoumaka E, Stewart GR, Herman RC, Chan H, Eglen RM, Hunter JC. A novel tetrodotoxin-sensitive, voltage-gated sodium channel expressed in rat and human dorsal root ganglia. J Biol Chem. 1997;272:14805–1489. doi: 10.1074/jbc.272.23.14805. [DOI] [PubMed] [Google Scholar]
- Saunders JC, Coles RB, Gates GR. The development of auditory evoked responses in the cochlea and cochlear nuclei of the chick. Brain Res. 1973;63:59–74. doi: 10.1016/0006-8993(73)90076-0. [DOI] [PubMed] [Google Scholar]
- Schnee ME, Ricci AJ. Biophysical and pharmacological characterization of voltage-gated calcium currents in turtle auditory hair cells. J Physiol. 2003;549:697–717. doi: 10.1113/jphysiol.2002.037481. [DOI] [PMC free article] [PubMed] [Google Scholar]
- Shatz CJ, Stryker MP. Prenatal tetrodotoxin infusion blocks segregation of retinogeniculate afferents. Science. 1988;242:87–89. doi: 10.1126/science.3175636. [DOI] [PubMed] [Google Scholar]
- Shnerson A, Devigne C, Pujol R. Age-related changes in the C57BL/6J mouse cochlea. II. Ultrastructural findings. Dev Brain Res. 1982;2:77–88. doi: 10.1016/0165-3806(81)90060-2. [DOI] [PubMed] [Google Scholar]
- Shnerson A, Pujol R. Age-related changes in the C57BL/6J mouse cochlea. I. Physiological findings. Dev Brain Res. 1982;2:65–75. doi: 10.1016/0165-3806(81)90059-6. [DOI] [PubMed] [Google Scholar]
- Sobkowicz HM, Rose JE, Scott GL, Levenick CV. Distribution of synaptic ribbons in the developing organ of Corti. J Neurocytol. 1986;15:693–714. doi: 10.1007/BF01625188. [DOI] [PubMed] [Google Scholar]
- Sobkowicz HM, Rose JE, Scott GE, Slapnick SM. Ribbon synapses in the developing intact and cultured organ of Corti in the mouse. J Neurosci. 1982;2:942–957. doi: 10.1523/JNEUROSCI.02-07-00942.1982. [DOI] [PMC free article] [PubMed] [Google Scholar]
- Sokolowski BH, Stahl LM, Fuchs PA. Morphological and physiological development of vestibular hair cells in the organ-cultured otocyst of the chick. Dev Biol. 1993;155:134–146. doi: 10.1006/dbio.1993.1013. [DOI] [PubMed] [Google Scholar]
- Spitzer NC. Activity-dependent neuronal differentiation prior to synapse formation: the functions of calcium transients. J Physiol Paris. 2002;96:73–80. doi: 10.1016/s0928-4257(01)00082-1. [DOI] [PubMed] [Google Scholar]
- Sugihara I, Furukawa T. Morphological and functional aspects of two different types of hair cells in the goldfish sacculus. J Neurophysiol. 1989;62:1330–1343. doi: 10.1152/jn.1989.62.6.1330. [DOI] [PubMed] [Google Scholar]
- Tierney TS, Russell FA, Moore DR. Susceptibility of developing cochlear nucleus neurons to deafferentation-induced death abruptly ends just before the onset of hearing. J Comp Neurol. 1997;378:295–306. doi: 10.1002/(sici)1096-9861(19970210)378:2<295::aid-cne11>3.0.co;2-r. [DOI] [PubMed] [Google Scholar]
- Tucker TR, Fettiplace R. Monitoring calcium in turtle hair cells with a calcium-activated potassium channel. J Physiol. 1996;494:613–626. doi: 10.1113/jphysiol.1996.sp021519. [DOI] [PMC free article] [PubMed] [Google Scholar]
- Von Gersdorff H, Sakaba T, Berglund K, Tachibana M. Submillisecond kinetics of glutamate release from a sensory synapse. Neuron. 1998;21:1177–1188. doi: 10.1016/s0896-6273(00)80634-0. [DOI] [PubMed] [Google Scholar]
- Watt SD, Gu X, Smith RD, Spitzer NC. Specific frequencies of spontaneous Ca2+ transients upregulate GAD 67 transcripts in embryonic spinal neurons. Mol Cell Neurosci. 2000;16:376–387. doi: 10.1006/mcne.2000.0871. [DOI] [PubMed] [Google Scholar]
- Witt CM, Hu HY, Brownell WE, Bertrand D. Physiologically silent sodium channels in mammalian outer hair cells. J Neurophysiol. 1994;72:1037–1040. doi: 10.1152/jn.1994.72.2.1037. [DOI] [PubMed] [Google Scholar]
- Wu SH, Oertel D. Maturation of synapses and electrical properties of cells in the cochlear nuclei. Hear Res. 1987;30:99–110. doi: 10.1016/0378-5955(87)90187-0. [DOI] [PubMed] [Google Scholar]
- Zhang LI, Poo M. Electrical activity and development of neural circuits. Nat Neurosci. 2001;4:1207–1214. doi: 10.1038/nn753. [DOI] [PubMed] [Google Scholar]
- Zidanic M, Fuchs PA. Kinetic analysis of barium currents in chick cochlear hair cells. Biophys J. 1995;68:1323–1336. doi: 10.1016/S0006-3495(95)80305-X. [DOI] [PMC free article] [PubMed] [Google Scholar]