

Abstract
Skeletal muscle that is deficient in creatine kinase (CK−/−) exhibits accelerated glycogenolysis during contraction. Understanding this phenomenon could provide insight into the control of glycogenolysis during contraction. Therefore, glycogen breakdown was investigated in isolated extensor digitorum longus CK−/− muscle. Muscles were stimulated to produce repeated tetani for 20 s in the presence of sodium cyanide to block mitochondrial respiration. Accumulation of lactate after stimulation was similar in wild-type (WT) and CK−/− muscles, whereas accumulation of glucose-6-phosphate was twofold higher in CK−/− muscles, indicating greater glycogenolysis in CK−/− muscles. Total phosphorylase activity was decreased by almost 30 % in CK−/− muscle (P < 0.001). Phosphorylase fractional activity (−/+ 3.3 mm AMP) was similar in both groups in the basal state (about 10 %), but increased to a smaller extent in CK−/− muscles after stimulation (39 ± 4 % vs. 52 ± 4 % in WT, P < 0.05). Inorganic phosphate, the substrate for phosphorylase, increased marginally in CK−/− muscles after stimulation (basal = 25.3 ± 2.2 µmol (g dry muscle)−1; stimulated = 33.9 ± 2.3 µmol (g dry muscle)−1), but substantially in WT muscles (basal = 11.4 ± 0.7 µmol (g dry muscle)−1; stimulated = 54.2 ± 4.5 µmol (g dry muscle)−1). Kinetic studies of phosphorylase b (dephosphorylated enzyme) from muscle extracts in vitro demonstrated higher relative activities in CK−/− muscles (60–135 %) in response to low AMP concentrations (up to 50 µm) in both the basal state and after stimulation (P < 0.05), whereas no differences in activity between CK−/− and WT muscles were observed at high AMP concentrations (> 100 µm). These data indicate that allosteric activation of phosphorylase b accounts for the accelerated glycogenolysis in CK−/− muscle during contraction.
Glycogen is the storage form of glucose in cells and is the major energy substrate that is utilized during muscle contraction. The breakdown of glycogen is catalysed by glycogen phosphorylase (EC 2.4.1.1). Phosphorylase is studied for its central role in glycogenolysis and as a model for the allosteric control of enzymes. In the reaction, a glucose residue on the nonreducing end of glycogen is phosphorylated to yield glucose 1-phosphate (glucose-1-P), which is then further metabolized in the glycolytic pathway. In addition to its role in providing a substrate during contraction, phosphorylase has recently emerged as a target for therapeutic intervention in the treatment of non-insulin-dependent diabetes mellitus (Treadway et al. 2001; Oikonomakos, 2002). Therefore, it is important to understand the regulation of this enzyme in living tissue.
Phosphorylase is regulated by substrate availability (inorganic phosphate, Pi), by interconversion (phosphorylation/ dephosphorylation) and allosterically, with AMP being a key activator. The phosphorylated form of phosphorylase (phosphorylase a) does not require AMP for its activity and is considered to be the active form in vivo. Conversely, the dephosphorylated form of phosphorylase (phosphorylase b) is fully dependent on AMP for activity and is considered to be inactive in resting muscle. Previously, it was believed that the Ca2+-mediated conversion of phosphorylase b to phosphorylase a (i.e. phosphorylation of phosphorylase b) via phosphorylase b kinase was primarily responsible for the acceleration of glycogenolysis during muscle contraction (Brostrom et al. 1971). Subsequent studies stressed the importance of Pi availability in the activation of glycogenolysis during muscle contraction (Chasiotis et al. 1982, 1983), with Pi being ultimately derived from the breakdown of phosphocreatine (PCr). However, a number of studies have questioned the role of interconversion and Pi availability in the activation of glycogenolysis during muscle contraction (Ren & Hultman, 1989; Katz, 1997). Thus the mechanism underlying the regulation of phosphorylase and glycogenolysis in living muscle remains unclear.
Recent studies have demonstrated that skeletal muscle from mice lacking creatine kinase (CK) breaks down glycogen at a higher rate than control muscle during contraction (van Deursen et al. 1993, 1994). This occurs even though CK-deficient muscle has negligible increases in Pi during contraction, owing to the lack of PCr breakdown (Dahlstedt et al. 2000). The purpose of the study presented here, therefore, was to determine the mechanism underlying the accelerated glycogenolysis that occurs during contraction in skeletal muscle that is entirely deficient in CK (CK−/−). The results demonstrate that neither an increase in Pi nor conversion of phosphorylase b to phosphorylase a are responsible for the accelerated glycogenolysis that occurs in CK−/− muscle. Rather, AMP-mediated activation of phosphorylase b appears to be a major mechanism underlying this accelerated glycogenolysis.
Methods
Materials
α-D-[U-14C]glucose-1-P and uridine diphosphate (UDP)-[U-14C]glucose were from Amersham Biosciences. All other reagents and enzymes were from either Sigma or Boehringer Mannheim.
Male C57Bl/6 pure inbred mice served as wild-type (WT) controls and male CK−/− mice were generated as described previously (Steeghs et al. 1997). Animals were housed at room temperature with a 12 h:12 h light:dark cycle. Food and water were provided ad libitum. Animals were killed by rapid cervical dislocation, and thereafter the extensor digitorum longus (EDL) muscles were isolated. The local Stockholm North ethical committee approved all procedures.
Muscle mounting, solutions and stimulation
Stainless-steel hooks were tied with nylon thread to the tendons of the muscle. Muscles were then transferred to a stimulation chamber and mounted between a laboratory-built force transducer and an adjustable holder. The chamber contained a Tyrode solution of the following composition (mm): NaCl 121, KCl 5, CaCl2 1.8, NaH2PO4 0.5, MgCl2 0.4, NaHCO3 24, EDTA 0.1, glucose 5.5 and 0.1 % fetal calf serum. The solution was gassed continuously with 5 %CO2/95 % O2, which results in a pH of 7.4. After setting the optimal length with twitches, muscles were allowed to recover for 30 min, Sodium cyanide (NaCN) was added to the solution in the chamber 25 min after setting the optimal length, yielding a final concentration of 3 mm. At 30 min muscles were either frozen in liquid N2 (non-stimulated) or stimulated with current pulses (0.5 ms duration; ≈150 % of the voltage required for a maximum force response) for 330 ms at 70 Hz via platinum plate electrodes placed parallel to the fibres. Tetani were administered at intervals of 1 s−1 for 10 or 20 s. After the final tetanus, the muscle was removed from the chamber and frozen, with a delay between removal and freezing of about 5 s.
Analyses
Force signals were sampled on-line and stored in a desktop computer for subsequent analysis. The muscles were stored in liquid N2 until they were freeze-dried. The hooks were removed and the muscles were dissected free of non-muscle constituents and then powdered. The powder was thoroughly mixed and aliquoted.
For analyses of phosphorylase and glycogen synthase (GS), incorporation of label from [14C]glucose-1-P and UDP-[14C]-glucose into glycogen were determined with filter paper techniques (Thomas et al. 1968; Tan & Nuttall, 1975), as described previously (Jiao et al. 1999), with slight modifications. Briefly, muscle powder was homogenized in ice-cold buffer (200 µl (mg dry muscle)−1) containing 30 % (v/v) glycerol, 10 mm EDTA and 50 mm potassium fluoride (KF), pH 7.0, with a ground-glass homogenizer, and centrifuged at 10 000 g for 20 min at 4 °C. The supernatant was then divided into two aliquots. One aliquot was diluted (2:1) with an ice-cold buffer containing 100 mm Mes and 100 mm KF, pH 6.3, and assayed for phosphorylase in the direction of glycogen synthesis. Phosphorylase a was assayed in the absence of AMP and in the presence of 60 mm glucose-1-P (22 500 dpm µmol−1), and 6.7 (mg glycogen) ml−1 at pH 6.3 for 20 min at 30 °C. Phosphorylase was also assayed in the presence of various concentrations of AMP up to 3.3 mm. Phosphorylase b activity was considered to be the difference between the activity measured in the absence and in the presence of AMP. It might be argued that AMP-dependent activity does not solely reflect the activation of phosphorylase b, since AMP also activates phosphorylase a (Lowry et al. 1964; Aragon et al. 1980). However, at the high concentrations of glucose-1-P and glycogen used, the effect of AMP on phosphorylase a will be negligible (Lowry et al. 1964). Phosphorylase activity is expressed as micromoles of glucose from glucose-1-P incorporated into glycogen per minute per gram of dry muscle. Phosphorylase fractional activity was defined as the ratio between the activities measured in the absence of AMP and presence of 3.3 mm AMP (total phosphorylase). Endogenous AMP in the assay mixture could be estimated to be about 0.1 µm, which would not interfere with our measurements (see Results).
The other aliquot of supernatant was diluted (1:4) with an ice-cold buffer containing 50 mm Tris, 20 mm EDTA and 130 mm KF, pH 7.8, and assayed for GS at a low glucose-6-phosphate (glucose-6-P) concentration (0.17 mm) and a high glucose-6-P concentration (7.2 mm, GShigh) using 0.13 mm UDP-glucose (5000 dpm nmol−1) at pH 7.8 and 30 °C for 10 min (Guinovart et al. 1979). Activity is expressed as micromoles of glucose from UDP-glucose incorporated into glycogen per minute per gram of dry muscle. GS fractional activity (GSF) is the ratio of the activity measured in the presence of 0.17 and 7.2 mm glucose-6-P.
For analysis of glycogen, aliquots of powder were digested with hot, 1 N KOH and hydrolysed enzymatically to free glucose (Jiao et al. 1999). Glucose was then analysed enzymatically with the aid of a fluorometric technique (Lowry & Passonneau, 1972). For analysis of metabolites, ice-cold 0.5 m perchloric acid was added to aliquots of muscle powder. The extract was kept in an ice bath for 15 min while being agitated with a vortex mixer, and then centrifuged (10 000 g). The supernatant was neutralized with 2.2 m KHCO3 and then centrifuged again. The latter supernatant was assayed for PCr, creatine (Cr), ATP, Pi, glucose-6-P and lactate, with the aid of enzymatic techniques (changes in NAD[P]H) adapted for fluorometry (Lowry & Passonneau, 1972). High-performance liquid chromatography was used to analyse the extracts for inosine monophosphate (IMP), inosine, ADP and AMP (Norman et al. 1991). To adjust for variability in solid nonmuscle constituents, metabolite values were divided by the sum of PCr + Cr (total Cr) and then multiplied by the mean total Cr content for the whole material (83.8 ± 2.2 µmol (g dry muscle)−1).
Statistical analysis
Values are given as means ± s.e.m., unless indicated otherwise. Statistically significant differences (P < 0.05) were determined with the unpaired t test.
Results
Glycogenolysis, phosphorylase and metabolites
Pilot experiments were performed to determine the optimal conditions of study. Muscles were stimulated for 10 or 20 s. Peak increases in phosphorylase fractional activity (PF) were achieved at 10 s and did not change further at 20 s in both groups (data not shown). Later time points were not studied because of the likelihood of decreases in PF during further stimulation, as well as decreases in the rate of glycogenolysis (Danforth & Lyon, 1964; Piras & Staneloni, 1969; Staneloni & Piras, 1969). Twenty seconds was chosen as the time point of study to: (1) allow for sufficiently large changes in glycogenolytic intermediates to be measured, (2) ensure a high and fairly linear glycogenolytic rate (Staneloni & Piras, 1969) and (3) ensure large increases in PF. Moreover, the experiments were performed in the presence of 3 mm NaCN to inhibit mitochondrial respiration (Sahlin & Katz, 1986). During 20 s of repeated tetani, there was no change in the lactate concentration in the medium (data not shown). Thus, increases in glycogenolytic intermediates under conditions where there is no oxidative metabolism nor release of such intermediates (i.e. lactate) from the muscle reflect the extent of glycogenolysis (Harris et al. 1981; Sahlin et al. 1989). This approach is superior to direct measurements of glycogen for estimating glycogenoylsis under conditions where the absolute change in glycogen is relatively small (Harris et al. 1975; Katz & Raz, 1995; Katz, 1997).
Glycogen content in the basal state was more than twofold greater in CK−/− muscle (Table 1). Lactate contents were similar between groups in the basal state and after stimulation, suggesting similar glycolytic (post-phosphofructokinase) flux. Glucose-6-P was significantly higher in the basal state and after stimulation in CK−/− muscle. The increase in glucose-6-P during stimulation was more than twofold greater in CK−/− muscle. As discussed elsewhere (Katz et al. 1986a; Katz & Sahlin, 1990), during short-term, intense muscle contraction, the phosphorylation of extracellularly derived glucose to glucose-6-P by hexokinase is negligible. Therefore, the larger glucose-6-P accumulation (together with the similar lactate accumulation) indicates increased glycogen breakdown in CK−/− muscle during the 20 s of repeated tetani, which is consistent with earlier reports based on direct measurements of glycogen during more prolonged stimulations (van Deursen et al. 1993, 1994).
Table 1.
Glycogenolytic intermediates in EDL muscle
| Basal | Stimulated | |||
|---|---|---|---|---|
| WT | CK−/− | WT | CK−/− | |
| Glycogen | 47 ± 5 | 107 ± 9*** | n.d. | n.d. |
| Glucose-6-P | 0.4 ± 0.1 | 1.7 ± 0.3*** | 1.7 ± 0.4 | 4.5 ± 0.6** |
| Lactate | 1.8 ± 0.9 | 3.2 ± 1.4 | 27.5 ± 4.1 | 23.3 ± 2.2 |
Values are means ± s.e.m. for 5–10 muscles and are given in micromoles per gram of dry muscle, or for glycogen in micromoles of glucosyl units per gram of dry muscle. Isolated EDL muscles were incubated in oxygenated Tyrode (basal) or stimulated in oxygenated Tyrode containing 3 mm NaCN for 20s and immediately frozen in liquid nitrogen, n.d., not determined.
P < 0.01
P < 0.001 vs. WT.
Twenty seconds of stimulation in the presence of NaCN resulted in PF values that were not significantly different than those obtained in the absence of NaCN for both CK−/− and WT muscles (data not shown). Therefore, the PF results from the two series of experiments were pooled. The increase of PF during contraction was blunted in CK−/− muscle (Fig. 1). This blunting occurred despite the observation that during repeated tetani, increases in myoplasmic Ca2+, which activates phosphorylase kinase, are comparable in CK−/− and WT muscle (Dahlstedt et al. 2000; Bruton et al. 2003). Total phosphorylase activity (+3.3 mm AMP) was about 30 % lower in CK−/− muscle (175 ± 4 µmol min−1 (g dry muscle)−1, n = 31, vs. 240 ± 7 µmol min−1 (g dry muscle)−1 in WT muscle, n = 35; P < 0.001). Thus, glycogen breakdown was higher despite the fact that both total phosphorylase and PF were lower during stimulation in CK−/− muscle. Indeed, the activity of phosphorylase a in CK−/− muscle during contraction was only about half of that in WT muscle (69 vs. 125 µmol min−1 (g dry muscle)−1).
Figure 1. Phosphorylase activation is blunted in CK−/− muscle during contraction.
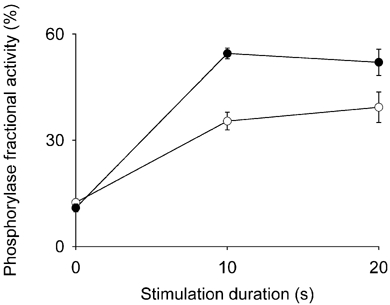
EDL muscles from CK−/− (^) and WT (•) mice were either not simulated (0 s) or stimulated with 330 ms tetani (1 s−1) for 10 or 20 s in the absence or presence of 3 mm NaCN. Since NaCN did not significantly affect the results, they have been pooled. The 10 s stimulations were performed only in the absence of NaCN. Phosphorylase was measured in the absence and presence of 3.3 mm AMP and the fractional activity is the ratio of the two. Values are means ± s.e.m. for 8–18 muscles, except for WT at 10 s, where n = 2. CK−/− values during contraction are significantly lower than for WT (P < 0.05).
The contents of high-energy phosphates and catabolites of ATP degradation are given in Table 2. As shown previously, levels of PCr did not decrease during contraction in CK−/− muscle, whereas large decreases occurred in WT muscle (cf. Dahlstedt et al. 2000). Surprisingly, the decrease in ATP was substantially smaller during stimulation in CK−/− muscle. Total muscle AMP content was significantly higher in CK−/− muscle in the basal state, but the difference was not significantly different after stimulation. The increase in IMP was stoichiometric to the decrease in ATP in both groups. The Pi content was significantly higher in CK−/− muscle in the basal state, as shown previously (Dahlstedt et al. 2000). Of particular importance is that there was little increase in Pi during stimulation in CK−/− muscle compared with a fivefold increase in WT muscle. Whereas the Pi content was higher at the onset of contraction in CK−/− muscle, it is clear that within a few seconds of contraction, when the rate of PCr degradation is highest (Hultman & Sjoholm, 1983), the Pi content rose to higher levels in WT muscle. Hence, the Pi content was probably higher during most of the 20 s contraction period in WT muscle. Thus, CK−/− muscle exhibited a higher glycogenolytic rate during contraction, despite a lower Pi content.
Table 2.
High-energy phosphate metabolism in EDL muscle
| Basal | Stimulated | |||
|---|---|---|---|---|
| WT | CK−/− | WT | CK−/− | |
| Phosphocreatine | 66.3 ± 1.4 | 44.6 ± 0.9*** | 24.4 ± 3.9 | 45.7 ± 2.3*** |
| Creatine | 17.7 ± 1.4 | 39.3 ± 1.0*** | 59.6 ± 3.9 | 38.4 ± 2.3*** |
| Pi | 11.4 ± 0.7 | 25.3 ± 2.2*** | 54.2 ± 4.5 | 33.9 ± 2.3*** |
| ATP | 22.6 ± 0.5 | 16.7 ± 0.3*** | 15.3 ± 1.4 | 14.0 ± 1.4 |
| ADP | 2.8 ± 0.1 | 3.6 ± 0.2** | 3.1 ± 0.1 | 4.0 ± 0.3* |
| AMP | 0.09 ± 0.01 | 0.16 ± 0.01** | 0.11 ± 0.02 | 0.16 ± 0.03 |
| IMP | 0.37 ± 0.10 | 0.28 ± 0.06 | 8.2 ± 1.2 | 2.5 ± 0.6** |
| Inosine | 0.09 ± 0.05 | 0.50 ± 0.18** | 0.15 ± 0.10 | 0.77 ± 0.25* |
| ATP turnover | — | — | 4.8 | 1.7 |
| Force–time integral | — | — | 483 ± 67 | 201 ± 48** |
| Mechanical efficiency | — | — | 101 | 118 |
Values are means (± s.e.m., when given) for 4–10 muscles and are given in micromoles per gram of dry muscle for metabolites. Isolated EDL muscles were incubated in oxygenated Tyrode (basal) or stimulated in oxygenated Tyrode containing 3 mm NaCN for 20s and immediately frozen in liquid nitrogen. ATP turnover during the 20s is calculated from mean values as follows: (−2ΔATP –ΔADP –Δphosphocreatine + 1.5 Δlactate)/20s and given in micromoles per second per gram of dry muscle. The force–time integral is given in (N × s)/(g dry muscle). Mechanical efficiency is calculated as mean force–time integral divided by ATP turnover and is expressed as (N × s2)/μmol.
P < 0.05
P < 0.01
P < 0.001 vs. WT.
Since neither interconversion (phosphorylation) nor substrate availability (Pi) could account for the higher glycogen breakdown in CK−/− muscle during contraction, we reasoned that activation of phosphorylase b would explain the results. A major allosteric activator of phosphorylase b is AMP. Therefore the activity of phosphorylase was measured in muscle extracts in the presence of increasing concentrations of AMP (Fig. 2). In the presence of low concentrations of AMP (≤ 100 µm), a greater proportion of phosphorylase b was activated in the CK−/− muscle both in the basal state (Fig. 2, top) and after stimulation (Fig. 2, bottom). At concentrations of up to 50 µm AMP, the relative activation of phosphorylase b was on average 60–135 % higher in CK−/−vs. WT muscle (insets of Fig. 2). At both 15 and 50 µm AMP, a greater proportion of phosphorylase b was activated after contraction vs. basal in the CK−/− muscle (15 µm AMP: basal = 4.7 ± 0.9 %, stimulated = 14.8 ± 3.7 %, P < 0.05; 50 µm AMP: basal = 34.2 ± 1.8 %, stimulated = 49.0 ± 2.9 %, P < 0.01). No significant contraction-induced changes were noted in the WT muscle extracts (Fig. 2).
Figure 2. Phosphorylase b sensitivity to AMP is increased in extracts from CK−/− muscle.
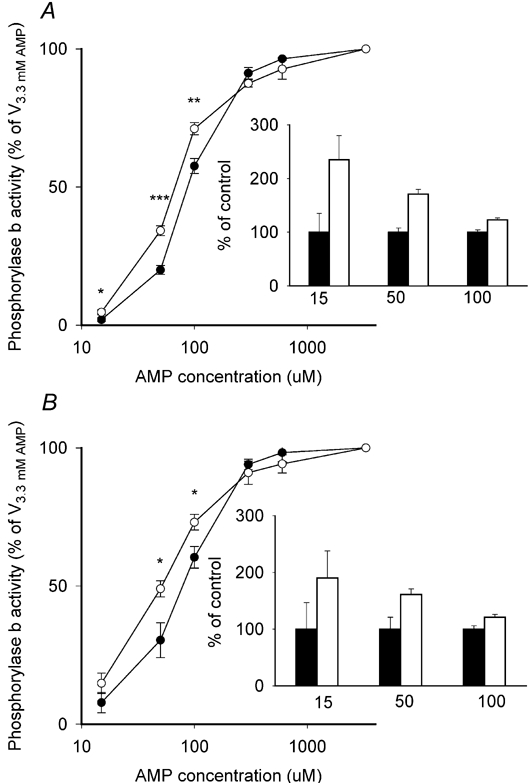
Extracts were prepared from CK−/− (^) and WT (•) EDL muscles that were either not stimulated (A) or stimulated for 20 s (B) and analysed for phosphorylase activity with various concentrations of AMP, as described in the text. Activity in the absence of AMP was set to zero and the activity measured in the presence of AMP is considered to reflect phosphorylase b activity. Insets show activities at low AMP concentrations, where mean WT values (control, black bars) are set to 100 % and CK−/− values (open bars) are given as a percentage of WT values. Values are means ± s.e.m. for 6–8 muscles. *P < 0.05; **P < 0.01; ***P < 0.001 between WT and CK−/− at a given AMP concentration.
Glycogen synthase
Because glycogen content is a function of both breakdown and synthesis, we also measured the activity of GS. GShigh in the basal state was increased by about 60 % in CK−/− muscle (6.4 ± 0.3 µmol min−1 (g dry muscle)−1 (n = 11) vs. 4.0 ± 0.4 µmol min−1 (g dry muscle)−1 in WT (n = 9), P < 0.001) and no significant changes occurred during contraction in either group (data not shown). GSF averaged 0.37 ± 0.03 (n = 9) in WT in the basal state and decreased to 0.24 ± 0.03 (n = 8) after 20 s of contraction (P < 0.01). GSF averaged 0.20 ± 0.02 (n = 11) in CK−/− in the basal state (P < 0.001vs. WT) and did not change after 20 s of contraction (0.21 ± 0.04, n = 6, P > 0.05). It is possible that the elevated GShigh activity and glucose-6-P (activates GS) content contributed to the increased glycogen level in the CK−/− muscle in the basal state. Furthermore, the glucose-6-P content after stimulation in both groups (equivalent to 0.9 and 2.3 mm for WT and CK−/−, respectively) would indicate that GS was almost fully active, assuming activation constant (Ka) values of GS for glucose-6-P of 0.2–0.5 mm (Larner & Villar-Palasi, 1971). Nevertheless, assuming a Km value of GS for UDP-glucose of 0.5 mm (Larner & Villar-Palasi, 1971) and a UDP-glucose concentration of 15 µm in stimulated mouse muscle (Passonneau et al. 1969), the rate of glycogen formation will be negligible compared with the rate of breakdown during contraction.
Force and fatigue
Initial force was slightly, but not significantly lower in CK−/− muscles (68 ± 16 N (g dry muscle)−1vs.82 ± 12 N (g dry muscle)−1 in WT). However, CK−/− muscles fatigued faster and to a greater extent during stimulation (Fig. 3). On average, force decreased to 92 ± 3 % of initial in WT and 62 ± 3 % CK−/− muscles during the second tetanus (P < 0.001) and to 56 ± 5 % and 23 ± 7 % (P < 0.01), respectively, during the last tetanus. The force-time integral in CK−/− muscle amounted to only about 40 % of that in WT muscle (Table 2). Interestingly, adjusting glycogenolysis for differences in force production ((Δglucose-6-P + 0.5Δlactate)/(force-time integral)) yields a glycogenolytic rate in CK−/− muscle that is more than twofold higher than in WT muscle. The mechanical efficiency ((force-time integral)/ATP turnover) was increased by about 20 % in CK−/− muscles during contraction (Table 2).
Figure 3. Fatigue is accelerated in CK−/− muscle during repeated contractions in the presence of cyanide.
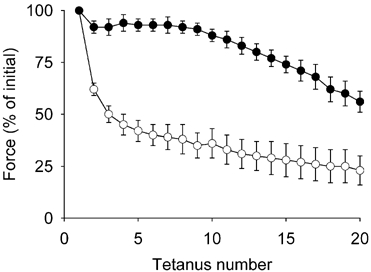
EDL muscles were stimulated with 330 ms tetani at 1 s intervals. Values are means ± s.e.m. for CK−/− (n = 6, unfilled circles) or WT (n = 8, filled circles) muscles. Other than the first tetanus, differences between groups are significant during all contractions (P < 0.01–0.001).
Discussion
An understanding of the regulation of glycogen breakdown during muscle contraction has remained elusive. The roles of increased PF and availability of Pi have been questioned in terms of explaining high glycogenolytic rates in skeletal muscle, since ischaemic, noncontracting muscle, despite elevated PF (i.e. phosphorylase a) and Pi values, exhibits negligible glycogenolysis (Ren & Hultman, 1989; Katz, 1997). If the same PF and Pi contents are obtained during muscle contraction, then the glycogenolytic rate is about 250-fold higher than during ischemia (Katz, 1997). The results of the present study demonstrate that high glycogenolytic rates occur in CK−/− muscle, despite low PF and Pi values.
Glycogenolysis and the allosteric activation of phosphorylase
How, then, can one explain the high glycogenolytic rate in CK−/− muscle? It could be argued that the higher basal glycogen content could increase glycogenolysis in CK−/− muscle during contraction, as has been suggested by some (Hespel & Richter, 1992). And, although the Km of phosphorylase for glycogen in vitro is about 2 mm (Brown & Cori, 1961), it has been suggested that the value may be higher in living muscle (Richter & Galbo, 1986). However, most studies performed during high-intensity, short-term exercise indicate that the rate of glycogenolysis is independent of the initial glycogen level (Sahlin et al. 1989; Spriet et al. 1990; Ren et al. 1990; Spencer & Katz, 1991). This speaks against the idea that the higher glycogen content in CK−/− muscle is responsible for the higher rate of glycogen breakdown under the conditions studied. Therefore, the most likely explanation for the high glycogenolytic rate in CK−/− muscle is the allosteric activation of phosphorylase.
It has been suggested that the major allosteric activator of phosphorylase during contraction is the transient increase in AMP concentration at the enzymatic site (Katz & Sahlin, 1990). The relevant species of AMP (free concentration at the enzymatic site during the contraction) can be neither measured directly nor calculated, for reasons that are discussed elsewhere (Katz et al. 1986b; Katz & Sahlin, 1990; Sahlin, 1991). However, AMP is a major determinant of flux through AMP deaminase at high rates of energy turnover (Katz et al. 1986b; Sahlin et al. 1990). Under these conditions, AMP is deaminated by AMP deaminase to IMP and NH3, and the removal of IMP is a very slow process that occurs during recovery from contraction (Meyer & Terjung, 1980). Thus, increases in IMP in frozen biopsy samples have been used as an indirect measure of AMP transients during the contraction phase (Broberg et al. 1988; Katz & Sahlin, 1990). Based on the observation of a greater decrease in ATP in CK−/− muscle during ischaemia (in ‘t Zandt et al. 1999), we predicted that the decrease in ATP and increase in IMP would be larger in CK−/− muscle during intense anaerobic contractions. We assumed that owing to the lack of CK activity, coupled with a high rate of ATP hydrolysis, the ADP transients would be elevated in CK−/− muscle. In addition, in the presence of normal levels of AK in CK−/− muscle (Ventura-Clapier et al. 1995), the excess ADP would be converted to AMP. Indeed, mathematical modelling of intracellular concentrations of free ADP and AMP during contraction indicate markedly larger increases in these nucleotides in muscles devoid of cytosolic CK (Roman et al. 2002). This would have allowed for the conclusion that the high level of glycogenolysis in CK−/− muscle could be attributed to larger AMP transients, which could activate both phosphorylases a and b. Surprisingly, the ATP depletion and IMP accumulation in CK−/− muscle after contraction were decreased to about 25 % of those seen in WT muscle. It should be noted, however, that AMP deaminase activity is decreased in the fast-twitch muscle of CK−/− mice also to about 25 % of that in WT muscle (Tullson et al. 1998). This could account for the observed decrease in AMP deamination in CK−/− muscle. Thus, larger AMP transients could explain the high glycogenolytic rate in CK−/− muscle by activating both phosphorylases a and b (Lowry et al. 1964).
A novel finding of the present study was that the phosphorylase b from CK−/− muscle exhibited an increased affinity for AMP in both the basal state and after contraction. This observation raises the possibility that the AMP-mediated activation of phosphorylase b contributes to the accelerated glycogenolysis in CK−/− muscle. Consistent with this idea is the observation that the average rate of glycogenolysis during the contraction (which amounted to 6.6 s of the 20 s) is about 120 µmol min−1 (g dry muscle)−1 (accumulation of 13 µmol of glycogenolytic intermediates (Δglucose-6-P + 0.5Δlactate from Table 1) per 6.6 s). This activity is almost twice that of the phosphorylase a activity measured in the CK−/− muscle extracts after contraction, indicating that the measured phosphorylase a activity was insufficient to account for the observed rate of glycogen breakdown. Noteworthy is that we are underestimating glycogenolysis by about 10 % (lacking other hexose phosphates and glycolytic intermediates; Katz et al. 1986c) and we are overestimating the ‘physiological’ phosphorylase activity, which is usually higher when measured in the direction of glycogen synthesis (see Danforth & Lyon, 1964). Thus the discrepancy between the measured glycogen breakdown and the measured in vitro activity of phosphorylase a is likely to be greater than we estimate.
One can question whether the free AMP concentration in the myoplasm can reach the levels required to substantially activate phosphorylase b during contraction, since it is generally believed that this concentration is very low (< 1 µm; Roman et al. 2002). Interestingly, it has been estimated by independent means that in muscles in which PCr breakdown is compromised (e.g. during fatigue), free ADP concentrations can reach values exceeding 1 mm (Westerblad et al. 1998; Roman et al. 2002). If these values are correct, then one can estimate the AMP concentration via the AK reaction ([AMP] = KAK×[ADP]2/[ATP], where KAK = 1.0; Roman et al. 2002). Assuming respective ADP and ATP values of 1 and 7 mm (see Table 2; and see Dahlstedt et al. (2001) for conversion to mm), the myoplasmic AMP concentration can be estimated to be almost 0.15 mm. This would be sufficient to activate phosphorylase b to > 50 % of Vmax.
At present, the mechanism underlying the increased affinity of phosphorylase b from CK−/− muscle for AMP in the basal state, as well as the further increase in affinity in stimulated muscle is unclear. Indeed, we also do not know whether the same mechanism is responsible for the increased affinity observed under both conditions. It is possible that alterations in free thiol availability induced by reactive oxygen species (Ji et al. 1988) or novel covalent modifications (e.g. phosphorylation, acetylation and glucosylation) are involved. This remains a matter for future investigation.
CK−/− muscles and fatigue
Previously, it was shown that EDL CK−/− muscles were slightly more fatigue resistant than WT muscles during repeated tetanic contractions (Dahlstedt et al. 2000). However, in the present study, force decreased rapidly in the second and third tetani in CK−/− muscles and thereafter continued to decrease at a slower rate, whereas the force decrease was markedly smaller in WT muscles. The difference in fatigue resistance between studies can be attributed to the NaCN-mediated inhibition of mitochondrial respiration (Bruton et al. 2003; Dzeja et al. 2003). The rapid force decline in CK−/− muscles in the present study is likely to be due to metabolic changes occurring as a consequence of the inability to rephosphorylate ADP via CK. The increased ADP concentration (see above) will reduce the rate of crossbridge cycling, while having little effect on the ability to generate force (Cooke & Pate, 1985). Thus, increased levels of ADP may explain the decreased ATP turnover and the increased mechanical efficiency in CK−/− muscles.
Conclusions
The results of this study demonstrate that the high rate of glycogen breakdown that occurs in CK−/− muscle during repeated contractions cannot be attributed to the conversion of phosphorylase b to phosphorylase a, nor to increases in the concentration of Pi. It is suggested that it is AMP-mediated activation of phosphorylase b that is primarily responsible for the accelerated glycogen breakdown. The activation can occur by increases in the concentration of the relevant species of AMP (transients at the enzymatic site during contraction) and by increasing the affinity of phosphorylase b for AMP.
Acknowledgments
This research was supported by grants from the Swedish National Center for Sports Research, the Swedish Medical Research Council (project 10842, 14402), the Novo Nordisk Foundation and funds at the Karolinska Institute.
References
- Aragon JJ, Tornheim K, Lowenstein JM. On a possible role of IMP in the regulation of phosphorylase activity in skeletal muscle. FEBS Lett. 1980;117:K56–64. doi: 10.1016/0014-5793(80)80570-9. [DOI] [PubMed] [Google Scholar]
- Broberg S, Katz A, Sahlin K. Propranolol enhances adenine nucleotide degradation in human muscle during exercise. J Appl Physiol. 1988;65:2478–2483. doi: 10.1152/jappl.1988.65.6.2478. [DOI] [PubMed] [Google Scholar]
- Brostrom CO, Hunkeler FL, Krebs EG. The relation of skeletal muscle phosphorylase kinase by Ca2+ J Biol Chem. 1971;246:1961–1967. [PubMed] [Google Scholar]
- Brown DH, Cori CF. Animal and plant polysaccharide phosphorylase. In: Boyer LM, editor. The Enzymes. Vol. 5. New York: Academic; 1961. pp. 207–228. [Google Scholar]
- Bruton JD, Dahlstedt A, Abbate F, Westerblad H. Mitochondrial function in intact skeletal muscle fibres of creatine kinase deficient mice. J Physiol. 2003 doi: 10.1113/jphysiol.2003.050732. in the Press. [DOI] [PMC free article] [PubMed] [Google Scholar]
- Chasiotis D, Sahlin K, Hultman E. Regulation of glycogenolysis in human muscle at rest and during exercise. J Appl Physiol. 1982;53:708–715. doi: 10.1152/jappl.1982.53.3.708. [DOI] [PubMed] [Google Scholar]
- Chasiotis D, Sahlin K, Hultman E. Regulation of glycogenolysis in human muscle in response to epinephrine infusion. J Appl Physiol. 1983;54:45–50. doi: 10.1152/jappl.1983.54.1.45. [DOI] [PubMed] [Google Scholar]
- Cooke R, Pate E. The effects of ADP and phosphate on the contraction of muscle fibers. Biophys J. 1985;48:789–798. doi: 10.1016/S0006-3495(85)83837-6. [DOI] [PMC free article] [PubMed] [Google Scholar]
- Dahlstedt A, Katz A, Westerblad H. Role of myoplasmic phosphate in contractile function of skeletal muscle: studies on creatine kinase-deficient mice. J Physiol. 2001;533:379–388. doi: 10.1111/j.1469-7793.2001.0379a.x. [DOI] [PMC free article] [PubMed] [Google Scholar]
- Dahlstedt AJ, Katz A, Wieringa B, Westerblad H. Is creatine kinase responsible for fatigue? Studies of isolated skeletal muscle deficient in creatine kinase. FASEB J. 2000;14:982–990. doi: 10.1096/fasebj.14.7.982. [DOI] [PubMed] [Google Scholar]
- Danforth WH, Lyon JB., Jr Glycogenolysis during tetanic contraction of isolated mouse muscles in the presence and absence of phosphorylase a. J Biol Chem. 1964;239:4047–1050. [PubMed] [Google Scholar]
- Dzeja PP, Terzic A, Wieringa B. Phosphotransfer dynamics in skeletal muscle from creatine-kinase gene-deleted mice. Mol Cell Biochem. 2003 doi: 10.1023/b:mcbi.0000009856.23646.38. in press. [DOI] [PubMed] [Google Scholar]
- Guinovart JJ, Salavert A, Massague J, Ciudad CJ, Salsas E, Itarte E. Glycogen synthase: a new activity ratio assay expressing a high sensitivity to the phosphorylation state. FEBS Lett. 1979;106:284–288. doi: 10.1016/0014-5793(79)80515-3. [DOI] [PubMed] [Google Scholar]
- Harris RC, Hultman E, Kaijser L, Nordesjö LO. The effect of circulatory occlusion on isometric exercise capacity and energy metabolism of the quadriceps muscle in man. Scand J Clin Lab Med. 1975;35:87–95. [PubMed] [Google Scholar]
- Harris RC, Hultman E, Sahlin K. Glycolytic intermediates in human muscle after isometric contraction. Pflugers Arch. 1981;389:277–282. doi: 10.1007/BF00584790. [DOI] [PubMed] [Google Scholar]
- Hespel P, Richter EA. Mechanism linking glycogen concentration and glycogenolytic rate in perfused contracting rat skeletal muscle. Biochem J. 1992;284:777–780. doi: 10.1042/bj2840777. [DOI] [PMC free article] [PubMed] [Google Scholar]
- Hultman E, Sjöholm H. Energy metabolism and contraction force of human skeletal muscle in situ during electrical stimulation. J Physiol. 1983;345:525–532. doi: 10.1113/jphysiol.1983.sp014994. [DOI] [PMC free article] [PubMed] [Google Scholar]
- In't Zandt HJ, Oerlemans F, Wieringa B, Heerschap A. Effects of ischemia on skeletal muscle energy metabolism in mice lacking creatine kinase monitored by in vivo31P nuclear magnetic resonance spectroscopy. NMR Biomed. 1999;12:327–334. doi: 10.1002/(sici)1099-1492(199910)12:6<327::aid-nbm570>3.0.co;2-9. [DOI] [PubMed] [Google Scholar]
- Ji LL, Stratman FW, Lardy HA. Enzymatic down regulation with exercise in rat skeletal muscle. Arch Biochem Biophys. 1988;263:137–149. doi: 10.1016/0003-9861(88)90622-4. [DOI] [PubMed] [Google Scholar]
- Jiao Y, Shashkina E, Shashkin P, Hansson A, Katz A. Manganese sulfate-dependent glycosylation of endogenous glycoproteins in human skeletal muscle is catalyzed by a nonglucose-6-phosphate-dependent glycogen synthase and not glycogenin. Biochim Biophys Acta. 1999;1427:1–12. doi: 10.1016/s0304-4165(98)00142-1. [DOI] [PubMed] [Google Scholar]
- Katz A. Differential responses of glycogen synthase to ischaemia and ischaemic contraction in human skeletal muscle. Exp Physiol. 1997;82:203–211. doi: 10.1113/expphysiol.1997.sp004009. [DOI] [PubMed] [Google Scholar]
- Katz A, Broberg S, Sahlin K, Wahren J. Leg glucose uptake during maximal dynamic exercise in humans. Am J Physiol. 1986a;251:E65–70. doi: 10.1152/ajpendo.1986.251.1.E65. [DOI] [PubMed] [Google Scholar]
- Katz A, Raz I. Rapid activation of glycogen synthase and protein phosphatase in human skeletal muscle after isometric contraction requires an intact circulation. Pflugers Arch. 1995;431:259–265. doi: 10.1007/BF00410199. [DOI] [PubMed] [Google Scholar]
- Katz A, Sahlin K. Role of oxygen in regulation of glycolysis and lactate production in human skeletal muscle. Exerc Sport Sci Rev. 1990;18:1–28. [PubMed] [Google Scholar]
- Katz A, Sahlin K, Henriksson J. Muscle ammonia metabolism during isometric contraction in humans. Am J Physiol. 1986b;250:C834–840. doi: 10.1152/ajpcell.1986.250.6.C834. [DOI] [PubMed] [Google Scholar]
- Katz A, Sahlin K, Henriksson J. Muscle ATP turnover rate during isometric contraction in humans. J Appl Physiol. 1986c;60:1839–1842. doi: 10.1152/jappl.1986.60.6.1839. [DOI] [PubMed] [Google Scholar]
- Larner J, & Villar-Palasi C. Glycogen synthase and its control. In: Hoerecker BL, Stadtman ER, editors. Current Topics in Cellular Regulation. New York: Academic; 1971. pp. 195–236. [Google Scholar]
- Lowry OH, Passonneau JV. A Flexible System Of Enzymatic Analysis. New York: Academic; 1972. [Google Scholar]
- Lowry OH, Schulz DW, Passonneau JV. Effects of adenylic acid on the kinetics of phosphorylase a. J Biol Chem. 1964;239:1947–1953. [PubMed] [Google Scholar]
- Meyer RA, Terjung RL. AMP deamination and IMP reamination in working skeletal muscle. Am J Physiol. 1980;239:C32–38. doi: 10.1152/ajpcell.1980.239.1.C32. [DOI] [PubMed] [Google Scholar]
- Norman B, Heden P, Jansson E. Small accumulation of inosine monophosphate (IMP) despite high lactate levels in latissimus dorsi during transplantation. Clin Physiol. 1991;11:375–384. doi: 10.1111/j.1475-097x.1991.tb00666.x. [DOI] [PubMed] [Google Scholar]
- Oikonomakos NG. Glycogen phosphorylase a molecular target for type 2 diabetes therapy. Curr Protein Pept Sci. 2002;3:561–586. doi: 10.2174/1389203023380422. [DOI] [PubMed] [Google Scholar]
- Passonneau JV, Lowry OH, Schulz DW, Brown JG. Glucose 1, 6–diphosphate formation by phosphoglucomutase in mammalian tissues. J Biol Chem. 1969;244:902–909. [PubMed] [Google Scholar]
- Piras R, Staneloni R. In vivo regulation of rat muscle glycogen synthetase activity. Biochemistry. 1969;8:2153–2160. doi: 10.1021/bi00833a056. [DOI] [PubMed] [Google Scholar]
- Ren JM, Broberg S, Sahlin K, Hultman E. Influence of reduced glycogen level on glycogenolysis during short-term stimulation in man. Acta Physiol Scand. 1990;139:467–474. doi: 10.1111/j.1748-1716.1990.tb08948.x. [DOI] [PubMed] [Google Scholar]
- Ren JM, Hultman E. Regulation of glycogenolysis in human skeletal muscle. J Appl Physiol. 1989;67:2243–2248. doi: 10.1152/jappl.1989.67.6.2243. [DOI] [PubMed] [Google Scholar]
- Richter EA, Galbo H. High glycogen levels enhance glycogen breakdown in isolated contracting skeletal muscle. J Appl Physiol. 1986;61:827–831. doi: 10.1152/jappl.1986.61.3.827. [DOI] [PubMed] [Google Scholar]
- Roman BB, Meyer RA, Wiseman RW. Phosphocreatine kinetics at the onset of contractions in skeletal muscle of MM creatine kinase knockout mice. Am J Physiol Cell Physiol. 2002;283:C1776–1783. doi: 10.1152/ajpcell.00210.2002. [DOI] [PubMed] [Google Scholar]
- Sahlin K. Control of energetic processes in contracting human skeletal muscle. Biochem Soc Trans. 1991;19:353–358. doi: 10.1042/bst0190353. [DOI] [PubMed] [Google Scholar]
- Sahlin K, Broberg S, Katz A. Glucose formation in human skeletal muscle. Influence of glycogen content. Biochem J. 1989;258:911–913. doi: 10.1042/bj2580911. [DOI] [PMC free article] [PubMed] [Google Scholar]
- Sahlin K, Gorski J, Edström L. Influence of ATP turnover and metabolite changes on IMP formation and glycolysis in rat skeletal muscle. Am J Physiol. 1990;259:C409–412. doi: 10.1152/ajpcell.1990.259.3.C409. [DOI] [PubMed] [Google Scholar]
- Sahlin K, Katz A. The content of NADH in rat skeletal muscle at rest and after cyanide poisoning. Biochem J. 1986;239:245–248. doi: 10.1042/bj2390245. [DOI] [PMC free article] [PubMed] [Google Scholar]
- Spencer MK, Katz A. Role of glycogen in control of glycolysis and IMP formation in human muscle during exercise. Am J Physiol. 1991;260:E859–864. doi: 10.1152/ajpendo.1991.260.6.E859. [DOI] [PubMed] [Google Scholar]
- Spriet LL, Berardinucci L, Marsh DR, Campbell CB, Graham TE. Glycogen content has no effect on skeletal muscle glycogenolysis during short-term tetanic stimulation. J Appl Physiol. 1990;68:1883–1888. doi: 10.1152/jappl.1990.68.5.1883. [DOI] [PubMed] [Google Scholar]
- Staneloni R, Piras R. Changes in glycogen synthetase and phosphorylase during muscular contraction. Biochem Biophys Res Commun. 1969;36:1032–1038. doi: 10.1016/0006-291x(69)90308-8. [DOI] [PubMed] [Google Scholar]
- Steeghs K, Benders A, Oerlemans F, De Haan A, Heerschap A, Ruitenbeek W, Jost C, Van Deursen J, Perryman B, Pette D, Bruckwilder M, Koudijs J, Jap P, Veerkamp J, Wieringa B. Altered Ca2+ responses in muscles with combined mitochondrial and cytosolic creatine kinase deficiencies. Cell. 1997;89:93–103. doi: 10.1016/s0092-8674(00)80186-5. [DOI] [PubMed] [Google Scholar]
- Tan AW, Nuttall FQ. Characteristics of the dephosphorylated form of phosphorylase purified from rat liver and measurement of its activity in crude liver preparations. Biochim Biophys Acta. 1975;410:45–60. doi: 10.1016/0005-2744(75)90206-5. [DOI] [PubMed] [Google Scholar]
- Thomas JA, Schlender KK, Larner J. A rapid filter paper assay for UDPglucose-glycogen glucosyltransferase, including an improved biosynthesis of UDP-14C-glucose. Anal Biochem. 1968;25:486–499. doi: 10.1016/0003-2697(68)90127-9. [DOI] [PubMed] [Google Scholar]
- Treadway JL, Mendys P, Hoover DJ. Glycogen phosphorylase inhibitors for treatment of type 2 diabetes mellitus. Expert Opin Investig Drugs. 2001;10:439–454. doi: 10.1517/13543784.10.3.439. [DOI] [PubMed] [Google Scholar]
- Tullson PC, Rush JW, Wieringa B, Terjung RL. Alterations in AMP deaminase activity and kinetics in skeletal muscle of creatine kinase-deficient mice. Am J Physiol. 1998;274:C1411–1416. doi: 10.1152/ajpcell.1998.274.5.C1411. [DOI] [PubMed] [Google Scholar]
- Van Deursen J, Heerschap A, Oerlemans F, Ruitenbeek W, Jap P, Ter Laak H, Wieringa B. Skeletal muscles of mice deficient in muscle creatine kinase lack burst activity. Cell. 1993;74:621–631. doi: 10.1016/0092-8674(93)90510-w. [DOI] [PubMed] [Google Scholar]
- Van Deursen J, Ruitenbeek W, Heerschap A, Jap P, Ter Laak H, Wieringa B. Creatine kinase (CK) in skeletal muscle energy metabolism: a study of mouse mutants with graded reduction in muscle CK expression. Proc Natl Acad Sci U S A. 1994;91:9091–9095. doi: 10.1073/pnas.91.19.9091. [DOI] [PMC free article] [PubMed] [Google Scholar]
- Ventura-Clapier R, Kuznetsov AV, D'Albis A, Van Deursen J, Wieringa B, Veksler VI. Muscle creatine kinase-deficient mice. I. Alterations in myofibrillar function. J Biol Chem. 1995;270:19914–19920. doi: 10.1074/jbc.270.34.19914. [DOI] [PubMed] [Google Scholar]
- Westerblad H, Dahlstedt AJ, Lännergren J. Mechanisms underlying reduced maximum shortening velocity during fatigue of intact, single fibres of mouse muscle. J Physiol. 1998;510:269–277. doi: 10.1111/j.1469-7793.1998.269bz.x. [DOI] [PMC free article] [PubMed] [Google Scholar]