

Abstract
Outer hair cells (OHC) serve as electromechanical amplifiers that guarantee the unique sensitivity and frequency selectivity of the mammalian cochlea. It is unknown whether the afferent fibres connected to adult OHCs are functional. If so, voltage-activated Ca2+ channels would be required for afferent synaptic transmission. In neonatal OHCs, Ca2+ channels seem to play a role in maturation since OHCs from Cav1.3-deficient (Cav1.3−/−) mice degenerate shortly after the onset of hearing. We therefore studied whole-cell Ca2+ currents in outer hair cells aged between postnatal day 1 (P1) and P8. OHCs showed a rapidly activating inward current that was 1.8 times larger with 10 mm Ba2+ as charge carrier (IBa) than with equimolar Ca2+ (ICa). IBa started activating at −50 mV with Vmax = −1.9 ± 6.9 mV, V0.5 = −15.0 ± 7.1 mV and k = 8.2± 1.1 mV (n = 34). The peak IBa showed negligible inactivation (3.6 % after 300 ms) whereas the ICa (10 mm Ca2+) was inactivated by 50.7 %. OHC IBa was reduced by 33.5 ± 10.3 % (n = 14) with 10 μm nifedipine and increased to 178.5 ± 57.8 % (n = 14) by 5 μm Bay K 8644. A dose-response curve for nifedipine revealed an IC50 of 2.3 μm, a Hill coefficient of 2.7 and a maximum block of 36 %. Average IBa density in OHCs was 24.4 ± 10.8 pA pF−1 (n = 105) which is only 38 % of the value in inner hair cells. Single cell RT-PCR revealed expression of Cav1.3 in OHCs. In OHCs from Cav1.3−/− mice, Ba2+ current density was reduced to 0.6 ± 0.5 pA pF−1 (n = 9) indicating that > 97 % of the Ca2+ channel current in OHCs flows through Cav1.3.
Outer hair cells (OHCs) are specialised sensory cells of the mammalian cochlea that are part of the cochlear amplifier. In contrast to inner hair cells (IHCs) which produce graded receptor potentials and release excitatory transmitter onto afferent fibres in response to an acoustic stimulus, OHCs respond to depolarisation by excitatory transduction currents with a shortening of their cell body (Brownell et al. 1985). It is assumed that this length change feeds energy into the cochlear partition which is the basis for the extraordinary sensitivity and frequency selectivity of the mammalian inner ear (Davis, 1983; Dallos & Corey, 1991). Although each OHC is innervated by several afferent nerve fibres (type II afferents, for review see Pujol et al. 1997; Felix, 2002) it is not known whether OHCs do have functional presynapses and if so, what purpose the afferent fibres may serve. Small L-type Ca2+ currents have been found in guinea pig OHCs (Nakagawa et al. 1991; Chen et al. 1995) but their function remains unclear. Transmitter release in IHCs is dependent on Ca2+ influx through voltage-activated Ca2+ channels (Moser & Beutner, 2000). The underlying Ca2+ currents in neonatal mouse IHCs have fast activation and deactivation kinetics, show little inactivation, activate at negative voltages (around −65 mV in 1.3 mm external Ca2+) and have L-type channel pharmacology (Platzer et al. 2000). IHC Ca2+ currents thus resemble Ca2+ currents recorded in hair cells of auditory or vestibular organs of other vertebrates including the frog sacculus (Lewis & Hudspeth, 1983; Chabbert, 1997; Armstrong & Roberts, 1998; Rodriguez-Contreras & Yamoah, 2001); the frog crista ampullaris (Martini et al. 2000; Russo et al. 2003); the turtle papilla (Art et al. 1986; Art & Fettiplace, 1987; Ricci et al. 2000; Schnee & Ricci, 2003); and the chick papilla (Fuchs et al. 1990; Zidanic & Fuchs, 1995; Kollmar et al. 1997; Spassova et al. 2001). The molecular basis of the IHC L-type Ca2+ currents was investigated using a mouse model lacking Cav1.3 α1 (or α1D) subunits (Cav1.3−/−, for nomenclature see Ertel et al. 2000). In IHCs of Cav1.3−/− mice, the average Ba2+ inward current (IBa) density was reduced to less than 8 % of the wild-type value indicating that the majority of Ca2+ channels in mouse IHCs are Cav1.3 L-type Ca2+ channels (LTCCs, Platzer et al. 2000). The same channel type had been cloned before from hair cells of chick basilar papilla (Kollmar et al. 1997). Hair cell degeneration in Cav1.3−/− mice starting in OHCs around postnatal day 14 (P14) and involving IHCs later on (Platzer et al. 2000; Glueckert et al. 2003) further suggested that Cav1.3 currents are normally present in wild-type mouse OHCs and are necessary for their differentiation and survival. We therefore investigated voltage-activated whole-cell Ca2+ currents in neonatal (P1-P8) OHCs. Single cell RT-PCR analysis and electrophysiological recordings in OHCs from Cav1.3−/− mice were employed to determine the contribution of Cav1.3 channels for OHC Ca2+ currents.
METHODS
Tissue preparation
OHCs of NMRI mice (Charles River, Sulzfeld, Germany) and Cav1.3−/− mice (Platzer et al. 2000) were studied either in organotypic cochlear cultures aged < P7 (Glowatzki et al. 1997) or following acute dissection of the organ of Corti (P1-P8). Animals were killed by decapitation and cochleae were removed according to national ethical guidelines. The organ of Corti was cut in three pieces: apical, medial and basal. Pieces were either mounted on coverslips with Cell Tak (Beckton Dickinson, Bedford, MA, USA) and maintained in culture for up to 24 h or a piece was fixed on a coverslip for immediate use by using Cell Tak or fixing it with two glass fibres. There was no difference regarding the current amplitudes or other current properties between OHCs from acutely isolated or cultured explants of the organ of Corti. For measuring IBa through Ca2+ channels, the recording chamber was constantly perfused with an extracellular solution composed of (mm): 160 Tris-(hydroxymethylamino)-methane HCl, 10 BaCl2, 5.6 glucose, 1 MgCl2, pH 7.4, 320 mosmol kg−1 (‘10 mm Ba2+ solution’). Tris+ ions were used instead of Na+ and K+ to avoid any currents through voltage-activated Na+ channels present in rat OHCs (Oliver et al. 1997) and through K+ channels. When Ca2+ was used as charge carrier, Ba2+ ions were replaced by 10 mm Ca2+ (‘10 mm Ca2+ solution’) or 1.3 mm Ca2+ (‘1.3 mm Ca2+ solution’). In the latter case osmolarity was kept at 320 mosmol kg−1 by adding Tris HCl. Ca2+- and Ba2+-free extracellular solution consisted of (mm) 2.3 MgCl2, 173 TrisCl, 5.6 glucose, 2 EGTA, pH 7.4, 320 mosmol kg−1. For some recordings of IBa in Cav1.3−/− OHCs, the extracellular solution contained (mm): 139 TEACl, 15 4-aminopyridine (4-AP), 10 BaCl2, 5.6 glucose, 1 MgCl2, 0.0005 TTX (Alomone Labs, Israel; ‘TEA solution’). Test solutions were applied by a gravity-fed application system with a micropipette placed near the OHC of interest. The application pipette was made from theta glass (Hilgenberg, Malsfeld, Germany) allowing the subsequent application of two additional solutions in one experiment. The recording chamber was mounted on an upright microscope (Zeiss Axioskop, Oberkochen, Germany) and viewed with differential interference contrast and a ×40 water immersion objective. OHCs were exposed by removing the tectorial membrane and adjacent Hensen cells with cleaning pipettes made from borosilicate glass.
Electrical recording
Membrane currents from OHCs (third and second row) were recorded at 20–22 °C by the whole-cell patch clamp technique using an AXOPATCH 200B amplifier (Axon Instruments, Union City, CA, USA). Patch pipettes with a resistance of 4–6 MΩ were made from quartz glass. Using pipettes with a lower resistance resulted in very small or nondetectable Ca2+ inward current (ICa). Pipettes were filled with (mm): 110 cesium gluconate (prepared from CsOH and gluconic acid by repetitive re-crystallisation), 20 CsCl, 10 sodium phosphocreatine, 5 Hepes, 5 EGTA, 4 MgCl2, 4 Na2ATP, 0.1 CaCl2, 0.3 GTP, pH 7.35, 305 mosmol kg−1, with a free Ca2+ concentration of 1.7 nm (calculated according to Bers et al. 1994; see also http://www.stanford.edu/~cpatton/maxc.html). Series resistance (Rs) compensation was only used when Rs was larger than 12 MΩ. Raw currents were corrected for linear leak currrents and potentials were corrected by −20 mV for liquid junction potentials (LJP) measured according to Neher (1992). In detail, LJPs were 20.1 ± 0.3 mV (n = 3) for the 10 mm Ba2+ solution; 20.2 ± 0.2 mV (n = 3) for the 10 mm Ca2+ solution; 19.9 ± 0.5 mV (n = 3) for the 1.3 mm Ca2+ solution; and 20.4 ± 0.5 mV (n = 3) for the TEA solution. Calculated LJPs (Barry, 1994) were very similar and deviated by less than 1 mV from measured LJPs. Data were acquired using the software Pulse++ 1.7 (developed by Ulrich Rexhausen, Institute of Physiology II, Tuebingen, Germany, and Klaus Bauer, Max Planck Institute for Medical Research, Heidelberg, Germany) and an ITC16 interface (Instrutech, Greatneck, NY, USA) and were stored on a Macintosh computer. Current traces were sampled at 50 kHz and filtered at 10 kHz (fast protocols) or at 5 kHz/1.3 kHz (slow protocols). Data analysis and fitting was carried out using the Igor software package (Wavemetrics, Lake Oswego, OR, USA).
Current-voltage (I-V) curves of Ba2+ currents obtained by step depolarisations were fitted according to:
| (1) |
where I is the IBa at the time the I–V was determined, V is the membrane potential, Vrev is the extrapolated reversal potential, Gmax is the maximum conductance of the cell, V0.5 is the voltage for half-maximum activation and k is the slope factor of the Boltzmann function. The percentage of inactivation of the peak current after 300 ms was calculated as:
| (2) |
with Ipeak being the current maximum of the peak current trace at t = tpeak and Itest the current determined at t = tpeak+ 300 ms. The inactivation time course of ICa in the 300 ms following the peak current was fitted with a double exponential function:
| (3) |
with A0, A1 and A2 being constants and τ1 and τ2 being the fast and slow time constants of inactivation, respectively. For the dose-response curve for nifedipine, maximum IBa was elicited every 10 s with repetitive voltage pulses from −90 to 0 mV each lasting 40 ms. When a constant current level was reached - typically 3 min after establishing the whole-cell configuration when a run-up of IBa had saturated - the respective nifedipine concentration (dissolved in DMSO; concentration of DMSO was < 0.1 %) in the 10 mm Ba2+ solution was applied for 90 s and subsequently washed out. The percentage of IBa inhibition was determined for between five and ten OHCs, averaged, and a least-squares fit to the data was performed with a Hill equation:
| (4) |
with Imax,inh being the maximum percentage of IBa inhibition, IC50 the nifedipine concentration for half-maximum inhibition, [nif] the nifedipine concentration and nH the Hill coefficient.
Single cell RT-PCR analysis
Following acute dissection of the organ of Corti (P2-5), OHCs and IHCs were identified under the microscope using morphological criteria. After removing supporting cells with cleaning pipettes, between 1 and 15 target cells were gently sucked into a borosilicate glass collection micropipette with a diameter of 6–8 μm (Langer et al. 2003). The collected cells were immediately transferred to a prechilled microcentrifuge tube containing 20 μl of RT mix consisting of: 1 × reverse transcription buffer (Invitrogen), 10 mm dithiothreitol (Invitrogen), 0.5 mm each of dATP, dCTP, dGTP, dTTP (Roche Molecular Biochemicals), 2 U μl−1 of RNase inhibitor (Peqlab), 25 μg ml−1 of Oligo-dT primer (Roche Molecular Biochemicals) and 2.5 U μl−1 of reverse transcriptase Superscript II (Invitrogen). Negative controls were also performed with perfusion solution to check for contamination by cell debris and with RT mix lacking the reverse transcriptase as control for contamination by genomic DNA. For the cDNA first strand synthesis, each microcentrifuge tube was incubated at 25 °C for 10 min followed by 60 min at 42 °C. The cDNA was stored at −20 °C until PCR analysis. PCR analysis was then performed with 9 μl of the reverse transcription product in a total volume of 50 μl of a PCR mix with final concentrations of 10 mm Tris, 50 mm KCl, 2 mm MgCl2, 200 μm dNTPs, 0.3 μm of each primer, 1–2 U Taq Polymerase (Invitrogen) through 30 cycles (30” at 94 °C; 30” at 60 °C; 45” at 72 °C). The following primers were used to amplify a 421 bp stretch of the Cav1.3 subunit from exon 24 to exon 28 (Green et al. 1996) which is not subject to alternative splicing: sense primer: 5′-CTC GGT TGT GAA GAT TCT GAG-3′; antisense primer: 5′-GAT GAC GAA GCC CAC GAA GAT-3′. A second round of 40 cycles (same program) was necessary to amplify a detectable product using 5 μl of the first PCR product as a template with the following nested primers: sense: 5′-GAG GGT CTT GCG GCC TCT CAG AGC-3′; antisense: 5′-ATC TCC ACA CGG TAG TTG TAG ACA GGA-3′. PCR products were analysed by agarose gel electrophoresis. The Cav1.3 specificity of the PCR product was confirmed by DNA sequencing (MWG Biotech, Germany).
Statistics
Data are given as means ±s.d. unless otherwise indicated. Statistical comparison of means were made by Student's two-tailed t test with P < 0.05 as the criterion for statistical significance. All current traces shown in the figures are single traces.
RESULTS
Identity of OHC inward currents
With Tris+ ions in the external solution and Cs+ ions in the pipette solution, i.e. under conditions in which most of the currents through K+ and Na+ channels were blocked, depolarising voltage steps evoked inward currents (Fig. 1A) carried by either Ca2+ or Ba2+. ICa showed little (1.3 mm Ca2+) to moderate (10 mm Ca2+) inactivation whereas IBa (10 mm Ba2+) did not inactivate (Fig. 1A and C). Peak current-voltage (I-V) curves (Fig. 1B) were bell-shaped which is typical for currents through voltage-activated Ca2+ and also Na+ channels. They showed that the maximum current amplitude was small in 1.3 mm Ca2+, increased in 10 mm Ca2+ and further increased in 10 mm Ba2+ (Fig. 1B). Changing the charge carrier from 1.3 to 10 mm Ca2+ also shifted the voltage of maximum current (Vmax) towards positive values, most probably due to a surface charge screening effect (Zhou & Jones, 1995). The I–V curve of IBa was typically shifted to negative values by about 5 mV as compared to the I–V of ICa obtained with equimolar Ca2+ (Fig. 1B) which is a known phenomenon of Ca2+ channel currents and has also been found in frog saccular hair cells (Rodriguez-Contreras & Yamoah, 2003). When the external solution contained neither Ca2+ nor Ba2+ and was supplemented with 2 mm EGTA only a tiny inward current of 4.3 pA (6.6 % of the control IBa in this OHC) could be evoked as shown by the peak current traces and I–V curves in Fig. 1C and D. Taken together these data demonstrate that neonatal OHCs possess voltage-activated Ca2+ currents.
Figure 1. Neonatal outer hair cells (OHCs) possess an inward current carried by Ca2+ or Ba2+.

A, depolarisation-evoked peak inward current traces of an OHC (postnatal day 6 (P6), holding potential: −70 mV) with 1.3 mm Ca2+, 10 mm Ca2+ or 10 mm Ba2+ in the extracellular solution. B, corresponding peak current-voltage (I–V) curves for the different charge carriers for the cell shown in A. C, IBa (10 mm Ba2+) in another OHC (P7) was greatly diminished in the absence of permeant divalent cations as shown by the current traces recorded at −10 mV and by the corresponding peak I–V curves (D). E, average IBa density ±s.d. as a function of age. The numbers of cells for a given age are indicated in the bars.
ICa and IBa were recorded in a number of cells and current densities (peak current divided by cell capacitance) were determined. Average peak current densities were 7.3 ± 2.2 pA pF−1 (n = 6) in 1.3 mm Ca2+, 13.2 ± 5.7 pA pF−1 (n = 14) in 10 mm Ca2+ and 24.4 ± 10.8 pA pF−1 (n = 105) in 10 mm Ba2+ solution, yielding a ratio of current densities of 1:1.8:3.3 for the three different ion conditions. Because IBa was 1.8 times larger than equimolar ICa we mostly used 10 mm Ba2+ for characterising the Ca2+ channel currents in OHCs. Ba2+ current densities varied with age (Fig. 1E) but did not depend on the cochlear location. The average IBa density showed a maximum of 35.6 pA pF−1 at P2, remained elevated above 19 pA pF−1 until P7 and drastically decreased to 6.7 pA pF−1 at P8. This contrasts to the developmental time course of the Ca2+ current density in IHCs which shows a pronounced maximum at P6 and only half of that maximum value at P2 (Beutner & Moser, 2001).
Activation properties of OHC Ca2+ channel currents
Figure 2 shows rapidly activating IBa evoked by depolarising voltage steps of 8 ms duration. Activation time constants were comparable to those of IHC IBa (τact≈0.3 ms for the peak current trace, Platzer et al. 2000). Figure 1B shows the corresponding I–V curve taken at the last millisecond of the depolarising voltage pulse. The current started activating at −50 mV and reached its maximum at −2.5 mV. Fitting the I–V curve with a Boltzmann function times driving force (see Methods) yielded the following parameters: V0.5 = −15.5 mV, k = 7.2 mV and reversal potential (Erev) = 50.6 mV.
Figure 2. The OHC IBa activates and deactivates rapidly.
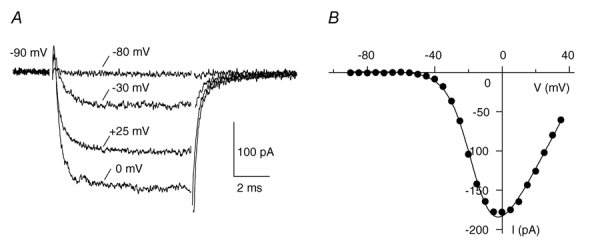
A, selected current traces evoked by depolarisations from the holding potential of −90 mV to the potentials indicated show rapid activation and deactivation of IBa in an OHC (P4). B, the I–V curve was taken at the last millisecond of the voltage pulse and fitted by a first order Boltzmann equation times the driving force, see Methods.
Parameters such as maximum inward current, Imax; cell capacitance, C; maximum current density, IBa,D; potential of maximum inward current, Vmax; potential of half-maximum activation, V0.5; and the steepness of the Boltzmann fit, k, were determined for both outer and inner hair cells. As we aimed at comparing properties of IBa in both cell types, critical experimental conditions had to be identical. To compare maximum IBa, only those recordings from IHCs were included that had been carried out with the same intracellular solution containing purified cesium gluconate (see Methods) as was used for all OHC measurements since non-purified cesium gluconate reduced IHC peak currents (data not shown). For the comparison of voltages such as V0.5 and Vmax only those IHC recordings were taken into account that had been carried out with the same intra- and extracellular solutions as used in OHC experiments in order to exclude any possible voltage difference brought about by LJPs between the bath and the local perfusion solution used in most IHC measurements (Platzer et al. 2000). For these reasons, a relatively small number of IHC data was included in Table 1 although more data exist that had been acquired under slightly different conditions (Platzer et al. 2000).
Table 1.
Biophysical properties of Ba2+ currents in neonatal outer (P1–P7) and inner (P2–P9) hair cells
| Imax | C | IBa,D | Vmax | V0.5 | k | |
|---|---|---|---|---|---|---|
| Cell type | (pA) | (pF) | (pA pF−1) | (mV) | (mV) | (mV) |
| OHC | 112.4 ± 48.7* | 4.7 ± 0.8* | 24.4 ± 10.8* | −1.9 ± 6.9 | −15.0 ± 7.1* | 8.2 ± 1.1* |
| n = 105 | n = 105 | n = 105 | n = 34 | n = 34 | n = 34 | |
| IHC | 421 ± 206 | 6.5 ± 0.4 | 64.7 ± 29.4 | −5.0 ± 4.1 | −19.6 ± 4.6 | 7.6 ± 0.7 |
| n = 5 | n = 5 | n = 5 | n = 13 | n = 13 | n = 13 |
P, postnatal day. Maximum current (Imax), cell capacitance (C), maximum current density (IBa,D), voltage of maximum current (Vmax), half-maximal voltage for activation (V0.5) and the slope for activation (k) for outer hair cells (OHC) and inner hair cells (IHC) are given as means ±s.d.V0.5 and k were determined by fitting the data to a first order Boltzmann function as described in Methods.
Statistically significant difference (P < 0.05).
The most prominent difference between OHC and IHC IBa was the difference in average maximum current amplitude between P1 and P7 (112.4 pA or 27 % in OHCs compared to 421 pA in IHCs). To compensate for different cell sizes, current densities were determined and compared between OHCs and IHC. Average IBa density of OHCs was 24.4 pA pF−1 which is only 38 % of that in IHCs. Vmax and V0.5 were slightly more positive in OHCs than in IHC (by 3.1 and 4.6 mV, respectively), and the steepness of the Boltzmann function was smaller in OHCs compared to IHCs.
Inactivation properties of OHC Ca2+ channel currents
OHC ICa showed little to moderate inactivation whereas in most cases IBa did not inactivate at all. OHCs were inhomogeneous with respect to inactivation in 10 mm Ca2+ solution: of 15 OHCs tested four cells did not show any inactivation like IBa, three cells showed weak inactivation (i.e. < 40 % reduction of the peak ICa during a 400 ms voltage pulse) and eight cells showed strong inactivation (> 40 % reduction of the peak ICa).
Figure 3 shows current responses of an OHC with strong inactivation in 10 mm Ca2+. To quantify the voltage-dependence of inactivation, the following inactivation protocol was used (Fig. 3A): starting from a holding potential of −70 mV OHCs were subjected to a conditioning pulse of 400 ms duration ranging from −70 to 30 mV before a test pulse to 0 mV was applied. Figure 3B shows that IBa did not inactivate during the conditioning pulse except at the highest potential tested (30 mV). In contrast, ICa significantly inactivated at potentials of −30 mV and above (Fig. 3C), consistent with the presence of Ca2+-dependent inactivation in OHC (but considerably less in IHC) Ca2+ channels. This is also demonstrated by the Ba2+ and Ca2+I–V curves (Fig. 3D and E) which were determined at the beginning (closed symbols) and at the end of the prepulse (open symbols). The I–V curves taken at the beginning of the prepulse further show that IBa was larger than ICa in the same cell. Figure 3F depicts the voltage dependence of IBa and ICa inactivation in terms of the normalised test pulse current (Itest/Icontrol) obtained by dividing the test current amplitudes (Itest) by the test current amplitude elicited without a depolarising prepulse (Icontrol). The normalised test pulse ICa was about 1 at prepulse potentials between −70 and −40 mV before it declined rapidly due to Ca2+-dependent inactivation. Interestingly, the normalised test pulse IBa showed an increase rather than a decrease with increasing prepulse potential. This is consistent with the known prepulse facilitation of LTCCs (Bourinet et al. 1994; Dolphin, 1996; Dai et al. 1999). When the inactivation curves were averaged for eight OHCs with strong inactivation of ICa, a slightly U-shaped inactivation curve with a minimum at 10 mV became apparent (Fig. 3G). This reflects that inactivation is maximal around Vmax where Ca2+ influx is maximal and decreases when at more depolarised potentials ICa decreases due to the reduced driving force. On average, ICa inactivated by approximately 70 % during a 400 ms depolarising prepulse to 10 mV.
Figure 3. Inactivation behaviour of IBa and ICa in OHCs.

A, pulse protocol to determine voltage-dependent inactivation. Selected voltage-activated inward current traces are shown for Ba2+ (B) and Ca2+ (C) as charge carriers. D and E, I–V curves at the beginning (closed symbols) and at the end of the conditioning pulse (open symbols) for IBa (D) and ICa (E). F, normalised inactivation curves for IBa and ICa were obtained by dividing the test pulse current (Itest) by the current amplitudes without depolarising prepulse (Icontrol), respectively. G, average normalised ICa inactivation curve as a function of membrane potential (left ordinate, Itest/Itest,max; obtained from 8 OHCs). Its slight U-shape indicates Ca2+-dependent inactivation. For comparison, the average normalised ICa peak I–V curve of the prepulse (right ordinate, Ipre/Ipre,max) is shown to illustrate the voltage of peak ICa and the subsequent decline of ICa due to the reduced driving force.
To characterise the time course of inactivation, ICa traces were fitted with exponential functions which worked well with double exponentials (Fig. 4A). Average fast time constants of inactivation ranging between 10 and 20 ms did not vary with voltage whereas average slow time constants showed large variation between 105 and 200 ms and tended to become faster with increasing depolarisations (Fig. 4B). The average ratios A1/A2 of the two exponential inactivation terms (Methods, eqn (3)) amounted to 0.36-0.60 and did not show a systematic dependence on membrane potential. Ba2+ current traces with their weak inactivation could not be fitted systematically. To compare the inactivation time courses of IBa and ICa, the percentage of inactivation of the peak current after 300 ms was determined yielding 3.6 ± 1.5 % (n = 10) for IBa and 50.7 ± 23.7 % (n = 10) for ICa (10 mm Ca2+) which compares to 11.1 ± 4.8 % (n = 18) and 21.1 ± 9.3 % (n = 5) in IHCs, respectively (Platzer et al. 2000).
Figure 4. Kinetics of Ca2+-dependent inactivation during 400 ms depolarising voltage pulses.
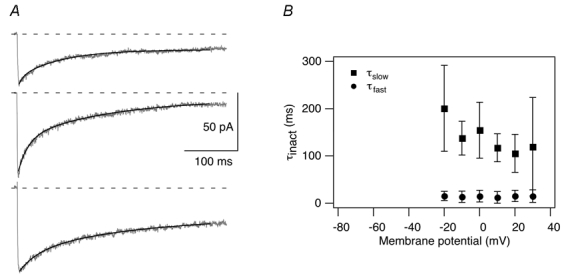
A, peak ICa traces elicited by depolarisations to +0 mV from three OHCs are shown with respective double-exponential fits (black lines). From top to bottom trace, fast time constants of inactivation were 10.4, 12.0 and 34.6 ms; slow time constants were 91.8, 130.0 and 168.0 ms, and the ratio between the amplitudes of the fast and the slow inactivation term (A1/A2, see Methods, eqn (3)) was 0.36, 0.67 and 0.36, respectively. B, average fast and slow ICa inactivation time constants ±s.d. for 8 OHCs obtained from the double-exponential fits as a function of the membrane potential.
Pharmacological properties of OHC Ca2+ channels
To determine if DHP-sensitive LTCCs contribute to neonatal OHC Ca2+ channel currents we tested their modulation by the LTCC activator Bay K 8644. Channel activation by this DHP is a highly specific property of LTCCs. Superfusion with 5 μm Bay K 8644 increased the OHC IBa as shown by the peak IBa traces and I–V curves (Fig. 5). On average, Bay K 8644 increased the peak IBa from 92.4 ± 49.5 to 158.9 ± 76.5 pA (n = 14) which corresponds to an increase to 178.5 ± 57.8 % of the control. Because in IHCs the Bay K 8644-induced increase of IBa was much larger (to 292 %, Platzer et al. 2000) we tested different lots of Bay K 8644 to rule out that the low sensitivity of OHC IBa was due to a batch of poor quality. We also tested the same agonist solution with both OHCs and IHCs but the results did not change, confirming that IHC and OHC IBa indeed have different sensitivities to Bay K 8644.
Figure 5. The LTCC agonist Bay K 8644 increases the OHC IBa.
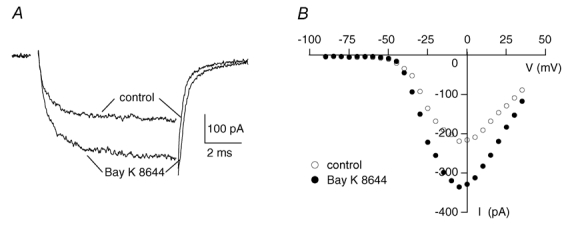
A, peak current traces before (control) and during the application of 5 μm Bay K 8644 in the bath in a 4-day-old OHC. B, corresponding I–V curves taken at the last millisecond of the voltage pulse are shown.
Next we determined the sensitivity of OHC currents to the DHP LTCC blocker nifedipine. Figure 6A and B shows peak IBa traces of an OHC before and during the application of nifedipine (10 μm) and corresponding I–V curves. Nifedipine reduced the peak current to 56.5 % of the control confirming that at least part of IBa was carried by LTCCs. After scaling the I–V curve of the nifedipine-resistant current to the control I–V curve (Fig. 6C) the two I–V curves matched remarkably. A dose-response curve for nifedipine was accomplished to define the sensitivity of the OHC IBa for nifedipine (Fig. 6D). IBa was partially blocked by nifedipine between 1 and 10 μm; higher concentrations (30 μm) did not further inhibit IBa. Fitting the data with a Hill equation (see Methods) gave a maximum inhibition of IBa of 36.3 ± 0.9 %, an IC50 of 2.3 ± 0.1 μm and a Hill coefficient of 2.7 ± 0.4. The high IC50 indicates that the LTCCs in OHCs have a low sensitivity to nifedipine. Incomplete block of IBa, however, could still result from a mixture of LTCCs and non-LTCCs. IBa inhibition at 10 μm nifedipine in OHCs (33.5 ± 10.3 % block of IBa, n = 14) was similar to IHC LTCCs (44.5 ± 11.3 % block of IBa, n = 4) but much lower than for Cav1.2 LTCCs (Koschak et al. 2001; Xu & Lipscombe, 2001). Taken together these pharmacological data suggest that Cav1.3 is also the major contributor to OHC L-type currents.
Figure 6. The LTCC antagonist nifedipine partially blocks the OHC IBa.
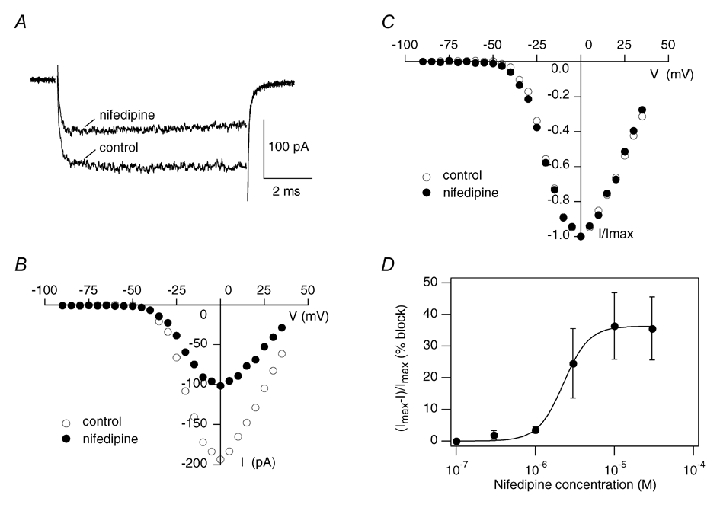
A, peak current traces before (control) and during the application of 10 μm nifedipine in the bath in an OHC (P4). B, corresponding I–V curves before and during nifedipine superfusion that were taken at the last millisecond of the voltage pulse. C, to compare I–V curves of the total current and the nifedipine-resistant current, I–V curves were scaled to their maximum. D, dose-response curve of the OHC IBa for nifedipine. For each nifedipine concentration, the percentage of IBa block was averaged for 5–10 OHCs. Fitting IBa block with a Hill equation yielded a maximum inhibition of 36.3 ± 0.9 %, an IC50 of 2.3 ± 0.1 μm and a Hill coefficient of 2.7 ± 0.4.
Molecular identity of OHC Ca2+ channels
Single-cell RT-PCR experiments were performed to confirm that Cav1.3 α1 transcripts are present in OHCs. A 421 bp Cav1.3 α1-specific PCR product comprising a region not subject to alternative splicing (see Methods) was amplified (Fig. 7) in three independent samples of RNA harvested from IHCs or OHCs at P4.
Figure 7. Detection of Cav1.3 α1 subunit transcripts by single-cell RT-PCR.
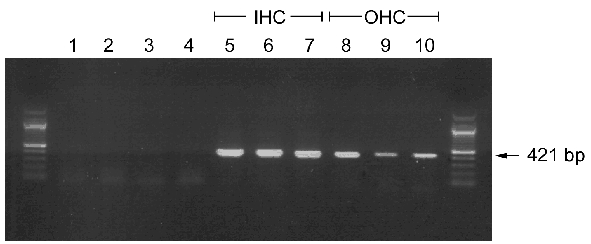
RNA from IHCs, OHCs or epithelial (Hensen) cells was collected and subjected to RT-PCR as described in Methods. Three separate RNA samples obtained from pooled IHCs (6–7 cells per pool) or OHCs (21–35 cells per pool) were analysed. Lanes 1–4: control samples; lane 1: no template control; lane 2: Hepes-Hanks’ solution without cells; lane 3: OHC sample processed without reverse transcriptase; lane 4: epithelial (Hensen) cells; lanes 5–7: OHC preparations; lanes 8–10: IHC preparations.
To directly quantify the contribution of Cav 1.3 for total Ca2+ channel current in OHCs electrophysiological recordings were performed in Cav1.3−/− mice. In Cav1.3−/− OHCs, the Ba2+ current density was dramatically reduced (Fig. 8) as shown by the peak IBa trace (Fig. 8A, control) and the corresponding I–V curve (Fig. 8B, control). The large upward transients in the current traces that were prominent prior to the small inward currents in Cav1.3−/− OHCs had a linear I–V curve with a reversal potential of approximately −90 mV and a conductance of about 0.6 nS and were unaffected by the K+ channel blockers TEA and 4-AP and the Na+ channel blocker TTX (data not shown). They might reflect outward currents carried by Cs+ or Na+ ions through a small fraction of the transduction channels, since it has been shown that 5–10 % of all transduction channels are open without mechanical stimulation (Geleoc et al. 1997). However, at present we do not understand why this outward current is transient and vanishes within the first 2 ms of the depolarising pulse.
Figure 8. The LTCC current is absent in OHCs from Cav1.3−/− mice.
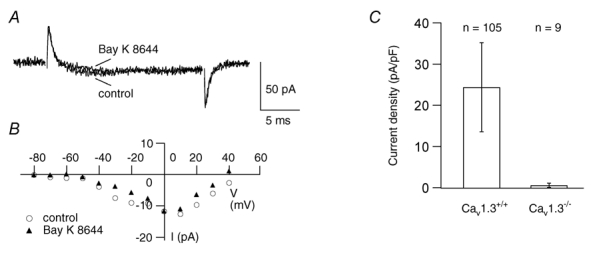
A, Ba2+ inward current traces at 0 mV in a 2-day-old Cav1.3−/− OHC in the TEA solution before and during superfusion with 5 μm Bay K 8644. B, corresponding I–V curves taken at the last millisecond of the voltage pulse show that the maximum inward control current was as small as −13 pA and was not increased by Bay K 8644. C, mean IBa densities ±s.d. for Cav1.3+/+ and Cav1.3−/− mice obtained from the number of cells indicated.
The largest inward current of all Cav1.3−/− OHCs tested had a peak amplitude of −13 pA that could not be increased by Bay K 8644 (Fig. 8A and B), and some OHCs showed no inward current at all. Average peak IBa was 2.8 ± 3.2 pA under control conditions and 3.0 ± 3.9 pA in the presence of 5 μm Bay K 8644 (n = 9). Cell capacitance as a measure of cell size was not affected by gene disruption (wild-type: 4.7 ± 0.8 pA pF−1, n = 105; Cav1.3−/−: 4.5 ± 1.1 pA pF−1, n = 9). The average current density was reduced from 24.4 ± 10.8 pA pF−1 (n = 105) in wild-type OHCs to 0.6 ± 0.5 pA pF−1 (n = 9) in Cav1.3−/− OHCs (Fig. 8C) leading us to conclude that more than 97 % of IBa in OHCs flows through Cav1.3 LTCCs.
DISCUSSION
Here we show the first analysis of Ca2+ currents in mouse OHCs aged from P1-P8. Neonatal OHCs seem to be the only mammalian cell type known so far that exclusively contains Cav1.3 Ca2+ channels. Cav1.3 channels are expressed in a variety of neurons, neuroendocrine, endocrine, cardiac pacemaker and sensory cells (Hell et al. 1993; Ihara et al. 1995; Platzer et al. 2000; Zhang et al. 2002; Mangoni et al. 2003). Their role for (neuro-)secretion and neurotransmission may be widely underestimated because no specific blocker exists that can differentiate between Cav1.3 and the widely distributed Cav1.2 (α1C) LTTCs. Interpretation of data regarding the role of different Ca2+ channel classes in synaptic transmission by sequentially blocking them with known Ca2+ channel blockers often disregards the fact that Cav1.3 channels are incompletely blocked by micromolar concentrations of LTCC blockers such as nifedipine and nimodipine. As a result, Cav1.3 currents may be misinterpreted as being non-LTCCs. Neonatal OHCs therefore seem to be a good model cell to study native Cav1.3 currents in isolation. Cav1.3 channels have been expressed in heterologous systems only recently (Scholze et al. 2001; Koschak et al. 2001; Xu & Lipscombe, 2001; Bell et al. 2001; Safa et al. 2001). The specific properties of native OHC Ca2+ channel currents show many similarities to currents from Xu & Lipscombe (2001) such as negative voltage of activation and lack of IBa inactivation. The differences in current properties of heterologously expressed Cav1.3 currents could be caused by different splice variants of the α1 subunit used in those studies.
Cav1.3-mediated currents in OHCs show many similarities with the Ca2+ currents in IHCs as well as with Ca2+ currents in auditory hair cells of chick (Zidanic & Fuchs, 1995) and turtle (Schnee & Ricci, 2003). With respect to hair cells of the mouse, the ratio IBa/ICa, the fast kinetics of activation, the lack of rapid inactivation of Ba2+ currents, and the partial block by nifedipine were similar in OHCs and IHCs. However, many differences between Ca2+ channel currents in the two hair cell types were found such as Vmax, V0.5 and k of IBa, the kinetics of inactivation of ICa and IBa, and the stimulation by Bay K 8644. Interestingly, Cav1.3 currents in most OHCs exhibited Ca2+-dependent inactivation similar to that in turtle auditory hair cells (Schnee & Ricci, 2003) whereas Ca2+-dependent inactivation was less pronounced in mouse IHCs (Platzer et al. 2000) and in guinea pig OHCs (Nakagawa et al. 1991; Chen et al. 1995). We have previously shown that recombinant Cav1.3 channels, like Cav1.3 in OHCs, also inactivate in a Ca2+-dependent manner (Koschak et al. 2001). Ca2+-dependent inactivation is largely determined by structural motifs in the C-terminal tail and involves calmodulin binding (Budde et al. 2002). Both rat or human C-terminal splice variants (Hui et al. 1991; Williams et al. 1992) identified so far contain the structural motifs required for Ca2+-dependent inactivation. It remains to be determined whether yet unknown C-terminal splice variants, accessory subunits (Dai et al. 1999) or other protein-protein interactions prevent Ca2+-dependent inactivation of Cav1.3 in IHCs. The recent findings on the modulation of heterologously expressed Cav1.3 channels by the presynaptic protein syntaxin that both increased the peak current density and slowed inactivation point in this direction (Song et al. 2003). The observed differences in current properties of inner and outer hair cells may result from: (i) IHC- and OHC-specific splicing of the α1 subunit, (ii) the association with different subtypes or splice variants of the auxiliary subunits β and α2δ or (iii) the interaction with different presynaptic molecules or scaffolding proteins. Single cell RT-PCR could clarify the prevalence of different Cav1.3 splice variants or different types of auxiliary subunits in IHCs and OHCs.
A major difference between outer and inner hair cells was the threefold lower IBa density in OHCs compared to IHCs. Before the onset of hearing around P12 (Rybak et al. 1992) IHCs already release transmitter onto afferent fibres in a Ca2+-dependent fashion (Beutner & Moser, 2001; Glowatzki & Fuchs, 2002). At this age, however, IHCs are not yet able to respond to an acoustic stimulus with a graded receptor potential but show spontaneous slow oscillations of the membrane potential (Kros et al. 1998, Marcotti et al. 1999, 2003) that depend on extracellular Ca2+. Ca2+-driven action potentials are a widespread phenomenon in the developing nervous system leading to the refinement of neuronal connectivity (for review see Mennerick & Zorumski, 2000; Spitzer, 2002). It is assumed that the periodic release of glutamate from the IHC caused by slow Ca2+ action potentials leads to refinement and maturation of synaptic connections in the auditory periphery and in the central auditory pathway. Oscillations of the membrane potential resembling the Ca2+ action potentials in IHCs have also been observed in OHCs but only after mild current injection (at least 40 pA, Marcotti & Kros, 1999). The threefold lower IBa density might be the reason for the lack of spontaneous Ca2+ action potentials in neonatal OHCs in vitro. It is not known, however, whether depolarising mechanisms exist in vivo that could drive the cell to the oscillation threshold. If Ca2+ action potentials indeed occurred in OHCs they could be involved in the formation of synaptic connections. Afferent and efferent innervation of OHCs are both built up during the first and second postnatal week, including: (i) innervation by collaterals of type I afferents at P0, (ii) innervation by type II afferents, (iii) retraction of type I afferent collaterals around P6 (Pujol et al. 1985, 1997) and (iv) efferent innervation by the medial olivocochlear bundle between P3 and P10 (Sobkowicz, 1992).
A general function of the Ca2+ channels in neonatal OHCs that has to be considered is their possible involvement in OHC-specific gene expression. Ca2+ currents, especially those through LTCCs, are involved in the regulation of gene expression in different cells and tissues (for review see Finkbeiner & Greenberg, 1998; Bradley & Finkbeiner, 2002). This could explain why the total lack of Ca2+ influx in Cav1.3−/− mice prevents OHCs from adopting an adult phenotype. The following degeneration of OHCs observed in Cav1.3−/− mice is probably the answer of the system to immature, non-functional OHCs around the time when hearing starts in wild-type animals.
The question remains if adult OHCs do have functional Ca2+ channels and, if so, for what purpose. We have shown that between P7 and P8, around the time when the OHC begins to adopt its mature phenotype by expressing the fast K+ current IK,n (Marcotti & Kros, 1999) and the motor protein prestin (Weber et al. 2002), IBa density drops by 65 %. The presence of small, noninactivating L-type Ca2+ currents in guinea pig OHCs (Nakagawa et al. 1991; Chen et al. 1995) suggests that LTCCs are also of importance in mature OHCs of the mouse.
Acknowledgments
We wish to thank Sylvia Kasperek for excellent technical assistence, Uli Rexhausen for his support with data acquisition and analysis, and Peter Ruppersberg and Hans-Peter Zenner for their continuous support. This work was supported by DFG grants En 294/2-1,2 (to J.E.), the FWF (P-14820), OeNB and EC-grant HPRN-CT-2000-00082 (to J.S.).
REFERENCES
- Armstrong CE, Roberts WM. Electrical properties of frog saccular hair cells: distortion by enzymatic dissociation. J Neurosci. 1998;18:2962–2973. doi: 10.1523/JNEUROSCI.18-08-02962.1998. [DOI] [PMC free article] [PubMed] [Google Scholar]
- Art JJ, Crawford AC, Fettiplace R. Electrical resonance and membrane currents in turtle cochlear hair cells. Hear Res. 1986;22:31–36. doi: 10.1016/0378-5955(86)90073-0. [DOI] [PubMed] [Google Scholar]
- Art JJ, Fettiplace R. Variation of membrane properties in hair cells isolated from the turtle cochlea. J Physiol. 1987;385:207–242. doi: 10.1113/jphysiol.1987.sp016492. [DOI] [PMC free article] [PubMed] [Google Scholar]
- Barry PH. JPCalc, a software package for calculating liquid junction potential corrections in patch-clamp, intracellular, epithelial and bilayer measurements and for correcting junction potential measurements. J Neurosci Methods. 1994;1:107–116. doi: 10.1016/0165-0270(94)90031-0. [DOI] [PubMed] [Google Scholar]
- Bell DC, Butcher AJ, Berrow NS, Page KM, Brust PF, Nesterova A, Stauderman KA, Seabrook GR, Nurnberg B, Dolphin AC. Biophysical properties, pharmacology, and modulation of human, neuronal L-type (α1D, Cav1. 3) voltage-dependent calcium currents. J Neurophysiol. 2001;85:816–827. doi: 10.1152/jn.2001.85.2.816. [DOI] [PubMed] [Google Scholar]
- Bers D, Patton C, Nuccitelli R. A practical guide to the preparation of Ca2+ buffers. Methods Cell Biol. 1994;40:3–29. doi: 10.1016/s0091-679x(08)61108-5. [DOI] [PubMed] [Google Scholar]
- Beutner D, Moser T. The presynaptic function of mouse cochlear inner hair cells during development of hearing. J Neurosci. 2001;21:4593–4599. doi: 10.1523/JNEUROSCI.21-13-04593.2001. [DOI] [PMC free article] [PubMed] [Google Scholar]
- Bourinet E, Charnet P, Tomlinson WJ, Stea A, Snutch TP, Nargeot J. Voltage-dependent facilitation of a neuronal alpha 1C L-type calcium channel. EMBO J. 1994;13:5032–5039. doi: 10.1002/j.1460-2075.1994.tb06832.x. [DOI] [PMC free article] [PubMed] [Google Scholar]
- Bradley J, Finkbeiner S. An evaluation of specificity in activity-dependent gene expression in neurons. Prog Neurobiol. 2002;67:469–477. doi: 10.1016/s0301-0082(02)00047-3. [DOI] [PubMed] [Google Scholar]
- Brownell WE, Bader CR, Bertrand D, de Ribaupierre Y. Evoked mechanical responses of isolated cochlear outer hair cells. Science. 1985;227:194–196. doi: 10.1126/science.3966153. [DOI] [PubMed] [Google Scholar]
- Budde T, Meuth S, Pape HC. Calcium-dependent inactivation of neuronal calcium channels. Nat Rev Neurosci. 2002;3:873–883. doi: 10.1038/nrn959. [DOI] [PubMed] [Google Scholar]
- Chabbert CH. Heterogeneity of hair cells in the bullfrog sacculus. Pflugers Arch. 1997;435:82–90. doi: 10.1007/s004240050486. [DOI] [PubMed] [Google Scholar]
- Chen C, Nenov A, Norris CH, Bobbin RP. ATP modulation of L-type calcium channel currents in guinea pig outer hair cells. Hear Res. 1995;86:25–33. doi: 10.1016/0378-5955(95)00050-e. [DOI] [PubMed] [Google Scholar]
- Dai S, Klugbauer N, Zong X, Seisenberger C, Hofmann F. The role of subunit composition on prepulse facilitation of the cardiac L-type calcium channel. FEBS Lett. 1999;442:70–74. doi: 10.1016/s0014-5793(98)01632-9. [DOI] [PubMed] [Google Scholar]
- Dallos P, Corey ME. The role of outer hair cell motility in cochlear tuning. Curr Opin Neurobiol. 1991;1:215–220. doi: 10.1016/0959-4388(91)90081-h. [DOI] [PubMed] [Google Scholar]
- Davis H. An active process in cochlear mechanics. Hear Res. 1983;9:79–90. doi: 10.1016/0378-5955(83)90136-3. [DOI] [PubMed] [Google Scholar]
- Dolphin AC. Facilitation of Ca2+ current in excitable cells. Trends Neurosci. 1996;19:35–43. doi: 10.1016/0166-2236(96)81865-0. [DOI] [PubMed] [Google Scholar]
- Ertel EA, Campbell KP, Harpold MM, Hofmann F, Mori Y, Perez-Reyes E, Schwartz A, Snutch TP, Tanabe T, Birnbaumer L, Tsien RW, Catterall WA. Nomenclature of voltage-gated calcium channels. Neuron. 2000;25:533–535. doi: 10.1016/s0896-6273(00)81057-0. [DOI] [PubMed] [Google Scholar]
- Felix H. Anatomical differences in the peripheral auditory system of mammals and man. A mini review. Adv Otorhinolaryngol. 2002;59:1–10. doi: 10.1159/000059235. [DOI] [PubMed] [Google Scholar]
- Finkbeiner S, Greenberg ME. Ca2+ channel-regulated neuronal gene expression. J Neurobiol. 1998;37:171–189. [PubMed] [Google Scholar]
- Fuchs PA, Evans MG, Murrow BW. Calcium currents in hair cells isolated from the cochlea of the chick. J Physiol. 1990;429:553–568. doi: 10.1113/jphysiol.1990.sp018272. [DOI] [PMC free article] [PubMed] [Google Scholar]
- Geleoc GS, Lennan GW, Richardson GP, Kros CJ. A quantitative comparison of mechanoelectrical transduction in vestibular and auditory hair cells of neonatal mice. Proc R Soc Lond B Biol Sci. 1997;264:611–621. doi: 10.1098/rspb.1997.0087. [DOI] [PMC free article] [PubMed] [Google Scholar]
- Glowatzki E, Fuchs PA. Transmitter release at the hair cell ribbon synapse. Nat Neurosci. 2002;5:147–154. doi: 10.1038/nn796. [DOI] [PubMed] [Google Scholar]
- Glowatzki E, Ruppersberg JP, Zenner HP, Rusch A. Mechanically and ATP-induced currents of mouse outer hair cells are independent and differentially blocked by d-tubocurarine. Neuropharmacology. 1997;36:1269–1275. doi: 10.1016/s0028-3908(97)00108-1. [DOI] [PubMed] [Google Scholar]
- Glueckert R, Wietzorrek G, Kammen-Jolly K, Scholtz A, Stephan K, Striessnig J, Schrott-Fischer A. Role of class D L-type Ca2+ channels for cochlear morphology. Hear Res. 2003;178:95–105. doi: 10.1016/s0378-5955(03)00054-6. [DOI] [PubMed] [Google Scholar]
- Green GE, Khan KM, Beisel DW, Drescher MJ, Hatfield JS, Drescher DG. Calcium channel subunits in the mouse cochlea. J Neurochem. 1996;67:37–45. doi: 10.1046/j.1471-4159.1996.67010037.x. [DOI] [PubMed] [Google Scholar]
- Hell JW, Westenbroek RE, Warner C, Ahlijanian MK, Prystay W, Gilbert MM, Snutch TP, Catterall WA. Identification and differential subcellular localization of the neuronal class C and class D L-type calcium channel alpha 1 subunits. J Cell Biol. 1993;123:949–962. doi: 10.1083/jcb.123.4.949. [DOI] [PMC free article] [PubMed] [Google Scholar]
- Hui A, Ellinor PT, Krizanova O, Wang JJ, Diebold RJ, Schwartz A. Molecular cloning of multiple subtypes of a novel rat brain isoform of the alpha 1 subunit of the voltage-dependent calcium channel. Neuron. 1991;7:35–44. doi: 10.1016/0896-6273(91)90072-8. [DOI] [PubMed] [Google Scholar]
- Ihara Y, Yamada Y, Fujii Y, Gonoi T, Yano H, Yasuda K, Inagaki N, Seino Y, Seino S. Molecular diversity and functional characterization of voltage-dependent calcium channels (CACN4) expressed in pancreatic beta-cells. Mol Endocrinol. 1995;9:121–130. doi: 10.1210/mend.9.1.7760845. [DOI] [PubMed] [Google Scholar]
- Kollmar R, Montgomery LG, Fak J, Henry LJ, Hudspeth AJ. Predominance of the α1D subunit in L-type voltage-gated Ca2+ channels of hair cells in the chicken's cochlea. Proc Natl Acad Sci U S A. 1997;94:14883–14888. doi: 10.1073/pnas.94.26.14883. [DOI] [PMC free article] [PubMed] [Google Scholar]
- Koschak A, Reimer D, Huber I, Grabner M, Glossmann H, Engel J, Striessnig J. α1D (Cav1. 3) subunits can form L-type Ca2+ channels activating at negative voltages. J Biol Chem. 2001;276:22100–22106. doi: 10.1074/jbc.M101469200. [DOI] [PubMed] [Google Scholar]
- Kros CJ, Ruppersberg JP, Rusch A. Expression of a potassium current in inner hair cells during development of hearing in mice. Nature. 1998;394:281–284. doi: 10.1038/28401. [DOI] [PubMed] [Google Scholar]
- Langer P, Grunder S, Rusch A. Expression of Ca2+-activated BK channel mRNA and its splice variants in the rat cochlea. J Comp Neurol. 2003;455:198–209. doi: 10.1002/cne.10471. [DOI] [PubMed] [Google Scholar]
- Lewis RS, Hudspeth AJ. Voltage- and ion-dependent conductances in solitary vertebrate hair cells. Nature. 1983;304:538–541. doi: 10.1038/304538a0. [DOI] [PubMed] [Google Scholar]
- Mangoni ME, Couette B, Bourinet E, Platzer J, Reimer D, Striessnig J, Nargeot J. Functional role of L-type Cav1. 3 Ca2+ channels in cardiac pacemaker activity. Proc Natl Acad Sci U S A. 2003;100:5543–5548. doi: 10.1073/pnas.0935295100. [DOI] [PMC free article] [PubMed] [Google Scholar]
- Marcotti W, Geleoc GS, Lennan GW, Kros CJ. Transient expression of an inwardly rectifying potassium conductance in developing inner and outer hair cells along the mouse cochlea. Pflugers Arch. 1999;439:113–122. doi: 10.1007/s004249900157. [DOI] [PubMed] [Google Scholar]
- Marcotti W, Johnson SL, Holley MC, Kros CJ. Developmental changes in the expression of potassium currents of embryonic, neonatal and mature mouse inner hair cells. J Physiol. 2003;548:383–400. doi: 10.1113/jphysiol.2002.034801. [DOI] [PMC free article] [PubMed] [Google Scholar]
- Marcotti W, Kros CJ. Developmental expression of the potassium current IK,n contributes to maturation of mouse outer hair cells. J Physiol. 1999;520:653–660. doi: 10.1111/j.1469-7793.1999.00653.x. [DOI] [PMC free article] [PubMed] [Google Scholar]
- Martini M, Rossi ML, Rubbini G, Rispoli G. Calcium currents in hair cells isolated from semicircular canals of the frog. Biophys J. 2000;78:1240–1254. doi: 10.1016/S0006-3495(00)76681-1. [DOI] [PMC free article] [PubMed] [Google Scholar]
- Mennerick S, Zorumski CF. Neural activity and survival in the developing nervous system. Mol Neurobiol. 2000;22:41–54. doi: 10.1385/MN:22:1-3:041. [DOI] [PubMed] [Google Scholar]
- Moser T, Beutner D. Kinetics of exocytosis and endocytosis at the cochlear inner hair cell afferent synapse of the mouse. Proc Natl Acad Sci U S A. 2000;97:883–888. doi: 10.1073/pnas.97.2.883. [DOI] [PMC free article] [PubMed] [Google Scholar]
- Nakagawa T, Kakehata S, Akaike N, Komune S, Takasaka T, Uemura T. Calcium channel in isolated outer hair cells of guinea pig cochlea. Neurosci Lett. 1991;125:81–84. doi: 10.1016/0304-3940(91)90136-h. [DOI] [PubMed] [Google Scholar]
- Neher E. Correction for liquid junction potentials in patch clamp experiments. Methods Enzymol. 1992;207:123–131. doi: 10.1016/0076-6879(92)07008-c. [DOI] [PubMed] [Google Scholar]
- Oliver D, Plinkert P, Zenner HP, Ruppersberg JP. Sodium current expression during postnatal development of rat outer hair cells. Pflugers Arch. 1997;434:772–778. doi: 10.1007/s004240050464. [DOI] [PubMed] [Google Scholar]
- Platzer J, Engel J, Schrott-Fischer A, Stephan K, Bova S, Chen H, Zheng H, Striessnig J. Congenital deafness and sinoatrial node dysfunction in mice lacking class D L-type Ca2+ channels. Cell. 2000;102:89–97. doi: 10.1016/s0092-8674(00)00013-1. [DOI] [PubMed] [Google Scholar]
- Pujol R, Lavigne-Rebillard M, Lenoir M. Development of sensory and neural structures in the mammalian cochlea. In: Rubel EW, Popper AN, Fay RR, editors. Development of the Auditory System, Springer Handbook of Auditory Research. XII. New York: Blackwell Science Inc; 1997. pp. 156–192. [Google Scholar]
- Pujol R, Lenoir M, Robertson D, Eybalin M, Johnstone BM. Kainic acid selectively alters auditory dendrites connected with cochlear inner hair cells. Hear Res. 1985;18:145–151. doi: 10.1016/0378-5955(85)90006-1. [DOI] [PubMed] [Google Scholar]
- Ricci AJ, Gray-Keller M, Fettiplace R. Tonotopic variations of calcium signalling in turtle auditory hair cells. J Physiol. 2000;524:423–436. doi: 10.1111/j.1469-7793.2000.00423.x. [DOI] [PMC free article] [PubMed] [Google Scholar]
- Rodriguez-Contreras A, Yamoah EN. Direct measurement of single-channel Ca2+ currents in bullfrog hair cells reveals two distinct channel subtypes. J Physiol. 2001;534:669–689. doi: 10.1111/j.1469-7793.2001.00669.x. [DOI] [PMC free article] [PubMed] [Google Scholar]
- Rodriguez-Contreras A, Yamoah EN. Effects of permeant ion concentrations on the gating of L-type Ca2+ channels in hair cells. Biophys J. 2003;84:3457–3469. doi: 10.1016/S0006-3495(03)70066-6. [DOI] [PMC free article] [PubMed] [Google Scholar]
- Russo G, Lelli A, Gioglio L, Prigioni I. Nature and expression of dihydropyridine-sensitive and -insensitive calcium currents in hair cells of frog semicircular canals. Pflugers Arch. 2003;44:189–197. doi: 10.1007/s00424-003-1050-y. [DOI] [PubMed] [Google Scholar]
- Rybak LP, Whitworth C, Scott V. Development of endocochlear potential and compound action potential in the rat. Hear Res. 1992;59:189–194. doi: 10.1016/0378-5955(92)90115-4. [DOI] [PubMed] [Google Scholar]
- Safa P, Boulter J, Hales TG. Functional properties of Cav 1. 3 (α1D) L-type Ca2+ channel splice variants expressed by rat brain and neuroendocrine GH3 cells. J Biol Chem. 2001;276:38727–38737. doi: 10.1074/jbc.M103724200. [DOI] [PubMed] [Google Scholar]
- Schnee ME, Ricci AJ. Biophysical and pharmacological characterization of voltage-gated calcium currents in turtle auditory hair cells. J Physiol. 2003;549:697–717. doi: 10.1113/jphysiol.2002.037481. [DOI] [PMC free article] [PubMed] [Google Scholar]
- Scholze A, Plant TD, Dolphin AC, Nurnberg B. Functional expression and characterization of a voltage-gated CaV1. 3 (α1D) calcium channel subunit from an insulin-secreting cell line. Mol Endocrinol. 2001;15:1211–1221. doi: 10.1210/mend.15.7.0666. [DOI] [PubMed] [Google Scholar]
- Sobkowicz H. The development of innervation in the organ of Corti. In: Romand R, editor. Development of Auditory and Vestibular Systems. Vol. 2. Amsterdam: Blackwell Science Inc; 1992. pp. 59–100. [Google Scholar]
- Song H, Nie L, Rodriguez-Contreras A, Sheng ZH, Yamoah EN. Functional interaction of auxiliary subunits and synaptic proteins with Cav1. 3 may impart hair cell Ca2+ current properties. J Neurophysiol. 2003;89:1143–1149. doi: 10.1152/jn.00482.2002. [DOI] [PubMed] [Google Scholar]
- Spassova M, Eisen MD, Saunders JC, Parsons TD. Chick cochlear hair cell exocytosis mediated by dihydropyridine-sensitive calcium channels. J Physiol. 2001;535:689–696. doi: 10.1111/j.1469-7793.2001.00689.x. [DOI] [PMC free article] [PubMed] [Google Scholar]
- Spitzer NC. Activity-dependent neuronal differentiation prior to synapse formation: the functions of calcium transients. J Physiol Paris. 2002;96:73–80. doi: 10.1016/s0928-4257(01)00082-1. [DOI] [PubMed] [Google Scholar]
- Weber T, Zimmermann U, Winter H, Mack A, Kopschall I, Rohbock K, Zenner HP, Knipper M. Thyroid hormone is a critical determinant for the regulation of the cochlear motor protein prestin. Proc Natl Acad Sci U S A. 2002;99:2901–2906. doi: 10.1073/pnas.052609899. [DOI] [PMC free article] [PubMed] [Google Scholar]
- Williams ME, Feldman DH, McCue AF, Brenner R, Velicelebi G, Ellis SB, Harpold MM. Structure and functional expression of alpha 1, alpha 2, and beta subunits of a novel human neuronal calcium channel subtype. Neuron. 1992;8:71–84. doi: 10.1016/0896-6273(92)90109-q. [DOI] [PubMed] [Google Scholar]
- Xu W, Lipscombe D. Neuronal Cav 1. 3α1 L-type channels activate at relatively hyperpolarized membrane potentials and are incompletely inhibited by dihydropyridines. J Neurosci. 2001;21:5944–5951. doi: 10.1523/JNEUROSCI.21-16-05944.2001. [DOI] [PMC free article] [PubMed] [Google Scholar]
- Zhang Z, Xu Y, Song H, Rodriguez J, Tuteja D, Namkung Y, Shin HS, Chiamvimonvat N. Functional roles of Cav1. 3 (α1D) calcium channel in sinoatrial nodes: insight gained using gene-targeted null mutant mice. Circ Res. 2002;90:981–987. doi: 10.1161/01.res.0000018003.14304.e2. [DOI] [PubMed] [Google Scholar]
- Zhou W, Jones SW. Surface charge and calcium channel saturation in bullfrog sympathetic neurons. J Gen Physiol. 1995;105:441–462. doi: 10.1085/jgp.105.4.441. [DOI] [PMC free article] [PubMed] [Google Scholar]
- Zidanic M, Fuchs PA. Kinetic analysis of barium currents in chick cochlear hair cells. Biophys J. 1995;68:1323–1336. doi: 10.1016/S0006-3495(95)80305-X. [DOI] [PMC free article] [PubMed] [Google Scholar]