Abstract
Biological and technological systems process information by means of cascades of signals. Be they interacting genes, spiking neurons or electronic transistors, information travels across these systems, producing, for each set of external conditions, an appropriate response. In technology, circuits performing specific complex tasks are designed by humans. In biology, however, design has to be ruled out, confronting us with the question of how these systems could have arisen by accumulation of small changes. The key factor is the genotype–phenotype map. With the exception of RNA folding, not much is known about the exact nature of this mapping. Here, we show that structure of the genotype–phenotype map of simple feed-forward circuits is very close to the ones found in RNA; they have a large degree of neutrality, by which a circuit can be completely rewired keeping its input–output function intact, and there is a relatively small neighbourhood of a given circuit containing almost all the phenotypes.
Keywords: cellular networks, cell signalling, evolution, neutral landscapes
1. Introduction
Many biological systems perform computations by internally processing the external stimuli. Some have information-processing capabilities that rival those of computers. Signal-transduction pathways, gene-regulation webs, immune responses and cortical maps are examples of structures performing such form of processing (Gerhardt & Kirschner 1997), which is carried out by different kinds of networks. All of them perform some class of computation (Hopfield 1994; Fernandez & Solé 2006), an essential ingredient of adaptation, whose evolutionary dynamics is largely unknown.
The evolution of multicellular life is pervaded by the computational nature of biological networks. They benefit from extensive cross-talk among different parts and are able to buffer mutational change and/or generate a wide repertoire of responses. When compared with artificial designs, such as electronic circuits (McAdams & Shapiro 1995), it is possible to identify common traits; both of them are definable in terms of an input–output structure with well-defined functional meaning; but their evolutionary rules strongly diverge. As pointed out by François Jacob as early as 1977, it is tinkering—not design—that shapes biological structures (Jacob 1977; Solé et al. 2002). Tinkering implies re-use and local, instead of top-down, planned decisions. Yet, in spite of its apparent limitations, it is obviously successful but not well understood. This is due to a lack of knowledge of the mapping between structure (genotype) and function (phenotype). With the exception of studies at the molecular level (Schuster et al. 1994; Schuster 1996; Babajide et al. 1997; Ancel & Fontana 2000; Schuster & Stadler 2002), little is known about the general nature of such mapping.
In order to uncover such mapping and its consequences for network evolution, we have explored the class of so-called feed-forward networks (FFN). They all involve the presence of a set of units acting as receptors and a downstream cascade of signalling events ending up in a set of output units. Such systems are simple (and yet very general) models of biological networks, from intracellular signalling (Bray 1995; Weng et al. 1999) to layered cortical maps (Rumelhart & McClelland 1986). Actually, intracellular signalling cascades have been shown to share a number of relevant traits in common with parallel-distributed systems (Bray 1990; see also Alberts et al. 2002, pp. 778–782) described as FFNs.
Consistently with the previous work on RNA folding (Schuster et al. 1994; Engelhardt 1998), we observe the following. (i) Neutral networks percolate the entire genotype space; there are always single-mutation neighbours of a given wiring that have the same input–output function, to the point of enabling us to go arbitrarily far in genotype space. (ii) It is not necessary to search all of the genotype space to find a given phenotype, since all the phenotypes are present around a relatively small neighbourhood of a given sequence, compared to the size of the whole space. A third piece of information suggests an even more interesting picture, (iii) the search neighbourhood becomes much smaller if we start at specifically chosen genotypes which have been optimized for mutant diversity, suggesting large differences in evolvability.
2. Feed-forward Boolean networks
2.1 Network structure and function
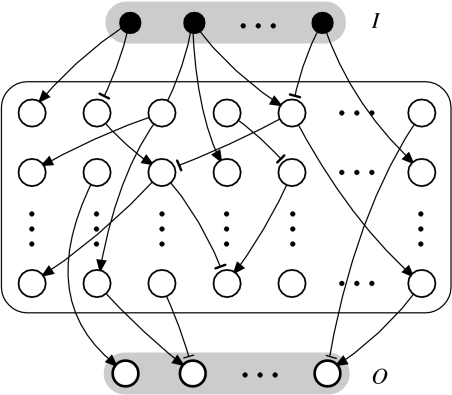
The model used is a very simple feed-forward structure (figure 1), and does not try to be a realistic representation of signalling graphs. We will ignore some relevant elements present in the signalling pathways, such as the presence of feedback loops. However, the wiring of the system is kept small, with average link numbers compatible with those seen in real signalling networks. Several extensions of this work will be presented elsewhere.
Figure 1.
Topology of the model of FFN used. It consists of a set of inputs (I units), hidden units (H×M units) and outputs (O units). Units can connect strictly to the layers above, thus avoiding cycles, except for the outputs, which cannot connect directly to the inputs.
The network has I inputs, O outputs and a H×M block of hidden units, as shown in figure 1. Units in the hidden block can connect only to the layers above them (thus avoiding cycles and cyclic behaviour), including inputs, and the outputs can connect to the hidden units but not directly to the inputs. In addition, the number E of connections is fixed.
The units, Si, of the network have a Boolean nature (i.e. Si∈{0, 1}), and perform a simple integer threshold function of the inputs, i.e.
| (2.1) |
The Θ function is defined as Θ(x)=0 for x≤0, and Θ(x)=1 for x>0 (thus the XOR function is not possible with only one unit). The weights wij are drawn from the set {+1, −1, 0}, representing positive, negative or absent regulation, respectively. When an input is presented, the output can be computed propagating the inputs in a non-dynamical way just as if all units changed at once.
By this definition, the input layer of the circuit models external states (or the result of sensing external states) being presented to the network, and the bottom layer models the output, representing needed response. The network, therefore, ‘computes’ the appropriate set of responses for each external state. This feed-forward topology is widely used in artificial neural networks.
2.2 Wiring-function mapping
Given this structure, we can easily define a genotype and a phenotype. The genotype, Wi, is defined as the ordered string of all weights wij. To compute the phenotype, we first calculate all the input–output pairs, with all possible different inputs from I1={0, 0, 0, …, 1} to (with the exception of I0={0, 0, …, 0}, which by definition, yields an all-zero output). The entire list of outputs completely describes the Boolean function Φi, or phenotype.
Two sets, W and Φ, describe the universe of possible wirings and functions, i.e. the sets of all possible genotypes and phenotypes. The genotype–phenotype map between wiring and function is then defined as
| (2.2) |
For each genotype Wi∈W, we have a phenotype Φi≡Ω(Wi)∈Φ. Evolution and adaptation occur through changes in wiring eventually leading to changes in function. How adaptation proceeds largely depends on the nature of mapping Ω (Stadler et al. 2001).
In order to characterize Ω, a metric or topological measure is needed. Given the discrete nature of both the spaces, phenotypic and genotypic distances can be defined, respectively, as
| (2.3) |
| (2.4) |
Phenotype distance is therefore equivalent to the Hamming distance of a bit string, and genotype distance is similar, measuring the number of different connections (i.e. either displaced or with reversed sign, which contribute 2 to the sum, hence the 1/2 factor). Throughout the work, we have used small networks, usually with I∈{3, 4}, O∈{4, 5}, H={7, …, 11} and M∈{3, 4}, with an average connectivity of 〈k〉≈3.0 which allowed us to more exhaustively explore genotype and phenotype spaces.
2.3 Network wiring changes
Mutation is implemented as the simplest random procedure that alters the wiring of the network preserving its average connectivity intact; an existing edge is chosen at random and is removed and re-wired between a previously disconnected pair of (different) elements (also chosen at random). A negative weight is added with probability 1/3 and a positive one with probability 2/3. The bias in the weights tries to compensate for the fact that a balanced network is less active overall.
3. Results
3.1 Frequencies of shapes
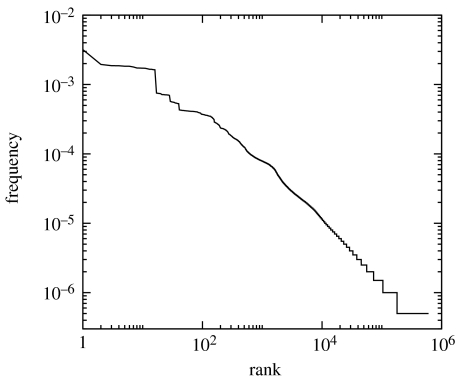
The frequencies of different functions were obtained using a sample of 2×10⁶ random wirings and computing the input–output table by the rules given. The rank plot of this data is shown in figure 2, evidencing a general form of power law. Thus, there are some frequent functions and many rare ones. The most frequent is the all-zero outputs function; there is a certain probability that no activation path exists between inputs and outputs, although overall, the probability is rather low (3.1×10⁻³). The small plateau following this first value at the low-rank zone corresponds to those functions with an equal output for all different inputs. In addition, within groups of 10 or more genotypes with the same phenotype, we calculated the average genotypic distance. In all cases, we obtained the same distance (within 1%) as that of a random sample, confirming that phenotypes have genotypes distributed uniformly over genotype space.
Figure 2.
Rank-frequency distribution of functions. Here, we represent the number of times, P(r), the rth most common system has been observed in the sample. A network with I=3, O=4, H=8 and M=3 and average connectivity 〈k〉=3 was chosen and a sample of 2×10⁶ was taken. The distribution follows a general form of Zipf's law, i.e. P(r)=a(b+r)−α with α≈0.75.
3.2 Neutral paths
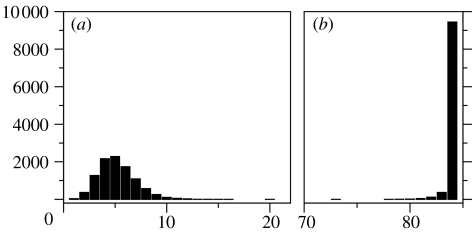
Two experiments were performed to check for the existence of neutral networks (i.e. regions in W consisting of neighbouring genotypes with the same phenotype), both involving neutral paths with monotonously decreasing (and increasing) distance from a reference sequence. In the first (figure 3a) experiment, a target wiring W is chosen at random, and a second random wiring is chosen as trial genotype, T. Next, if a random neighbour T′ of T conserves the phenotype and has a smaller dG(W,T′), it is accepted as the new T. The process is repeated 104 times. The final dG(W,T) is an upper bound of the minimum distance of the two phenotypes ΦW and ΦT. It is remarkable that this distance is on an average 5 (out of 84).
Figure 3.
Probability densities of genotype distance dG in two different experiments. (a) A target wiring is chosen at random, and an approach in genotype space to this target is tried by 104 different wirings. For each trial wiring, a neutral path is performed in which neighbours have to maintain function and at the same time be closer to the target (average final distance to the target, 5.18±1.82). (b) A similar neutral path is tried. In this case, a random genotype is chosen and a trail copy is mutated, step-by-step pushing it away in genotype space, while again conserving function (94.4% of genotypes were completely rewired while still maintaining phenotype).
In the second experiment, a random wiring W is chosen, and a copy of it is taken as trial, T. At each step, if a random neighbour T′ of T has the same phenotype as W and dG(W,T′) is larger, it is accepted as the new T. The process is repeated 104 times. The final dG(W,T) correlates with the size in genotype space of the neutral networks. In this experiment, 94.4% of the genotypes could be completely rewired (maximum genotype distance of 84), while keeping the phenotype (the smaller distance being 73). Neutral networks therefore percolate through genotype space.
3.3 Map structure
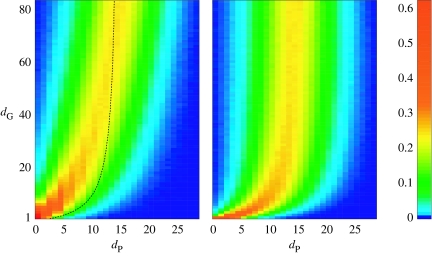
To understand how the map Ω is seen from the viewpoint of an average genotype W, we evaluated the probability that another genotype W′ at distance dG(W,W′) had a phenotype at a certain distance dP (the structure density surface; see Schuster et al. 1994). This probability was evaluated by producing progressively distant mutants from a given starting wiring, and evaluating the distance dP of their respective functions. We took 103 reference wirings, and for each one, we chose 10 different wirings at all values of dG and computed dP. Figure 4a shows the resulting two-dimensional histogram. As dG increases, we have a picture of how the average phenotypic distance behaves. For values of dG between 1 and 20, there is a correlation with the phenotype (a few changed wires usually produce a few changes in function), but after that, the distance to phenotypes is progressively similar to the random case, i.e. we can expect to find an almost random phenotype if we change 20 or more of a given network's links (a 25% of the total).
Figure 4.
Genotype-map structure as seen from a group of genotypes in two different numerical experiments ((I,O,H,M, 〈k〉)=(3, 4, 8, 3, 3.0)). (a) From 103 random wirings, the histogram of phenotypic distances of 10 other wirings at progressively higher distances starting at them. (b) The same histogram starting at the 80 selected genotypes with increased mutational diversity. The average phenotypic distance of the right part is plotted as a dashed black line in the left part for comparison.
Together with the covering of genotype space by the average phenotype, these results suggest the presence of a neighbourhood (a high-dimensional ball) around a particular FFN whose wirings include all common functions, in consonance with the RNA case (Schuster et al. 1994). However, there are some differences. Firstly, a few changes in an RNA sequence mostly result in a changed shape; even in the case of only one mutation, an RNA molecule can have a drastically different structure (up to a 66% change in phenotype distance). This is in contrast to FFNs, which in general are more robust for a small number of mutations (figure 4a). Secondly, the radius of the high-dimensional ball around which a genotype can find all common functions is somewhat smaller in the RNA case (approx. 15%). These differences lead us to think whether a special group of FFNs could be more sensitive to mutations, and therefore, deeply alter the perception of genotype space in the same experiment with them as starting points.
3.4 Mutation sensitivity
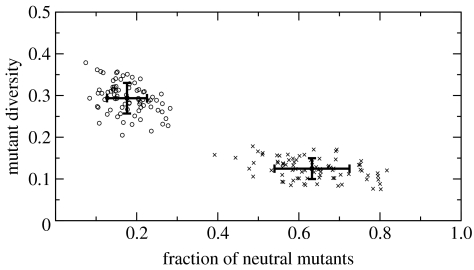
To test this hypothesis, we searched FFNs with a higher average sensitivity. Starting at a random genotype W, we measured its mutant diversity with two parameters: μ (satisfying 0<μ<1), indicating the fraction of mutants with a different phenotype (i.e. non-neutral), and δ (satisfying 0<δ<1), measuring the fraction of unique phenotypes within the non-neutral group (or diversity). A pair (μ,δ) with values (0.85, 0.1) describes a robust FFN with an 85% of neutral mutants in which non-neutral phenotypes (the remaining 15%) are repeated 10 times on an average.
We chose a group of 80 random FFNs and with each one, we performed a hill-climbing process successively choosing mutants with either lower μ or higher δ, but conserving phenotype. The size of the mutant samples was 2×10³. The starting and the ending sets are shown in figure 5. It is immediately clear that the differences in mutation sensitivity are enormous. These differences suggest that within a neutral network, special FFNs could serve as gateways, giving populations access to a very high number of different phenotypes from the same spot.
Figure 5.
A set of 80 random genotypes (times) was optimized for higher mutant diversity, conserving their phenotype (open circles). A hill-climbing process was performed with each one so that either the fraction of neutral mutants (μ) decreased, or the diversity of the different mutants (δ) increased. The initial average values of (0.63, 0.12), indicating very robust networks, were changed into (0.17, 0.29), suggesting the big differences in the sensitivity to mutations of genotypes within the same neutral network.
This is confirmed by the structure of the genotype–phenotype map (figure 4b) as viewed from the sensitive group of FFNs. The average phenotype distance is plotted as a dashed line on the left for comparison. The distance separating this group from a random genotype is halved, indicating a much smaller search space for these special FFNs.
3.5 Dynamical transitions
The structure of the mapping is further made clear by studying evolutionary dynamics. Following the previous approaches (Huynen et al. 1996), we did some optimization experiments in which a population of FFNs evolves towards a target function. We choose a very infrequent target phenotype ΦT (the phenotype with the highest average output-pair entropy in a sample of 105), and a group of 103 FFNs chosen at random serves as initial population. At each iteration, a new population results from fitness-proportionate reproduction, with the fitness of a genotype Wi being . Every reproduced FFN has a probability, p=0.3, of being mutated.
An example of the dynamics displayed by this kind of process is shown in figure 6. The average distance to the target decreases with time, showing punctuated events in which fitter genotypes spread rapidly within the population. Between these transitions, a stable regime characterized by an increase in genetic diversity takes place. A sample of the average dG of FFNs in the population shows increasing values, which drop abruptly whenever a fitter genotype takes over. This is the typical result that should be expected from the random drift of a population within a genotype space in the presence of neutrality (Huynen et al. 1996; Fontana & Schuster 1998).
Figure 6.
An example of the evolutionary optimization towards a specially chosen phenotype (see text). The parameters of the FFNs are I=6, O=5, H=10, M=5 and L=3.0. The initial population consists of 103 random FFNs. The population finds the target in 1749 generations, and the dynamics shows punctuated events in which population diversity falls abruptly. The vertical axis on the left shows distance to the target or dP. On the right, it shows genotypic distance or dG. Genotypic spread is the average dG between 103 random pairs of genotypes within the population.
4. Discussion
Neutrality plays a very important role in evolution. It helps populations to buffer against environmental fluctuations (Kimura 1983; Engelhardt 1998; van Nimwegen et al. 1998; van Nimwegen & Crutchfield 2000). This is achieved by creating ensembles of equally fit mutants. Moreover, once a more advantageous mutant appears, a rapid amplification occurs around the new solution. Previous theoretical efforts have shown that the evolutionary dynamics on neutral nets is largely independent of the parameters being used. Actually, it seems solely determined by network's topology. The direct consequence of this is that many properties of the network topology can be inferred from simple population statistics (Engelhardt 1998; Engelhardt & Newman 1998; van Nimwegen et al. 1998). Such convergent results might actually indicate that the overall structure of neutral networks in evolving systems is shaped by universal rules.
In FFNs, neutrality is a consequence of the numerous connections in a specific network that can be added or removed without directly affecting its functionality (Fernandez & Solé 2004). Therefore, it is a robust result that is insensitive to the parameters I, O, M or H, but depends on the existence of a threshold at each unit, as the consistent results we have observed suggest. The exception is the rank-frequency distribution, which already for the values of I=6 and O=6 turns out to be too large to sample with enough significance, and therefore, is different if sampled with the same density. In addition, we are aware of some caveats of our approach.
First, the parameters affect other aspects of the FFNs, such as their ability to compute a randomly chosen phenotype. As in the case of neural networks, the number of hidden layers (H here) and their size (M here) affects the complexity of the computations available to the system or its capacity (Hertz et al. 1991), and in the case of FFNs, to the attainable phenotypes (which also depends on the number of links, E). In this sense, many dynamics experiments such as the one shown in figure 6 failed when performed with a target phenotype chosen at random (and never with a phenotype computed from a random genotype). In general, we do not know what is the precise dependence between an increase in M or H and the diversity of phenotypes, but we expect to find an increasing coverage of phenotype space as H and M increase.
Second, and concerning the explanatory power, the all-or-none binary nature of the model dynamics used here is certainly an oversimplification. However, it is consistent with the switch-like behaviour of proteins within signalling cascades (Bray 1990, 1995; Weng et al. 1999; Alberts et al. 2002), and some studies show how a Boolean treatment of gene networks can successfully reproduce a broad spectrum of observations (Mendoza et al. 1999; Albert & Othmer 2003; Espinosa-Soto et al. 2004). In our study, a Boolean idealization was a necessity, since the proper definition of a phenotype and genotype requires discretization, and we feel it is also pertinent to the issues treated. A similar argument applies to the feed-forward nature of the networks studied, since real networks are in general recurrent, but the methodological issues involved in modelling them make the problem much more difficult.
Third, there is no agreed measure of evolutionary adaptability or evolvability. Although its definition is mostly clear (Kirschner & Gerhart 1998), it leaves room for interpretation and proposed measures are inevitably defined in terms of the models presented, and our sensitivity measure (μ,δ) is no exception. Nevertheless, sensitivity to mutation is informative about the plasticity of a given genotype, in relation with the second point of the evolvability definition; ‘to reduce the number of mutations needed to produce phenotypically novel traits’ (Kirschner & Gerhart 1998). Since neutrality is assumed, the first point, ‘to reduce the potential lethality of mutations’, is fulfilled (other authors have already studied evolvability as affected by neutrality (Ebner et al. 2002), but in the sense of ‘the ability of random variations to sometimes produce improvement’).
Despite these limitations, and as already discussed in Schuster et al. (1994), the presence of neutrality in the genotype–phenotype map has immediate consequences for an evolutionary process, and our results extend those of RNA and combinatorial molecules to a new domain and provide a good example of a more general applicability of these ideas. In the case of biology, living systems have evolved mechanisms of computation able to optimize their chances of survival. As a consequence, convergence towards networked structures able to integrate and process external inputs into reliable outputs has been widespread. Our results suggest that evolving such functional networks is not as difficult as it may seem, complementing the strictly topological results in the field of network biology (Barabási & Oltvai 2004). Present research is actually aimed at building synthetic molecular interaction networks (Elowitz & Leibler 2000; Guet et al. 2002; Kobayashi et al. 2004). Not surprisingly, special interest is being focused on the possibility of exploiting the computational potential of such networks.
On the other hand, many attempts have been made at the evolutionary design of digital (and analogue) circuits using genetic representations. In this context, some authors have already pointed out the importance of neutrality in artificial circuit evolution (Yu & Miller 2001) and genetic programming (Banzhaf & Leier 2006). However, most of this work has been focused on the production of small electronic circuits and their application to other domains is not straightforward. The results presented here could also contribute to this field.
Acknowledgments
We thank the members of the Complex Systems Lab for useful discussions. This work has been supported by a grant MCyT FIS2004-05422, the European Union within the 6th Framework Program under contracts FP6-001907 (Dynamically Evolving Large-scale Information Systems) and the Santa Fe Institute.
References
- Albert R, Othmer H.G. The topology of the regulatory interactions predicts the expression pattern of the Drosophila segment polarity genes. J. Theor. Biol. 2003;223:1–18. doi: 10.1016/S0022-5193(03)00035-3. [DOI] [PMC free article] [PubMed] [Google Scholar]
- Alberts B, Johnson A, Lewis J, Raff M, Roberts K, Walter P. IV edn. Garland; New York, NY: 2002. Molecular biology of the cell. [Google Scholar]
- Ancel L.W, Fontana W. Plasticity, evolvability and modularity in RNA. J. Exp. Zool. 2000;288:242–283. doi: 10.1002/1097-010X(20001015)288:3%3C242::AID-JEZ5%3E3.0.CO;2-O. [DOI] [PubMed] [Google Scholar]
- Babajide A, Hofacker I.L, Sippl M.J, Stadler P.F. Neutral networks in protein space: a computational study based on knowledge-based potentials of mean force. Fold. Des. 1997;2:169–261. doi: 10.1016/S1359-0278(97)00037-0. [DOI] [PubMed] [Google Scholar]
- Banzhaf W, Leier A. Evolution on neutral networks in genetic programming. In: Yu T, Riolo R, Worzel B, editors. Genetic programming—theory and applications III. Kluwer Academic; Boston, MA: 2006. pp. 207–221. [Google Scholar]
- Barabási A.-L, Oltvai Z.N. Network biology: understanding the cell's functional organization. Nat. Rev. Genet. 2004;5:101–113. doi: 10.1038/nrg1272. [DOI] [PubMed] [Google Scholar]
- Bray D. Intracellular signalling as a parallel distributed process. J. Theor. Biol. 1990;143:215–231. doi: 10.1016/s0022-5193(05)80268-1. [DOI] [PubMed] [Google Scholar]
- Bray D. Protein molecules as computational elements in living cells. Nature. 1995;376:307–312. doi: 10.1038/376307a0. [DOI] [PubMed] [Google Scholar]
- Ebner M, Shackleton M, Shipman R. How neutral networks influence evolvability. Complexity. 2002;7:19–33. doi: 10.1002/cplx.10021. [DOI] [Google Scholar]
- Elowitz M.B, Leibler S. A synthetic oscillatory network of transcriptional regulators. Nature. 2000;403:335–338. doi: 10.1038/35002125. [DOI] [PubMed] [Google Scholar]
- Engelhardt, R. 1998 Emergent percolating nets in evolution. Ph.D. thesis. University of Copenhagen.
- Engelhardt R, Newman M.E.J. Effects of selective neutrality on the evolution of molecular species. Proc. R. Soc. B. 1998;265:1333–1338. doi: 10.1098/rspb.1998.0438. [DOI] [Google Scholar]
- Espinosa-Soto C, Padilla-Longoria P, Alvarez-Buylla E.R. A gene regulatory network model for cell-fate determination during Arabidopsis thaliana that is robust and recovers experimental gene expression profiles. Plant Cell. 2004;16:2923–2939. doi: 10.1105/tpc.104.021725. [DOI] [PMC free article] [PubMed] [Google Scholar]
- Fernández P, Solé R.V. The role of computation in complex regulatory networks. In: Koonin E.V, et al., editors. Power laws, scale-free networks and genome biology. Landes BioScience; Georgetown, TX: 2006. pp. 206–225. [Google Scholar]
- Fontana W, Schuster P. Continuity in evolution: on the nature of transitions. Science. 1998;280:1451–1455. doi: 10.1126/science.280.5368.1451. [DOI] [PubMed] [Google Scholar]
- Gerhardt J, Kirschner M. Blackwell; Oxford, UK: 1997. Cells, embryos and evolution. [Google Scholar]
- Guet C.C, Elowitz M.B, Hsing W, Leibler S. Combinatorial synthesis of genetic networks. Science. 2002;24:1466–1470. doi: 10.1126/science.1067407. [DOI] [PubMed] [Google Scholar]
- Hertz J, Krogh A, Palmer R.G. Perseus Books; Reading, MA: 1991. Introduction to the theory of neural computation. [Google Scholar]
- Hopfield J.J. Physics, computation, and why biology looks so different. J. Theor. Biol. 1994;171:53–60. doi: 10.1006/jtbi.1994.1211. [DOI] [Google Scholar]
- Huynen M.A, Stadler P.F, Fontana W. Smoothness within ruggedness: the role of neutrality in adaptation. Proc. Natl Acad. Sci. USA. 1996;93:397–401. doi: 10.1073/pnas.93.1.397. [DOI] [PMC free article] [PubMed] [Google Scholar]
- Jacob F. Evolution and tinkering. Science. 1977;196:1161–1166. doi: 10.1126/science.860134. [DOI] [PubMed] [Google Scholar]
- Kimura M. Cambridge University Press; Cambridge, UK: 1983. The neutral theory of molecular evolution. [Google Scholar]
- Kirschner M, Gerhart J. Evolvability. Proc. Natl Acad. Sci. USA. 1998;95:8420–8427. doi: 10.1073/pnas.95.15.8420. [DOI] [PMC free article] [PubMed] [Google Scholar]
- Kobayashi H, Kaern M, Araki M, Chung K, Gardner T.S, Cantor C.R, Collins J.J. Programmable cells: interfacing natural and engineered gene networks. Proc. Natl Acad. Sci. USA. 2004;101:8414–8419. doi: 10.1073/pnas.0402940101. [DOI] [PMC free article] [PubMed] [Google Scholar]
- McAdams H.H, Shapiro L. Circuit simulation of genetic networks. Science. 1995;269:650–656. doi: 10.1126/science.7624793. [DOI] [PubMed] [Google Scholar]
- Mendoza L, Thieffry D, Alvarez-Buylla E.R. Genetic control of flower morphogenesis in Arabidopsis thaliana: a logical analysis. Bioinformatics. 1999;15:593–606. doi: 10.1093/bioinformatics/15.7.593. [DOI] [PubMed] [Google Scholar]
- Rumelhart D.E, McClelland J.L, editors. Parallel distributed processing: explorations in the microstructure of cognition. Foundations. vol. 1. MIT Press; Cambridge, MA: 1986. [DOI] [PubMed] [Google Scholar]
- Schuster P. How does complexity arise in evolution? Complexity. 1996;2:22–30. doi: 10.1002/(SICI)1099-0526(199609/10)2:1%3C22::AID-CPLX6%3E3.0.CO;2-H. [DOI] [Google Scholar]
- Schuster P, Stadler P.F. Networks in molecular evolution. Complexity. 2002;8:34–42. doi: 10.1002/cplx.10052. [DOI] [Google Scholar]
- Schuster P, Fontana W, Stadler P.F, Hofacker I.L. From sequences to shapes and back: a case study in RNA secondary structures. Proc. R. Soc. B. 1994;255:279–284. doi: 10.1098/rspb.1994.0040. [DOI] [PubMed] [Google Scholar]
- Solé R.V, Ferrer R, Montoya J.M, Valverde S. Selection, tinkering and emergence in complex networks. Complexity. 2002;8:20–33. [Google Scholar]
- Stadler B.M.R, Stadler P.F, Wagner G.P, Fontana W. The topology of the possible: formal spaces underlying patterns of evolutionary change. Theor. Biol. 2001;213:241–274. doi: 10.1006/jtbi.2001.2423. [DOI] [PubMed] [Google Scholar]
- van Nimwegen E, Crutchfield J.P. Metastable evolutionary dynamics: crossing fitness barriers or escaping via neutral paths? Bull. Math. Biol. 2000;5:799–848. doi: 10.1006/bulm.2000.0180. [DOI] [PubMed] [Google Scholar]
- van Nimwegen E, Crutchfield J.P, Huynen M. Neutral evolution of mutational robustness. Proc. Natl Acad. Sci. USA. 1998;96:9716–9720. doi: 10.1073/pnas.96.17.9716. [DOI] [PMC free article] [PubMed] [Google Scholar]
- Weng G, Bhalla U.S, Iyengar R. Emergent properties of networks of biological signaling pathways. Science. 1999;283:381–387. doi: 10.1126/science.283.5400.381. [DOI] [PubMed] [Google Scholar]
- Yu T, Miller J.F. Proc. Fourth European Conf. genetic programming. Lecture Notes in Computer Science. vol. 2038. Springer; Berlin, Germany: 2001. Neutrality and the evolvability of Boolean function landscape; pp. 204–217. [Google Scholar]


