

Abstract
Existing methods for assessing protein synthetic rates (PSRs) in human skeletal muscle are invasive and do not readily provide information about individual muscle groups. Recent studies in canine skeletal muscle yielded PSRs similar to results of simultaneous stable isotope measurements using l-[1-13C, methyl-2H3]methionine, suggesting that positron-emission tomography (PET) with l-[methyl-11C]methionine could be used along with blood sampling and a kinetic model to provide a less invasive, regional assessment of PSR. We have extended and refined this method in an investigation with healthy volunteers studied in the postabsorptive state. They received ≈25 mCi of l-[methyl-11C]methionine with serial PET imaging of the thighs and arterial blood sampling for a period of 90 min. Tissue and metabolite-corrected arterial blood time activity curves were fitted to a three-compartment model. PSR (nmol methionine⋅min−1⋅g muscle tissue−1) was calculated from the fitted parameter values and the plasma methionine concentrations, assuming equal rates of protein synthesis and degradation. Pooled mean PSR for the anterior and posterior sites was 0.50 ± 0.040. When converted to a fractional synthesis rate for mixed proteins in muscle, assuming a protein-bound methionine content of muscle tissue, the value of 0.125 ± 0.01%⋅h−1 compares well with estimates from direct tracer incorporation studies, which generally range from ≈0.05 to 0.09%⋅h−1. We conclude that PET can be used to estimate skeletal muscle PSR in healthy human subjects and that it holds promise for future in vivo, noninvasive studies of the influences of physiological factors, pharmacological manipulations, and disease states on this important component of muscle protein turnover and balance.
Keywords: skeletal muscle/fractional synthesis rate
Tissue protein wasting, primarily from skeletal muscle (1, 2), is a major contributor to morbidity and mortality in a variety of catabolic disease states (3). The loss of protein mass occurs by different mechanisms, depending on the circumstances; in bed rest, for example, there is a decrease in protein synthesis with maintenance of protein breakdown (4), whereas in critical illness and injury, muscle protein breakdown often is increased together possibly with an elevated protein synthesis that is unable to match the rise in protein breakdown (5). However, no satisfactory data based on tracer incorporation methods for human muscle protein synthesis in burn injury or other major catabolic states are available. Furthermore, protein synthesis and breakdown are likely to be coordinately controlled, and the specific nature of the disruption of protein metabolism in severely stressful states will dictate the form of therapy aimed at attenuating muscle loss. Hence, more information is needed about the changes in human muscle protein synthesis in a variety of circumstances. This goal could best be achieved with the aid of measurements that are less invasive than those commonly used, such as arterio-venous amino acid difference studies (6, 7) and tissue biopsies to measure incorporation of radioactive or stable isotope tracers (8–10).
We have proposed, where the appropriate mixture of facilities, expertise, and clinical material exist, that positron-emission tomography (PET) is a particularly promising technique for noninvasive measurements of tissue and organ metabolism (11). Because of the high spatial resolution and quantitative nature of PET, metabolic and kinetic parameters can be measured in tissue volumes as small as 1.0 cm3. Because positron-emitting isotopes of 11C, 13N, 15O, and 18F can be prepared with a small medical cyclotron, almost any biologically important molecule can serve as a PET tracer. Also, because of the short physical half-lives of these radionuclides, sequential, time-dependent physiological and biochemical measurements can be performed in the same subject (12). Most importantly, because of the less invasive nature of PET, measurements in human subjects could be made relatively routine.
Recently, we used PET with l-[methyl-11C] methionine as an in vivo, quantitative method for measuring protein synthesis rate (PSR) in paraspinal and hind limb muscles of restrained, anesthetized dogs (13). Data analysis was performed by fitting tissue and metabolite-corrected arterial plasma time-activity curves to a three-compartment model, assuming insignificant transamination and transmethylation of methionine in this tissue. PSR was calculated from fitted parameter values and plasma methionine concentrations. The PET measurements demonstrated similar PSRs for paraspinal and hind limb muscles. However, in that study, the effect of protein degradation was not included when determining the kinetic parameters. In this report, we introduce explicit theoretical consideration of the effect of protein degradation rate and discuss how uncertainties in this rate effect estimation of PSR by PET. Further, we establish the utility of this approach for estimation of muscle protein synthesis in healthy human volunteers and compare our results with other estimates, obtained by different tracer methods, reported in the literature.
MATERIALS AND METHODS
Materials.
All chemical reagents were obtained from Aldrich, Sigma, or Fisher Scientific and were used without further purification. HPLC solvents were purchased from Aldrich.
l-[methyl-11C] methionine (11C-Met) was prepared by the method described by Langstrom et al. (14) with minor modifications. Radiochemical purity of the final product was measured as described elsewhere (15) and was routinely >95%.
Human Subjects.
Six healthy volunteers (four males, ages 32–43, and two females, ages 26 and 38) participated in 10 PET studies.
Inclusion criteria.
The inclusion criteria for the study were: (i) healthy males and females, age range of 18–55 years; (ii) written informed consent required to participate; (iii) height and weight within 20% of ideal values as indicated from reference tables; (iv) supine and standing blood pressure within the range of 110/60 to 150/90 mm Hg; and (v) heart rate, after resting for 5 min, within the range of 46–90 beats/min.
Exclusion criteria.
The exclusion criteria for the study were: (i) clinical evidence of physical or psychological disease, based on medical history, physical examination, or electrocardiogram; (ii) any clinically significant abnormality on the prestudy laboratory tests; (iii) known drug or alcohol dependence, or a positive urinary drug screen; (iv) history of drug allergy; and (v) therapy with standard prescription drugs within 2 weeks before participation in the study or exposure to any investigational drug within a previous 4-week period.
Physical examination and medical history, electrocardiogram, and routine blood and urine tests were performed before injection of 11C-Met. In all subjects, imaging was performed after an overnight fast. No attempt was made to control for diet before these studies. The imaging protocol was approved by the committees on human studies, pharmacy, and radioisotopes of the Massachusetts General Hospital. All subjects gave written informed consent before their participation in the study.
PET.
Images were acquired with a PC-4096 PET camera (Scanditronix AB, Uppsala, Sweden; ref. 16). The intrinsic imaging parameters of this device are in-plane and axial resolutions of 6.0 mm FWHM (full width half maximum), 15 contiguous slices with 6.5 mm separation and sensitivity of ≈5,000 cps/μCi per cc. Images were reconstructed by using a standard filtered back-projection algorithm to an in-plane resolution of 6 mm FWHM. The projection data were corrected for attenuation, nonuniformity of detector response, random coincidences, dead time, and scatter. The PET camera was cross-calibrated with the well scintillation counter that was used for plasma radioactivity measurements.
Before imaging, a venous catheter was placed in a peripheral vein for tracer administration and a radial arterial catheter was inserted for blood sampling. The subjects were positioned supine on the imaging bed of the PET camera, with their mid-thighs centered in the field of view. Before injection of tracer, measurements of photon attenuation were made by using a rotating pin source containing 68Ge. Approximately 25 mCi 11C-Met (specific activity: ≈1,000 mCi/μmol) was injected through the venous catheter, and sequential images and arterial blood samples were collected over 90 min.
Over the first 4 min, blood was withdrawn via a rotary pump (flow rate ≈8 ml⋅min−1) and 11C radioactivity was recorded at 1-sec intervals with two pairs of on-line coincidence detectors. Thereafter, samples of arterial blood were withdrawn at 5, 10, 15, 30, 60, and 90 min, and radioactivity was measured in a well counter. “Metabolite corrected” plasma time-activity curves (TACs) were calculated by multiplying the plasma TACs by a metabolite correction function (i.e., the fraction of unchanged methionine) (17). PET images were collected in 1-min frames for 90 min.
Four to six irregular-shaped regions of interest (ROIs), each containing ≈6 cc of tissue, were placed on the anterior and posterior aspects of each thigh in all slices. In positioning the ROIs, particular caution was taken to exclude bone and major vascular structures. The concentration of radioactivity in all of the ROIs for each segment of the left and right thigh were averaged to yield composite time activity curves.
11C-Met Kinetic Modeling.
The results of the imaging studies in healthy volunteers were analyzed by using a compartmental model that extends the ideas previously described for calculating PSR in anesthetized dogs (13). Fig. 1 illustrates the model configuration. In this schema, the tracer label can be in one of three states: (i) as free methionine in plasma, (ii) as free methionine in tissue, or (iii) as labeled protein. For analyzing the PET data, tracer in plasma is not considered to be a compartment of the model; instead, the tracer plasma concentration history was included as a measured input function. K1,2 is the unidirectional clearance (ml⋅min−1⋅g−1) of methionine from plasma to tissue, i.e., the product of regional blood flow and unidirectional extraction; k2,1 is a rate constant (min−1) that accounts for transfer of label from the tissue-free methionine pool to plasma; k2,3 is a rate constant that accounts for transfer of label from the tissue-free methionine pool to labeled proteins; and k3,2 is a rate constant accounting for protein degradation.
Figure 1.

Kinetic model for methionine utilization by skeletal muscle. K1,2 is the unidirectional clearance (ml⋅min−1⋅g−1) of methionine from plasma to tissue, i.e., the product of regional blood flow and unidirectional extraction; k2,1 is the rate constant (min −1) for transfer of label from the tissue-free methionine pool to plasma; k2,3 is the rate constant for transfer of label from the tissue-free methionine pool to labeled proteins; and k3,2 is the rate constant for protein degradation.
In formulating the model both tracer and tracee were considered. It was assumed that the tracee is in steady state, meaning that the pool sizes and transport parameters can be considered to be constant, at least over the period of the experiment. Under these circumstances, the equations describing the steady-state quantities can be derived from a simple mass balance:
 |
1 |
 |
2 |
where [Met]p and [Met]f are the plasma and tissue concentrations of free methionine, respectively, and [Prot] is the concentration of methionine mixed proteins of muscle. The model equations for the tracer can be written as a set of coupled linear differential equations with constant coefficients, with the additional assumption that k2,3[Prot]* (degradation rate of labeled protein) is negligible (18).
 |
3 |
 |
4 |
where the superscript ∗ indicates 11C-labeling and λ is the decay constant for carbon-11 (0.03414 min−1). The total concentration of label in tissue is measured by PET and is given in terms of the model as:
 |
5 |
where bvrepresents fractional blood volume, [Met]*v represents the vascular concentration of labeled methionine (a measured concentration history) and t denotes the time of the measurement. The model parameters were estimated by least-squares fitting (Marquardt algorithm, matlab, version 4.2) of the predicted tissue concentrations of methionine to the tissue concentrations measured by PET, as indicated in Eq. 3. Under steady-state conditions the rate of methionine utilization (PSR, nmol methionine⋅min−1⋅g −1) is given by:
 |
6 |
When the results of our previous PET studies in dogs (13) were reanalyzed by using this modeling approach (i.e., Eq. 6), estimated PSR increased from 0.193 ± 0.054 to 0.275 ± 0.066 nmol methionine⋅min−1⋅g−1, in close agreement with the results of stable isotope measurements (0.27 ± 0.050 nmol methionine⋅min−1⋅g−1), which were made simultaneously.
To compare our findings with literature values, the fractional synthesis rate (FSR) of muscle protein per hour was calculated by using the following assumptions: (i) methionine concentration in muscle mixed proteins is 120 μmol⋅g protein−1 (19, 20) and (ii) the concentration of protein in muscle tissue is 20%.
Statistical Evaluations.
Data were summarized as mean ± SEM, and comparisons were made by using paired or unpaired t tests.
RESULTS
Inspection of the PET images (Fig. 2) revealed relatively homogeneous distribution of tracer without evidence of significant differences between the various muscle groups. Compared with muscle, accumulation of tracer was much lower in fat and bone but higher in bone marrow.
Figure 2.
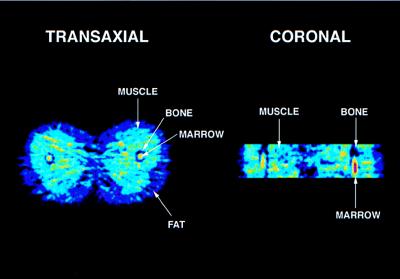
Transverse (Left) and coronal (Right) PET images of thigh muscle of a healthy volunteer. Note: Tracer accumulation is reduced in bone and increased in bone marrow.
Fig. 3 shows, for subject number 2, the least-squares fit of a time-activity curve for the average concentration of 11C-Met in human thigh muscle to the kinetic model in Fig. 1. The time dependence of the residuals derived from the fitting procedure and model estimates of the concentrations of radioactivity in tissue-free methionine and labeled protein compartments also are illustrated; all concentrations have been corrected for radioactive decay. These results demonstrate that the time dependence of the concentration of 11C-Met in skeletal muscle is well described by the model; in all cases, r2 was ≈0.99%, and the residuals were randomly distributed.
Figure 3.

(Upper) Least-squares fit of a PET time activity curve for the average concentration of 11C-Met in thigh muscle (subject no. 2, Table 1) based on the kinetic model shown in Fig. 1 (solid curve and crosses). The time dependence of blood radioactivity (spaced dots) was interpolated to a smooth curve from fitting the experimental observations to a decreasing biexponential model. Model predictions of radioactivity concentration in tissue-free methionine (dashes) and labeled protein (dots) compartments also are illustrated. (Lower) The time dependence of the residuals derived from the least-squares procedure (•).
For all subjects that were studied, estimated model parameters for anterior and posterior thigh muscle are given in Table 1. Supporting the qualitative impression from the imaging data, very similar values for K1,2, k2,1, and k2,3 were obtained in all six subjects and for both muscle regions. Pooling the data across subjects and muscle groups the mean values were: K1,2 = 0.0264 ± 0.0029 ml⋅min−1⋅g−1, k2,1 = 0.0629 ± 0.0043 min−1, and k2,3 = 0.0593 ± 0.00021 min−1. The plasma methionine level in the six subjects, averaged over all scan sessions, was 20.08 ± 0.86 nmol⋅ml−1. Table 1 also shows the PET estimates of PSR for all subjects. The mean PSR in healthy humans, averaged over all scan sessions and muscle regions was 0.50 ± 0.040 nmol methionine⋅min−1⋅g−1. Finally, from the assumptions described in Materials and Methods we can estimate from the PSR the FSR of mixed proteins in muscle. Based on the combined PSR, the mean (±SEM) FSR is estimated to be 0.125 ± 0.01%⋅h−1.
Table 1.
Kinetic parmeters for l-[methyl-11C] methionine metabolism in thigh muscle of healthy volunteers
| No. | Sex | Age | [Met]p, μM | Site | K1,2, ml/min/g | k2,1, min−1 | k2,3, min−1 | PSR, nmol/min |
|---|---|---|---|---|---|---|---|---|
| 1 | M | 32 | 23.7 | A | 0.0154 | 0.0576 | 0.0597 | 0.379 |
| 1 | M | 32 | P | 0.0161 | 0.0688 | 0.0594 | 0.331 | |
| 1a | M | 32 | 23.8 | A | 0.0099 | 0.0421 | 0.0601 | 0.336 |
| 1a | M | 32 | P | 0.0102 | 0.0476 | 0.0600 | 0.306 | |
| 2 | M | 36 | 20.4 | A | 0.0317 | 0.0492 | 0.0590 | 0.775 |
| 2 | M | 36 | P | 0.0318 | 0.0502 | 0.0590 | 0.762 | |
| 2a | M | 36 | 16.8 | A | 0.0247 | 0.0431 | 0.0597 | 0.574 |
| 2a | M | 36 | P | 0.0230 | 0.0403 | 0.0597 | 0.573 | |
| 3 | M | 41 | 16.2 | A | 0.0206 | 0.0535 | 0.0596 | 0.371 |
| 3 | M | 41 | P | 0.0211 | 0.0715 | 0.0593 | 0.284 | |
| 4 | F | 26 | 21.9 | A | 0.0590 | 0.0906 | 0.0572 | 0.817 |
| 4 | F | 26 | P | 0.0558 | 0.0938 | 0.0564 | 0.735 | |
| 5 | M | 43 | 19.7 | A | 0.0243 | 0.0977 | 0.0599 | 0.293 |
| 5 | M | 43 | P | 0.0230 | 0.0954 | 0.0597 | 0.283 | |
| 5a | M | 43 | 21.3 | A | 0.0200 | 0.0491 | 0.0598 | 0.518 |
| 5a | M | 43 | P | 0.0197 | 0.0645 | 0.0594 | 0.385 | |
| 6 | F | 38 | 17.0 | A | 0.0362 | 0.0576 | 0.0590 | 0.630 |
| 6 | F | 38 | P | 0.0389 | 0.0794 | 0.0585 | 0.486 | |
| 6a | F | 38 | 20.0 | A | 0.0235 | 0.0486 | 0.0602 | 0.582 |
| 6a | F | 38 | P | 0.0228 | 0.0567 | 0.0600 | 0.482 | |
| Mean ± SEM | 36.0 ± 2.5 | 20.08 ± 0.86 | A | 0.0265 ± 0.004 | 0.0589 ± 0.006 | 0.0594 ±0.00025 | 0.528 ±0.057 | |
| Mean ± SEM | P | 0.0262 ± 0.004 | 0.0668 ± 0.006 | 0.05914 ± 0.00034 | 0.463 ± 0.057 | |||
a, repeat study; A, anterior muscle group; P, posterior muscle group.
DISCUSSION
Quantitative in vivo aspects of amino acid utilization and protein synthesis in human subjects have been investigated extensively by i.v. or oral administration of stable isotope-labeled amino acids (21, 22). Although these studies have given information about whole body protein turnover rates, most have not provided estimates of amino acid metabolism in specific tissues and organs; the latter have been derived mostly from A-V difference studies (23). To better understand the metabolic basis for the erosion of skeletal muscle proteins under stressful conditions and, in turn, to establish effective therapeutic strategies aimed at attenuating this loss of muscle protein, direct estimates of human muscle protein synthesis are needed under a variety of conditions. We have proposed that PET potentially provides a means for a routine noninvasive, in vivo kinetic analysis of the fate of 11C-Met in skeletal muscle and also have pointed out previously that PET has several advantages over A-V difference studies (13). Therefore, we have extended use of this technique to initial studies of human muscle protein synthesis, and we record estimates of PSR and FSR for the anterior and posterior aspects of the thigh by using this short-lived nuclide as a tracer.
As mentioned above, an important feature of the PET 11C-Met method is its ability to make regional measurements of the kinetic parameters describing the transport of methionine and its incorporation into protein. The clearance of methionine from plasma to the tissue-free methionine compartment, K1,2, was 0.0264 ± 0.003 ml⋅min−1⋅g−1, similar to muscle blood flow (7, 24, 25). The half-time for turnover of the tissue pool was 5.7 min, and 48% of the labeled methionine entering the tissue-free pool ultimately was incorporated into protein.
Our data (Table 1) clearly illustrate the high degree of reproducibility and precision of the 11C-Met method. Of all the kinetic parameters that were determined k2,3 (0.0593 ± 0.00021 min−1) was most stable. Also, it is important to note that the kinetic parameters were similar within each subject for the two muscle groups that were studied. Because these measurements are essentially independent, this finding indicates high within-subject reproducibility.
Although there are many important technical differences between the stable isotope (6–10) and PET 11C-Met method, the underlying bases of the techniques are quite similar. In the stable isotope method, plasma flow, arterial and deep venous blood samples, and muscle biopsy specimens are the measured quantities and materials analyzed (25). In the PET measurement, muscle biopsy and deep arterial/venous sampling are replaced with noninvasive measurements of the change in the tissue concentration of the tracer. Here we did sample arterial blood, which in our setting can be performed routinely without any major risk to study subjects without pre-existing arterial lines. A less invasive approach, in this context would be to sample “arterialized” venous blood from a heated dorsal hand vein, which often is used in studies of the kinetics of nutritionally indispensable amino acids (26). In our follow-up investigations, we hope to examine this possibility in detail.
With respect to the arterio-venous difference technique and the present approach, both methods require a kinetic model to relate fluxes and rates to the measured quantities. For example, a recent paper by Tessari and colleagues (7) reports on the application of a kinetic model for estimating leucine kinetics in skeletal muscle of the human forearm, by using 14C- and 15N-leucine as tracers. After accounting for the deamination of leucine to α-ketoisocaproic acid and the arterial and venous sampling, their kinetic model is essentially identical to that depicted in Fig. 1. Our previous demonstration in a dog model (13) that transmethylation of 11C-Met across the hind limb was, for practical purposes negligible, allows for further simplification of the methionine model. Furthermore, both approaches make identical modeling assumptions; neglecting return of label after incorporation into protein during the experimental period.
To clarify the limitations of the PET-11C-Met method it is first necessary to give further consideration to the meaning of steady state in the context of these experiments. These considerations are also relevant, but not usually stated, with regard to the more conventional stable isotope methods. The derivation of Eq. 6 requires constant pool sizes and rates, which leads to the conclusion that PSR and degradation rates must be equal. In healthy adults, who are not substantially adding or losing muscle mass, equality of PSR and degradation rates must be true, at least on a daily basis. If we introduce the unknown parameter Φ = k2,3[Prot]/PSR, representing the ratio of the degradation rates and PSRs, Eq. 6 can be formally extended as:
 |
7 |
and simple calculations show that the error caused by assuming that Φ = 1 is less than 10% for 0.8 ≤ Φ ≤ 1.2. However, in pathological conditions of muscle wasting Φ may be significantly larger than 1.2 (2, 4, 5) and the present method would not be reliable for computing PSRs unless measurements of protein degradation rates were also available. If proteolysis were particularly rapid, it might become necessary to use non-steady-state modeling. To measure PSR by PET in states of abnormal catabolism it will be necessary to: (i) extend the measurement time so that k3,2 can be estimated and (ii) provide an estimate of [Prot]. Despite these concerns, because return of label from the protein pool should be negligible during the experimental period, the PET method still can be used to estimate K1,2, k2,1, and k2,3. Because abnormal catabolism may alter these kinetic parameters, the PET method may provide additional valuable insights into the physiological mechanisms that account for changes in muscle turnover and mass under conditions of stress. Furthermore, without explicit knowledge of protein degradation rate it is also possible to measure the component of protein synthesis attributable to circulating methionine, which would be of physiologic interest, and this quantity is estimated by:
 |
8 |
It should be noted that JMet is the quantity referred to as the PSR in some PET studies (27, 28).
Strict comparisons of our results with literature values for FSR in healthy adults as obtained by direct tracer incorporation methods should be made with caution because of (i) differences in subject characteristics, metabolic state, muscle protein fraction and type, and anatomic location, the precise analytical measures used, and the assumptions made about the isotopic enrichment of the amino acid precursor, and (ii) the assumptions we have made about the methionine and protein content of muscle, to arrive at an estimate of FSR. Hence with these uncertainties in mind, the present FSR of 0.125 ± 0.01%⋅h−1 is comparable with estimates involving direct incorporation of stable isotope tracers, ranging from about 0.05 (25, 29–31) to 0.09% (31–34). On this basis, it seems that we have made a reasonable estimation of muscle protein synthesis in healthy adults. It now remains for us to carry out studies in additional well-defined groups of subjects, such as the elderly, malnourished, and stressed patients during acute illness and recovery, so that a coherent picture of the status of muscle protein synthesis rates in different muscles and regions and the quantitative importance of various factors on these rates can be assembled. It also should be pointed out that the present method is limited by the fact that it estimates the PSR for the mixed proteins of muscle, and individual proteins may respond differently and perhaps even in different directions to a particular stimulus. Nevertheless, it does appear to be potentially valuable for providing a further basis for tailoring effective nutritional/pharmacological therapies aimed at the maintenance of muscle protein synthesis and optimizing function in both health and disease conditions.
Acknowledgments
We acknowledge the excellent technical support from Stephen Weise, Avis Loring, Sandra Barrow, Lynn Gedremis, Michael Callaway, Susan Huang, and the members of the Massachusetts General Hospital Cyclotron Laboratory. This work was supported in part by grants from the Shriners Hospitals for Children and the National Institutes for General Medical Sciences (P50-GM21700, T32-GM07035, and T32-CA09362).
ABBREVIATIONS
- PET
positron-emission tomography
- PSR
protein synthesis rate
- FSR
fractional synthesis rate
References
- 1. Rennie M J. In: Organ Metabolism and Nutrition: Ideas for Future Critical Case Care. Kinney J M, Tucker H N, editors. New York: Raven; 1994. pp. 23–48. [Google Scholar]
- 2.Cooney R N, Kimball S R, Vary T C. Shock. 1997;7:1–16. doi: 10.1097/00024382-199701000-00001. [DOI] [PubMed] [Google Scholar]
- 3.Hill G L. Disorders in Nutrition and Metabolism in Clinical Surgery. Edinburgh: Churchill Livingstone; 1992. [Google Scholar]
- 4.Ferrando A, Wolfe R R. In: Physiology, Stress, and Malnutrition: Functional Correlates, Nutritional Intervention. Kinney J M, Tucker H N, editors. Philadelphia: Lippincott-Raven; 1997. pp. 413–429. [Google Scholar]
- 5.Rennie M J. Br Med Bull. 1985;41:257–264. doi: 10.1093/oxfordjournals.bmb.a072060. [DOI] [PubMed] [Google Scholar]
- 6.Cheng K N, Dworzak F, Ford G C, Rennie M J, Halliday D. Eur J Clin Invest. 1985;15:349–354. doi: 10.1111/j.1365-2362.1985.tb00283.x. [DOI] [PubMed] [Google Scholar]
- 7.Tessari P, Inchiostro S, Zanetti M, Barazzoni R. Am J Physiol. 1995;269:E127–E136. doi: 10.1152/ajpendo.1995.269.1.E127. [DOI] [PubMed] [Google Scholar]
- 8.Biolo G R, Flemming S P, Maggi S O, Wolfe R R. J Parent Enteral Nutr. 1992;16:305–315. doi: 10.1177/0148607192016004305. [DOI] [PubMed] [Google Scholar]
- 9.Garlick P J, McNurlan M A, Essen P, Wernerman J. Am J Physiol. 1994;266:E287–E297. doi: 10.1152/ajpendo.1994.266.3.E287. [DOI] [PubMed] [Google Scholar]
- 10.Rennie M J, Smith K, Watt P W. Am J Physiol. 1994;266:E298–E307. doi: 10.1152/ajpendo.1994.266.3.E298. [DOI] [PubMed] [Google Scholar]
- 11.Young V R, Yu Y M, Hsu H, Babich J W, Alpert N M, Tompkins R G, Fischman A J. In: Emerging Technologies for Nutrition Research: Potential for Assessing Military Performance. Carlson-Newberry S J, Costello R B, editors. Washington DC: National Academy Press; 1997. pp. 231–257. [PubMed] [Google Scholar]
- 12.Huang S C, Phelps M E. In: Positron Emission Tomography and Autoradiography: Principles and Applications for the Brain and Heart. Phelps M E, Mazziotta J C, Schelbert H R, editors. New York: Raven; 1986. pp. 287–346. [Google Scholar]
- 13.Hsu H, Yu Y M, Babich J W, Burke J F, Livni E, Tompkins R G, Young V R, Alpert N M, Fischman A J. Proc Natl Acad Sci USA. 1996;93:1841–1846. doi: 10.1073/pnas.93.5.1841. [DOI] [PMC free article] [PubMed] [Google Scholar]
- 14.Langstrom B, Antoni G, Gullberg P, Halldin C, Malmborg P, Nagren K, Rimland A, Svard H. J Nucl Med. 1987;28:1037–1040. [PubMed] [Google Scholar]
- 15.Nagren K. In: PET Studies on Amino Acid Metabolism and Protein Synthesis. Mazoyer B M, Hess W D, Comar D, editors. Dordrecht, the Netherlands: Kluwer; 1993. pp. 87–87. [Google Scholar]
- 16.Rota Kops E, Herzog H, Schmid A, Holte S, Feinendegen L E. Comput Assist Tomogr. 1990;14:437–445. doi: 10.1097/00004728-199005000-00022. [DOI] [PubMed] [Google Scholar]
- 17.Lundquist H, Stalnacke C G, Langstrom B, Jones B. In: The Metabolism of the Human Brain with Positron Emission Tomography and Autoradiography. Greitz T, Ingvar D H, Widen L, editors. New York: Raven; 1985. pp. 233–340. [Google Scholar]
- 18.Reeds P J. In: Modern Methods in Protein Nutrition and Metabolism. Nissen S, editor. San Diego: Academic; 1992. pp. 249–273. [Google Scholar]
- 19.Stegink L D, Bell E F, Daabees T T, Anderson D W, Zike W L, Filer L J. In: Amino Acids: Metabolism and Medical Applications. Blackburn G L, Grant J P, Young V R, editors. Boston, MA: John Wright PSG; 1983. pp. 123–146. [Google Scholar]
- 20.Davis T A, Fiorotto M L, Reeds P J. J Nutr. 1993;123:947–956. doi: 10.1093/jn/123.5.947. [DOI] [PubMed] [Google Scholar]
- 21.Waterlow J C. Annu Rev Nutr. 1995;15:57–92. doi: 10.1146/annurev.nu.15.070195.000421. [DOI] [PubMed] [Google Scholar]
- 22.Young V R, Yu Y-M, Krempf M. In: New Techniques in Nutritional Research. Whitehead R G, Prentice A, editors. San Diego: Academic; 1991. pp. 17–72. [Google Scholar]
- 23.Elia M. Nutr Res Rev. 1991;4:3–31. doi: 10.1079/NRR19910005. [DOI] [PubMed] [Google Scholar]
- 24.Bennet W M, Connacher A A, Scrimgeour C M, Jung R T, Rennie M J. Am J Physiol. 1990;259:E185–E194. doi: 10.1152/ajpendo.1990.259.2.E185. [DOI] [PubMed] [Google Scholar]
- 25.Biolo G, Fleming R Y, Maggi S P, Wolfe R R. Am J Physiol. 1995;268:E75–E84. doi: 10.1152/ajpendo.1995.268.1.E75. [DOI] [PubMed] [Google Scholar]
- 26.Copeland K C, Kenney F A, Nair K S. Am J Physiol. 1992;263:E1010–E1014. doi: 10.1152/ajpendo.1992.263.5.E1010. [DOI] [PubMed] [Google Scholar]
- 27.Hawkins R A, Huang S C, Barrio J R, Keen R E, Feng D, Mazziotta J C, Phelps M E. J Cereb Blood Flow Metab. 1989;9:446–460. doi: 10.1038/jcbfm.1989.68. [DOI] [PubMed] [Google Scholar]
- 28.Paans A M J, Pruin V, van Waarde A, Willemsen A T M, Vaalburg W. Balliere’s Clin Endocrinol. 1996;10:497–510. doi: 10.1016/s0950-351x(96)80666-5. [DOI] [PubMed] [Google Scholar]
- 29.Yarasheski K E, Campbell J A, Smith K, Rennie M J, Holloszy J O, Bier D M. Am J Physiol. 1992;262:E261–E267. doi: 10.1152/ajpendo.1992.262.3.E261. [DOI] [PubMed] [Google Scholar]
- 30.Nair K S, Welle S L, Halliday D, Campbell R G. J Clin Invest. 1988;82:198–205. doi: 10.1172/JCI113570. [DOI] [PMC free article] [PubMed] [Google Scholar]
- 31.McNurlan M A, Essen P, Heys S D, Buchan V, Garlick P J, Wernerman J. Clin Sci (London) 1991;81:557–564. doi: 10.1042/cs0810557. [DOI] [PubMed] [Google Scholar]
- 32.Rennie M J, Edwards R H, Halliday D, Matthews D E, Wolman S L, Millward D J. Clin Sci (London) 1982;63:519–523. doi: 10.1042/cs0630519. [DOI] [PubMed] [Google Scholar]
- 33.Welle S, Thornton C, Statt M, McHenry B. Am J Physiol. 1994;267:E599–E604. doi: 10.1152/ajpendo.1994.267.4.E599. [DOI] [PubMed] [Google Scholar]
- 34.Patterson B W, Zhang X J, Chen Y, Klein S, Wolfe R R. Metab Clin Exp. 1997;46:943–948. doi: 10.1016/s0026-0495(97)90084-6. [DOI] [PubMed] [Google Scholar]