

Abstract
Human hypertrophic cardiomyopathy, characterized by cardiac hypertrophy and myocyte disarray, is the most common cause of sudden cardiac death in the young. Hypertrophic cardiomyopathy is often caused by mutations in sarcomeric genes. We sought to determine arrhythmia propensity and underlying mechanisms contributing to arrhythmia in a transgenic (TG) rabbit model (β-myosin heavy chain–Q403) of human hypertrophic cardiomyopathy. Langendorff-perfused hearts from TG (n = 6) and wild-type (WT) rabbits (n = 6) were optically mapped. The upper and lower limits of vulnerability, action potential duration (APD) restitution, and conduction velocity were measured. The transmural fiber angle shift was determined using diffusion tensor MRI. The transmural distribution of connexin 43 was quantified with immunohistochemistry. The upper limit of vulnerability was significantly increased in TG versus WT hearts (13.3 ± 2.1 versus 7.4 ± 2.3 V/cm; P = 3.2e−5), whereas the lower limits of vulnerability were similar. APD restitution, conduction velocities, and anisotropy were also similar. Left ventricular transmural fiber rotation was significantly higher in TG versus WT hearts (95.6 ± 10.9° versus 79.2 ± 7.8°; P = 0.039). The connexin 43 density was significantly increased in the mid-myocardium of TG hearts compared with WT (5.46 ± 2.44% versus 2.68 ± 0.77%; P = 0.024), and similar densities were observed in the endo- and epicardium. Because a nearly 2-fold increase in upper limit of vulnerability was observed in the TG hearts without significant changes in APD restitution, conduction velocity, or the anisotropy ratio, we conclude that structural remodeling may underlie the elevated upper limit of vulnerability in human hypertrophic cardiomyopathy.
Keywords: arrhythmia, vulnerability, hypertrophic cardiomyopathy, transgenic rabbit
Hypertrophic cardiomyopathy (HCM) is the most common cause of sudden cardiac death (SCD) in the young and a significant cause of diastolic heart failure in the elderly.1 Ventricular tachycardia and fibrillation are considered to be the principle mechanisms of SCD; thus, implantable cardioverter defibrillators are now routinely recommended for HCM patients at high risk of SCD.2,3 However, the mechanisms of arrhythmia propensity and defibrillation in HCM remain largely unknown.
HCM is characterized by cardiac hypertrophy, myocyte disarray, and interstitial fibrosis.4 Myocyte disarray is considered the pathological hallmark of HCM, whereas myocyte hypertrophy and interstitial fibrosis are common in many cardiovascular conditions. HCM is caused by mutations in sarcomeric proteins (except for phenocopy), with the MYH7 gene encoding β-myosin heavy chain (MyHC) being the most frequent cause of HCM.5
We have generated a transgenic (TG) rabbit model by cardiac-restricted expression of the mutant β-MyHC-Q403, known to cause HCM in humans.6 The β-MyHC-Q403 rabbits recapitulate the phenotype of human HCM and exhibit cardiac hypertrophy, myocyte disarray, interstitial fibrosis, and SCD.7,8 The β-MyHC-Q403 rabbits afford the opportunity to delineate mechanisms of cardiac arrhythmias in HCM, as the rabbit has long been an experimental model of choice for studies of basic cardiac electrophysiology because of its ability to sustain complex reentrant arrhythmias that faithfully reproduce those in larger species.9,10 The rabbit heart has also been found to be most similar to the human heart with respect to both the effective size and wave patterns during ventricular fibrillation, both of which are principal parameters for the investigation of arrhythmia mechanisms.11
To elucidate the underlying mechanisms contributing to arrhythmia vulnerability and SCD in HCM, we used multiple imaging modalities to assess electrophysiological, structural, and molecular characteristics from the hearts of β-MyHC-Q403 rabbits and compared them with wild-type (WT) controls.
Materials and Methods
An expanded Materials and Methods section is in the online data supplement at http://circres.ahajournals.org.
TG Rabbits
Generation and initial phenotypic characterization of the β-MyHC-Q403 TG rabbits have been published.7,8,12 All protocols were approved by the appropriate Institutional Animal Care and Use Committees. We studied 6 TG and 6 WT littermate control rabbits, matched for age, sex, and body weight. These characteristics as well as selected echocardiographic parameters are shown in Table 1.
Table 1.
Animal Characteristics and Selected Echocardiographic Parameters
| Animal | Age, mo | Sex | Body Weight, kg | ST, cm | PWT, cm | LV Mass, g |
|---|---|---|---|---|---|---|
| Wild type | ||||||
| 1 | 34 | F | 4.6 | 0.21 | 0.20 | 4.55 |
| 2 | 35.5 | F | 4.25 | 0.22 | 0.20 | 4.61 |
| 3 | 35 | M | 4.44 | 0.22 | 0.21 | 4.64 |
| 4 | 14.5 | F | 3.58 | 0.22 | 0.21 | 3.63 |
| 5 | 39.5 | M | 4.13 | 0.21 | 0.19 | 3.72 |
| 6 | 15 | F | 4.74 | 0.22 | 0.23 | 4.49 |
| Mean ± SD or M/F | 28.92 ± 11.1 | 2/4 | 4.29 ± 0.41 | 0.22 ± 0.01 | 0.21 ± 0.01 | 4.27 ± 0.47 |
| Transgenic | ||||||
| 1 | 34.5 | F | 4.95 | 0.27 | 0.24 | 5.89 |
| 2 | 34.5 | M | 4.52 | 0.33 | 0.28 | 6.97 |
| 3 | 35 | F | 5.16 | 0.27 | 0.23 | 5.73 |
| 4 | 14.5 | F | 3.70 | 0.28 | 0.25 | 6.21 |
| 5 | 15 | F | 4.63 | 0.25 | 0.23 | 4.91 |
| 6 | 16 | M | 4.19 | 0.24 | 0.24 | 4.42 |
| Mean ± SD or M/F | 24.92 ± 10.7 | 2/4 | 4.52 ± 0.53 | 0.27 ± 0.03 | 0.25 ± 0.02 | 5.69 ± 0.91 |
| P | 0.001 | < 0.01 | < 0.01 | |||
Age, sex, body weight, and selected echocardiographic parameters of each animal studied. P values reflect comparisons between TG and WT animals obtained with a t test. M/F indicates male or female; ST, septal thickness; PWT, posterior wall thickness.
Echocardiography
Echocardiographic and tissue Doppler images were obtained and analyzed as described previously.12,13
Optical Mapping Experiments
The optical mapping system and Langendorff-perfused rabbit heart have been described previously.14 The entire anterior epicardial surface was mapped with a 16 × 16 photo-diode array (PDA) with a field-of-view of approximately 2.7 × 2.7 cm (see Figure 2). The excitation– contraction uncoupler 2,3-butanedione monoxime (BDM) (15 mmol/L; Fisher Scientific, Fair Lawn, NJ) was added to the perfusate to suppress motion artifacts in the optical recordings.
Figure 2.
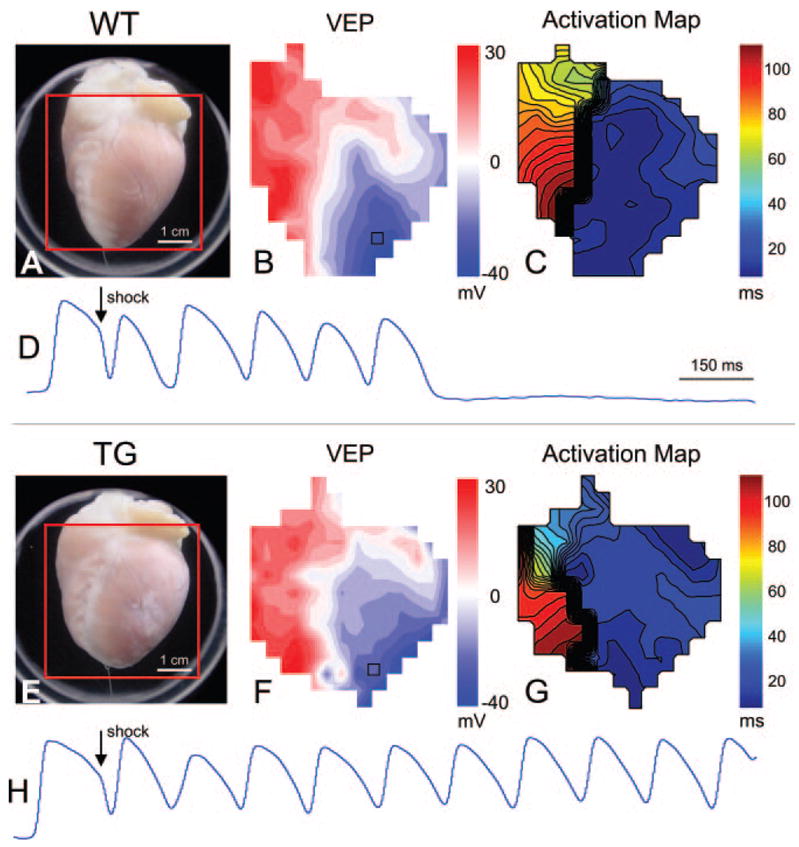
Optical imaging data during shock application. A, Photograph of a Langendorff-perfused WT heart with the optical field of view indicated with a red square. B, Map of VEP at shock end (8 V/cm, 79% APD). Red and blue regions represent depolarized and hyperpolarized tissue, respectively. C, Activation map showing the shock-induced spread of reentrant activation. Isochrones are 4 ms apart. D, Optical action potentials recorded from the location are indicated with a black square in B. Shock-induced deexcitation is observed at this site, and the tissue is immediately reexcited by reentrant activation. The arrhythmia self-terminates after several beats. E through H, Similar images as A through D for a TG heart. In this case, the shock (8 V/cm, 86% APD) produced a sustained arrhythmia.
Experimental Protocol
The pacing site was located on the anterior left ventricular (LV) epicardium midway between apex and base. The pacing current was at least 4 times the pacing threshold. An S1–S2 protocol was performed with 20 S1s delivered at a cycle length of 300 ms followed by an S2 of decreasing duration until the S2 pacing stimulus no longer produced an action potential. The last S2 interval to capture was deemed the effective refractory period. The S1–S2 protocol was performed on all 12 hearts; however, a full action potential duration (APD) restitution protocol was only performed for 6 hearts (3 WT, 3 TG, 1 male/2 female for each group). The full APD restitution protocol consisted of the same S1–S2 protocol but included longer S2 intervals up to the interval at which the sinus rate interrupted the S2 interval.
A protocol to determine the vulnerable grid15 was then performed. After a train of 20 paced beats at a basic cycle length of 300 ms, a truncated exponential monophasic shock (10-ms duration, 80% tilt) was delivered at a specified coupling interval (CI) that was randomized within the vulnerable grid.15 Shock strengths (SS) ranged from ≈ 1 to 18 V/cm. The CI from the last paced beat ranged from 40 to 220 ms with 20-ms steps. The vulnerable grid was completed for both shock polarities. The applied electric field is referred to as RV – when the electrode near the RV was used as the cathode. The opposite electrode configuration is referred to as LV –.
A sustained arrhythmia was defined as lasting more than 6 shock-induced extra beats, consistent with Fabritz et al.15 Any sustained arrhythmias lasting more than several minutes were terminated with a rescue shock. The upper (ULV) and lower (LLV) limit of vulnerability were defined as the highest and lowest SS at which a sustained arrhythmia was induced, respectively. The vulnerable window (VW) was defined as the ULV minus the LLV. The longest and shortest extent of the vulnerable period (VP) were defined as the longest and shortest CIs that produced a sustained arrhythmia, and the VP was defined as the longest minus the shortest extent of VP. After completion of the grid, several grid points were again measured to confirm stability of the grid. These points consisted of a SS slightly larger than the ULV and shocks applied at CIs slightly longer and shorter than the longest and shortest VPs to confirm that sustained arrhythmias were not produced.
Diffusion-Weighted Magnetic Resonance Imaging
Immediately after optical mapping experiments, hearts were perfused with 3.7% formaldehyde, diffusion tensor MRI (DTMRI) was performed, and the myofiber helix angle (α) was calculated for an LV short-axis slice midway between apex and base as described previously.16,17
Immunohistochemistry
After MR imaging, hearts were transferred to 20% sucrose for 2 two days and the LV lateral wall was embedded in Tissue-Tek OCT compound, frozen, and cryosectioned parallel to the epicardium. Immunohistochemistry was performed with a commercially available anti–connexin (Cx)43 antibody (C6219; Sigma) used at a dilution of 1:400. Alexa fluor 555 goat anti-rabbit IgG (A-21428; Molecular Probes) was used for the secondary antibody at a dilution of 1:1000. Confocal imaging was performed with a × 40 lens on a Nikon C1/80i confocal microscope.
Data Analysis
Optical Mapping Data Analysis
All signal analysis software was custom developed using MATLAB (The Mathworks Inc, Natick, Mass). This software allowed for automated calculation of activation, repolarization, APD, and calibrated transmembrane voltage in PDA channels having a signal-to-noise ratio of ≥ 5 dB. For calibration, a resting potential of − 85 mV and an action potential amplitude of 100 mV were assumed.
APD80 was automatically calculated in all channels that met the specified signal-to-noise ratio criteria (≥ 5 dB). Conduction delay in each channel was calculated as the time difference between the pacing stimulus and activation. The percentage APD (%APD) at which a shock was applied was calculated for each channel according to the following equation14:
The %APD was then averaged across all included PDA channels for each vulnerable grid point. The vulnerable grid, the upper and lower limits of VP, and the VP are all expressed as %APD.
Cx43 Quantification
Cx43 density was quantified from immunohistochemical images as previously described.18 Four randomly selected images were acquired from each of 2 sister sections at each tissue location (epi-, mid-, or endocardium) for a total of 8 images per location and 24 images per heart. The Cx43 density at each location was calculated as the average density of the 8 images.
Statistical Analysis
All data are presented as means ± SD. To compare group data between TG and WT hearts, either a t test for parameters with equal variance or Kruskal–Wallis test for those with unequal variances were performed. Where appropriate, a 2-way ANOVA and Fisher’s protected t test were also performed. A value of P < 0.05 was considered statistically significant. All nonlinear fitting was performed using the “nlinfit” function in MATLAB. The maximum number of iterations was set to 1000. The termination tolerance on the residual sum of squares and the estimated coefficients were both set to 1e−8.
Results
Echocardiography and Tissue Doppler Imaging
Septal thickness, posterior wall thickness, and LV mass were increased in TG compared with WT hearts (Table 1). These findings are consistent with previous reports on the β-MyHC-Q403 rabbits.7,8
Vulnerable Grid
Large differences in ULV were observed between WT and TG hearts (Figure 1 and Tables 2 and 3). Significant statistical differences were found for RV – shocks (WT, 7.75 ± 2.06 V/cm; versus TG, 13.80 ± 2.05 V/cm; P = 0.003), LV – shocks (WT, 7.00 ± 2.74 V/cm; versus TG, 12.80 ± 2.28 V/cm; P = 0.010), and when RV – and LV – shocks were pooled (WT, 7.38 ± 2.28 V/cm; versus TG, 13.30 ± 2.11 V/cm; P = 3.2e−5). No statistical differences in ULV were observed between RV – and LV – shocks for either group or when WT and TG data were pooled. No statistical differences in LLV were found between groups. However, the VW was found to be significantly different between WT and TG hearts (WT, 6.25 ± 2.62 V/cm; versus TG, 12.08 ± 2.29 V/cm; P = 0.002). Analysis of all parameters relating to the phase of shock application including the longest and shortest extent of VP as well as the VP did not reveal any statistical differences between WT and TG hearts (Table 2). Because of instability of the vulnerable grid, caused by ischemia or prolonged experiment duration, data from 2 TG hearts and 1 WT heart were not included in the analysis of vulnerable grid parameters. Therefore, n = 5 for TG hearts (2 male/3 female) and n = 4 for WT hearts (1 male/3 female) for grid parameters only.
Figure 1.
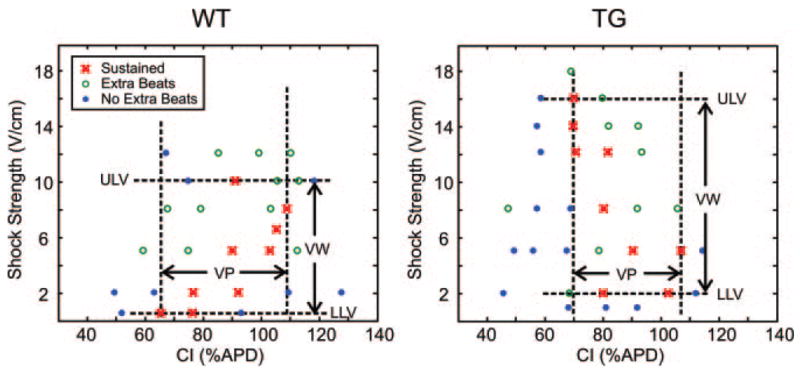
Sample vulnerability grids from a WT and TG heart showing the outcome at each shock strength and CI combination.
Table 2.
Vulnerable Grid Parameters
| RV/LV Combined, V/cm | Wild Type | Transgenic |
|---|---|---|
| ULV | 7.38 ± 2.28† | 13.30 ± 2.11 |
| LLV | 0.92 ± 0.58 | 1.42 ± 0.66 |
| VW | 6.25 ± 2.62* | 12.08 ± 2.29 |
ULV, LLV, and VW for RV – and LV – shocks combined. P values reflect comparisons between WT and TG hearts obtained with a t test.
P < 0.01 vs TG,
P < 0.001 vs TG.
Table 3.
VP Results
| Parameter, % | Wild Type | Transgenic | ||
|---|---|---|---|---|
| APD | RV – | LV – | RV – | LV – |
| Longest Extent of VP | 114.43 ± 17.43 | 111.68 ± 17.61 | 110.04 ± 8.88* | 95.76 ± 6.95 |
| Shortest Extent of VP | 43.30 ± 24.00 | 50.82 ± 21.41 | 62.87 ± 14.60 | 51.49 ± 17.05 |
| VP | 71.13 ± 41.12 | 60.86 ± 33.84 | 47.17 ± 21.34 | 48.21 ± 25.47 |
VP results are expressed as %APD for RV – and LV – shocks as well as for RV – and LV – shocks combined. The P value reflects comparison between RV – and LV – shocks for the TG group.
P < 0.05 vs TG LV –.
Patterns of epicardial shock-induced virtual electrode polarization (VEP) and postshock activation were similar for WT and TG hearts. Figure 2 shows the response to an RV – 8 V/cm shock applied at 79% and 86% of the APD to a WT and TG heart, respectively. Figure 2A and 2E shows the anterior views of each heart with the PDA field of view indicated with a red square. From these images, obvious differences in heart size can be observed, with apparent hypertrophy in the TG heart compared with the WT heart. However, the shock-induced VEPs, as observed on the epicardial surface of the heart and shown in Figure 2B and 2F, are almost identical between WT and TG hearts. The postshock spread of activation is also very similar with activation spreading quickly from the RV to the LV then slowly reentering at the base of the RV in both hearts (Figure 2C and 2G). Noteworthy, this results in several shock-induced extra beats in the WT heart (Figure 2D), whereas in the TG heart, a sustained arrhythmia occurs (Figure 2H).
In addition, the maximum VEP (VEPmax) and minimum VEP (VEPmin) were calculated for all animals at shock end for an 8 V/cm shock applied at approximately 80% of APD80. The results are reported in Table I in the online data supplement. The magnitudes of polarization as well as VEPmax − VEPmin were comparable between groups. Although the %APD at which shocks were applied varied slightly between animals, there was also no significant difference in this parameter.
APD Restitution
Neither a linear nor biexponential fit of the APD restitution curve revealed significant differences in stability of electrical activation between TG and WT hearts (Figure 3; see the online data supplement for details). The slope of the linear fit was compared and found to be similar between groups (TG, 0.472 ± 0.182; versus WT, 0.424 ± 0.262; P = 0.728). For the biexponential fit, the fitting parameter τ1 was compared. The TG group was found to have a slightly faster but not statistically significant τ1 compared with the WT group (0.281 ± 0.068 versus 0.342 ± 0.209 ms; P = 0.827).
Figure 3.
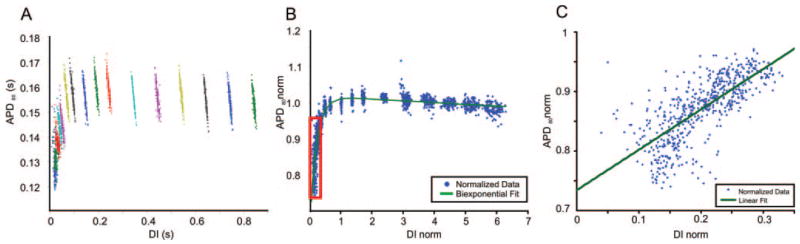
APD restitution curves. A, APD vs diastolic interval (DI) for each photodiode pixel before normalizing. The different colors represent different S2 pacing intervals. The points within each color represent all photodiode pixels at each S2 interval. B, APD restitution curve after normalizing and fitting with a biexponential function (see the online data supplement for details). C, The steepest portion of the restitution curve shown in the red box in B, along with a linear fit. Comparisons between TG and WT animals revealed no significant differences for either fitting method.
Several other parameters related to the APD were also investigated, including the mean APD80, the dispersion of APD80 (online data supplement, Equation 2), and the effective refractory period. No statistical differences were observed between groups for any of these calculations (supplemental Table II).
Conduction Velocity
Conduction velocities and the anisotropic ratio of conduction velocity (ratio = Cl/Ct) were calculated for all 12 hearts for basic pacing at a cycle length of 300 ms as well as for an S2 of 180 ms. No statistical differences or interactions were found between WT and TG hearts or between cycle lengths of 180 and 300 ms for any of the velocity parameters when a 2-way ANOVA was performed, indicating that the higher ULV observed in the TG hearts cannot be directly attributed to either slower or more anisotropic conduction (Figure 4; supplemental Table III).
Figure 4.
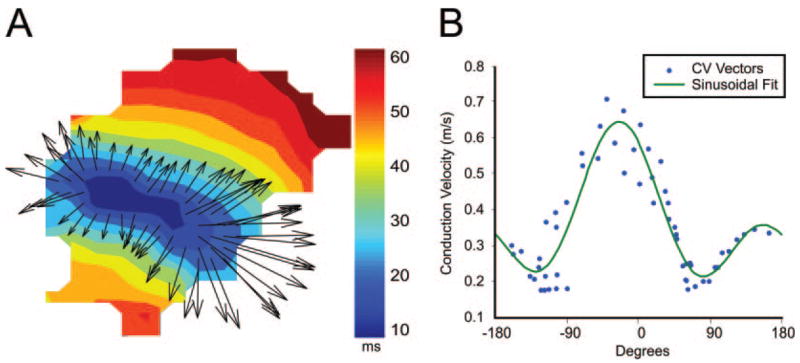
Epicardial conduction velocities. A, Sample activation map and conduction velocity vectors near the pacing site (field of view similar to those shown in Figure 2). B, Magnitude and direction of each conduction velocity vector and sinusoidal fit (see text and the online data supplement for details).
Myocardial Fiber Rotation
Myocardial fiber rotation across the LV wall (helix angle: α) was quantified using DTMRI. A larger transmural fiber angle shift was found in TG hearts compared with WT. The total fiber angle shift for the entire wall thickness (Figure 5) was found to be 95.6 ± 10.9° in TG hearts compared with 79.2 ± 7.8° in WT hearts (P = 0.039).
Figure 5.
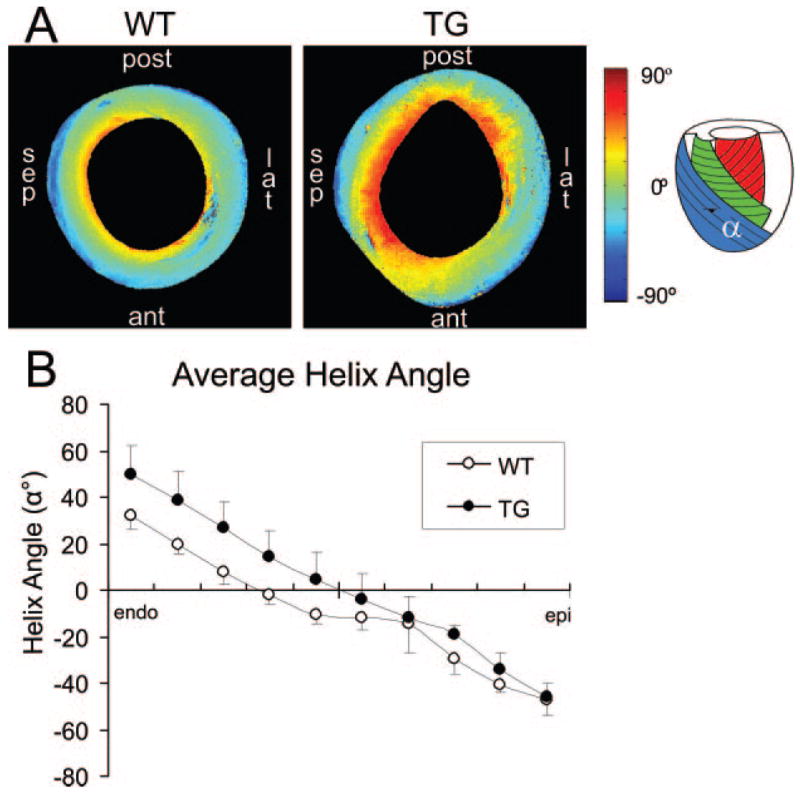
Diffusion tensor MRI. A, Mid-ventricle short-axis slices from a WT and TG heart showing the helix angle (α). sep indicates septal; post, posterior; lat, lateral; ant, anterior. B, Average helix angle from all hearts at 10 steps across the LV wall from endocardium to epicardium. The TG hearts were found to have a significantly larger helix angle compared with WT hearts (95.6 ± 10.9° vs 79.2 ± 7.8°; P = 0.039).
Immunohistochemistry
Disruption of either the total amount or distribution of the gap junction protein Cx43 has been shown to promote conduction abnormalities and facilitate arrhythmias.19 Therefore, we tested the hypothesis that the transmural distribution of Cx43 may be altered in the TG rabbits. Transmural expression of Cx43 was significantly altered in TG hearts compared with WT hearts (Figure 6). WT hearts showed a general trend of increased expression of endocardial Cx43 compared with the mid- and epicardium. Mid-myocardial Cx43 density was found to be significantly decreased compared with the endocardial density for WT hearts (mid-myocardial, 2.68 ± 0.77%; versus endocardial, 5.31 ± 2.46%; P = 0.034). In TG hearts, however, the trend was somewhat reversed, with increased (but not statistically significant) mid-myocardial Cx43 density compared with the endocardium (mid-myocardial, 5.46 ± 2.44%; versus endocardial, 3.92 ± 2.48%; P = 0.301). When WT and TG hearts were compared, a significant difference in Cx43 density was found in the mid-myocardium with TG hearts having an ≈ 2-fold increase in density compared with WT hearts (5.46 ± 2.44% versus 2.68 ± 0.77%; P = 0.024). All Cx43 data are reported in supplemental Table IV.
Figure 6.

Transmural expression of Cx43. A, Sample confocal images from a WT and TG heart taken from endo-, mid-, and epicardial locations. B and C, Individual Cx43 densities obtained from each WT and TG heart studied. D, Average Cx43 densities at each tissue location. All Cx43 densities are listed in supplemental Table IV.
Discussion
In this study, we investigated the electrophysiological basis of SCD in HCM in the β-MyHC-Q403 TG rabbits and determined that a point mutation in a contractile protein, β-MyHC, conveys a significant increase in arrhythmogenicity via an increased ULV and VW. However, the electrophysiological mechanisms normally associated with proarrhythmia failed to explain this increase. The well-established predictors of arrhythmia initiation and maintenance include dynamic instabilities such as a steep APD restitution curve, electrical heterogeneities such as severe dispersion of APD or repolarization, a shortened wavelength (either slower conduction velocity or a shorter effective refractory period), or an increased anisotropic ratio of conduction velocity. In this study, none of those predictors were present in the TG hearts, yet arrhythmia propensity was significantly increased. Thus, additional mechanisms, such as increased transmural fiber rotation and disrupted Cx43 density, may play an important role in arrhythmia propensity and maintenance in HCM.
Both axes of the vulnerability grid (CI and SS) provide a measure of arrhythmogenicity, as the VP is closely related to the dispersion of repolarization15 and the ULV strongly correlates with the defibrillation threshold (DFT).20 An increase in either of these parameters indicates an increased susceptibility to shock-induced ventricular arrhythmias. In this study, similar values of VP were measured, indicating that WT and TG hearts have similar dispersion of repolarization. However, we found that the TG hearts had a much higher ULV and VW (almost 2-fold) compared with WT hearts; thus the TG hearts exhibit an overall increased susceptibility to postshock arrhythmias.
Interestingly, the epicardial postshock activation patterns and maps of VEP were remarkably similar in both groups (Figure 2), with the shock-induced phase singularity mechanism21 responsible for the initial reentrant activation observed on the anterior epicardial surface. The magnitude of VEP produced by the shock was also similar between groups, indicating that the driving force for postshock activation was also similar. However, the major difference between WT and TG hearts appears to be that in TG hearts, shocks below the ULV produced reentrant activation which resulted in a sustained (> 6 extra beats up to several minutes) ventricular arrhythmia. However, shocks of the same magnitude and CI that produced sustained arrhythmias in TG hearts produced the same reentrant activation in WT hearts but often resulted in only several extra beats. Thus, it is possible that the mechanisms of arrhythmia “initiation” are not different in TG hearts compared with control, as the same virtual electrode-induced phase singularity mechanism21 is responsible. Rather, it is the mechanisms of arrhythmia “maintenance” that appear to result in a higher ULV.
The increased ULV also indicates that the DFT for TG hearts should be considerably higher20 than WT. Although the DFT may be increased in any hypertrophic state,22 a distinct increase in DFT has yet to be demonstrated in patients with HCM except for a small subset of patients with advanced hypertrophy.23 Because implantable cardioverter defibrillators are now being routinely recommended for both primary and secondary prevention of SCD in HCM,2,3 the possibility of increased DFTs in patients with moderate hypertrophy needs to be considered.
DTMRI revealed a modest yet statistically significant increase in transmural fiber rotation for a mid-ventricle short axis slice in TG hearts compared with WT. The increased transmural fiber rotation in TG hearts may play a role in converting nonsustained ventricular arrhythmias into sustained arrhythmias, thus promoting arrhythmia maintenance. Several numerical studies support this theory24–27 and have shown that an increased amount of transmural fiber rotation can result in scroll wave filament instability, promoting filament bending and scroll wave breakup. However, there is some disagreement regarding the role of a steep APD restitution curve in this phenomenon. Using the Luo–Rudy action potential model, Qu et al26 found that increased fiber rotation led to filament bending and scroll wave breakup only in the settings of a sufficiently steep APD restitution curve. Rappel27 also found that scroll wave breakup did not occur in the Luo–Rudy model but did occur when the Beeler–Reuter model was used. Using a simplified cardiac model, Fenton and Karma24,25 found that scroll wave breakup is a function of fiber rotation rate and the scroll wave trajectory and not of the slope of the APD restitution curve. Regardless of the exact role of the APD restitution curve, these numerical studies indicate that transmural fiber rotation may play a role in arrhythmia maintenance, thus supporting the experimental results obtained in the present study.
Abnormal expression of Cx43 can promote conduction abnormalities and may provide the substrate for arrhythmias.19 In the present study, a statistically significant increase in mid-myocardial Cx43 density was found in TG hearts compared with WT. This altered distribution may affect transmural conduction and facilitate arrhythmia maintenance without affecting epicardial conduction patterns recorded with optical mapping techniques because of the limited depth penetration of optical mapping.
Although total expression of Cx43 is known to be down-regulated in the ventricle of patients with hypertrophic, dilated, and ischemic cardiomyopathies,28,29 we observed an increase in mid-myocardial Cx43 in the TG rabbits. Similarly, an increase in total Cx43 was observed in TG rabbits with a mutation in cardiac troponin I that causes HCM in humans.30 These findings may reflect different stages of remodeling or intrinsic differences that take place in familial hypertrophic cardiomyopathies compared with those that are in response to injury.
Most importantly, the increased Cx43 density found in the mid-myocardium of the TG hearts may provide an interesting link between the possibly altered mechanical stress experienced in the mid-myocardial layers of the hypertrophic hearts and the transcription and translation of Cx43. Finite element modeling studies have indicated that muscle fiber stress and strain across the LV wall are very sensitive to the transmural distribution of helix angle,31 changing up to 50%, with only slight variations in helix angle distribution.32 Our DTMRI results show differences in both the distribution and total amount of transmural fiber angle rotation; therefore, the LV wall mechanics may vary greatly between WT and TG hearts. In addition, it has been reported that pulsatile stretch leads to a dramatic upregulation of Cx43 in cultured myocytes.33 Thus, we conclude that altered ventricular mechanics may result in altered Cx43 expression. However, support for this hypothesis must first come in the form of measuring or predicting mechanical strain and/or stress in the hypertrophic ventricle via tagged MRI or numerical simulations.
In summary, we found a 2-fold increase in ULV and VW in the β-MyHC-Q403 TG rabbits, suggesting an increase in both arrhythmia propensity and DFT. The increased ULV was associated with increased transmural fiber rotation and increased mid-myocardial Cx43 expression, yet the traditional electrophysiological parameters normally associated with arrhythmia were not present. Thus, structural, not electrophysiological, remodeling may underlie the increased arrhythmia propensity in HCM. This finding may have important implications regarding pharmacologic suppression of arrhythmias in HCM, as treatments aimed toward reducing or reversing the structural remodeling may be more effective than traditional antiarrhythmic drugs. Additionally, our findings indicate that an elevated DFT may be present even in the absence of extreme hypertrophy. This important finding should be taken into account as an ever-increasing number of HCM patients are receiving implantable cardioverter defibrillators.
Study Limitations
The limitations of the isolated rabbit heart have been described previously21 and include the use of BDM as an excitation–contraction uncoupler. It is well known that BDM can flatten the restitution curve and shorten APD, causing an offset in the quantitative results obtained in this study. However, because BDM was used in both groups of rabbits, it is very likely that the qualitative observations will still exist if this study were repeated without BDM. To optically map as much of the ventricular epicardium as possible, a tradeoff was made with regard to spatial resolution. Therefore, the fluorescent optical signals at each PDA location are a summary of approximately 1.7 × 1.7 mm2 of cardiac tissue. This summary effect may mask subtle differences between the WT and TG activation maps, conduction velocities, and VEP maps. In addition, the optical mapping technique cannot penetrate the epicardial surface beyond ≈ 1 mm. Therefore, all fluorescence recordings are from the epicardium only. Thus, the change in mid-myocardial Cx43 expression found in this study is not reflected in epicardial conduction velocity measurements. Finally, immunohistochemistry and MRI were performed on the same hearts as those used for the optical mapping study. During the mapping portion of the study, the isolated heart preparation is subject to protein degradation and edema, which can affect immunostaining and structural imaging results. However, all WT and TG hearts were subject to the same optical mapping protocol.
Supplementary Material
Acknowledgments
Sources of Funding
This work was supported by NIH grants R01-HL67322 and R01-HL074283 (to I.R.E.) and R01-HL68884 (to A.J.M.); an American Heart Association Predoctoral Fellowship (C.M.R.); Clinician–Scientist Award in Translation Research from Burroughs Wellcome Fund no. 1005907 (to A.J.M.); and the Greater Houston Community Foundation (TexGen) (A.J.M.).
Footnotes
Disclosures
None.
References
- 1.Maron BJ, Shirani J, Poliac LC, Mathenge R, Roberts WC, Mueller FO. Sudden death in young competitive athletes. Clinical, demographic, and pathological profiles. JAMA. 1996;276:199–204. [PubMed] [Google Scholar]
- 2.Maron BJ, Shen WK, Link MS, Epstein AE, Almquist AK, Daubert JP, Bardy GH, Favale S, Rea RF, Boriani G, Estes NA, III, Spirito P. Efficacy of implantable cardioverter-defibrillators for the prevention of sudden death in patients with hypertrophic cardiomyopathy. N Engl J Med. 2000;342:365–373. doi: 10.1056/NEJM200002103420601. [DOI] [PubMed] [Google Scholar]
- 3.Maron BJ, Estes NA, III, Maron MS, Almquist AK, Link MS, Udelson JE. Primary prevention of sudden death as a novel treatment strategy in hypertrophic cardiomyopathy. Circulation. 2003;107:2872–2875. doi: 10.1161/01.CIR.0000072343.81530.75. [DOI] [PubMed] [Google Scholar]
- 4.Davies MJ, McKenna WJ. Hypertrophic cardiomyopathy-pathology and pathogenesis. Histopathology. 1995;26:493–500. doi: 10.1111/j.1365-2559.1995.tb00267.x. [DOI] [PubMed] [Google Scholar]
- 5.Marian AJ, Roberts R. The molecular genetic basis for hypertrophic cardiomyopathy. J Mol Cell Cardiol. 2001;33:655–670. doi: 10.1006/jmcc.2001.1340. [DOI] [PMC free article] [PubMed] [Google Scholar]
- 6.Watkins H, Rosenzweig A, Hwang DS, Levi T, McKenna W, Seidman CE, Seidman JG. Characteristics and prognostic implications of myosin missense mutations in familial hypertrophic cardiomyopathy. N Engl J Med. 1992;326:1108–1114. doi: 10.1056/NEJM199204233261703. [DOI] [PubMed] [Google Scholar]
- 7.Marian AJ, Wu Y, Lim DS, McCluggage M, Youker K, Yu QT, Brugada R, DeMayo F, Quinones M, Roberts R. A transgenic rabbit model for human hypertrophic cardiomyopathy. J Clin Invest. 1999;104:1683–1692. doi: 10.1172/JCI7956. [DOI] [PMC free article] [PubMed] [Google Scholar]
- 8.Nagueh SF, Chen S, Patel R, Tsybouleva N, Lutucuta S, Kopelen HA, Zoghbi WA, Quinones MA, Roberts R, Marian AJ. Evolution of expression of cardiac phenotypes over a 4-year period in the beta-myosin heavy chain-Q403 transgenic rabbit model of human hypertrophic cardiomyopathy. J Mol Cell Cardiol. 2004;36:663–673. doi: 10.1016/j.yjmcc.2004.02.010. [DOI] [PMC free article] [PubMed] [Google Scholar]
- 9.Allessie MA, Schalij MJ, Kirchhof CJ, Boersma L, Huybers M, Hollen J. Experimental electrophysiology and arrhythmogenicity. Anisotropy and ventricular tachycardia. Eur Heart J. 1989;10(suppl E):2–8. doi: 10.1093/eurheartj/10.suppl_e.2. [DOI] [PubMed] [Google Scholar]
- 10.Schalij MJ, Lammers WJ, Rensma PL, Allessie MA. Anisotropic conduction and reentry in perfused epicardium of rabbit left ventricle. Am J Physiol. 1992;263:H1466–H1478. doi: 10.1152/ajpheart.1992.263.5.H1466. [DOI] [PubMed] [Google Scholar]
- 11.Panfilov AV. Is heart size a factor in ventricular fibrillation? Or how close are rabbit and human hearts? Heart Rhythm. 2006;3:862–864. doi: 10.1016/j.hrthm.2005.12.022. [DOI] [PubMed] [Google Scholar]
- 12.Nagueh SF, Kopelen HA, Lim DS, Zoghbi WA, Quinones MA, Roberts R, Marian AJ. Tissue Doppler imaging consistently detects myocardial contraction and relaxation abnormalities, irrespective of cardiac hypertrophy, in a transgenic rabbit model of human hypertrophic cardiomyopathy. Circulation. 2000;102:1346–1350. doi: 10.1161/01.cir.102.12.1346. [DOI] [PMC free article] [PubMed] [Google Scholar]
- 13.Patel R, Nagueh SF, Tsybouleva N, Abdellatif M, Lutucuta S, Kopelen HA, Quinones MA, Zoghbi WA, Entman ML, Roberts R, Marian AJ. Simvastatin induces regression of cardiac hypertrophy and fibrosis and improves cardiac function in a transgenic rabbit model of human hypertrophic cardiomyopathy. Circulation. 2001;104:317–324. doi: 10.1161/hc2801.094031. [DOI] [PMC free article] [PubMed] [Google Scholar]
- 14.Li L, Nikolski V, Efimov IR. Effects of lidocaine on shock-induced vulnerability. J Cardiovasc Electrophysiol. 2003;14:S237–S248. doi: 10.1046/j.1540.8167.90316.x. [DOI] [PubMed] [Google Scholar]
- 15.Fabritz CL, Kirchhof PF, Behrens S, Zabel M, Franz MR. Myocardial vulnerability to T wave shocks: relation to shock strength, shock coupling interval, and dispersion of ventricular repolarization. J Cardiovasc Electrophysiol. 1996;7:231–242. doi: 10.1111/j.1540-8167.1996.tb00520.x. [DOI] [PubMed] [Google Scholar]
- 16.Chen J, Liu W, Zhang H, Lacy L, Yang X, Song SK, Wickline SA, Yu X. Regional ventricular wall thickening reflects changes in cardiac fiber and sheet structure during contraction: quantification with diffusion tensor MRI. Am J Physiol Heart Circ Physiol. 2005;289:H1898–H1907. doi: 10.1152/ajpheart.00041.2005. [DOI] [PubMed] [Google Scholar]
- 17.Chen J, Song SK, Liu W, McLean M, Allen JS, Tan J, Wickline SA, Yu X. Remodeling of cardiac fiber structure after infarction in rats quantified with diffusion tensor MRI. Am J Physiol Heart Circ Physiol. 2003;285:H946–H954. doi: 10.1152/ajpheart.00889.2002. [DOI] [PubMed] [Google Scholar]
- 18.Fedorov VV, Hucker WJ, Dobrzynski H, Rosenshtraukh LV, Efimov IR. Postganglionic nerve stimulation induces temporal inhibition of excitability in rabbit sinoatrial node. Am J Physiol Heart Circ Physiol. 2006;291:H612–H623. doi: 10.1152/ajpheart.00022.2006. [DOI] [PubMed] [Google Scholar]
- 19.Severs NJ, Coppen SR, Dupont E, Yeh HI, Ko YS, Matsushita T. Gap junction alterations in human cardiac disease. Cardiovasc Res. 2004;62:368–377. doi: 10.1016/j.cardiores.2003.12.007. [DOI] [PubMed] [Google Scholar]
- 20.Chen PS, Shibata N, Dixon EG, Martin RO, Ideker RE. Comparison of the defibrillation threshold and the upper limit of ventricular vulnerability. Circulation. 1986;73:1022–1028. doi: 10.1161/01.cir.73.5.1022. [DOI] [PubMed] [Google Scholar]
- 21.Efimov IR, Cheng Y, Van Wagoner DR, Mazgalev T, Tchou PJ. Virtual electrode-induced phase singularity: a basic mechanism of defibrillation failure. Circ Res. 1998;82:918–925. doi: 10.1161/01.res.82.8.918. [DOI] [PubMed] [Google Scholar]
- 22.Khalighi K, Daly B, Leino EV, Shorofsky SR, Kavesh NG, Peters RW, Gold MR. Clinical predictors of transvenous defibrillation energy requirements. Am J Cardiol. 1997;79:150–153. doi: 10.1016/s0002-9149(96)00702-3. [DOI] [PubMed] [Google Scholar]
- 23.Almquist AK, Montgomery JV, Haas TS, Maron BJ. Cardioverter-defibrillator implantation in high-risk patients with hypertrophic cardiosmyopathy. Heart Rhythm. 2005;2:814–819. doi: 10.1016/j.hrthm.2005.05.008. [DOI] [PubMed] [Google Scholar]
- 24.Fenton F, Karma A. Fiber-rotation-induced vortex turbulence in thick myocardium. Phys Rev Lett. 1998;81:481–484. [Google Scholar]
- 25.Fenton F, Karma A. Vortex dynamics in three-dimensional continuous myocardium with fiber rotation: filament instability and fibrillation. Chaos. 1998;8:20–47. doi: 10.1063/1.166311. [DOI] [PubMed] [Google Scholar]
- 26.Qu Z, Kil J, Xie F, Garfinkel A, Weiss JN. Scroll wave dynamics in a three-dimensional cardiac tissue model: roles of restitution, thickness, and fiber rotation. Biophys J. 2000;78:2761–2775. doi: 10.1016/S0006-3495(00)76821-4. [DOI] [PMC free article] [PubMed] [Google Scholar]
- 27.Rappel WJ. Filament instability and rotational tissue anisotropy: a numerical study using detailed cardiac models. Chaos. 2001;11:71–80. doi: 10.1063/1.1338128. [DOI] [PubMed] [Google Scholar]
- 28.Dupont E, Matsushita T, Kaba RA, Vozzi C, Coppen SR, Khan N, Kaprielian R, Yacoub MH, Severs NJ. Altered connexin expression in human congestive heart failure. J Mol Cell Cardiol. 2001;33:359–371. doi: 10.1006/jmcc.2000.1308. [DOI] [PubMed] [Google Scholar]
- 29.Peters NS, Green CR, Poole-Wilson PA, Severs NJ. Reduced content of connexin43 gap junctions in ventricular myocardium from hypertrophied and ischemic human hearts. Circulation. 1993;88:864–875. doi: 10.1161/01.cir.88.3.864. [DOI] [PubMed] [Google Scholar]
- 30.Sanbe A, James J, Tuzcu V, Nas S, Martin L, Gulick J, Osinska H, Sakthivel S, Klevitsky R, Ginsburg KS, Bers DM, Zinman B, Lakatta EG, Robbins J. Transgenic rabbit model for human troponin I-based hypertrophic cardiomyopathy. Circulation. 2005;111:2330–2338. doi: 10.1161/01.CIR.0000164234.24957.75. [DOI] [PMC free article] [PubMed] [Google Scholar]
- 31.Bovendeerd PH, Arts T, Huyghe JM, van Campen DH, Reneman RS. Dependence of local left ventricular wall mechanics on myocardial fiber orientation: a model study. J Biomech. 1992;25:1129–1140. doi: 10.1016/0021-9290(92)90069-d. [DOI] [PubMed] [Google Scholar]
- 32.Bovendeerd PH, Huyghe JM, Arts T, van Campen DH, Reneman RS. Influence of endocardial-epicardial crossover of muscle fibers on left ventricular wall mechanics. J Biomech. 1994;27:941–951. doi: 10.1016/0021-9290(94)90266-6. [DOI] [PubMed] [Google Scholar]
- 33.Zhuang J, Yamada KA, Saffitz JE, Kleber AG. Pulsatile stretch remodels cell-to-cell communication in cultured myocytes. Circ Res. 2000;87:316–322. doi: 10.1161/01.res.87.4.316. [DOI] [PubMed] [Google Scholar]
Associated Data
This section collects any data citations, data availability statements, or supplementary materials included in this article.