

Abstract
Cell crawling is an inherently physical process that includes protrusion of the leading edge, adhesion to the substrate, and advance of the trailing cell body. Research into advance of the cell body has focused on actomyosin contraction, with cytoskeletal disassembly regarded as incidental, rather than causative; however, extracts from nematode spermatozoa, which use Major Sperm Protein rather than actin, provide at least one example where cytoskeletal disassembly apparently generates force in the absence of molecular motors. To test whether depolymerization can explain force production during nematode sperm crawling, we constructed a mathematical model that simultaneously describes the dynamics of both the cytoskeleton and the cytosol. We also performed corresponding experiments using motile Caenorhabditis elegans spermatozoa. Our experiments reveal that crawling speed is an increasing function of both cell size and anterior-posterior elongation. The quantitative, depolymerization-driven model robustly predicts that cell speed should increase with cell size and yields a cytoskeletal disassembly rate that is consistent with previous measurements. Notably, the model requires anisotropic elasticity, with the cell being stiffer along the direction of motion, to accurately reproduce the dependence of speed on elongation. Our simulations also predict that speed should increase with cytoskeletal anisotropy and disassembly rate.
INTRODUCTION
Most articles on amoeboid cell motility start by reciting (1–3) the canonical tripartite litany: extend and adhere at the front; advance the cell body; detach and recede at the rear. Though conceptually distinguished, these are not viewed as separate stages but rather, widely acknowledged (4,5) as tightly integrated physical processes. Even so, individual components of the whole mechanism have not received equal consideration. In prior experiments and mathematical models (6), there has been more focus on leading edge extension (7) rather than advance of the cell body, more focus on forces from cytoskeletal assembly (8–10) rather than disassembly, and more focus on the solid cytoskeleton rather than the fluid cytosol.
Research into causes for advance of the cell body (11,12) favors contraction of actin bundles by Myosin II as most likely. However, observations (13–15) of Dictyostelium discoideum amoeba show that motor function of Myosin II is not essential for cell crawling. Also, more recent experiments using Myosin IIA-deficient fibroblasts showed that the cells without myosin migrate faster than wild-type cells (16). Therefore, it is possible that the translocation of the cell during crawling is driven partially by the dynamics of the actin network without the action of molecular motors. Indeed, biomimetic constructs of actin (17,18) show that polymer network collapse can generate forces, whether myosin acts as a motor or not. Whatever the role of myosin is in cell motility, constructing quantitative models for cell crawling will require untangling the physics of the cytoskeleton from the action of molecular motors.
Nematode spermatozoa provide an excellent model system for studying the basics of cell crawling in the absence of molecular motors. Unlike most other crawling cells, nematode sperm utilize a cytoskeleton composed of a network of Major Sperm Protein (MSP). This protein forms nonpolar filaments, to which no molecular motors are known to associate (19). However, the motility of these cells still exhibits all three fundamental processes required for standard crawling motility. In these cells, polymerization at the leading edge is believed to drive advance of the front of the cell (20). The molecular level mechanism for adhesion of these cells to the substrate is still unknown. Based on in vitro experiments, depolymerization of the cytoskeletal network has been proposed as the force-producing mechanism for pulling up the rear (21,22).
Cell motility experiments often focus on the cytoskeleton, although it occupies only a small fraction of typical crawling cells, by volume. Observations of cell blebbing (23,24) and Walker carcinoma cells (25) suggest that cytosolic pressure can drive cell extension in regions of cytoskeletal disruption, and there is evidence (26) that intracellular pressure provides the motive force for Amoeba proteus cells. In this article, simulations of nematode spermatozoon crawling demonstrate a realistic motility mechanism that relies, in part, on cytosolic forces.
Spermatozoa from the nematode Caenorhabditis elegans routinely exhibit steady, amoeboid crawling on prepared surfaces. The salient features of a steadily crawling spermatozoon include an active, laminar pseudopod at the front, and a passive, domed cell body at the back (Fig. 1). The pseudopod develops transient ruffles and peripheral bulges but otherwise conforms to a characteristic, overall cell geometry, including persistent elongation in the direction of motion. Extension of the pseudopod and advance of the cell body are not separate stages but rather occur in unison. Variant morphologies and motilities have been catalogued (27), including periodic velocity cycles (28), but steadily crawling spermatozoa are most amenable to quantitative measurement and mathematical modeling.
FIGURE 1.

Side-view schematic of a crawling nematode sperm. Polymerization at the leading edge pushes the front of the cell forward. Spatially varying adhesion anchors the cell to the substrate and provides traction. Depolymerization of the cytoskeleton produces contractile force which pulls the cell body forward. Pseudocolor roughly represents polymer volume fraction.
In this article, we construct a mathematical model to describe the crawling motility of nematode sperm. This model simultaneously accounts for the dynamics of the cytoskeleton and the cytosol, with cytoskeletal disassembly as the mechanism for producing the force that advances the cell body (Fig. 1). Previous models (29–31) have succeeded in capturing certain features of preexisting data but support for our model includes validation against quantitative experiments. To test the results of our model, we measured size, shape, and crawling speed of C. elegans sperm. Consistent with a previous experiment (32), we found that larger cells crawl faster than smaller cells. Furthermore, cells that are elongated in their direction of motion crawl more rapidly than rounder cells. The model that we propose here accurately reproduces the dependence of crawling speed on cell size and shape, but requires that the cell be stiffer in its direction of motion than perpendicular to it. This requirement for anisotropy is justified by a realistic physical interpretation. We find that cell speed increases with this elastic anisotropy and also increases with the cytoskeletal disassembly rate.
METHODS
Dissection of sperm
Following Royal et al. (28), wild-type C. elegans males were isolated and dissected in 8 μl of sperm medium (50 mM HEPES, pH 7.0, 50 mM NaCl, 25 mM KCl, 1 mM MgSO4, 5 mM CaCl2, 8 mg/ml Polyvinylpyrrolidone, 0.4 mg/ml Pronase (33)). Liberation of the spermatids and testis was achieved by cutting the worm with a 20 g needle ∼1/3 the distance from the posterior end of the worm (34).
Coverslip preparation
Slides and coverslips (45 × 50 mm lower slide and 20 × 20 mm coverslip) were washed with 1% Alconox detergent (Alconox, White Plains, NY), rinsed with distilled water, and left to air-dry at room temperature. Cleaned slips were then coated with polylysine. Twenty microliters of 10 μg/ml polylysine was placed on one cover slide while a second cover slide was stacked on top, sandwiching the solution. These slides were carefully separated and air-dried at room temperature. Sperm buffer with the activating reagent monensin consisted of 50 mM HEPES pH 7.0, 50 mM NaCl, 25 mM KCl, 5 mM, 1 mM MgSO4, and 1 mg/ml bovine serum albumin (35).
Imaging of crawling cells
The sperm, in sperm media, were mounted between a 45 × 50 mm lower coverslip and a 20 × 20 mm upper coverslip, prepared as described above, supported by Vaseline applied between the coverslips in two parallel strips 1.5 cm apart by a 30 g needle. Time series of the sperm were recorded on a model No. TE300 inverted microscope (Nikon, Melville, NY) using a 100×, 1.4 NA PlanApo objective with differential interference contrast (DIC) optics. A SensiCam charge-coupled device camera (Cooke, Romulus, MI) was used to capture 12-bit digital images.
Pseudofluorescent image processing
DIC microscopy provides high contrast images derived from changes in the refractive index within a sample; the method works best for reasonably transparent materials, such as nematode sperm cells. Crudely, a DIC image is created by breaking the incident light into two paths before sending it through the sample. The light in one of these paths is phase-shifted by an angle 2ψ0 and translated spatially along a shear direction. Once through the sample, the light is recombined. This process highlights gradients in the index of refraction along the shear direction. The intensity of a DIC image, I, can be written as (36)
 |
(1) |
where a is the amplitude, Δa is the difference in amplitude, and Δθ is the change in phase angle between the two paths. If θ0 is the phase angle in the absence of a cell, then θ–θ0 is roughly proportional to the index of refraction inside the cell times the cell thickness. Therefore, θ > θ0 inside the cell and is equal to θ0 outside the cell. We calculate θ from our images by minimizing the difference between the grayscale image intensity in our DIC images and the value expected from Eq. 1 (full details of this method will be published in an upcoming article). Because the index of refraction inside the cell is larger than outside, the reconstructed θ is large (bright) inside the cell and small (dark) outside the cell. We threshold the cells by weighting the value of θ by the magnitude of the gradient of θ. An initial thresholding determines the region of the cell body. Then, setting the value of θ inside the cell body equal to the minimum value of θ inside the cell body, we re-threshold the θ intensity, which gives us a binary image of the region of the whole cell. We use the MatLab (The MathWorks, Natick, MA) image processing toolbox with these binary images to extract the area and the major and minor axes of the cells.
Cytoskeletal velocity measurement using spatio-temporal correlation
The pseudopodia of nematode sperm have sharp, persistent features (MSP bundles) that are visible in DIC images. For a sequence of successive images taken at short time intervals, spatial correlation of successive images allows tracking of these cytoskeletal features within a cell as it crawls. We denote the image intensity at position x and time t as It(x). The intensity at position x′ and time t + Δt is It+Δt (x′). We then calculate the normalized cross-correlation coefficient, R, which has been used to measure the deformation of elastic substrata during cell crawling (37),
 |
(2) |
where the summation over δ visits pixels from a range of ∼−10 to 10 along both the x and y directions. Background subtraction is performed on each image before correlating intensities. We only do our computations for a regularly spaced subset of pixels (approximately one out of every eight) that lie inside the thresholded cell region. The value of x′ where R is a maximum defines the velocity at point x as v = (x′ − x)/Δt.
DEPOLYMERIZATION MODEL FOR NEMATODE SPERM CRAWLING
In this section we describe qualitatively our model for nematode sperm motility. The complete mathematical description of the model is included in the Appendix.
Our model focuses on steadily crawling C. elegans sperm cells. We assume that during crawling the cells maintain a fixed volume, which is consistent with the experimental observation that a spermatozoon retains the volume it had as a spermatid (38), and seems reasonable since regulation of cell volume is widely acknowledged (39,40) as a common trait of most eukaryotic cells. Our model includes cytosolic flow and substrate adhesion, along with anisotropic elasticity of the cytoskeleton and cytoskeletal assembly and disassembly. A detailed description of these features and their consequences for motility follows.
Cytoskeletal assembly and disassembly
Purified extracts from Ascaris suum spermatozoa exhibit both cytoskeletal assembly and disassembly. In cultured mixtures of MSP, adenosine triphosphate, and cytosolic factors (41), a vesicle made of spermatozoon membrane develops a fibrous, columnar tail (42); stable MSP dimers assemble into helical subfilaments, pairs of subfilaments entangle to form helical filaments, and filaments associate into fiber complexes (43). In a buffer solution, without adenosine triphosphate or cytosolic factors, fiber complexes slowly disassemble and fade away (22), with more rapid fading (Fig. 2 B) if cytosolic factors are restored, along with a tyrosine phosphatase (21). In this article, “assembly” refers collectively to all hierarchical stages of molecular interaction during fiber complex growth, while “disassembly” or “depolymerization” refer to the complete inverse process.
FIGURE 2.

(A) Surface striations are visible in a DIC image of a crawling C. elegans spermatozoon, suggesting ridges and furrows of unequal cytoskeletal density, inside the cell. Pointers show the beginning, middle and end of one ridge. (B) In a time series of images, taken at 3-min intervals, a cultured MSP fiber complex grows shorter and fainter simultaneously. The column becomes increasingly faint as loss of MSP decreases the optical density. Axial shrinkage exceeds radial shrinkage, suggesting anisotropic cytoskeletal stress. Fiber complex images (B) from Miao et al. (21). (Reprinted with permission from the American Association for the Advancement of Science.)
Assembly and disassembly of fiber complexes has not been investigated using C. elegans sperm extracts; where information is not available for MSP from C. elegans, we use results from A. suum in our model. There are differences in the MSP from these two species, such as MSP filaments from C. elegans tending to form parallel rafts, leaving few isolated strands, whereas filaments from A. suum tend to twist around one another, while leaving multiple strands unbound (44). However, individual MSP filaments from the two nematodes are indistinguishable by electron microscopy (44). In addition, at the whole cell level, we have observed surface striations on C. elegans spermatozoa (Fig. 2 A), which appear similar to the features identified as fiber complexes inside crawling A. suum spermatozoa (42,45,46).
Anterior pseudopod extension
Experiments show that cytoskeletal assembly is localized at the membrane of crawling A. suum spermatozoa. In cell extracts, fiber complexes grow by incorporating new fibers at only one end (42,47), distinguished by a vesicle derived from plasma membrane. Vesicle propulsion achieves rates comparable to anterior extension in whole spermatozoa, while the trailing fiber complex behind a vesicle remains stationary. Experiments on whole cells (48) show that cytoskeletal assembly occurs at the leading edge and is spatially separated from disassembly. In both extracts and whole cells, cytoskeletal assembly requires an integral membrane phosphoprotein (49). These observations justify our decision to handle cytoskeletal assembly as a boundary condition at the periphery of the crawling spermatozoa, in order to focus on cytoskeletal disassembly and mechanical response throughout the interior.
Our model imposes steady crawling on real cell shapes to compute the requisite driving forces. Cytoskeletal stress and cytosolic pressure must provide the force required for anterior pseudopod extension, against membrane tension and external hydrostatic pressure. This boundary condition on stress sets the density of MSP filaments at the membrane without modeling assembly explicitly.
The model includes membrane tension γ as a parameter. The membrane tension for nematode spermatozoa has never been measured. We, therefore, estimated this number based on values that have been determined for other cells. In simulations, we used a value of 25 pN/μm, which was measured for blood granulocytes (50,51) and is consistent with values between 8 pN/μm and 48 pN/μm that were measured for rat basophilic leukemia cells (52).
Depolymerization drives advance of the cell body
Contraction accompanies cytoskeletal disassembly within cultured fiber complexes. In a time series of phase-contrast images, a fiber complex becomes successively fainter and shorter (Fig. 2 B). Compared to the background, grayscale values at each point reflect the MSP content of the fiber complex (47), indicating steady loss of MSP filaments throughout the fiber complex as it contracts (21). The change in length of a contracting fiber complex is directly related to the extent of constituent MSP filament loss (22). Fiber complex contraction can pull a bead that is attached at the terminus (21), showing that this contraction is capable of producing force. Experiments on A. suum spermatozoa suggest that cytoskeletal disassembly results in the advance of the cell body (48). Starting from these observations, further analysis suggests that disassembly strains the cytoskeleton and supports a model in which stress depends on the density of MSP filaments within a fiber complex (22).
For random, thermal fluctuation of flexible polymer, entropy favors crumpled polymer configurations, which are more numerous and therefore more probable than uncrumpled configurations. Partial loss of polymer by cytoskeletal disassembly yields greater freedom for crumpling of whatever polymer remains, which can lead to entropic contraction. A more detailed treatment (31,53) describes a cytoskeletal network immersed in cytosol as a polyelectrolyte gel (54). These models include effects which can counteract contraction, such as polymer flexibility, counterion concentration, and the mobility of the monomer. However, direct observation of retracting fiber complexes (Fig. 2 B) provides strong evidence for contraction by disassembly within MSP fiber complexes, and, therefore, we assume that the material parameters for the MSP cytoskeleton are such that cytoskeletal disassembly leads to contraction. Consequently, in our model, stress depends on the cytoskeletal volume fraction, φ, which is the fraction of space occupied by MSP filaments for any small volume element within a cell. For simplicity, we assume a linear relation between the cytoskeletal stress and changes in the φ, such that partial disassembly of the cytoskeleton produces stress in the remaining MSP network and causes it to contract. We do not represent the cell body explicitly but adjust the cytoskeletal disassembly rate so that the rear of the spermatozoon advances due solely to cytoskeletal contraction.
The model includes the unstressed volume fraction, φ0, as a parameter. Since the total concentration of MSP monomer in the cytosol is 4 mM (46), we estimate a value of 5–7% for the total volume fraction of MSP (in polymer and solution). The amount of MSP in polymer form has not been measured in these cells. Therefore, we assume that roughly half of the MSP is in polymer form and use values of φ0 between 2% and 5% in our simulations.
Cytoskeletal anisotropy
Internal fiber complexes manifest as surface ridges on A. suum spermatozoa (48). A sparse network of MSP filaments connects the dense fiber complexes, which span the pseudopod from the leading edge to the cell body (45). The disposition of cultured MSP filaments from C. elegans, described above, is somewhat different (44), yet surface striations on motile cells (Fig. 2 A) suggest ridges and furrows of unequal cytoskeletal density. If so, anterior-posterior compression then meets resistance from high density ridges, while transverse compression can simply move the ridges closer together by distorting low density intervening material (Fig. 3 A). This yields anisotropic elasticity at the cellular level from an inhomogeneous distribution of MSP filaments, with no need for anisotropy of the MSP at the molecular level. More precisely, anterior-posterior compression acts on stiff springs in parallel with pliable springs (Fig. 3 B), while transverse compression acts on stiff and pliable springs in series (Fig. 3 C), which yields a lower effective spring constant in the latter case. This reasoning supports our decision to include anisotropic cytoskeletal elasticity in our model.
FIGURE 3.

(A) Surface ridges on C. elegans spermatozoa resemble corresponding features of A. suum in which a sparse network of MSP filaments connects dense fiber complexes. Anterior-posterior compression (B) then meets resistance from high density ridges, which act as stiff springs, while transverse compression (C) can simply move the ridges closer together by distorting low-density intervening material, in regions which act as pliable springs, with a greater effective spring constant for stiff and pliable springs in parallel, compared to stiff and pliable springs in series.
In addition, cultured fiber complexes from A. suum also exhibit anisotropic elasticity. This is somewhat surprising since the symmetry of MSP dimers (55) leads to filaments with no polarity (19) that seem randomly oriented in micrographs (42) and platinum replicas (21,49) of fiber complexes. Even so, in a time series of images (Fig. 2 B), the fractional change in length of a shrinking fiber complex is readily apparent from one frame to the next, while the fractional change in radius is almost imperceptible. This suggests unequal axial and radial strains since uniform fading indicates disassembly throughout the fiber complex, not just at the ends. Quantitative analysis (22) confirms incommensurate changes in length and radius, which are entirely consistent with anisotropic elasticity although available data suggest no obvious molecular mechanism.
Our model describes the cytoskeletal stiffness and anisotropy using the parameters σ0 and α, respectively. The value of σ0 sets the resistance to anterior-posterior compression or extension, while α is the multiplicative factor by which σ0 exceeds stiffness in the transverse direction. In simulations, we used values for σ0 on the order of one atmosphere, which is comparable to the value that was estimated previously by fitting experiments on retraction of MSP fiber complexes (22). Experiments offer no clear suggestion for α so we tried a range of values.
Cytosolic flow
In crawling nematode spermatozoa, anterior cytoskeletal assembly pulls MSP dimers out of the cytosol, while posterior disassembly puts dimers back into solution. This suggests a model, like ours, that reflects interaction between solid and fluid phases of the cytoplasm. Under steady crawling, advance of the cytosol requires a pressure gradient, just as cytoskeletal displacement depends on a stress gradient. These cytosolic and cytoskeletal driving forces must balance against intracellular drag, since inertia is comparatively insignificant at cellular viscosity and length scales. The model treats dimers implicitly in terms of volume transferred between the cytoskeleton and the cytosol.
Cell membranes are not completely impermeable to water. Therefore, our model allows transmembrane fluid flow. Internal pressures below ambient hydrostatic pressure pulls fluid into the cell, and, conversely, pressures that exceed atmospheric pressure push fluid out. Since our model imposes fixed cell volume, any fluid that flows into the cell must be balanced by outflow somewhere else.
The drag force for movement of the cytoskeleton through the cytosol is proportional to the velocity difference between the solid and the fluid; the intracellular drag coefficient ζ0 is the constant of proportionality. The model also includes membrane permeability kf as a parameter, where kf is the filtration coefficient, which sets membrane permeability to fluid, rather than ions. In simulations, we typically used a value of 20 pN/μm2 for ζ0, which has been measured for polyacrylamide gels (57) and is comparable to estimates of 16 pN/μm2 for neutrophils (51). We used a value of 1.65 × 10⁻⁶ μm3/pN/s for kf, based on measurements for glioma cells (58). This is comparable to a value of 1.27 × 10⁻⁶ μm3/pN/s for human erythrocytes (59) but slightly conservative compared to values of 10.9 × 10⁻⁶ μm3/pN/s for squid axons (60) or 15.7 × 10⁻⁶ μm3/pN/s for dog alveolar macrophages (61).
Substrate adhesion
Steady crawling requires traction. Without anchorage, opposite ends of a contracting fiber complex both move toward the center of mass (Fig. 2 B), but steady crawling moves the anterior and posterior ends of a spermatozoon in the same direction (Fig. 4, A and B). This suggests a model which makes it hard to slide backward at the front, yet easy to slide forward at the back. Our model employs large extracellular drag beneath the pseudopod and small drag beneath the cell body. This is consistent with displacement of cytoskeletal features in A. suum spermatozoa (20,48), which we have confirmed for C. elegans as well (Fig. 5).
FIGURE 4.

A typical C. elegans spermatozoon advances nearly 3 μm in 5 s (A and B), with little change in shape. The cell has a domed body at the rear (C) and a laminar foot, at the front. Given an empirically determined shape, simulations predict the peripheral cytoskeletal assembly rate (C) for a steadily crawling cell, with a maximum of 0.4 μm/s at the leading edge. Simulations represent transmembrane adhesion as external drag (D), with strong adhesion at the front and weak adhesion under the cell body. Relative to the assembly rate, arrows for fluid flux (E), cytosolic velocity (G) and cytoskeletal velocity (I) are scaled by factors of 500, 5, and 1, respectively. For ease of comparison with preexisting empirical data, transmembrane fluid flow and cytosolic velocity are plotted in a frame that moves with the cell while cytoskeletal velocity is plotted in a fixed laboratory reference frame. Simulations also yield cytosolic gauge pressure (F) and the magnitude of cytoskeletal stress (H), determined from anterior-posterior and transverse components.
FIGURE 5.

Trackable features of a crawling spermatozoon manifest as surface mottling in a DIC image (above). Feature tracking gives an average speed near 0.4 μm/s for the cell body (below). Velocities for the anterior cytoskeleton are markedly lower and, from observation, slightly retrograde. Near the edge of the cell, tracking detects the stationary background, resulting in spuriously low values at some peripheral pixels.
The model includes anterior and posterior extracellular drags as parameters. Results depend on the ratio of these drags to intracellular drag. In simulations, we used values of 512 ζ0 and 32 ζ0 for anterior and posterior extracellular drags, respectively, where ζ0 is the intracellular drag, defined previously. These estimates are consistent with measurements of traction force and velocity for epithelial fish keratocytes (62), which can be estimated by dividing the measured traction stress by the cytoskeletal velocity. Since adhesion is likely to depend on the surface beneath a cell, in addition to variation between species, we tried a range of other extracellular drag values as well.
EXPERIMENTAL RESULTS
Cell speed versus size and shape
We used differential interference contrast (DIC) microscopy to observe 45 cells and collected digital images at 1-s intervals, producing 1961 individual frames for analysis. Reliable, automated tracking of motile cells hinged on transforming DIC images into pseudofluorescent images, using an original algorithm (see Methods for a more complete description). In some instances, tracked cells appeared to briefly detach from the substrate and then slew sideways or backward, before regaining traction and then resuming steady crawling. These events were detected as statistical anomalies and excluded from trend analysis, leaving 1242 usable frames.
Our tracking algorithm gave the geometry of the crawling cells in the plane of the substrate. First and second moments of the area distribution then determined the cell centroid along with maximum and minimum diameters. For each image in a sequence, instantaneous velocity was calculated using centroid displacement from the frame behind to the frame ahead of the current frame, divided by twice the time interval between frames. Cell elongation along the direction of motion was computed as (a − b)/min(a, b) where a and b are the anterior-posterior and transverse cell diameters, respectively. Elongation increases linearly as the ratio of a to b increases, with a value of zero for a circular cell. Steady crawling often includes slight yet systematic changes in cell speed and geometry, over several seconds. Therefore, analysis treats the frames from each digital recording independently, rather than averaging over each cell.
Average values of length, width, and speed for the cells in our experiments were 7.3 ± 0.9 μm, 4.2 ± 0.4 μm, and 0.24 ± 0.09 μm/s, respectively, which is consistent with average values reported previously (28). While crawling, each spermatozoon changed area by <4%, over the period of observation. We observed an increase in crawling speed with increased cell area (Fig. 6 C), consistent with prior reports (32) of larger speeds for cells with greater volume. Crawling speed also increases with increased anterior-posterior elongation (Fig. 6 B).
FIGURE 6.

Speed versus size (B) and shape (C). Simulations employ real cell shapes with a range of elongations (shapes A, corresponding points B). (B and C) Scattered data points show the experimental results. Working in dimensionless variables allows scaling of each shape to cover the full range of areas. Simultaneous regression shows that crawling speed depends on both cell elongation and the square root of cell area (R2 = 0.57). Compared to the best fit (black lines, B and C), results for simulations with anisotropy (white lines, R2 = 0.52) fall within one standard deviation (gray shading). The fit for simulations without anisotropy (dashed lines) is not as good (R2 = 0.25). All coefficients of determination are statistically significant (p < 0.001)
Graded substrate adhesion
Within a crawling spermatozoon, obtrusive knobs and ridges develop at the leading edge and then hold station or slowly drift backward, until overrun by the trailing cell body. These protuberant features within the pseudopod have been identified as branching fiber complexes, in A. suum spermatozoa (20,48). Correlation between features from successive frames of a digital recording yields incremental cytoskeletal displacements (for details, see Methods). Dividing each displacement by the time interval between frames then gives cytoskeletal velocities throughout the pseudopod. By the same method, static, papillary surface texture allows tracking of the cell body, as a whole.
Feature tracking gives drastically different results for the pseudopod and cell body of a steadily crawling spermatozoon, with velocities differing widely in both direction and magnitude (Fig. 5). Within the pseudopod, minuscule, slightly retrograde cytoskeletal velocities suggest strong adhesion to the substrate below. In stark contrast, the rear of the cell moves forward rapidly, suggesting weak adhesion beneath the cell body. The apparent transition from high to low adhesion is quite sharp, occurring at a location just in front of the cell body. These results support the extracellular drag gradient that we chose for our model (Fig. 4 D).
Model validation and results
To test our model, we computed the dependence of crawling speed on cell size and shape, for comparison with our experimental results. Simulations employed 10 empirically determined cell shapes (see Methods for a description of how these geometries were determined). The chosen shapes roughly cover the full range of cell elongation, from experiments (Fig. 6, A and B). Working in dimensionless variables allowed scaling of each shape to cover the full range of measured cell areas. With units then restored, simulations gave crawling speed as a function of cell size.
Treating size and shape simultaneously, we fit our simulation results to our experimental data by minimizing the mean-squared difference using cytoskeletal anisotropy and the rate of cytoskeletal disassembly as free parameters. Simulations then reproduce the observed increase in crawling speed with increased anteroposterior elongation (Fig. 6 B) and simultaneously reproduce the observed increase in crawling speed for increasingly larger cells (Fig. 6 C). For a strong adhesion gradient (Fig. 4 D), simulations roughly capture the velocity field obtained from cytoskeletal tracking, with small rearward velocities for the pseudopod compared to large forward velocities for the cell body (compare Fig. 5 and Fig. 4 I).
To quantify agreement between experiments and simulations, for different parameter values, we computed coefficients of determination (R2) from the square of the correlation between empirical measurements and corresponding simulation results. In our simulations we varied cytoskeletal stiffness, intracellular drag, extracellular drag, cytoskeletal anisotropy, and the unstressed volume fraction. As a basis for comparison, fitting a plane to experimental data (Fig. 6, B and C) confirms the dependence of crawling speed on both cell size and cell shape (R2 = 0.57). The fit for quadratic polynomial was only slightly better (R2 = 0.60). Experimental accuracy limits the quality of these fits and there is no reason to expect that simulations can do better. Coefficients of determination for these and all subsequent fits are statistically significant (p < 0.001).
A good fit to experiments requires anisotropy in simulations. Prior experiments or calculations set at least the order of magnitude for all other parameters (Table 1). For these estimates, any degree of anisotropy in simulations gave a better fit to experiments than a simulation without anisotropy (Fig. 7). Increasing anisotropy beyond 10:1 gave little further improvement. For a range of other parameter values (Table 2), the best fit with anisotropy (R2 = 0.52) was significantly better than any result without anisotropy (R2 ≤ 0.25). Our initial parameter estimates (Table 1) and 10:1 anisotropy gave some of the best agreement with experiments. Unless otherwise specified, we used those values in all simulations.
TABLE 1.
Model parameters
 |
FIGURE 7.

Fitting simulation results to experimental data yields an increased coefficient of determination (R2) as cytoskeletal anisotropy increases. Simulations with greater intracellular drag (ζ0) require less anisotropy to achieve the same degree of agreement with experiments.
TABLE 2.
Coefficients of determination for a range of parameter values
| Posterior drag
|
|||||
|---|---|---|---|---|---|
| (ζf, α, φ0, σ0) | 3 | 8 | 16 | 32 | 64 |
| (64, 1, 0.02, 1) | 0.142 | 0.189 | 0.227 | 0.022 | 0.000 |
| (128, 1, 0.02, 1) | 0.136 | 0.183 | 0.228 | 0.071 | 0.005 |
| (512, 1, 0.02, 1) | 0.135 | 0.185 | 0.247 | 0.252 | 0.125 |
| (64, 6, 0.02, 1) | 0.126 | 0.218 | 0.319 | 0.426 | 0.410 |
| (128, 6, 0.02, 1) | 0.133 | 0.230 | 0.336 | 0.449 | 0.445 |
| (512, 6, 0.02, 1) | 0.148 | 0.248 | 0.365 | 0.493 | 0.502 |
| (64, 1, 0.05, 1) | 0.134 | 0.182 | 0.218 | 0.026 | 0.001 |
| (128, 1, 0.05, 1) | 0.128 | 0.177 | 0.218 | 0.069 | 0.006 |
| (512, 1, 0.05, 1) | 0.123 | 0.175 | 0.231 | 0.191 | 0.102 |
| (64, 6, 0.05, 1) | 0.134 | 0.218 | 0.315 | 0.415 | 0.405 |
| (128, 6, 0.05, 1) | 0.138 | 0.226 | 0.327 | 0.437 | 0.427 |
| (512, 6, 0.05, 1) | 0.149 | 0.244 | 0.353 | 0.462 | 0.470 |
| (64, 1, 0.02, 10) | 0.130 | 0.179 | 0.214 | 0.028 | 0.001 |
| (128, 1, 0.02, 10) | 0.124 | 0.174 | 0.214 | 0.068 | 0.006 |
| (512, 1, 0.02, 10) | 0.119 | 0.172 | 0.225 | 0.172 | 0.086 |
| (64, 6, 0.02, 10) | 0.114 | 0.207 | 0.305 | 0.406 | 0.399 |
| (128, 6, 0.02, 10) | 0.119 | 0.213 | 0.314 | 0.417 | 0.414 |
| (512, 6, 0.02, 10) | 0.124 | 0.225 | 0.330 | 0.435 | 0.439 |
| (64, 1, 0.05, 10) | 0.129 | 0.179 | 0.213 | 0.029 | 0.001 |
| (128, 1, 0.05, 10) | 0.124 | 0.174 | 0.213 | 0.068 | 0.006 |
| (512, 1, 0.05, 10) | 0.118 | 0.172 | 0.224 | 0.169 | 0.083 |
| (64, 6, 0.05, 10) | 0.129 | 0.213 | 0.309 | 0.407 | 0.399 |
| (128, 6, 0.05, 10) | 0.132 | 0.217 | 0.317 | 0.416 | 0.418 |
| (512, 6, 0.05, 10) | 0.135 | 0.225 | 0.328 | 0.429 | 0.432 |
The table shows R2 values for the best fit between simulations and experiments. Anterior (ζf) and posterior extracellular drag are given as multiples of ζ0, which is the intracellular drag coefficient. Model parameters α, φ0, and σ0 are anisotropy, unstressed volume fraction, and cytoskeletal stiffness, respectively. We estimate that the maximum R2 value is ∼0.60 due to experimental uncertainty.
Along with 10:1 anisotropy, fitting simulations to experiments gives 0.05 s−1 as the disassembly rate for the MSP cytoskeleton within C. elegans spermatozoa. This is comparable to a rate of ∼0.03 s−1 for actin network disassembly within other eukaryotic cells (63–65). The former rate includes dissociation of MSP fibers from complexes while the latter rate includes severing and uncapping of actin filaments (66). In both cases, subsequent depolymerization is comparatively rapid.
As expected, disassembly of cell-free fiber complexes is slower than cytoskeletal disassembly within whole cells. Fiber complexes of MSP shrink at a rate of 1.7 ± 0.7 μm/min, from previous measurements (21), which is roughly 10 times slower than crawling speeds for whole cells. In correspondence, fiber complexes have a disassembly rate of 2.3 × 10⁻³ s−1 from previous analysis (22), which is ∼20 times slower than the cytoskeletal disassembly rate that we predict for whole cells. This is consistent with actin network disassembly for which rate constants in whole cells can be orders-of-magnitude greater than rates measured for in vitro cell extracts (67,68).
The anterior cytoskeletal assembly rate in simulations (Fig. 4 C) is comparable to average measured rates of 0.2 μm/s near the vesicles of growing fiber complexes, with 0.6 μm/s as the maximum observed value. Observations of steadily crawling A. suum spermatozoa (20,47) reveal that the cytoskeleton maintains close contact with the cell membrane. Imposing steady crawling in simulations sets peripheral membrane displacement, which influences internal cytoskeletal displacement, but does not force the cytoskeleton and the membrane to move with the same velocity, at the boundary. At the leading edge, the cytoskeletal velocity fails to keep pace with the membrane, and assembly of new MSP is required to fill the gap. Simulations yield the rate of cytoskeletal assembly from the difference between membrane and cytoskeletal velocities.
Simulations predict an intracellular pressure gradient (Fig. 4 F) and consequent cytosolic flow. The cytosol is not entrained with the cytoskeleton (compare Fig. 4, G and I), which demonstrates the importance of treating solid and fluid phases independently. For any small region of a cell, the pressure gradient gives the force that propels the cytosol. At the same point, force derived from cytoskeletal stress can be >10-times larger in magnitude but, summed over the entire cell, cytoskeletal force components tend to cancel while cytosolic forces accumulate and ultimately account for roughly 36% of the total driving force on a typical C. elegans spermatozoon. Simulations give a maximum traction stress of ∼1 nN/μm2, which falls in the range of measured values for both dog epithelial cells (69) and fish epidermal keratocytes (70).
The pressure gradient in the cytosol is largely along the anterior-posterior axis (Fig. 4 F). Consequent forces are directed toward the front of the cell and have almost no transverse component, thereby complimenting cytoskeletal anisotropy, which also yields greater force along the anterior-posterior axis. With greater intracellular drag, the cytosol exerts more force on the cytoskeleton and simulations with low anisotropy then show improved agreement with experiments (Fig. 7).
This model makes two other experimentally testable predictions. First, simulations predict increased crawling speed with increased anisotropy. Crawling speed plummets for anisotropy below optimum and begins to asymptote for greater anisotropy (Fig. 8 A). Second, we explored the dependence of the steady crawling speed on the cytoskeletal depolymerization rate. We found that the speed increases roughly linearly with depolymerization for all elongations (Fig. 8 B). Another interesting feature of our model is that permeability of the membrane to fluid produces a small influx of fluid at the leading edge (Fig. 4 E).
FIGURE 8.

Simulations allow independent manipulation of cytoskeletal anisotropy and disassembly, with cell size and all other parameters held fixed. With disassembly fixed, crawling speed increases rapidly with anisotropy (A). With fixed anisotropy, crawling speed increases with increasingly rapid cytoskeletal disassembly (B).
DISCUSSION
Here we have shown that depolymerization of the MSP network can quantitatively account for the dependence of C. elegans sperm crawling speed on cell size and shape. Our model fits the experimental data with a reasonable value for the depolymerization rate of the MSP network and requires the cytoskeleton to be anisotropic. This requirement of anisotropy is well justified by two observed features of the MSP network. First, the cytoskeleton of an A. suum spermatozoon is composed of MSP fiber complexes, which lie roughly parallel to the translational direction (46) and there is evidence of dense cytoskeletal ridges in C. elegans spermatozoa as well. Second, contraction induced in comet tails of MSP formed behind vesicles requires anisotropy to explain the rate of change of the length of the comet tail with respect to the rate of change of the diameter (21,22,54). Anisotropic cytoskeletal elasticity has yet to receive widespread consideration but our model demonstrates that anisotropy might be advantageous for any cell that needs to migrate rapidly. Indeed, keratocytes are known for rapid crawling and provide an example where cytoskeletal anisotropy might be important (71,72).
The effects of cytoskeletal disassembly and cytosolic forces need not be limited to C. elegans spermatozoa. Even cells that employ molecular motors must include cytoskeletal disassembly, as a counterbalance to anterior assembly. Therefore, the locomotive efficacy of cytoskeletal disassembly merits study, as a means of understanding possible contributions to a compound mechanism. Bovine aortic endothelial cells employ actin for motility yet exhibit increased speed with increased rates of cytoskeletal turnover (73), consistent with simulations based on MSP disassembly (Fig. 8 B). Interestingly, the slope of speed versus turnover rate in these experiments is ∼3 μm, which is similar to the value of 5 μm predicted by our model. There is also some evidence (74) that cytosolic pressure contributes to motility of keratocytes, which are usually regarded as a model for motility based on actin and myosin. Keratocytes also exhibit increased speed as width perpendicular to the crawling direction decreases (62). This has not been directly addressed in prior models but is consistent with possible roles for cytoskeletal depolymerization and cytosolic flow, as in our model.
Leading edge fluid influx is a prediction of our model which might have implications for anterior cell extension. The proposed Brownian ratchet mechanism (75) for protrusion depends on thermal fluctuation opening a gap between the membrane and existing cytoskeletal polymer for insertion of new monomers into the network. Leading edge fluid influx might advance the membrane, by inflation, and thus reduce the load on protrusive, cytoskeletal polymer. Consistent with this picture, our model showed a small decrease in polymer stress as the membrane permeability to fluid was increased (results not shown). Since fluctuations need only make space for a single monomer, even slight effects from membrane permeability might be significant. Localization of aquaporins might lead to nonuniform permeability which could give fluid influx a greater influence than predicted by our simulations, where we assumed uniform permeability of membrane to the fluid. In fact, fluorescence dequenching measurements reveal localized water influx at the expanding rim or motile neutrophils (76). Similar experiments could be done on nematode spermatozoa to test the predictions given by the model presented here.
Though the biochemistry involved in cell crawling has received greater attention than the physical processes, there have been a number of models proposed to describe the mechanics of this type of cell motility. In this genre of modeling, nematode spermatozoa are quite conspicuous, most likely due to their simplicity. One-dimensional models have been proposed with the motile force coming from pH-induced contraction (31) and unbundling (30). A two-dimensional, lubrication analysis has been used to take into account the cell height, with retraction driven by a generic contractile mechanism, possibly driven by pH (77). Yet another model (29,78) used a discrete system of springs and dashpots to describe nematode sperm motility in two dimensions (along the plane of the substratum) and also used pH as a mechanism for inducing contraction. In addition, two-phase fluid mechanics models similar to what we describe here have been used to describe the motility of neutrophils (51) and keratocytes (79). The model presented here differs from these previous models in that it explicitly connects depolymerization of the cytoskeleton to force production while accounting for internal cytosolic and transmembrane fluid flows. The effects of anisotropy of the cytoskeleton and transmembrane fluid flow have not been considered previously, and, interestingly, we find that anisotropy can greatly affect the crawling speed and also is required to explain the dependence of speed on cell shape in nematode sperm.
Our model does not account for effects due to intracellular pH or nonlinearities in the mathematical model. In motile A. suum sperm, there is a pH difference between the front and the rear of the cell, such that the rear of the cell is more acidic than the leading edge (80). Intracellular pH in these cells has been proposed to affect adhesion (48), leading edge assembly of polymer (48,49), contraction (29,77), and disassembly (48). However, neither low pH nor a pH gradient was required for retraction of fiber complexes in vitro (21). Conclusive experiments as to the role of pH in these cells are lacking. Therefore, the model proposed here does not depend on intracellular pH. If pH does affect disassembly, then we would expect a nonuniform disassembly rate. In addition, we do not treat nonlinear terms that arise from advection and the cytoskeletal stress. Both pH and nonlinearities may produce quantitative differences to our results; however, we do not expect these effects to change the qualitative behavior of the model that is presented.
SUPPLEMENTARY MATERIAL
To view all of the supplemental files associated with this article, visit www.biophysj.org.
Supplementary Material
Acknowledgments
C.W. acknowledges support from National Institutes of Health grants GM64346 and RR022232. W.A.M. acknowledges support from National Institutes of Health grant HD43156.
APPENDIX
In this Appendix we derive the mathematical model for the depolymerization-driven motility of nematode sperm. We begin by describing the cytoplasm of the cell as a polymer network immersed in a fluid and develop the equations in three-dimensional space. The model presented here treats the cytoplasm as a two-phase fluid—a polymer phase and a cytosolic fluid phase. A general theory for two-phase flows was derived in Drew and Segel (81) and has been used previously to describe cytoskeletal dynamics (for example, see (31,51,79,82)). Force balance on the polymer and fluid components, in conjunction with conservation of volume, defines the velocities of these phases in terms of the cytosolic pressure and the polymer stress. Disassembly of the cytoskeleton and advection determine the amount of polymer at a given location. Starting from these three-dimensional equations, we assume that the height of the pseudopod of the cell is thin with respect to the width and length to derive a two-dimensional model for the physics of nematode sperm crawling. (A derivation using mass conservation that explicitly accounts for the soluble MSP dimer is presented in Data S1 in the online Supplementary Material.)
Inside a cell, the cytoskeleton occupies a fraction φ of any small volume element, while a fraction (1 − φ) of each volume element is filled with cytosol. As the cytoskeleton disassembles or moves, an equal volume of cytosol must fill the vacated space so that net volume is conserved,
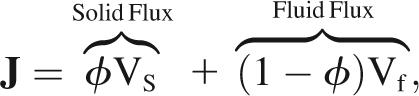 |
(3) |
 |
(4) |
where J is the net cytoplasmic flux, while Vs and Vf are velocities for the interpenetrating solid cytoskeleton and fluid cytosol, distinguished by subscripts s and f, respectively. These are absolute velocities, measured in a fixed laboratory reference frame.
For the special case of steady crawling, local changes in φ are equivalent to rigid body translation, with V0 as the constant crawling velocity of the cell. In general, cytoskeletal flow and disassembly change the volume fraction, over time,
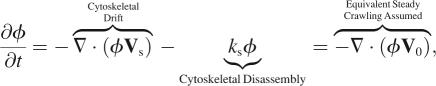 |
(5) |
where ks is the cytoskeletal disassembly rate (Table 1). The assumption of steady crawling amounts to seeking a traveling wave solution for the volume fraction kinetics, which yields a steady-state φ-profile in a reference frame that moves with the cell.
The total intracellular pressure gradient is split between the cytosol and the cytoskeleton. A fraction (1 − φ)∇p pushes the fluid phase from regions of high pressure to regions of low pressure, where p is the intracellular pressure. Likewise, a fraction φ∇p pushes on the solid phase, augmented by cytoskeletal forces. A detailed derivation of the distribution of the pressure gradient between phases in a two-phase model is given in Drew and Segel (81). For length scales and viscosities pertinent to cells, inertia is comparatively insignificant. Consequently, for each volume element, drag forces balance driving forces,
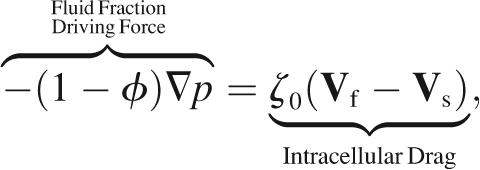 |
(6) |
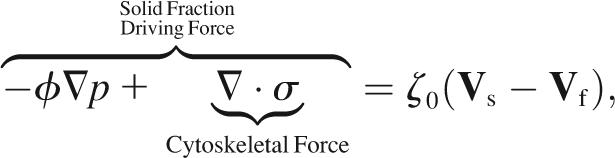 |
(7) |
where σ is the cytoskeletal stress tensor and ζ0 is the intracellular drag coefficient (Table 1). As required by Newton's third law, the drag of the cytoskeleton on the cytosol is equal and opposite to the drag of the cytosol on the cytoskeleton. Therefore, adding contributions from the cytosol (Eq. 6) and the cytoskeleton (Eq. 7) yields no net force on each volume element,
 |
(8) |
where τij = σij − pδij is the i, j component of the total cytoplasmic stress and δij is the Krönecker delta. By convention, the outward stress and pressure on the faces of a volume element have opposite sign.
For a crawling cell on a horizontal plane, consider a Cartesian coordinate system with basis vectors  and
and  along the anterior-posterior and transverse axes, of the cell, respectively. This choice makes
  parallel to V0 and puts
  perpendicular to the basal plane of the cell. These coordinates are convenient for specifying components of the cytoplasmic stress explicitly.
Laplace's Law (83) imposes a boundary condition on stress and pressure, in combination, for the apical surface and perimeter of a cell. Surface tension in a curved membrane counteracts any imbalance between external hydrostatic pressure and the net outward force on each unit of cell surface area,
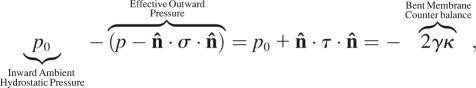 |
(9) |
where p0 is atmospheric pressure, κ is the curvature of the membrane, and γ is the membrane tension (Table 1). In nematode sperm, the mechanism of adhesion between the cell and the substrate is unknown. As little is known, we choose to describe the interaction between the polymer and the substrate through a drag force on the cell that is proportional to the polymer velocity. This choice for the drag force has been used in a number of other models for cell motility (29–31). Therefore, force balance at the substrate leads to a boundary condition on the stress at the basal surface,
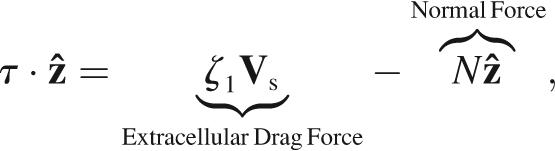 |
(10) |
where N represents the reaction force of the surface that supports the cell and ζ1 is an extracellular drag coefficient (Table 1), which is assumed to be large beneath the pseudopod of the cell and small beneath the cell body (Fig. 4). We treat shears on the apical surface as negligible. All components of the cytoplasmic stress tensor are then accounted for along the entire cell membrane.
Along the perimeter of a crawling cell, one unit of membrane area sweeps out volume at a rate of  where
where  is the local outward unit normal. Following behind the membrane, intracellular flow of solid and fluid matter fills only part of the swept volume, leaving transmembrane fluid flow to fill whatever space remains,
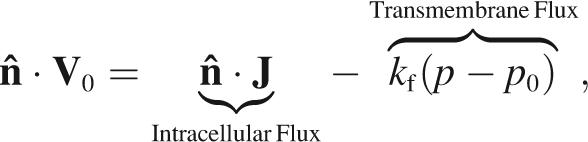 |
(11) |
where kf is the filtration coefficient (Table 1), which gives membrane permeability to fluid, rather than ions. Fluid flows across the cell membrane from high pressure to low, with a negative sign denoting fluid ingress. The same boundary condition applies to the apical and basal surfaces of the cell. Transmembrane flow through the basal surface of the cell is considered negligible due to occlusion by the substrate.
The pseudopod of a nematode spermatozoon is relatively thin, compared to the length and width of the cell. This suggests a treatment in which φ and the horizontal components of Vs and Vf have no dependence on the vertical z coordinate. Integration of the cytoplasmic conservation equation (Eq. 4) with respect to z using the boundary condition (Eq. 11) then leads to
 |
(12) |
where h is the constant height of the apical surface above the basal plane, equal to 1 μm in our simulations. The cytoplasmic flux J has Jx, Jy, and Jz as components. Here we have used that  vanishes at both the apical and basal surfaces. In addition, we assume that there is no transmembrane flux at the substrate. Vertical integration of the net cytoplasmic force on each volume element (Eq. 8) is completely analogous to
 |
(13) |
 |
(14) |
where the right-hand side of each equation comes from the boundary conditions at the basal surface (Eq. 10) and the apical surface (Eq. 9). At both of these surfaces κ vanishes for a pseudopod of uniform thickness. These equations relate Vs to the divergence of τ in two dimensions. The z component of the divergence of the stress does not influence the two-dimensional equations and is, therefore, ignored.
Integrating the cytosolic stress (Eq. 6) over the pseudopod thickness yields a factor of h on both sides of the equation. Canceling the common factor then provides a relation between (Vf − Vs) and ∇p that holds in two dimensions. The same integration and cancellation procedure applies to the equation for cytoskeletal drift under steady crawling (Eq. 5).
Specification of the cytoskeletal velocity components (Eqs. 13 and 14) requires a constitutive relation for the polymer stress. Based on experimental evidence, cytoskeletal stress depends on the cytoskeletal volume fraction. In addition, stresses due to volumetric deformations of a gel usually dominate shear stresses (84). Therefore, we ignore σxy (= σyx) when compared to σxx and σyy. Linear dependence of σ on φ is the simplest possible assumption,
 |
(15) |
where α, φ0, and σ0 are the anisotropy, unstressed volume fraction, and stiffness of the cytoskeleton, respectively, (Table 1). The overall negative sign reflects cytoskeletal compression when φ drops below the unstressed value.
Ultimately, the model yields a pair of coupled second-order, partial differential equations. To examine the basic behavior of this model, we linearize the equations with respect to φ and p. After vertical integration, cytoskeletal drift under steady crawling (Eq. 5) yields the first equation
 |
(16) |
where components of Vs are obtained from integrating the net cytoplasmic force on each volume element (Eqs. 13 and 14), with anisotropic cytoskeletal stress (Eq. 15) inserted. The divergence and all variables are now in two dimensions only. Vertical integration of the cytoplasmic conservation equation (Eq. 12) yields the second equation,
 |
(17) |
 |
(18) |
where (Vs − Vf) was eliminated from the cytoplasmic flux (Eq. 3), using the cytosolic force on each volume element (Eq. 6), integrated over pseudopod thickness.
Observations of steadily crawling A. suum spermatozoa (20,47) reveal that the MSP cytoskeleton maintains close contact with the cell membrane. For a range of crawling speeds, the cytoskeletal depolymerization rate is computed by systematically adjusting ks until  matches
  at the rear of the cell. At the front of the cell, and other points along the perimeter, the difference between
  and
and  gives the rate at which polymer must assemble to maintain the proscribed crawling velocity, which we will call the polymer assembly rate (Fig. 4 C). Cytoskeletal growth due to polymerization must bridge the gap wherever velocity of the existing cytoskeleton fails to keep pace with the cell membrane.
Actual computation employs dimensionless variables, using L0, p0, and p0/(L0ζ0) to set scales for length, stress, and velocity, respectively, where L0 is the square root of cell area. In this scheme, changes in nondimensional depolymerization rate is equivalent to changes in L0 at fixed ks. Using appropriate scale factors to restore units then provides crawling speed as a function of cell size, once a value for ks is chosen, with p0 and ζ0 determined empirically (Table 1).
The linearized equations of our model (Eqs. 16 and 17) are solved numerically using empirically determined cell shapes (Fig. 6 A). From a binary thresholded image, we construct a signed distance map, ψ, that describes the position of the cell boundary (85,86). We then discretize the geometries on a Cartesian grid, which leads to a staircased representation of the cell boundaries. The equations are discretized using a finite volume method where the fluxes on the staircased geometry are corrected for Schaff et al. (87) using the normal vector at the boundary:  Each discretized cell geometry has ∼10,000 interior points. The equations are integrated implicitly using MatLab to solve the corresponding linear system of equations. Solutions give φ and p directly, from which Vf, Vs, and σ are then determined (Fig. 4, F–I).
Editor: Alexander Mogilner.
References
- 1.Huttenlocher, A., R. R. Sandborg, and A. F. Horwitz. 1995. Adhesion in cell-migration. Curr. Opin. Cell Biol. 7:697–706. [DOI] [PubMed] [Google Scholar]
- 2.Lauffenburger, D., and A. F. Horwitz. 1996. Cell migration: a physically integrated molecular process. Cell. 84:359–369. [DOI] [PubMed] [Google Scholar]
- 3.Mitchison, T. J., and L. P. Cramer. 1996. Actin based cell motility and cell locomotion. Cell. 84:371–379. [DOI] [PubMed] [Google Scholar]
- 4.Rafelski, S. M., and J. A. Theriot. 2004. Crawling toward a unified model of cell motility: spatial and temporal regulation of actin dynamics. Annu. Rev. Biochem. 73:209–239. [DOI] [PubMed] [Google Scholar]
- 5.Rodriguez, O. C., A. W. Schaefer, C. A. Mandato, P. Forscher, W. M. Bement, and C. M. Waterman-Storer. 2003. Conserved microtubule-actin interactions in cell movement and morphogenesis. Nat. Cell Biol. 5:599–609. [DOI] [PubMed] [Google Scholar]
- 6.Gracheva, M. E., and H. G. Othmer. 2004. A continuum model of motility in amoeboid cells. Bull. Math. Biol. 66:167–193. [DOI] [PubMed] [Google Scholar]
- 7.Grimm, H. P., A. B. Verkhovsky, A. Mogilner, and J. J. Meister. 2003. Analysis of actin dynamics at the leading edge of crawling cells: implications for the shape of keratocyte lamellipodia. Eur. Biophys. J. Biophys. Lett. 32:563–577. [DOI] [PubMed] [Google Scholar]
- 8.Bohnet, S., R. Ananthakrishnan, A. Mogilner, J. J. Meister, and A. B. Verkhovsky. 2006. Weak force stalls protrusion at the leading edge of the lamellipodium. Biophys. J. 90:1810–1820. [DOI] [PMC free article] [PubMed] [Google Scholar]
- 9.Marcy, Y., J. Prost, M. F. Carlier, and C. Sykes. 2004. Forces generated during actin-based propulsion: a direct measurement by micromanipulation. Proc. Natl. Acad. Sci. USA. 101:5992–5997. [DOI] [PMC free article] [PubMed] [Google Scholar]
- 10.Prass, M., K. Jacobson, A. Mogilner, and M. Radmacher. 2006. Direct measurement of the lamellipodial protrusive force in a migrating cell. J. Cell Biol. 174:767–772. [DOI] [PMC free article] [PubMed] [Google Scholar]
- 11.Svitkina, T. M., A. B. Verkhovsky, K. M. McQuade, and G. G. Borisy. 1997. Analysis of the actin-myosin II system in fish epidermal keratocytes: mechanism of cell body translocation. J. Cell Biol. 139:397–415. [DOI] [PMC free article] [PubMed] [Google Scholar]
- 12.Verkhovsky, A. B., T. M. Svitkina, and G. G. Borisy. 1997. Contraction of actin-myosin II dynamic network drives cell translocation. Mol. Biol. Cell. 8:974. [Google Scholar]
- 13.Knecht, D. A., and W. F. Loomis. 1987. Antisense RNA inactivation of myosin heavy chain gene expression in Dictyostelium discoideum. Science. 237:1081–1085. [DOI] [PubMed] [Google Scholar]
- 14.Laevsky, G., and D. A. Knecht. 2003. Cross-linking of actin filaments by myosin II Is a major contributor to cortical integrity and cell motility in restrictive environments. J. Cell Sci. 116:3761–3770. [DOI] [PubMed] [Google Scholar]
- 15.Xu, X. X. S., E. Lee, T. L. Chen, E. Kuczmarski, R. L. Chisholm, and D. A. Knecht. 2001. During multicellular migration, myosin II serves a structural role independent of its motor function. Dev. Biol. 232:255–264. [DOI] [PubMed] [Google Scholar]
- 16.Even-Ram, S., A. D. Doyle, M. A. Conti, K. Matsumoto, R. S. Adelstein, and K. M. Yamada. 2001. Myosin IIA regulates cell motility and actomyosin-microtubule crosstalk. Nat. Cell Biol. 11:63–80. [DOI] [PubMed] [Google Scholar]
- 17.Janson, L. W., J. Kolega, and D. L. Taylor. 1991. Modulation of contraction by gelation/solation in a reconstituted motile model. J. Cell Biol. 114:1005–1015. [DOI] [PMC free article] [PubMed] [Google Scholar]
- 18.Janson, L. W., and D. L. Taylor. 1993. In vitro models of tail contraction and cytoplasmic streaming in amoeboid cells. J. Cell Biol. 123:345–356. [DOI] [PMC free article] [PubMed] [Google Scholar]
- 19.Bullock, T. L., A. J. McCoy, H. M. Kent, T. M. Roberts, and M. Stewart. 1998. Structural basis for amoeboid motility in nematode sperm. Nat. Struct. Biol. 5:184–189. [DOI] [PubMed] [Google Scholar]
- 20.Roberts, T. M., and M. Stewart. 1997. Nematode sperm: amoeboid movement without actin. Trends Cell Biol. 7:368–373. [DOI] [PubMed] [Google Scholar]
- 21.Miao, L., O. Vanderlinde, M. Stewart, and T. M. Roberts. 2003. Retraction in amoeboid cell motility powered by cytoskeletal dynamics. Science. 302:1405–1407. [DOI] [PubMed] [Google Scholar]
- 22.Wolgemuth, C. W., L. Miao, O. Vanderlinde, T. Roberts, and G. Oster. 2005. MSP dynamics drives nematode sperm locomotion. Biophys. J. 88:2462–2471. [DOI] [PMC free article] [PubMed] [Google Scholar]
- 23.Charras, G. T., C. K. Hu, M. Coughlin, and T. J. Mitchison. 2006. Reassembly of contractile actin cortex in cell blebs. J. Cell Biol. 175:477–490. [DOI] [PMC free article] [PubMed] [Google Scholar]
- 24.Cunningham, C. C. 1995. Actin polymerization and intracellular solvent flow in cell-surface blebbing. J. Cell Biol. 129:1589–1599. [DOI] [PMC free article] [PubMed] [Google Scholar]
- 25.Keller, H., A. D. Zadeh, and P. Eggli. 2002. Localized depletion of polymerized actin at the front of Walker carcinosarcoma cells increases the speed of locomotion. Cell Motil. Cytoskeleton. 53:189–202. [DOI] [PubMed] [Google Scholar]
- 26.Yanai, M., C. M. Kenyon, J. P. Butler, P. T. MacKlem, and S. M. Kelly. 1996. Intracellular pressure is a motive force for cell motion in Amoeba proteus. Cell Motil. Cytoskeleton. 33:22–29. [DOI] [PubMed] [Google Scholar]
- 27.Nelson, G., T. Roberts, and S. Ward. 1982. Caenorhabditis elegans spermatozoan locomotion: amoeboid movement with almost no actin. J. Cell Biol. 92:121–131. [DOI] [PMC free article] [PubMed] [Google Scholar]
- 28.Royal, D. C., M. A. Royal, D. Wessels, S. Lhernault, and D. R. Soll. 1997. Quantitative analysis of Caenorhabditis elegans sperm motility and how it is affected by mutants Spe11 and Unc54. Cell Motil. Cytoskeleton. 37:98–110. [DOI] [PubMed] [Google Scholar]
- 29.Bottino, D. C., A. Mogilner, T. M. Roberts, and G. F. Oster. 2000. A computational model of crawling in Ascaris suum sperm. Mol. Biol. Cell. 11:380A. [Google Scholar]
- 30.Mogliner, A., and D. W. Verzi. 2003. A simple 1-D model for the crawling nematode sperm cell. J. Stat. Phys. 110:1169–1189. [DOI] [PMC free article] [PubMed] [Google Scholar]
- 31.Wolgemuth, C., A. Mogilner, and G. Oster. 2004. The hydration dynamics of polyelectrolyte gels with applications to drug delivery and cell motility. Eur. Biophys. J. 33:146–158. [DOI] [PubMed] [Google Scholar]
- 32.Lamunyon, C. W., and S. Ward. 1998. Larger sperm outcompete smaller sperm in the nematode Caenorhabditis elegans. Proc. R. Soc. Lond. Ser. B Biol. Sci. 265:1997–2002. [DOI] [PMC free article] [PubMed] [Google Scholar]
- 33.Ward, S., E. Hogan, and G. A. Nelson. 1983. The initiation of spermatogenesis in the nematode Caenorhabditis elegans. Dev. Biol. 98:70–79. [DOI] [PubMed] [Google Scholar]
- 34.L'Hernault, S. W., and T. Roberts. 1995. Cell biology of nematode sperm. Methods Cell Biol. 48:273–301. [DOI] [PubMed] [Google Scholar]
- 35.Nelson, G. A., and S. Ward. 1980. Vesicle fusion, pseudopod extension and amoeboid motility are induced in nematode spermatids by the ionophore monensin. Cell. 19:457–464. [DOI] [PubMed] [Google Scholar]
- 36.Cogswell, C. J., and C. J. R. Sheppard. 1991. Confocal differential interference contrast (DIC) microscopy: including a theoretical analysis of conventional and confocal DIC imaging. J. Microsc. 165:81–101. [Google Scholar]
- 37.Marganski, W. A., M. Dembo, and Y.-L. Wang. 2003. Measurements of cell-generated deformations on flexible substrata using correlation-based optical flow. Methods Enzymol. 361:197–211. [DOI] [PubMed] [Google Scholar]
- 38.Roberts, T. M., F. M. Pavalko, and S. Ward. 1986. Membrane and cytoplasmic proteins are transported in the same organelle complex during nematode spermatogenesis. J. Cell Biol. 102:1787–1796. [DOI] [PMC free article] [PubMed] [Google Scholar]
- 39.Okada, Y., editor. 1998. Cell Volume Regulation: The Molecular Mechanism and Volume Sensing Machinery. Elsevier Science, Amsterdam, The Netherlands.
- 40.Strange, K. 1994. Cellular and Molecular Physiology of Cell Volume Regulation. CRC Press, Boca Raton, FL.
- 41.Buttery, S. M., G. C. Ekman, M. Seavy, M. Stewart, and T. M. Roberts. 2003. Dissection of the Ascaris sperm motility machinery identifies key proteins involved in Major Sperm Protein-based amoeboid locomotion. Mol. Biol. Cell. 14:5082–5088. [DOI] [PMC free article] [PubMed] [Google Scholar]
- 42.Italiano, J., Jr., T. M. Roberts, M. Stewart, and C. A. Fontana. 1996. Reconstruction in vitro of the motile apparatus from the amoeboid sperm of Ascaris shows that filament assembly and bundling move membranes. Cell. 84:105–114. [DOI] [PubMed] [Google Scholar]
- 43.King, K. L., M. Stewart, and T. M. Roberts. 1994. Supramolecular assemblies of the Ascaris suum Major Sperm Protein (MSP) associated with amoeboid cell motility. J. Cell Sci. 107:2941–2949. [DOI] [PubMed] [Google Scholar]
- 44.Baker, A. M. E., T. M. Roberts, and M. Stewart. 2002. 2.6 Ångstrom resolution crystal structure of helices of the motile Major Sperm Protein (MSP) of Caenorhabditis elegans. J. Mol. Biol. 319:491–499. [DOI] [PubMed] [Google Scholar]
- 45.Sepsenwol, S., H. Ris, and T. M. Roberts. 1989. A unique cytoskeleton associated with crawling in the amoeboid sperm of the nematode Ascaris suum. J. Cell Biol. 108:55–56. [DOI] [PMC free article] [PubMed] [Google Scholar]
- 46.Roberts, T. M., and M. Stewart. 2000. Acting like actin: the dynamics of the nematode Major Sperm Protein (MSP) cytoskeleton indicate a push-pull mechanism for amoeboid cell motility. J. Cell Biol. 149:7–12. [DOI] [PMC free article] [PubMed] [Google Scholar]
- 47.Roberts, T. M., E. D. Salmon, and M. Stewart. 1998. Hydrostatic pressure shows that lamellipodial motility in Ascaris sperm requires membrane-associated Major Sperm Protein filament nucleation and elongation. J. Cell Biol. 140:367–375. [DOI] [PMC free article] [PubMed] [Google Scholar]
- 48.Italiano, J. E., M. Stewart, and T. M. Roberts. 1999. Localized depolymerization of the Major Sperm Protein cytoskeleton correlates with the forward movement of the cell body in the amoeboid movement of nematode sperm. J. Cell Biol. 146:1087–1095. [DOI] [PMC free article] [PubMed] [Google Scholar]
- 49.Leclaire, L. L., M. Stewart, and T. M. Roberts. 2003. A 48 KDa integral membrane phosphoprotein orchestrates the cytoskeletal dynamics that generate amoeboid cell motility in Ascaris sperm. J. Cell Sci. 116:2655–2663. [DOI] [PubMed] [Google Scholar]
- 50.Evans, E., and A. Yeung. 1989. Apparent viscosity and cortical tension of blood granulocytes determined by micropipette aspiration. Biophys. J. 56:151–160. [DOI] [PMC free article] [PubMed] [Google Scholar]
- 51.Herant, M., W. A. Marganski, and M. Dembo. 2003. The mechanics of neutrophils: synthetic modeling of three experiments. Biophys. J. 84:3389–3413. [DOI] [PMC free article] [PubMed] [Google Scholar]
- 52.Dai, J. W., H. P. Tingbeall, and M. P. Sheetz. 1997. The secretion-coupled endocytosis correlates with membrane tension changes in Rbl 2H3 cells. J. Gen. Physiol. 110:1–10. [DOI] [PMC free article] [PubMed] [Google Scholar]
- 53.Mogilner, A., and G. Oster. 2003. Shrinking gels pull cells. Science. 302:1340–1341. [DOI] [PubMed] [Google Scholar]
- 54.Shibayama, M., and T. Tanaka. 1993. Volume phase transition and related phenomena of polymer gels. Adv. Polymer Sci. 109:1–62. [Google Scholar]
- 55.Bullock, T. L., T. M. Roberts, and M. Stewart. 1996. 2.5 Ångstrom resolution crystal structure of the motile Major Sperm Protein (MSP) of Ascaris suum. J. Mol. Biol. 263:284–296. [DOI] [PubMed] [Google Scholar]
- 56.Reference deleted in proof.
- 57.Tokita, T., and T. Tanaka. 1991. Friction coefficient of polymer networks of gels. J. Chem. Phys. 95:4613. [Google Scholar]
- 58.Tomita, M., F. Gotoh, M. Tanahashi, N. Kobari, T. Shinohara, Y. Terayama, B. a. O. Yamawaki, T. Mihara, K., and A. Kaneko. 1990. The mechanical filtration coefficient (Lp) of the cell membrane of cultured glioma cells (C6). Acta Neurochir. Suppl. (Wien). 51:11–13. [DOI] [PubMed] [Google Scholar]
- 59.Kargol, A., M. Przestalski, and M. Kargol. 2005. A study of porous structure of cellular membranes in human erythrocytes. Cryobiology. 50:332–337. [DOI] [PubMed] [Google Scholar]
- 60.Vargas, F. 1968. Filtration coefficient of the axon membrane as measured with hydrostatic and osmotic methods. J. Gen. Physiol. 51:13–27. [DOI] [PMC free article] [PubMed] [Google Scholar]
- 61.Garrick, R. A., T. G. Polefka, W. O. Cua, and F. P. Chinard. 1986. Water permeability of alveolar macrophages. Am. J. Physiol. Cell Physiol. 251:C524–C528. [DOI] [PubMed] [Google Scholar]
- 62.Doyle, A. D., and J. Lee. 2005. Cyclic changes in keratocyte speed and traction stress arise from Ca2+-dependent regulation of cell adhesiveness. J. Cell Sci. 118:369–379. [DOI] [PubMed] [Google Scholar]
- 63.Pollard, T. D., L. Blanchoin, and R. D. Mullins. 2000. Molecular mechanisms controlling actin filament dynamics in nonmuscle cells. Annu. Rev. Biophys. Biomol. Struct. 29:545–576. [DOI] [PubMed] [Google Scholar]
- 64.Theriot, J. A., and T. J. Mitchison. 1991. Actin microfilament dynamics in locomoting cells. Nature. 352:126–131. [DOI] [PubMed] [Google Scholar]
- 65.Watanabe, N., and T. J. Mitchison. 2002. Single-molecule speckle analysis of actin filament turnover in lamellipodia. Science. 295:1083–1086. [DOI] [PubMed] [Google Scholar]
- 66.Mogilner, A., and L. Edelstein-Keshet. 2002. Regulation of actin dynamics in rapidly moving cells: a quantitative analysis. Biophys. J. 83:1237–1258. [DOI] [PMC free article] [PubMed] [Google Scholar]
- 67.Miyoshi, T., T. Tsuji, C. Higashida, M. Hertzog, A. Fujita, S. Narumiya, G. Scita, and N. Watanabe. 2006. Actin turnover-dependent fast dissociation of capping protein in the dendritic nucleation actin network: evidence of frequent filament severing. J. Cell Biol. 175:947–955. [DOI] [PMC free article] [PubMed] [Google Scholar]
- 68.Pantaloni, D. C. la Leinche, and M. F. Carlier. 2001. Cell biology—mechanism of actin-based motility. Science. 292:1502–1506. [DOI] [PubMed] [Google Scholar]
- 69.du Roure, A., O. and Saez, A. Buguin, R. H. Austin, P. Chavrier, P. Siberzan, and B. Ladoux. 2005. Force mapping in epithelial cell migration. Proc. Natl. Acad. Sci. USA. 102:2390–2395. [DOI] [PMC free article] [PubMed] [Google Scholar]
- 70.Jurado, C., J. R. Haserick, and J. Lee. 2005. Slipping or gripping? Fluorescent speckle microscopy in fish keratocytes reveals two different mechanisms for generating a retrograde flow of actin. Mol. Biol. Cell. 16:507–518. [DOI] [PMC free article] [PubMed] [Google Scholar]
- 71.Burton, K., and J. Park. 1999. Keratocytes generate traction forces in two phases. Mol. Biol. Cell. 10:3745–3769. [DOI] [PMC free article] [PubMed] [Google Scholar]
- 72.Small, J. V., and G. P. Resch. 2005. The comings and goings of actin: coupling protrusion and retraction in cell motility. Curr. Opin. Cell Biol. 17:517–523. [DOI] [PubMed] [Google Scholar]
- 73.McGrath, J. L., E. A. Osborn, Y. S. Tardy, C. F. Dewey, and J. H. Hartwig. 2000. Regulation of the actin cycle in vivo by actin filament severing. Proc. Natl. Acad. Sci. USA. 97:6532–6537. [DOI] [PMC free article] [PubMed] [Google Scholar]
- 74.Bereiter-Hahn, J. 2005. Mechanics of crawling cells. Med. Eng. Phys. 27:743–753. [DOI] [PubMed] [Google Scholar]
- 75.Oster, G. 2002. Brownian ratchets: Darwin's motors. Nature. 417:25. [DOI] [PubMed] [Google Scholar]
- 76.Loitto, V. M., T. Forslund, T. Sundqvist, K. E. Magnusson, and M. Gustafsson. 2002. Neutrophil leukocyte motility requires directed water influx. J. Leukoc. Biol. 71:212–222. [PubMed] [Google Scholar]
- 77.Joanny, J.-F., F. Jülicher, and J. Prost. 2003. Motion of an adhesive gel in a swelling gradient: a mechanism for cell locomotion. Phys. Rev. Lett. 90:168102. [DOI] [PubMed] [Google Scholar]
- 78.Bottino, D., A. Mogilner, M. Stewart, and G. Oster. 2001. How nematode sperm crawl. J. Cell Sci. 115:367–384. [DOI] [PubMed] [Google Scholar]
- 79.Rubinstein, B., K. Jacobson, and A. Mogilner. 2005. Multiscale two-dimensional modeling of a motile simple-shaped cell. Multiscale Model. Simul. 3:413–439. [DOI] [PMC free article] [PubMed] [Google Scholar]
- 80.King, K. L., J. Essig, T. M. Roberts, and T. S. Moerland. 1994. Regulation of the Ascaris Major Sperm Protein (MSP) cytoskeleton by intracellular pH. Cell Motil. Cytoskeleton. 27:193–205. [DOI] [PubMed] [Google Scholar]
- 81.Drew, D. A., and L. A. Segel. 1971. Averaged equations for two phase flow. Stud. Appl. Math. 50:205–231. [Google Scholar]
- 82.Dembo, M., and F. Harlow. 1986. Cell motion, contractile networks, and the physics of interpenetrating reactive flow. Biophys. J. 50:109–121. [DOI] [PMC free article] [PubMed] [Google Scholar]
- 83.Vogel, S. 2003. Comparative Biomechanics: Life's Physical World. Princeton University Press, Princeton, NJ.
- 84.Tanaka, T., and D. Fillmore. 1979. Kinetics of swelling of gels. J. Chem. Phys. 70:1214–1218. [Google Scholar]
- 85.Osher, S., and R. Fedkiw. 2000. Level Set Methods and Dynamic Implicit Surfaces. Vol. 153, Applied Mathematical Sciences Series. Springer-Verlag, New York.
- 86.Sethian, J. A. 1999. Level Set Methods and Fast Marching Methods: Evolving Interfaces in Computational Geometry, Fluid Mechanics, Computer Vision and Material Science, 2nd Ed. Cambridge University Press, New York.
- 87.Schaff, J. C., B. M. Slepchenko, Y.-S. Choi, J. Wagner, D. Resasco, and L. M. Loew. 2001. Analysis of nonlinear dynamics on arbitrary geometries with the virtual cell. Chaos. 11:115–131. [DOI] [PubMed] [Google Scholar]
Associated Data
This section collects any data citations, data availability statements, or supplementary materials included in this article.