Abstract
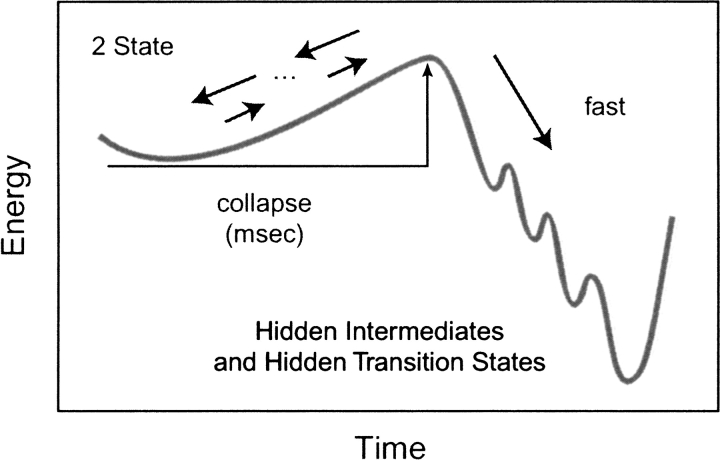
Do two-state proteins fold by pathways or funnels? Native-state hydrogen exchange experiments show discrete nonnative structures in equilibrium with the native state. These could be called hidden intermediates (HI) because their populations are small at equilibrium, and they are not detected in kinetic experiments. HIs have been invoked as disproof of funnel models, because funnel pictures appear to indicate (1) no specific sequences of events in folding; (2) a continuum, rather than a discrete ladder, of structures; and (3) smooth landscapes. In the present study, we solve the exact dynamics of a simple model. We find, instead, that the present microscopic model is indeed consistent with HIs and transition states, but such states occur in parallel, rather than along the single pathway predicted by the sequential stabilization model. At the microscopic level, we observe a huge multiplicity of trajectories. But at the macroscopic level, we observe two pathways of specific sequences of events that are relatively traditional except that they are in parallel, so there is not a single reaction coordinate. Using singular value decomposition, we show an accurate representation of the shapes of the model energy landscapes. They are highly complex funnels.
Keywords: Folding kinetics, master equation formalism, transition pathways, energy landscape
There are currently two main models of two-state protein folding kinetics: the pathway model (Pande et al. 1998; Englander 2000; Rumbley et al. 2001) and the parallel routes, or funnel model (Bryngelson et al. 1995; Socci et al. 1998; Klimov and Thirumalai 2001). It has recently been argued (Englander 2000; Rumbley et al. 2001) that new experimental observations of the existence of "hidden intermediates" (HI) are not consistent with the funnel model. We explore this issue here using a model in which we can study the dynamics in a rigorous and complete way. The present work indicates an alternative to traditional pathway explanations for two-state protein folding kinetics.
Small globular proteins often fold very quickly, in tens of microseconds (Pande et al. 1998; Englander 2000), and very simply, following single-exponential (called two-state) kinetics. Single-exponential processes are typically described by mass-action models (Ikai and Tanford 1971; Tsong et al. 1971; Dill and Chan 1997; Englander 2000; Rumbley et al. 2001;). A single-exponential decay in both forward (folding) and backward (unfolding) directions can be described by two states, unfolded (U) and native (N),
 |
(I) |
More complex kinetics requires additional mass-action symbols. To explain two-exponential folding requires three mass-action states. For example, if the third state is labelled I (intermediate), then a possible model is
 |
(II) |
and larger numbers of exponentials could be described by a sequential pathway model
 |
(III) |
where each intermediate state Ij represents an additional observed relaxation process in the experiments. We call these macroscopic models because their states (U, I1, I2, …) are ensemble averages over microscopic chain conformations. Macroscopic models do not say which chain conformations correspond to each mass-action symbol (such as Ij or TS [transition state]). They cannot describe how the microscopic rate processes depend on amino acid sequence or external conditions. They do not predict the sequences of microscopic chain folding events.
Microscopic insights require microscopic models: statistical mechanical computer simulations (Sali et al. 1994; Miller and Dill 1995; Pande and Rokhsar 1999a; Dinner et al. 2000; Li et al. 2000), Langevin dynamics of continuum models with different friction coefficients (Veitshans et al. 1997; Thirumalai and Klimov 1999; Klimov and Thirumalai 2000), and molecular dynamics (MD) simulations of unfolding (Daggett et al. 1996; Lazaridis and Karplus 1997; Pande et al. 1998; Alonso and Daggett 2000) or refolding starting from transition states (Pande and Rokhsar 1999b). Microscopic models have led to the view that the fast-folding proteins fold up along funnel-shaped energy landscapes.
But it has been argued that the microscopic models imply "an unlimited number, essentially a continuum, of intermediates and paths" (Rumbley et al. 2001). It has been argued that such astronomical numbers of paths are inconsistent with experiments showing a small number of discrete near-native structures. We call these structures HIs, for the following reasons. First, they are not true thermodynamic intermediates because these nonnative structures, which are observed by native-state hydrogen exchange experiments, are never the dominant population under equilibrium conditions (Bai et al. 1995). Second, they escape detection in kinetics experiments. Folding is monoexponential, meaning that no intermediates are observed in mass-action kinetics models. Hence, we call these intermediate states "hidden".
The fundamental questions are (1) what are the HIs that are observed in experiments, and (2) are they inconsistent with funnel models? In broader terms, the essence of the issue is how macrostates (U, I1, I2, …) are related to the microscopic conformations of a chain. Neither experiments nor typical computational modeling has determined this relationship. Here, through a complete and exact treatment of the dynamics, we can do so in a simple folding model.
Model and parameters
We use a two-dimensional Go model. An attractive potential ɛ is assigned to every pair of monomers making native contacts. All other contacts have zero interaction energy. To mimic the weakening of hydrophobic interactions by denaturants or temperature, we vary the value of ɛ/kT. High temperatures denature the model proteins, whereas low temperatures stabilize the folded state, following Boltzmann’s law. We generate the complete sets of all self-avoiding conformations of 9-mers and 16-mers on a square lattice.
Collecting microscopic conformations together into macroconformations
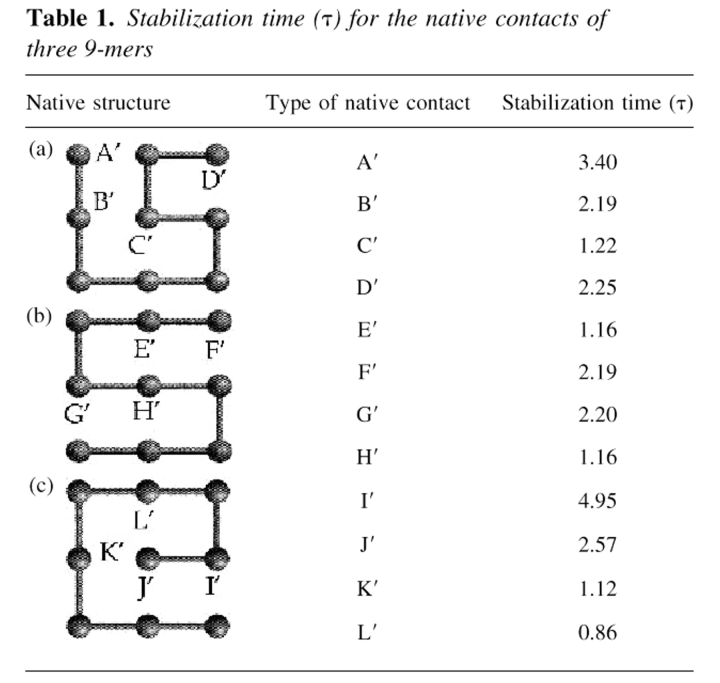
The microconformations are the individual lattice conformations, of which there are N = 740 for the 9-mers and N = 802,075 for the 16-mers, excluding the conformers that are related by symmetry or by rigid body rotation. Macroconformations (or macrostates) are ensembles of microconformations that are specified by particular sets of native contacts. For example, the 9-mers have M = 13 mutually exclusive macroconformations. If we designate each of them by the corresponding list of contacts, the macroconformations for the structure in Table 1a are A‘, B‘, C‘, D‘, A‘B‘, A‘C‘, B‘C‘, B‘D‘, C‘D‘, A‘B‘C‘, B‘C‘D‘, A‘B‘C‘D‘, in addition to the set O of conformations having no native contacts. A‘D‘ and A‘B‘D‘ are not accessible because of lattice geometry constraints. We define a macropath, or macroroute, as a time series of macroconformations. Our interest here is in relating micropaths, the individual chain trajectories in folding, to macropaths, the mass action–like description of a series of folding steps.
Table 1.
Stabilization time (τ) for the native contacts of three 9-mers
The 16-mer shown in Figure 1 ▶ has 267 macrostates. Table 2 lists the dominant ones among these, that is, those having relatively high statistical weights, Wmic. Wmic is the number of microconformations in each macroconformation. The complete list of macroconformations is available as supplementary material. Table 3 lists the total numbers, Wmic and Wmac, of the respective microconformations and macroconformations of the 16-mers having m native contacts.
Fig. 1.
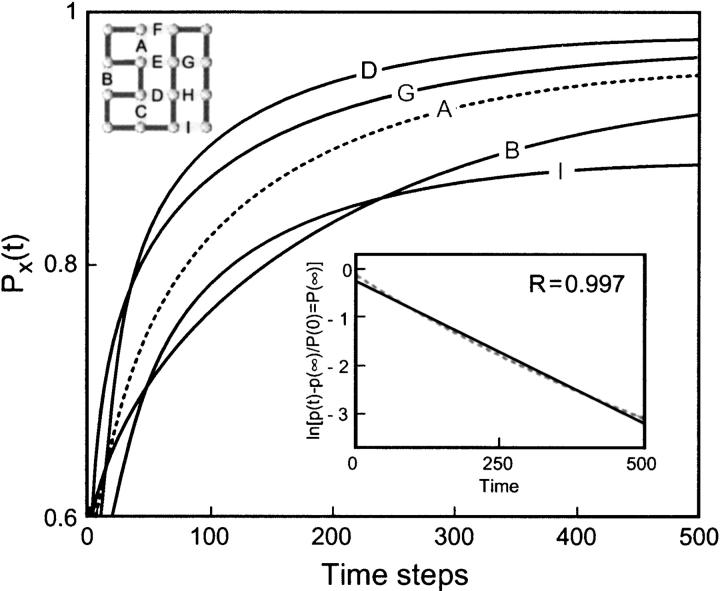
Time evolution of native contacts for the 16-mer. The time-dependent probability PX(t) of contacts X = A–D, G, I is shown. The inset shows the plot of ln{[PN(t) − PN(∞)]/[PN(0) − PN(∞)]} versus time where PN(t) is the probability of native state. The close fit (correlation coefficient = 0.997) to a line shows that the observed kinetics is single exponential.
Table 2.
Dominant macroconformations for 16-mers, and their statistical weights, Wmic
| m = 2 | Wmic | m = 5 | Wmic | ||
| 1 | AB | 13004 | 1 | ABCDE | 51 |
| 2 | AC | 10391 | 2 | ABGHI | 47 |
| 3 | AG | 9545 | 3 | ACGHI | 71 |
| 4 | BC | 9291 | 4 | BCDEG | 38 |
| 5 | GH | 6207 | 5 | BCGHI | 35 |
| 6 | CG | 5264 | 6 | ABCGH | 7 |
| 7 | BG | 5189 | 7 | ABCDG | 16 |
| m = 3 | Wmic | m = 6 | Wmic | ||
| 1 | ABC | 1867 | 1 | ABCDEF | 39 |
| 2 | GHI | 1558 | 2 | ABCGHI | 7 |
| 3 | ABG | 1405 | 3 | BCDEHI | 5 |
| 4 | AGH | 1241 | 4 | BCDGHI | 5 |
| 5 | ACG | 1139 | 5 | CDEGHI | 4 |
| 6 | BCG | 1025 | 6 | ABCDEG | 3 |
| 7 | BCD | 691 | 7 | ABCDEI | 3 |
| 8 | ABCDGI | 2 |
| m = 4 | Wmic | ||||
| 1 | BCDE | 503 | m = 7 | Wmic | |
| 2 | AGHI | 315 | 1 | BCDEGHI | 5 |
| 3 | ABCG | 207 | 2 | ABCDEFG | 3 |
| 4 | ABGH | 181 | |||
| 5 | CGHI | 178 | m = 8 | Wmic | |
| 6 | BGHI | 172 | 1 | ABCDEFGH | 1 |
| 7 | ACGH | 141 |
Table 3.
Statistical weights of microconformations (Ωmic) and macroconformations (Ωmac) with m native contacts for the 16-mera
| m | Ωmic(m) | Ωmac(m) |
| 0 | 543,621 | 1 |
| 1 | 176,461 | 9 |
| 2 | 60,968 | 35 |
| 3 | 17,135 | 68 |
| 4 | 3,367 | 76 |
| 5 | 428 | 50 |
| 6 | 80 | 20 |
| 7 | 13 | 6 |
| 8 | 1 | 1 |
| 9 | 1 | 1 |
| Total | 802,075 | 267 |
a Ωmic is the sum over the Wmic values of all Ωmac (m) macrostates.
Master equation formalism
To determine the complete kinetics, we solve a master equation, the full coupled kinetics among all 740 or 802,075 conformations, as described in Materials and Methods. The virtues of the master equation approach are that (1) it allows us to explore all time scales, differing by many orders of magnitude; (2) it gives us the complete and exact kinetics, without limitations owing to incomplete sampling methods; and (3) it requires no thermodynamic assumption, such as in transition-state theory, in which the population of the TS is assumed to be in equilibrium with the reactant state. Avoiding this assumption is essential here, because we believe two-state protein folding is so fundamentally different from how it appears in the traditional single reaction–coordinate treatments that it is essential to learn about the nature of barriers and intermediates rather than to make assumptions about them.
There are other studies in this area. Master equation formalisms have been adopted by Scheraga and coworkers (Ye et al. 1999) for analyzing the folding of a subset of 50 conformations (local energy minima) generated for staphylococcal protein A, and by Eaton and coworkers for modeling the formation of a β-hairpin (Munoz et al. 1998). A well-defined folding pathway was reported (Pande and Rokhsar 1999a) for a 48-mer on a three-dimensional cubic lattice and on well-defined TS conformations having a common core structure. Likewise, a preferred unfolding pathway was observed by Lazaridis and Karplus (1997) in the multiple MD trajectories of chymotrypsin inhibitor 2 (CI2), a classical example protein that obeys two-state kinetics, indicating that a preferred pathway can be compatible with a funnel-like average energy surface, as had been previously noted from lattice model simulations (Miller et al. 1992). This observation was interpreted as a reconciliation of the old and new views of folding. The TS region for CI2 was shown to involve only 25% of native contacts (Lazaridis and Karplus 1997). The off-lattice 46-mer model (Dokholyan et al. 2000) also revealed that only a few well-defined contacts formed the completion of folding in the TS drive with high probability. Galzitskaya and Finkelstein (1999) on the other hand, found TS structures including up to three fourths of residues.
Results and Discussion
Time evolution of native contacts
To validate this model, we must first show that the folding kinetics is two-state, that is, that the native conformation emerges via a single-exponential kinetic process. The inset in Figure 1 ▶ shows this for the 16-mer native structure. The linearity of the semi-log plot has a correlation coefficient of R = 0.997, although some residuals are observed. Results from the 9-mers also show single-exponential behaviour on a macroscopic scale. This observable single exponential comes from a multiexponential process that has a separation of time scales. For simplicity of terminology, we refer to it as monoexponential.
Figure 1 ▶ also shows the remarkable heterogeneity of the kinetics of the underlying processes of contact formation. To make this more quantitative, we calculate a characteristic stabilization time, τ(X),
 |
over 0 < t < ∞. PX(t) is the fractional population of contact X at time t. Stabilization times τ(X) for the 9-mers are given in Table 1. The main conclusion is that folding begins with the most local contacts and proceeds toward less local ones, consistent with a zipping mechanism (Dill et al. 1993; Fiebig and Dill 1993). For example, Table 1 shows that τ(L) < τ(K) < τ(J) < τ(I). Helical contacts at chain termini tend to form at the burst stage of folding, but they can be rapidly reopened, so their effective stabilization time is longer than that of inner helical contacts. β-Strand or interdomain contacts, on the other hand, accumulate steadily, and can show a shorter characteristic times compared with those of the reversible helical contacts. The 16-mer we have studied here has two domains, an α-helical and a β-sheet. Helix contacts are A thorough C, and the β-strands contacts are G through I. These six contacts may be interpreted as intradomain contacts, whereas D through F are interdomain contacts. The characteristic times show the order τ(C) ≈ τ(G) < τ(D) < τ(I) < τ(A) < τ(H) < τ(E) < τ(B) < τ(F). The core local contacts (G and C) form first, whereas A, involving a chain terminus, is slower.
The macrodescription: Structure emerges as sequences of events
Figure 2 ▶ shows how structure emerges along macroroutes. It shows that the folding process can be described as a set of macroscopic events, even though there is a broad ensemble of microscopic routes. The figure shows the time-delayed joint probabilities, P(X, t1; Y, t2), of macroconformations X and Y, observed at various time windows (t1, t2) during the folding of the 9-mer shown in Table 1a. The abscissa and ordinate are the original (X) and final (Y) macroconformations. The color code gives the probability of each time-delayed joint event.
Fig. 2.
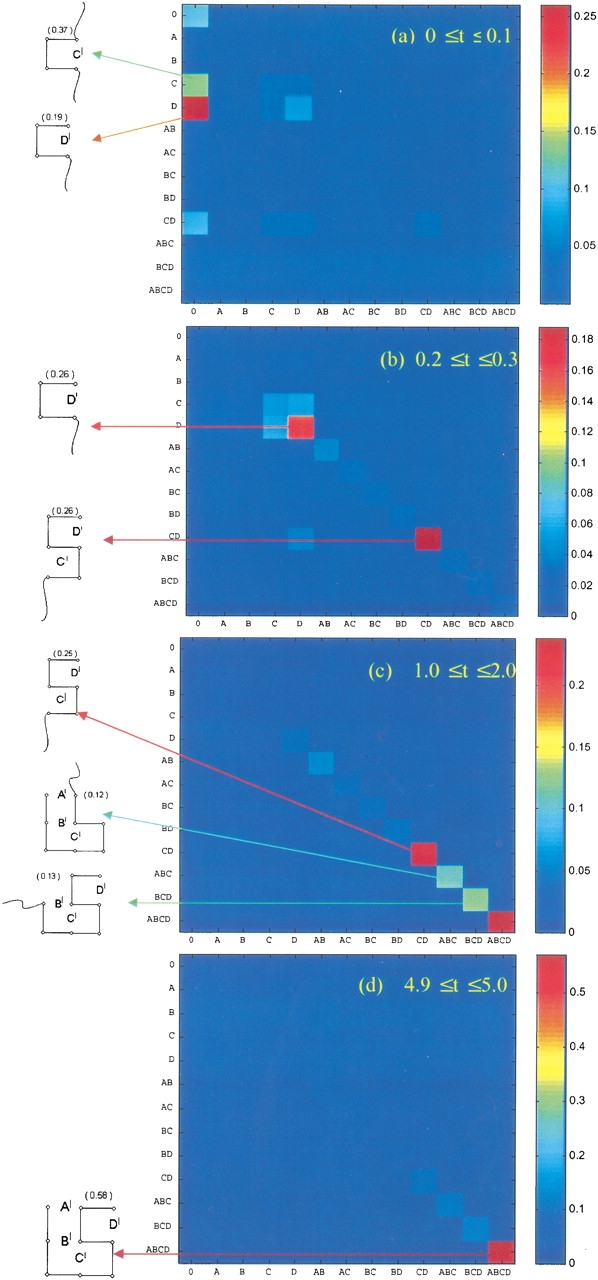
Joint probabilities P(X, t1; Y, t2) of macroconformation X (abscissa) at time t1 and macroconformation Y (ordinate) at time t2, calculated for various time intervals t1 ≤ t ≤ t2. See the color code on the right bar for the range of the probability values. The macroconformations stabilized at different stages are explicitly displayed on the left margin, along with their instantaneous probabilities.
In short, Figure 2 ▶ gives the following macrodescription of folding for the 9-mer: Helical turn D‘ forms first, then helical unit C‘ zips up, and then the β-sheet contacts B‘ and A‘ zip up on the helix that has already formed. Hence, although there are a large number of microroutes between the individual chain conformations, there is a relatively well defined description of a dominant macroscopic pathway. This was first noted in earlier simulations (Miller et al. 1992).
Moreover, we observe kinetic cooperativity. Given contact C‘D‘, the native conformation A‘B‘C‘D‘ emerges directly, without any substantial population of the intermediate structures, A‘B‘C‘ or B‘C‘D‘. The contacts A‘ and B‘ form almost simultaneously, once C‘D‘ has formed.
Macrokinetics is different from microkinetics
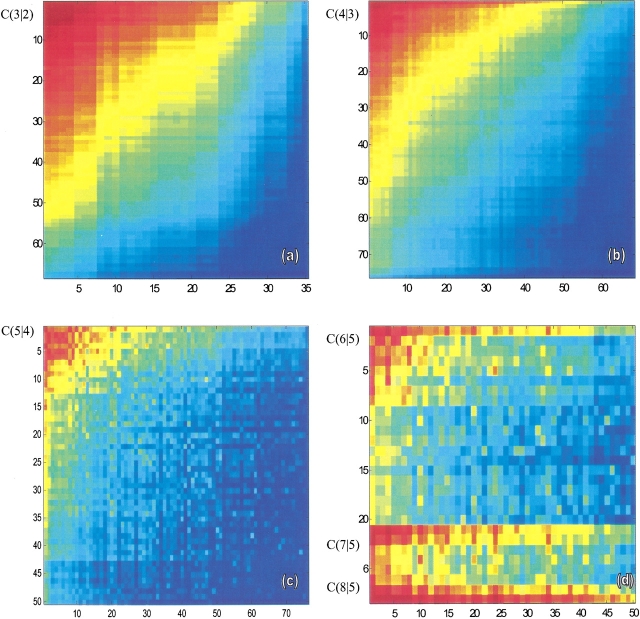
The macro and micro descriptions of the folding kinetics are very different. For example, the number of transitions per unit time between two microstates, say from conformation j to i, is given by the microscopic quantity kij. But the numbers of transitions between two macrostates is a sum of the rates over all microroutes. There is only one microroute between two microstates, but there are many microroutes between two macrostates. The multiplicity depends on the initial and final macrostates. Figure 3 ▶ illustrates this point for the 16-mer. Consider one macrostate having m native contacts, and the next macrostate along the folding pathway, having m+1 native contacts. C (m+1|m) is the transition rate from m to m+1. In Figure 3 ▶, the transition probabilities (or rates) corresponding to different pairs of macrostates (abscissa and ordinate) are shown by the color code, from red through blue in order of decreasing transition rates. The individual macrostates are rank-ordered along the x- and y-axes in order of increasing numbers of microstates, Wmic (where S/k = Wmic is the conformational entropy; Table 2).
Fig. 3.
Transition rates C (m + 1|m) between macroconformations having m (abscissa) and m + 1 (ordinate) native contacts, for m = 2, 3, and 4, shown in the maps (a–c). Map d shows the transitions to macroconformations with 7, 8, and finally 9 (all) contacts, starting from m = 5. Macroconformations are assigned serial indices in the order of decreasing conformational entropies (see Table 2). The color code, red-orange-yellow-green-cyan-blue, refers to decreasing transition probabilities. The uniform shading in a and b indicates the strong correlation between transition probabilities and conformational entropies. The spots in c signal the interference of specific interactions, which become more pronounced in d.
Figure 3a ▶ shows a uniform gradient of red at the top left to blue at the bottom right. The most frequent transitions (darkest red) are among the highest conformational-entropy macrostates, namely, those having high Wmic values (see Table 2). That is, chain conformations undergo rapid and frequent transitions broadly traversing the tops of funnel energy landscapes, but deeper on the landscape, the chains are more "stuck", so transitions are slower and more limited. A chain loses little entropy on forming local contacts; it loses much entropy in forming nonlocal contacts. Hence, the most probable transitions are those involving the most localized contacts; this has been called zipping (Dill et al. 1993; Fiebig and Dill 1993).
As we move toward more native-like conformations, from Figure 3 ▶, a through d, the rates become less dependent simply on Wmic and more dependent on the complexity of the specific native structure (Bryngelson et al. 1987). Figure 3d ▶ shows several transitions involving lower entropy conformations that have higher rates.
There is a dichotomy between micro and macro descriptions of kinetics. Figure 3a ▶ shows the huge multiplicity of microscopic pathways of folding, whereas Figures 2 and 4 ▶ ▶ show that this can be described as simple specific macroscopic sequences of events.
Fig. 4.
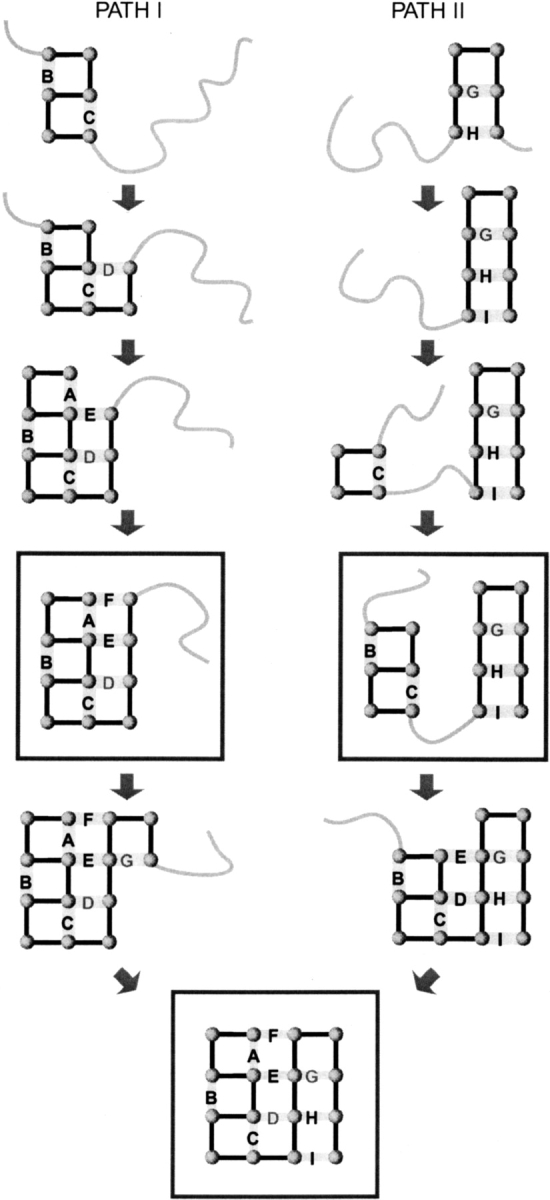
Two parallel macropaths I and II observed in the folding kinetics of the investigated 16-mer. The macropath I on the left is the fastest macropath and dominates the macroscopic folding rate.
The macroscopic kinetics involves two parallel pathways
Figure 4 ▶ shows the dominant macrostates along the two main macroroutes. There are two bottleneck macrostates: ABCDEF, which has all the helical and interdomain contacts, and BCGHI, in which the helical and sheet domains are practically formed (except for the terminal contact A) but not yet assembled. Folding proceeds in parallel through these two macroconformations. They are bottlenecks not because their intrinsic rates, kj, are small but because there are fewer exit routes than entrance routes from those conformations (Shea et al. 1999). Hence, folding stalls at those conformations. Macropath I involves the macroconformations (ABCDE and ABCDEF) that have high Wmic values (Table 2) and high fluxes (Fig. 3 ▶). This macropath has the greatest individual flux of any one macropath. Even so, the overall speed of folding is even greater than through this route alone, because there is also flow through other macroroutes (Ozkan et al. 2001).
We observe hidden kinetic intermediates
What is the evidence for HI states in folding kinetics? According to mass-action schemes I through III, true kinetic intermediates exist only when multiexponential kinetics is observed. In essence, in the simplest case of two exponential rate processes, one rate coefficient would describe the "pouring" of molecules from U to I to fill up I, and the other rate coefficient would describe the "emptying of I into N." But clearly, for single-exponential kinetic processes, only mass-action scheme I applies, meaning that there is no observable intermediate state. Englander has interpreted his data on cytochrome c in terms of what we call HIs (Bai et al. 1995; Englander 2000; Rumbley et al. 2001). These are macrostates that fill up and then empty out, even though the overall folding kinetics is only monoexponential.
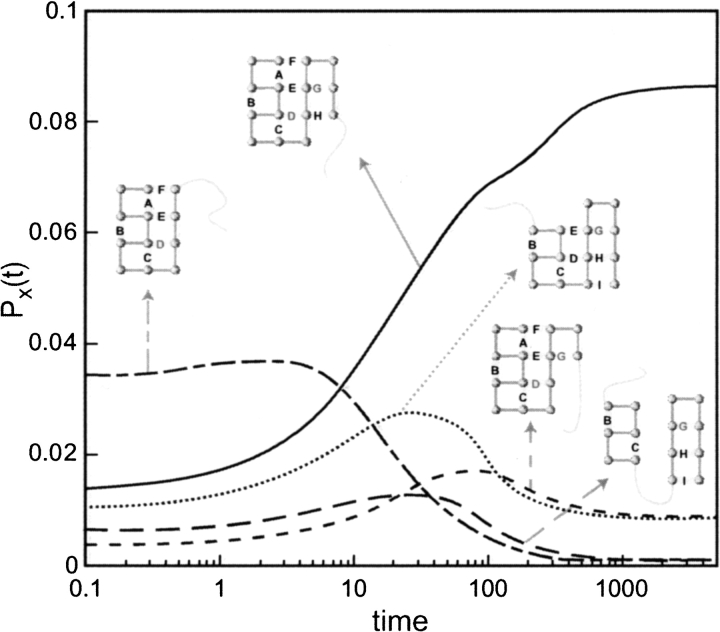
Figure 5 ▶ shows the observation of HIs in our model. It shows that a jump to folding conditions causes certain macrostates to fill up then empty out as folding proceeds, even though the overall folding follows monoexponential kinetics.
Fig. 5.
Time evolution of substructured 16-mer macroconformations. The peaks observed indicate the tendencies to accumulate before complete folding.
HIs are in parallel, not in series
There is a key difference, however, between the HIs that we observe and those proposed by Englander in his sequential stabilization model. Englander proposes that the HIs occur in series along the reaction coordinate D → I1 → I2 → I3 → N (Fig. 6a ▶), whereas ours are in parallel. Also, the progressively slower hydrogen exchange (HX) rates measured under native conditions have been ascribed to increasingly unfolded forms located along an energetically uphill staircase, down which the conformations might step in their folding sequence (Englander and Kallenbach 1983). This series model of sequential intermediates has been referred to as the staircase model (Englander 2000).
Fig. 6.
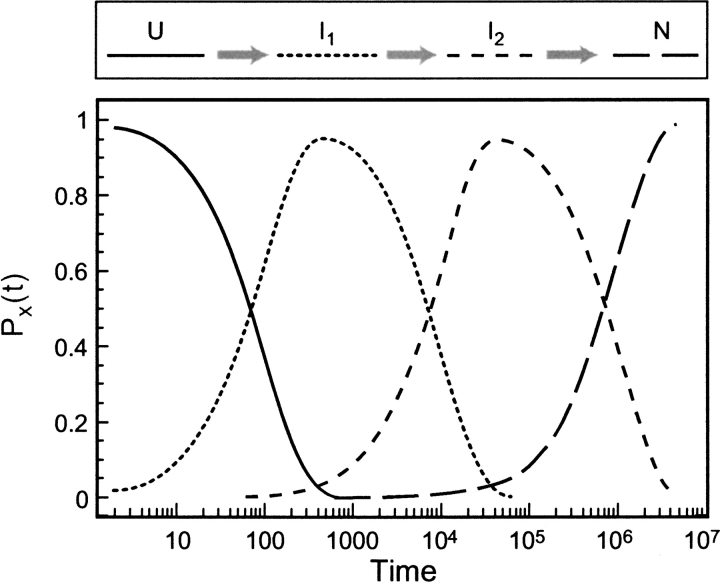
(a) Folding profile for apparent two-state folding proteins, composed of an initial rate-limiting barrier (TS) succeeded by sequentially stabilized intermediates, proposed by Englander and coworkers (Englander and Kallenbach 1983;Rumbley et al. 2001). (b) Time evolution of the probability of the states U, I1, I2 and N for the sequential scheme U〉I1〉I2〉N, using the rate constants 10−2,10−4, and 10−6/unit time for the respective steps U>I1, I1〉I2, and I2〉N, and the initial conditions PU(0) = 1 and PI1(0) = PI2(0) = PN(0) = 0.
In a series process, the emptying of one bin, indicated as a drop in the population of I2 over a certain time interval, will approximately coincide with the filling of the next bin, an increase in the population of I3. See, for example, Figure 6b ▶ showing the time evolution of the states U, I1, I2, and N for the sequential transition U → I1 → I2 → N. The curves are calculated for a fully unfolded state at t = 0—that is, PU(0) = 1 and PI1(0) = PI2(0) = PN(0) = 0—using the respective rate constants k1 = 10−2, k2 = 10−4 and k3 = 10−6/unit time for the three sequential steps. Figure 5 ▶ shows, however, that conformations BCDEGHI, ABCDEFG, and ABCGHI all fill up and empty out over the same time course and, hence, are not sequential. Moreover, Figure 5 ▶ shows another feature of parallel processes: Faster processes are not necessarily precursors of slower ones. That is, a slow step is not simply one contact more native than a faster step. The fast hidden intermediate is ABCDEF, which is indeed a simple precursor of ABCDEFG, but it is not a precursor of BCDEGH or ABCGHI.
Denaturants or temperature affects the time of appearance of HIs
Figure 7 ▶ shows the transient intermediates (or HIs) on a log-time scale. It shows that the time window of appearance of the HIs is determined by the driving force for folding, such as the concentration of denaturant, but controlled here by changing the temperature. For example, C‘D‘ reaches a population of 0.39 during the burst stage of folding when ɛ/RT = −5, which is significantly higher than its original and equilibrium populations. Such a transient accumulation might be attributed to being trapped in a local minimum along the folding pathway. The escape from this subset is faster at higher temperatures, as expected from classical rate models.
Fig. 7.
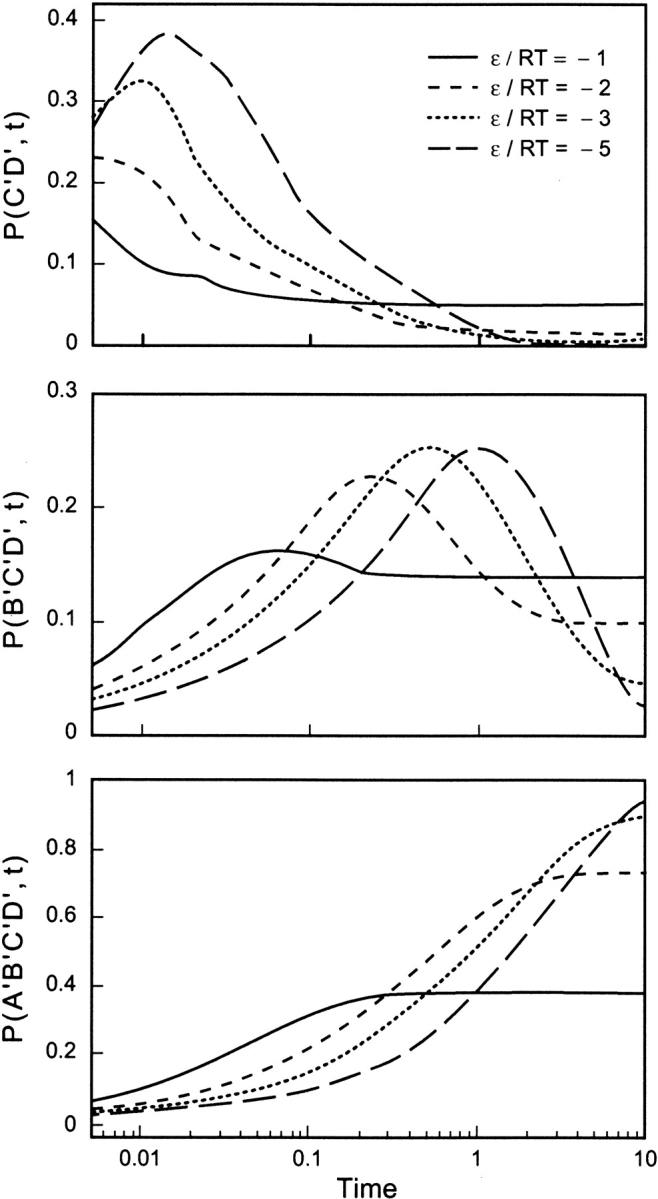
Time evolution of the partially folded substructures B‘C‘ and B‘C‘D‘, and native structure A‘B‘C‘D‘, for the 9-mer displayed in Table 1a, calculated for the indicated ɛ/kT ratios. The accumulation of the intermediates is diminished at higher temperatures (or weaker intramolecular interactions).
We tested another aspect of the sequential stabilization model. The existence of multiple HIs implies that there must be multiple "hidden transition states", which are the barriers between the HIs. We can test for them by computing a quantity we call the nucleation power of a conformation.
Nucleation power measures the tendency to act as a folding nucleus
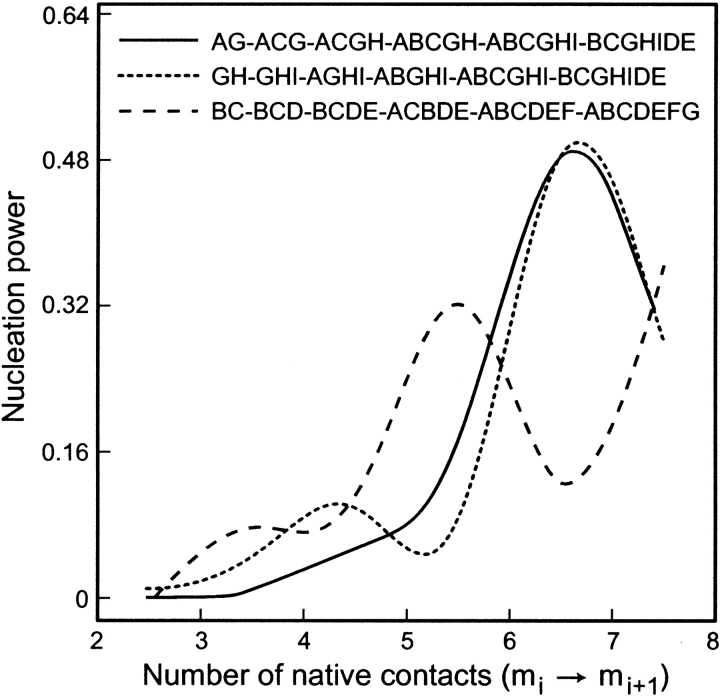
Computational studies indicate that proteins can have multiple folding nuclei (Klimov and Thirumalai 2000, 2001). We are interested in quantitating the concept of folding nucleus. Suppose you start from the unfolded state, initiate folding conditions at time t = 0, then measure the folding time, τ0, that is, the time required to reach the native state. Now if you started from a conformation having m native contacts, instead of from the unfolded state, then the time to fold would be τm. The quantity Δτm/τ0 = (τm−1 − τm)/τ0 gives a measure of the nucleation power of contact m along this macroroute. If (Δτm/τ0) = 0, it means that the addition of contact m does not accelerate folding, so m is not a nucleating contact. At the other extreme, Δτm/τ0 = 1 implies τm−1 = τ0 and τm ≈ 0 (because τm−1 and τm can only range from 0 to τ0). This represents the classical limit at which there is a single rate-limiting step, the addition of contact m, and all subsequent folding steps are instantaneous. According to the sequential stabilization hypothesis, the quantity, Δτm/τ0 plotted against the reaction coordinate should have a series of peaks and valleys, corresponding to the linear sequences of hills and valleys in Figure 6a ▶.
There are hidden transition states
Figure 8 ▶ shows the Δτm/τ0 values for three different macropaths in our model, plotted against the midpoints between m and m − 1. We note three main conclusions. First, the macroroute AG-ACG-ACGH-ABCGH-ABCGHI-BCGHIDEnative is well described as a classical nucleation process. There is a single nucleating contact. It occurs very late in folding: It is the step from the sixth to seventh contact, out of nine contacts in the native state. Second, the macroroute BC-BCD-BCDE-ABCDE-ABCDEF-ABCDEFG-native is heterogeneous (Klimov and Thirumalai 1998, 2000). There is no single nucleating contact. Both the steps from five to six and from seven to eight contacts give equivalent enhancement of folding speed. Hence, this is not a classical nucleus. The occurrence of peaks and valleys is consistent with hidden transition states. Third, it is clear that different macroroutes have different folding mechanisms, not all of which involve hidden transition states.
Fig. 8.
Nucleation power of native contacts along particular macroroutes, indicated by the incremental change in folding time τm succeeding the formation of each contact m, relative to the overall folding time τ0. The ratio Δτ/τ0 = (τm−1 − τm)/τ0 is shown for each passage from m − 1 to m contacts along four different macroroutes.
Displaying energy landscapes using singular value decomposition
Free energy landscapes for protein folding are complex and have a high dimensionality. They cannot be visualized in three-dimensions. So cartoons have generally been used to illustrate principles of landscape shapes (Dill and Chan 1997), or certain preferred coordinates can be chosen for representing landscapes (Erman et al. 1997; Chen and Dill 2000).
In the present study, we instead use a better method, based on principal components analysis (Kitao and Go 1999; Doruker et al. 2000; Garcia and Sanbonmatsu, 2001). The 16-mer conformations are organized in a 32 × M matrix, R. Each column of R represents a given conformation, and M is the number of conformations included for constructing the energy landscape. The singular value decomposition of this rectangular matrix yields a new matrix of the same size, say R‘, which is just the representation of R in the new (normal) space. Each column, then, designates the coordinates of a given conformation along the normal (principal) axes. Using the dominant two directions, that is, the first two rows of R‘, we can express the M conformations by single points on a plane spanned by the first two principal axes. The corresponding equilibrium energies determine the energy surface. Figure 9 ▶, a through c, shows a progression of increasingly narrowed representations of conformational space around the native structure.
Fig. 9.
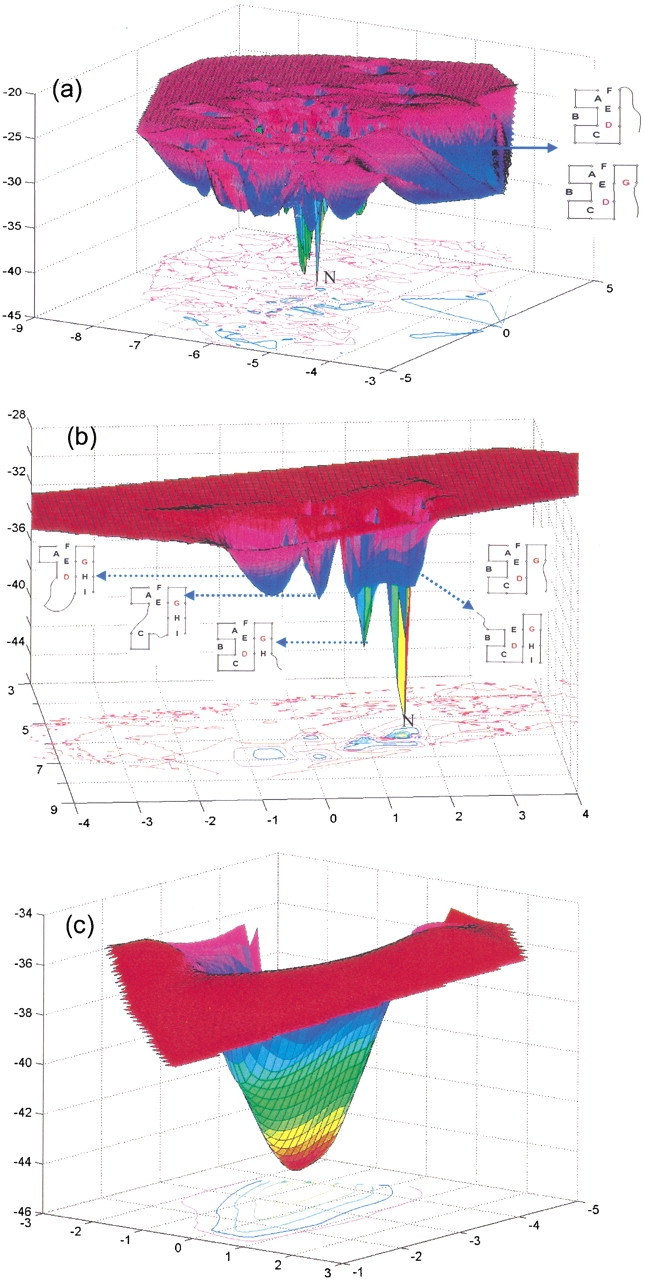
Energy landscape obtained by projecting the conformations onto the two-dimensional normal space found by the singular value decomposition of the 32-dimensional vectors defining the individual conformations. Parts a, b, and c refer to subsets of conformations having more than m = 4, 5, and 6 native contacts, respectively. The native conformation is labeled as N.
Figure 9a ▶ shows the energy surface for the subset (M = 523) of 16-mer conformations having more than four native contacts (m > 4). The shape of the landscape is complex even for this relatively small subset of conformations. The native conformation, forming the deepest minimum, is labeled N. The surface also has several local minima. Interestingly, there is a broad minimum at a distant position with respect to the native conformation (on the right), and a deep channel that is likely to serve as a macropath for the passage between this relatively stable region and the native state. Examination of the conformations that lie along this channel shows the preponderance of the macrostates ABCDEF and ABCDEFG, that is, the native-like conformations reached via the macropath I.
Figure 9b ▶ shows the energy surface for the microconformations (M = 95) having more than five native contacts. Again, the native state is the deepest minimum, and the second deepest minimum is the conformation ABCDEFGH. The broad minimum closest to these two minima includes the conformations that comply with the macrostates BCDEGHI and ABCDEFG. The macrostate BCDEGHI is composed of five conformations (Table 2). Figure 9b ▶ also shows traps: The macrostates CDEFGHI, ADEFGHI, ACEFGHI, and ABCDEHI are not readily convertible to the native conformation, despite having seven native contacts. Contacts must be broken first before they can reach the native structure.
Figure 9c ▶ shows only conformations having seven native contacts, which gives a smooth funnel shape near the native state. If more than six native contacts are made, folding is fast and simple along this landscape. We note that although folding in this model is fast, multichannel, and funnel-like in the sense that conformations are fed by higher energy conformations and pour into lower energy ones, the shapes of these landscapes can be quite complex.
Discussion
We study a simple model of fast protein folding kinetics, chosen because it has the minimal necessary ingredients for obtaining microscopic insights about two-state protein folding: single-exponential kinetics and a single native state in an otherwise large conformational space of self-avoiding polymer conformations. It is intended for the exploration of general principles, not for exploring atomic details. We use a master equation formalism, so that the kinetics can be studied rigorously and without assumptions about the microscopic nature of transition states or intermediates.
We find that folding proceeds via a large multiplicity of microscopic routes. But we find that the microscopic chain conformations can be collected into macrostates, resembling those in mass-action models, and that classical pathways can be defined in terms of sequences of macrostates. For one monomer sequence, we find two main macropathways: One involves rapid helix formation, and the other involves a slower β-sheet formation, like that found in hen egg lysozyme (Matagne et al. 1997, 1998). In agreement with our calculations, the rate of folding of lysozyme depends on the population of the α-domain intermediates (Matagne et al. 2000). We find that the sequences of macrostates can be described as a zipping process (Dill et al. 1993; Fiebig and Dill 1993) in which local contacts form early, particularly ones inside the core of the molecule, followed by nonlocal contacts.
We observe HIs: macrostates that fill up then empty out during the folding process, even though the overall kinetics is monoexponential, so these intermediates are not observable in the kinetics. A main conclusion from this work is the demonstration that increasingly structured nonnative states can contribute to two-state protein folding kinetics, even when not occurring along a single sequential pathway.
Materials and methods
We consider model proteins having N accessible conformations. The time evolution of these conformations is described by the master equation (Oppenheim et al. 1967; Bahar 1989; Gardiner 1990; Van Kampen 1990)
 |
(1) |
where P(t) is the N-dimensional vector of the instantaneous probabilities of the conformations, and A is the N × N transition (or rate) matrix describing the kinetics of the transitions between these conformations. The simultaneous solution of the above set of N differential equations gives the time-dependent probability of occurrence of the N conformations vector, P(t):
 |
(2) |
where exp{Λt} is a diagonal matrix, B is the matrix of the eigenvectors of A, and B−1 is the inverse of B. C(t) is the conditional or transition probability matrix. C(t) fully describes the time dependence of N × N transitions. The time-delayed joint probability of conformations i at time t2 and j at time t1 is found from the product C(i,t2 − t1|j,0)Pj(t1). Combination of these probabilities in
 |
(3) |
yields the time-delayed joint probability P(A,t2; B,t1) of the macroconformations A and B comprising NA and NB conformations, respectively.
Rate matrix
The conformational transition rates (elements of A) are assumed to depend on intramolecular energy barriers and on the frictional resistance of the solvent. The energy barrier is zero for passages to conformations having an equal or lower energy, and is proportional to the energy difference between the initial and final conformations for passages to a conformation of higher energy. The friction factor ensures that large conformational transitions are less frequent than smaller ones, representing the drag imposed by friction with the solvent. The frictional resistance scales with the root mean square difference, 〈(Δrij)2〉1/2, between the monomer positions of the conformations i and j, after optimal superimposition of the two conformations. Bonds have unit length. Based on these definitions, the ij-th element of A that is associated with the passage from conformation j to conformation i, becomes
 |
(4) |
 |
where ΔGij is the free energy change accompanying the transition, qi is the number of native contacts in conformation i, ν is a proportionality constant dependent on the frictional resistance, and H(qi, qj) is the heavyside step function, equal to 1 if qj > qi and zero otherwise. In the absence of viscous effects, ν = 0. Alternatively, the friction could have an inverse proportionality on viscosity, following Kramer’s rate expression (Jacob and Schmid 1999). But we preferred to include explicitly the 〈(Δrij)2〉1/2 values in the front term of Equation 4, because this gives a structural basis for different rates. We used ɛ = −5 RT and ν = 0.5 for the 9-mers, and ɛ = −2.3 RT and ν = 1.0 for the 16-mers. These parameters give reasonable stabilities and prevent computational overflows that can arise from large time scale differences between the fast and slow processes.
Initial conditions and equilibrium distribution
For 9-mers, the initial condition is taken to be the uniform distribution of all conformations; that is, Pi(0) = 1/N for all i. This represents the infinite temperature limit. For 16-mers, the initial distribution is taken to be the Boltzmann distribution at 500 K. In both cases, folding is initiated by cooling the system to room temperature (300 K), at which the equilibrium probabilities of the corresponding native conformations (n) are Pn(∞) = 0.9848 for the 9-mers, and 0.837 for the 16-mers.
Acknowledgments
We thank Walter Englander for many helpful discussions. We would also like to acknowledge a TUBITAK fellowship to S. Banu Ozkan.
The publication costs of this article were defrayed in part by payment of page charges. This article must therefore be hereby marked "advertisement" in accordance with 18 USC section 1734 solely to indicate this fact.
Article and publication are at http://www.proteinscience.org/cgi/doi/10.1110/ps.0207102.
References
- Alonso, D.O. and Daggett, V. 2000. Staphylococcal protein A: Unfolding pathways, unfolded states, and differences between the B and E domains. Proc. Natl. Acad. Sci. 97 133–138. [DOI] [PMC free article] [PubMed] [Google Scholar]
- Bahar, I. 1989. Stochastics of rotational isomeric transitions in polymer chains. J. Chem. Phys. 91 6525–6531. [Google Scholar]
- Bai, Y., Sosnick, T.R., Mayne, L., and Englander, S.W. 1995. Protein folding intermediates: Native-state hydrogen exchange. Science 269 192–197. [DOI] [PMC free article] [PubMed] [Google Scholar]
- Bryngelson, J.D. and Wolynes, P.G. 1987. Spin glasses and the statistical mechanics of protein folding. Proc. Natl. Acad. Sci. 84 7524–7528. [DOI] [PMC free article] [PubMed] [Google Scholar]
- Bryngelson, J.D., Onuchic, J.N., Socci, N.D., and Wolynes, P.G. 1995. Funnels, pathways, and the energy landscape of protein folding: A synthesis. Proteins 21 167–195. [DOI] [PubMed] [Google Scholar]
- Chen, S.J. and Dill, K. 2000. RNA folding energy landscapes. Proc. Natl. Acad. Sci. 97 133–138. [DOI] [PMC free article] [PubMed] [Google Scholar]
- Daggett, V., Li, A., Itzhaki, L.S., Otzen, D.E., and Fersht, A.R. 1996. Structure of the transition state for folding of a protein derived from experiment and simulation. J. Mol. Biol. 257 430–440. [DOI] [PubMed] [Google Scholar]
- Dill, K.A. and Chan, H.S. 1997. From Levinthal to pathways to funnels. Nat. Struct. Biol. 4 10–19. [DOI] [PubMed] [Google Scholar]
- Dill, K.A., Fiebig, K.M., and Chan, H.S. 1993. Cooperativity in protein-folding kinetics. Proc. Natl. Acad. Sci. 90 1942–1946. [DOI] [PMC free article] [PubMed] [Google Scholar]
- Dinner, A.R., Sali, A., Smith, L.J., Dobson, C.M., and Karplus, M. 2000. Understanding protein folding via free-energy surfaces from theory and experiment. Trends Biochem. Sci. 25 331–339. [DOI] [PubMed] [Google Scholar]
- Dokholyan, N.V., Buldyrev, S.V., Stanley, H.E., and Shakhnovich, E.I. 2000. Identifying the protein folding nucleus using molecular dynamics. J. Mol. Biol. 296 1183–1188. [DOI] [PubMed] [Google Scholar]
- Doruker, P., Atilgan, A.R., and Bahar, I. 2000. Dynamics of proteins predicted by molecular dynamics simulations and analytical approaches: Application to α-amylase inhibitor. Proteins 40 512–524. [PubMed] [Google Scholar]
- Englander, S.W. 2000. Protein folding intermediates and pathways studied by hydrogen exchange. Annu. Rev. Biophys. Biomol. Struct. 29 213–238. [DOI] [PubMed] [Google Scholar]
- Englander, S.W. and Kallenbach, N.R. 1983. Hydrogen exchange and structural dynamics of proteins and nucleic acids. Q. Rev. Biophys. 16 521–655. [DOI] [PubMed] [Google Scholar]
- Erman, B., Bahar, I., and Jernigan, R.L. 1997. Equilibrium states of rigid bodies with multiple interaction sites. J. Chem. Phys. 107 2046–2059. [Google Scholar]
- Fiebig, K.M. and Dill, KA. 1993. Protein core assembly processes. J. Chem. Phys. 98 3475–3487. [Google Scholar]
- Galzitskaya, O.V. and Finkelstein, A.V. 1999. A theoretical search for folding/unfolding nuclei in three-dimensional protein structures. Proc. Natl. Acad. Sci. 96 11299–11304. [DOI] [PMC free article] [PubMed] [Google Scholar]
- Garcia, A.E. and Sanbonmatsu, K.Y. 2001. Exploring the energy landscape of a β hairpin in explicit solvent. Proteins 42 345–354. [DOI] [PubMed] [Google Scholar]
- Gardiner, G.W. 1990. Handbook of stochastic methods for physics, chemistry, and natural dciences. Springer, London.
- Ikai, A. and Tanford, C. 1971. Kinetic evidence for incorrectly folded intermediate states in the refolding of denatured proteins. Nature 230 100–102. [DOI] [PubMed] [Google Scholar]
- Jacob, M. and Schmid, F.X. 1999. Protein folding as a diffusional process. Biochemistry 38 13773–13779. [DOI] [PubMed] [Google Scholar]
- Kitao, A. and Go, N. 1999. Investigating protein dynamics in collective coordinate space. Curr. Opin. Struct. Biol. 9 164–169. [DOI] [PubMed] [Google Scholar]
- Klimov, D.K and Thirumalai, D. 1998. Lattice models for proteins reveal multiple folding nuclei for nucleation-collapse mechanism. J. Mol. Biol. 282 471–492. [DOI] [PubMed] [Google Scholar]
- ———. 2000. Mechanisms and kinetics of β-hairpin formation. Proc. Natl. Acad. Sci. 97 2544–2549. [DOI] [PMC free article] [PubMed] [Google Scholar]
- ———. 2001. Multiple protein folding nuclei and the transition state ensemble in two-state proteins. Proteins 43 465–475. [DOI] [PubMed] [Google Scholar]
- Lazaridis, T. and Karplus, M. 1997. "New view" of protein folding reconciled with the old through multiple unfolding simulations. Science 278 1928–1931. [DOI] [PubMed] [Google Scholar]
- Li, L., Mirny, L.A., and Shakhnovich, E.I. 2000. Kinetics, thermodynamics and evolution of non-native interactions in a protein folding nucleus. Nat. Struct. Biol. 7 336–342. [DOI] [PubMed] [Google Scholar]
- Matagne, A., Radford, S.E., and Dobson, C.M. 1997. Fast and slow tracks in lysozyme folding: Insight into the role of domains in the folding process. J. Mol. Biol. 267 1068–1074. [DOI] [PubMed] [Google Scholar]
- Matagne, A., Chung, E.W., Ball, L.J., Radford, S.E., Robinson, C.V. and Dobson, C.M. 1998. The origin of the α-domain intermediate in the folding of hen lysozyme. J. Mol. Biol. 277 997–1005. [DOI] [PubMed] [Google Scholar]
- Matagne, A., Jamin, M., Chung, E.W., Robinson, C.V., Radford, S.E., and Dobson C.M. 2000. Thermal unfolding of an intermediate is associated with non-Arrhenius kinetics in the folding of hen lysozyme. J. Mol. Biol. 297 193–210. [DOI] [PubMed] [Google Scholar]
- Miller, D.W. and Dill, K.A. 1995. A statistical mechanical model for hydrogen exchange in globular proteins. Protein Sci. 4 1860–1873. [DOI] [PMC free article] [PubMed] [Google Scholar]
- Miller, R., Danko, C.A., Fasolka, M.J., Balazs, A.C., Chan, H.S., and Dill, K.A. 1992. Folding kinetics of proteins and copolymers. J. Chem. Phys. 96 768–780. [Google Scholar]
- Munoz, V., Henry, E.R., Hofrichter, J., and Eaton, W.A. 1998. A statistical mechanical model for β-hairpin kinetics. Proc. Natl. Acad. Sci. 95 5872–5879. [DOI] [PMC free article] [PubMed] [Google Scholar]
- Oppenheim, I., Shuler, K.E., and Weiss, G.H. 1967. Stochastic theory of multistate relaxation processes. Adv. Mol. Relax Processes 1 13. [Google Scholar]
- Ozkan, S.B., Bahar, I., and Dill, K.A. 2001. Transition states and the meaning of φ-values in protein folding kinetics. Nat. Struct. Biol. 8 765–769. [DOI] [PubMed] [Google Scholar]
- Pande, V.S. and Rokhsar, D.S. 1999a. Folding pathway of a lattice model for proteins. Proc. Natl. Acad. Sci. 96 1273–1278. [DOI] [PMC free article] [PubMed] [Google Scholar]
- ———. 1999b. Molecular dynamics simulations of unfolding and refolding of a β-hairpin fragment of protein G. Proc. Natl. Acad. Sci. 96 9062–9067. [DOI] [PMC free article] [PubMed] [Google Scholar]
- Pande, V.S., Grosberg, A.Y., Tanaka, T., and Rokhsar, D.S. 1998. Pathways for protein folding: Is a new view needed? Curr. Opin. Struct. Biol. 8 68–79. [DOI] [PubMed] [Google Scholar]
- Rumbley, J., Hoang, L., Mayne, L., and Englander, S.W. 2001. An amino acid code for protein folding. Proc. Natl. Acad. Sci. 98 105–112. [DOI] [PMC free article] [PubMed] [Google Scholar]
- Sali, A., Shakhnovich, E., and Karplus, M. 1994. How does a protein fold? Nature 369 248–251. [DOI] [PubMed] [Google Scholar]
- Shea, J.E., Onuchic, J.N., and Brooks III, C.L.. 1999. Exploring the origins of topological frustration: Design of a minimally frustrated model of fragment B of protein A. Proc. Natl. Acad. Sci. 96 12512–12517. [DOI] [PMC free article] [PubMed] [Google Scholar]
- Socci, N.D., Onuchic, J.N., Wolynes, P.G. 1998. Protein folding mechanisms and the multidimensional folding funnel. Proteins 32 136–158. [PubMed] [Google Scholar]
- Thirumalai, D. and Klimov, D.K. 1999. Deciphering the timescales and mechanisms of protein folding using minimal off-lattice models. Curr. Opin. Struct. Biol. 9 197–207. [DOI] [PubMed] [Google Scholar]
- Tsong, T.Y., Baldwin, R.L., and Elson, E.L. 1971. The sequential unfolding of ribonuclease A: Detection of a fast initial phase in the kinetics of unfolding. Proc. Natl. Acad. Sci. 68 2712–2715. [DOI] [PMC free article] [PubMed] [Google Scholar]
- Van Kampen, N.G. 1992. Stochastic processes in physics and chemistry. North-Holland, Amsterdam.
- Veitshans, T., Klimov, D., and Thirumalai, D. 1997. Protein folding kinetics: timescales, pathways and energy landscapes in terms of sequence-dependent properties. Fold Des. 2 1–22. [DOI] [PubMed] [Google Scholar]
- Ye, Y.J., Ripoll, D.R., and Sheraga H.A. 1999. Kinetics of cooperative protein folding involving two separate conformational families. Comp Theor. Polymer Sci 9 359–370. [Google Scholar]


