



Abstract
The interaction between like-charged amino acid residues has been proposed to stabilize the folded state of peptides and proteins, and to modulate the substrate binding and the action mechanism of enzymes. We have used an alanine- and lysine-based peptide as a model system to study the interaction between like charges, and we have performed a 16-nsec molecular dynamics simulation in solution. The calculated potential of mean force for the approach of the lysine’s Nζ atoms showed a minimum at a distance of 0.7 nm, in agreement with the separation probabilities obtained from analysis of protein crystal structures. The analysis of the individual energy components showed that the solvent polarization pays for the approach of the like charges and that the van der Waals energies do not contribute significantly. The entropic contributions have been divided in conformational and desolvation terms. Both terms favor the formation of the charge pair. A 10-fold increase in counterion concentration was observed—with respect to its bulk concentration—next to the peptide charges, which helps to stabilize the peptide charges at a close distance.
Keywords: Ala–Lys peptides, helical peptides, electrostatic interactions, solvent polarization, molecular dynamics simulation, like-charges interactions
Electrostatics plays a major role in determining the structure and function of macromolecules (Perutz 1978; Warshel and Åqvist 1991; Honig and Nicholls 1995). The interaction between opposite charged residues (salt bridges) is a common feature in the structure of globular proteins (Barlow and Thornton 1983). Despite some controversy (Hendsch and Tidor 1994), salt bridges are now believed to be a stabilizing factor of the native state of proteins (Kumar and Nussinov 1999; Takano et al. 2000) as well as the α-helical conformation in designed peptides (Marqusee and Baldwin 1987; Smith and Scholtz 1998; Olson et al. 2001).
The study of the interaction between like-charged ions in solution has attracted much attention among theoreticians. These investigations have covered a wide range of theoretical methods, including ab-initio calculations, molecular dynamics and Monte Carlo simulations, conformational searches, and integral equations (Pettitt and Rosky 1986; Dang and Pettitt 1987; Buckner and Jorgensen 1989; Boudon et al. 1990; Dang and Pettitt 1990; Bader and Chandler 1992; Hummer et al. 1993; No et al. 1997; Soetens et al. 1997; Vila et al. 1998; Cho et al. 2000). Molecular dynamics and Monte Carlo simulations that used truncation schemes to handle electrostatics interactions (Dang and Pettitt 1987; Buckner and Jorgensen 1989; Boudon et al. 1990; Dang et al. 1990; Soetens et al. 1997) have shown that the potential of mean force (PMF) for the interaction between two ions of like charge can present two minima. These two minima correspond to the contact ion pair, with an interionic distance of ∼0.3–0.4 nm, and the solvent-separated ion pair, with an interionic distance of ∼0.6–0.7 nm. For some interacting ions, the contact ion pair is the global minimum of the calculated PMF. These results have been challenged by Bader and Chandler (1992) and by Hummer et al. (1993), whose calculated PMFs without the use of truncation for the electrostatic interactions do not show minima. The presence of minima in the PMF is remarkable because it is in clear contradiction to the results of continuum theory for which the PMF is always repulsive.
Close contact between like-charged residues was observed in crystal structures of proteins (Magalhaes et al. 1994; Soetens et al. 1997; Vila et al. 1998) in earlier molecular dynamics simulations of the active site region of ribonuclease (Brünger et al. 1985) and lysozyme (Brooks and Karplus 1989), and in conformational searches on Ala–Lys peptides (Vila et al. 1998). Moreover, the interaction between like-charged residues was proposed to stabilize the native state of proteins (Soetens et al. 1997) and the α-helix conformation of Ala–Lys peptides (Vila et al. 1998).
Because almost all previous work with like-charged ions was done with free atomic or molecular ions in solution, we found it interesting to study this interaction in an environment more relevant to peptides and proteins, that is, one that takes into account the interaction of the charges with the backbone field, the conformational flexibility of the interacting charges (because they are not free but attached to the backbone), the hydrophobic effect, the role of counterions, and so forth.
Here we report the molecular dynamics simulation of the hexapeptide Ac-AKAAAK-NMe with explicit representation of the solvent. The peptide is held in the α-helix conformation by applying position restraints. We have chosen this model system because larger peptides containing this sequence are likely to spontaneously adopt an α-helix structure (Marqusee et al. 1989), and the lysine residues are on the same side of the helix barrel, allowing full interaction between their charges. The PMF for the approach of the like charges in solution were calculated. Then the different energetic and the entropic components were examined in detail. The conformations adopted for the lysine’s side chains, and the preferred location of the counterions are also analyzed and discussed.
Results
Overall properties
Because of the use of position restraints in the backbone atoms, the peptide was confined to the α-helix region during the simulation. The distance between the Nζ atoms of the lysine residues was chosen as the reaction coordinate. The PMF, W(r), was computed from the frequency of occurrence of a given distance using the formula:
 |
(1) |
where p(r) is the probability of the Nζ–Nζ distance r, R is the gas constant, and T is the absolute temperature (here 300 K). Figure 1 ▶ shows the PMFs for the simulations of the peptide in solution and in vacuum. The simulation in vacuum serves to establish which is the maximum possible separation between the charges. In vacuum, the equilibrium Nζ–Nζ distance oscillates around 1.4 nm. This long equilibrium distance is the result of the compromise between the strong repulsion of the positive charges on one hand, and the restriction imposed by the bonds on the other. The PMF in solution is wider than in vacuum, has a single minimum with an equilibrium distance of 0.7 nm, and rises considerably at short (<0.5 nm) and at long (>1.5 nm) distances. At a distance of 0.7 nm the NH3+ are not in contact but separated by a distance that is longer than the diameter of one water molecule. For this system, the contact ion pair is not observed, because there is no second minimum at shorter distances. Figure 2, A and B ▶, shows the distances between the Nζ atoms together with the distances between each Nζ and each counterion as a function of the simulation time. The distances are shown for two portions of the trajectory of about 1.5-nsec long each. Figure 2A ▶ shows that, in this portion of the trajectory, the lysine ends are close to each other and that, most of the time, one chloride counterion (Cl−b in Fig. 2A ▶) is close (<0.7 nm) to both Nζ atoms. In Figure 2B ▶ the two counterions are far (>1.5 nm) from the Nζ atoms. It can be seen that the positive charges still approach each other, but their movement spans a wider region than the one shown in Figure 2A ▶. The PMFs calculated for these two portions of the dynamics are illustrated in Figure 3 ▶. This figure shows that when one counterion is close to the lysine charges, the attraction is stronger, that is, the minimum in the PMF is shifted to shorter separations. The highly dynamic nature of the interaction is clear from Figure 2, A and B ▶: the Nζ atoms approach and separate within a few picoseconds.
Fig. 1.

Potentials of mean force for the interaction between the Nζ atoms of Lys2 and Lys6 of the peptide Ac-AKAAAK-NMe in α-helix conformation, corresponding to simulations in solution and in vacuum.
Fig. 2.

Distance between lysine Nζ atoms (upper panels), and the distance between Nζ atoms and Cl− ions (lower panels), for two different portions of the simulation in solution. Color code for the lower panels: Nζ2–Cl−a black; Nζ2–Cl−b green; Nζ6–Cl−a red; Nζ6–Cl−b blue. (A) From 4000 to 5500 psec. (B) From 8750 to 10,000 psec.
Fig. 3.

Potential of mean force for the interaction between the Nζ atoms of Lys2 and Lys6 of the peptide Ac-AKAAAK-NMe in the α-helix conformation, corresponding to the portions in panels A and B shown in Figure 2 ▶.
Energetics
To find the cause of the observed attraction, we have calculated the energy components along the reaction coordinate (Levi and Gallicchio 1998). The total energy E of the system is, in the GROMOS-87 force field:
 |
(2) |
where Eint is the sum of bond, bond-angle, and torsional energies; Ecul is the total coulombic energy; and Evdw is the total van der Waals energy. Because the last two terms are a pairwise summation, they have been further divided for the purpose of our analysis:
 |
(3) |
Each term on the right is, respectively, the sum of the coulombic interaction between all pairs of atoms within the peptide (EculPep–Pep), between the atoms in the peptide and the atoms in the solvent (EculPep–Sol), between the atoms in the peptide and the Cl− ions (EculPep–Cl−), between the atoms of the solvent (EculSol–Sol), between the atoms of the solvent and the Cl− ions (EculSol–Cl−), and between Cl− ions (EculCl−–Cl−). In the same way, the total van der Waals energy was divided in:
 |
(4) |
 |
With the use of particle mesh Ewald (PME) to handle electrostatics, we can only discriminate the pairwise interactions up to 0.9 nm because this is the cutoff distance used for the real space sum. This problem was circumvented as follows. First, the electrostatics terms that involved the solvent were recalculated using a 1.7-nm cutoff for the frames saved during the trajectory. This new computation took only 1/100 of the time needed for the whole simulation (using PME) because the frames were saved every 100 steps. Second, for the Pep–Cl− term, the water molecules were removed, one Nζ and one Cl− were neutralized, and the energies were recalculated using PME. This was repeated for every Nζ–Cl− combination and the obtained energies were summed up to give the Pep–Cl− electrostatic term of equation 3. Last, the Cl−–Cl− term was calculated using the Coulomb law with the minimum distance between the ions or one of its images. We have not applied any correction for the cutting off of the van der Waals energies. Therefore, these energies were used as obtained from the simulation. Figure 4 ▶ shows the average of the recalculated electrostatic components as a function of the Nζ–Nζ distance.
Fig. 4.

The average electrostatic energy components of the total energy as a function of the Nζ–Nζ distance. EculPep–Pep, EculPep–SoL, EculPep–Cl−, EculSol–Sol, EculSol–Cl−, and EculCl−–Cl− correspond to the electrostatic interactions within the peptide, between the peptide and the solvent, between the peptide and Cl− ions, between the solvent molecules, between the solvent and the Cl− ions, and between the Cl− ions, respectively. The displayed values are the average energies calculated over five equally long portions of the trajectory. The error bars represent ± 1 SD from the five determinations.
The total electrostatic energy is the result of several opposing terms, which are discussed in more detail in the following paragraph. The EculPep–Pep is the energy that the system must surmount to bring the positive NH3+ groups together. This clearly repulsive energy amounts to ca. +160 kJ/mole in the 0.5–1.3-nm range. The global negative sign of this term is mainly due to the four intramolecular hydrogen bonds in the peptide. The approach of the two positive charges induces favorable electrostatics interactions between the peptide and the water molecules (Fig. 4, E ▶culPep–Sol), probably as a result of the increased charge-to-volume ratio and, consequently, a more efficient polarization of the solvent. The favorable interaction is estimated in −260 kJ/mole within the displayed range. The interaction between the peptide and the counterions (Fig. 4, E ▶culPep–Cl−) is attractive and amounts to approximately −50 kJ/mole (in the shown range). This indicates that, on the average, the counterions approach the charged peptide as the Nζ atoms approach each other (see also Fig. 8 ▶). The reorientation of the water molecules around the peptide as the Nζ–Nζ distance diminishes reduces the interaction between the water molecules (Fig. 4, ▶EculSol–Sol). This suggests a disruption of the hydrogen bond network of the solvent around the peptide charges. The reduction of the water–water interaction hinders the approach of the Nζ atoms in ∼+150 kJ/mole. The solvation of the chloride ions (Fig. 4, E ▶culSol–Cl−) must be analyzed in relation to their interaction with the peptide (Fig. 4, ▶EculPep–Cl−). In this context, it can be seen that, as the chlorides approach the peptide, they lose their favorable interaction with the solvent. This dehydration of the chloride ions hinders the Nζ–Nζ approach in ∼+50 kJ/mole. The EculCl−–Cl− varies only 10 kJ/mole in the displayed range.
Fig. 8.
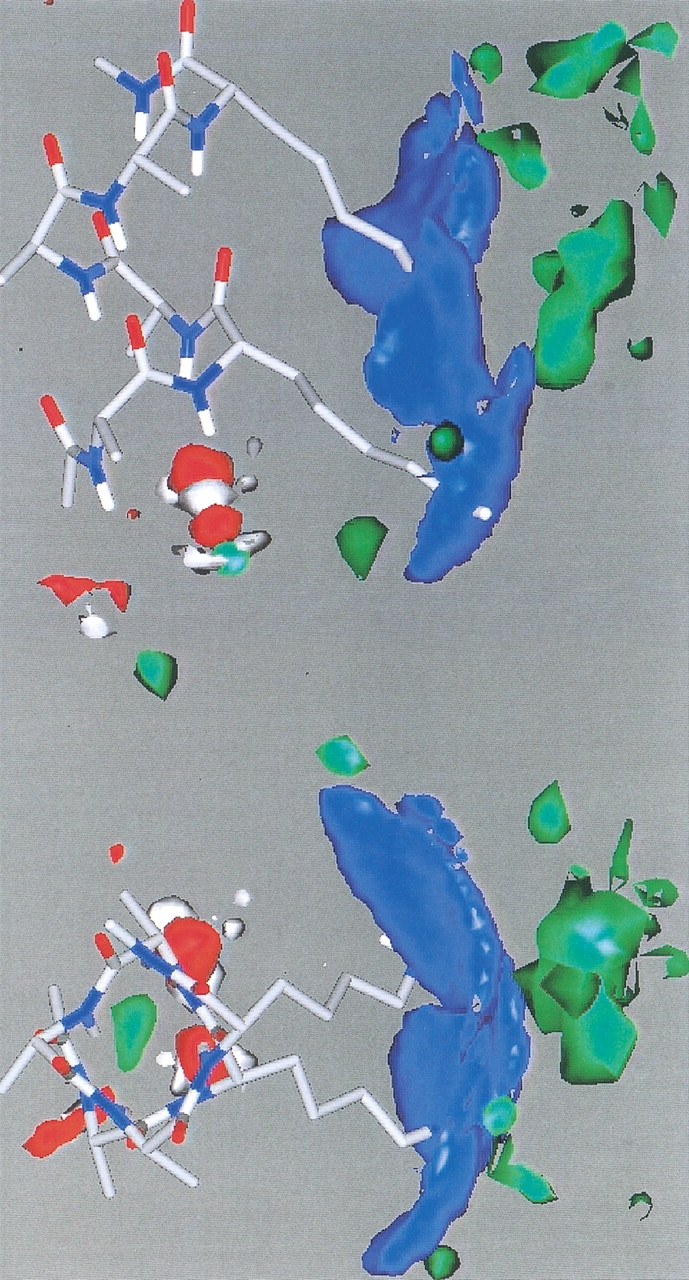
Atomic isodensity surfaces. The color code and the density values are as follows: blue for the Nζ atoms, density = 5 M; green for the Cl− ions, density = 1 M; red for the water oxygens, density = 440 M; and white for water hydrogens, density = 440 M. The densities were determined by direct counting of the corresponding atoms within cubic cells of 0.05 nm per side. The bulk density of Cl− ions is 0.075 M. The figure was prepared with gOpenMol (Laaksonen 1992).
The van der Waals energies are illustrated in Figure 5 ▶. As the Nζ–Nζ atoms approach, the lateral chains develop favorable interactions and thus EvdwPep–Pep becomes more negative. The reduction in EvdwPep–Pep is completely compensated by the reduction in the peptide–water van de Waals energy (Fig. 5, E ▶vdwPep–Sol). In other words, as the peptide becomes more compact, it establishes new intrapeptide contacts but reduces the solvent-accessible surface area, the magnitude of the energetic changes being the same. The rest of the terms in equation 4 are essentially constant along the reaction coordinate (not shown).
Fig. 5.

The average van der Waals energy components of the total energy as a function of the Nζ–Nζ distance. EvdwPep–Pep, EvdwPep–Sol, correspond to the van der Waals interactions within the peptide, and between the peptide and the solvent molecules, respectively. The displayed values are the average calculated on five equally long portions of the trajectory. The error bars represent ± 1 SD from the five determinations.
Entropy
We now turn to the entropic contributions to the charge-pairing process. They can be separated in intramolecular conformation (Sconf) and solvent contributions (Ssolv) (Brady and Sharp 1997):
 |
(5) |
As in the case of the calculation of the PMFs, we take the system at the Nζ–Nζ distance of 0.7 nm (the equilibrium distance) as the reference state. Sconf was calculated using the Boltzmann formula:
 |
(6) |
where the pi(r) is the probability of the conformer i at Nζ–Nζ distance r. The probabilities have been determined with the conformational analysis described in Materials and Methods (similar calculations were carried out by Cramer and Rose 1992). Figure 6 ▶ shows that the conformational contribution (expressed as −TΔS) has a flat minimum between 0.6 and 1.0 nm. A closer look at the conformational analysis reveals that this minimum is a consequence of the fact that the system has more ways to achieve Nζ–Nζ distances in this range than in ranges corresponding to shorter or longer distances. For example, in the Nζ–Nζ ranges 0.45–0.50 nm and 1.35–1.40 nm, there are only 11 and 4 different conformers, respectively, whereas in the range between 0.65–0.70 nm, there are 82. The solvent contribution to the entropy was calculated using the empirically determined formula of Weng et al. (1997) (see also Murphy and Freire 1992):
 |
(7) |
where ΔAapol(r) is the change in hydrophobic solvent-accessible surface area with respect to the system at a Nζ–Nζ distance of 0.7 nm. The contribution that results from changes in the exposure of polar groups was much smaller and it was not taken into account. The result for Ssolv is also displayed in Figure 6 ▶. It can be seen that, as the charges approach, the hydrophobic CH2 groups of lysine residues are less exposed to the solvent and when the distance drops below 0.6 nm, the area reduction levels off. The combined entropic effects (Fig. 6 ▶, Ssolv+Sconf) clearly favor the charge-pairing process.
Fig. 6.

The entropic contributions to the free energy along the reaction coordinate. Sconf is the conformational entropy calculated according to equation 6. Ssolv is the desolvation entropy calculated from the changes in hydrophobic-accessible surface area with equation 7. Ssol + Sconf is the sum of the conformational and desolvation terms. The results are reported as −TΔS. The values at 0.7 nm are taken as reference and the temperature is 300 K.
Conformations and atomic densities
The conformational analysis indicates that there are 112 different conformers. The five most populated are listed in Table 1. It can be seen that there is no single dominating conformation. The most populated, which accounts only for the 11.79% of the total, has the χ1 dihedral in g− and χ2, χ3, and χ4 in t for the two lysine residues, as commonly found for lysine residues in proteins (Dunbrack and Cohen 1997). The first three most populated conformers are displayed in Figure 7 ▶. The NH3+ groups for these three conformers, as well as for most of the others, are pointing toward the positive end of the helix macrodipole. This could indicate a weak interaction of the lysine charges with the helix macrodipole, most probably because of the screening effect of the water polarization, and the concentration of negative charge at the N terminus of the peptide, as discussed following (for discussions about helix dipole–charge interaction, see Åqvist et al. 1991; Sitkoff et al. 1994). Groebke et al. (1996), in an NMR study of Ala–Lys peptides of similar sequences to the one studied in this work, have also reported conformations with the lysine ends pointing to the N terminus of the helix, and with the CH2 groups close to the helix barrel. The conformations in Figure 7 ▶ also present the tight packing of the CH2 groups of neighbor lysines reported by Vila et al. (1998) for Ala–Lys peptides, but the conformations in Figure 7 ▶ do not have the NH3+ groups pointing toward opposite directions as were the conformations found by Vila et al. (1998). However, they also reported that the most probable Nζ–Nζ distance is in the 0.55–0.8-nm range.
Table 1.
The main conformations adopted by the lateral chains of the Lys residues in the peptide Ac-AKAAAK-NMe
| Conformer | ||
| Lys2 | Lys6 | Population (%) |
| g−, t, t, t | g−, t, t, t | 11.79 |
| g−, t, t, t | g−, g−, t, t | 7.10 |
| g+, t, t, t | g−, t, t, t | 6.40 |
| g+, t, t, t | t, t, t, t | 3.24 |
| t, t, t, t | g−, t, t, t | 3.22 |
The angles are listed in the following order: χ1, χ2, χ3, χ4.
See text for the definitions of t, g+, g−.
Fig. 7.
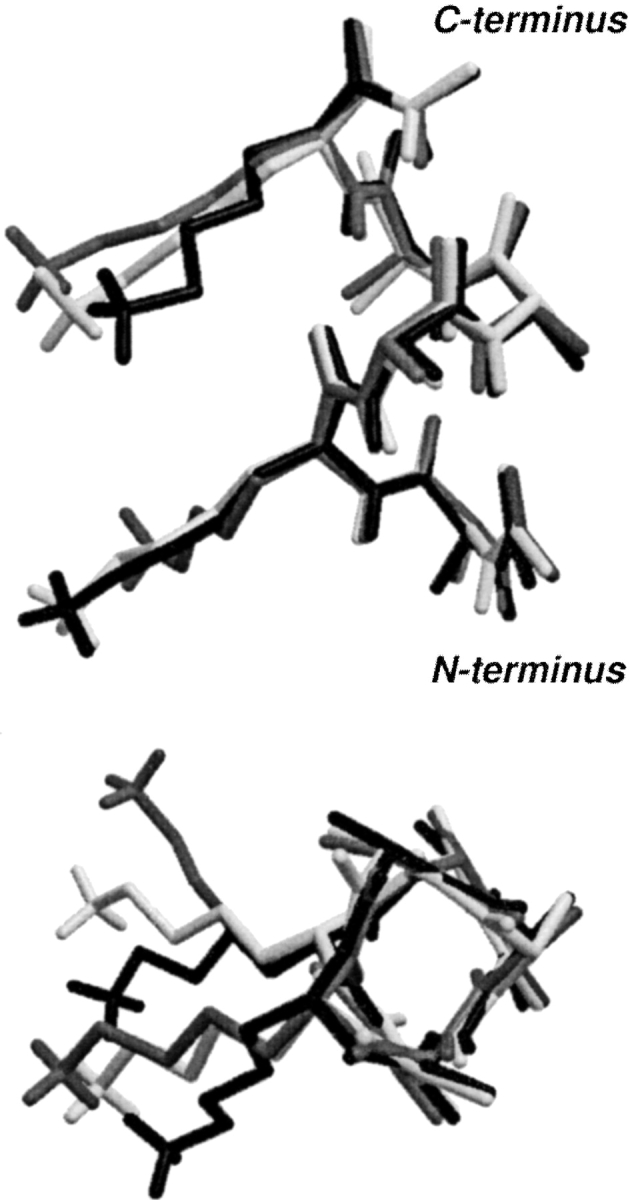
The three most populated conformers in solutions for the peptide Ac-AKAAAK-NMe in the α-helix conformation.
According to the PMFs shown in Figure 3 ▶, the chloride ions strengthen the interaction between the positive charges. To see if there is a preferred position of these ions with respect to the peptide, we computed the partial atomic densities for the Cl− ions, the Nζ atoms of the peptide, and the oxygen and hydrogen atoms of the water molecules. The isodensities shown in Figure 8 ▶ indicate that the Cl− occupies mainly two positions: bridging the positive charges, and at the N terminus of the helix. It can also be seen that there is a high concentration of water at the positive end of the helix barrel, and that they are highly polarized because the water oxygens are closer to the peptide than the water hydrogens. These water molecules bridge the peptide and the Cl− ions and also screen the helix macrodipole.
Discussion
Our simulations show that the positive charges of the Lys residues in the studied peptide do not repel each other but rather tend to approach at short distances. The PMF for the approach of the NH3+ groups has a minimum at 1.4 nm in vacuum, whereas in solution the minimum occurs at 0.7 nm. We calculated a ΔG = −10 kJ/mole for the process of bringing the Nζ atoms from 1.4 nm to 0.7 nm in solution. The equilibrium distance observed in solution corresponds to the solvent-separated ion pair. The large sampling performed allowed us to analyze the charge-pairing process in terms of individual energetic and entropic contributions. The repulsion between the positive charges increases the total energy as they approach each other. This increase is compensated by the polarization of the solvent. The enhancement in solvent polarization could be explained by the increase of charge density produced by placing the two Lys charges in a smaller volume. At the same time, these more polarized water molecules around the NH3+ groups disrupt the local hydrogen bond network of the water, and the electrostatic water–water interaction diminishes. The approach of the counterions serves as a bridge between the positive charges, reducing their repulsion and then helping to stabilize the NH3+ groups at a short distance. The changes in the van der Waals energy components are one order of magnitude lower than the changes in the electrostatic terms. As the NH3+ groups approach, favorable van der Waals interactions are established between the atoms of the peptide, but there is a reduction in the peptide–water contacts that counterbalances such an increase. This energetic balance in the van der Waals interactions is in agreement with the hypothesis that intramolecular van der Waals interactions contribute marginally to determine the folding of proteins and the binding of ligands (see Weng et al. 1997 and references therein).
Under the studied conditions, that is, free side chains on a rigid backbone, the conformational entropy helps to shape the PMF for a simple reason: there are more conformations that result in NH3+ groups at the equilibrium distance than there are conformations in which the NH3+ groups are either more separated or in contact. It is also instructive to compare the present scenario of two charges attached by bonds getting closer with the approach of two independent ions that are free to move in the solution. The approach of two ions free in solution, whether of the same or different charge, is seriously hindered by entropy. When the ions at a distance r1 approach each other at a distance r2, the translational entropy loss, ΔStras, can be estimated to be:
 |
(8) |
where k is the Bolztmann constant.
In the peptide as well as in a given protein, the restriction imposed by the bonds increases the effective concentration of the charges and therefore diminishes the translational entropic penalty for the formation of the charge pair. The entropic contribution resulting from the hydrophobic effect was evaluated from the changes in the solvent-accessible surface area. We conclude that pairing of the NH3+ groups is favored by the hydrophobic effect, although the magnitude of this contribution is small if compared with the solvent polarization.
The overall picture that emerges is that the total energy is made up of large and competing contributions. The solvent polarization is the major driving force to the approach of the like charges. It must be noted that, at the equilibrium distance, this term does not reach an energetic minimum (Pep–Sol, Fig. 4 ▶). This indicates that, although it is the most important contribution, the equilibrium distance is not completely determined by the orientation of the solvent itself. The water bridging of like-charged groups as described by Brooks and Karplus (1987, 1989), for example, should not be considered as the determinant of the ion pairing process, but rather as an arrangement that results from the plasticity of the hydrogen bond network. For the aforementioned reasons, the conformational entropy and the hydrophobic effect can ultimately determinate the attraction or repulsion of two like-charged ions, and shape the PMF for each system in particular.
It is interesting to note that the distribution of Nζ–Nζ distances from a survey of crystal structures of proteins (Atlas of protein side chain, http://www.biochem.ucl.ac.uk/bsm/sidechains/Lys/Lys/r.html) is in excellent agreement with the distribution calculated in this work. We also want to point out the high concentration of chloride ions next to the Nζ atoms, which is more than 10 times their bulk concentration. This accumulation of charge of opposite sign to the peptide is a consequence of the more intense electrostatic field produced by the close lying of the peptide charges and can have influence in the binding and mechanism of enzymes that posses one or more groups of like-charged residues in their active site (Wada and Nakamura 1981; Brooks and Karplus 1987).
Materials and methods
Molecular dynamics
An ideal α-helix conformation (φ = −57, Ψ = −47) for the sequence Ac-AKAAAK-NMe was constructed using a molecular editor. This conformation has four intramolecular hydrogen bonds. Equilibrated boxes of solvent were stacked to form a cubic box of 3.5-nm sides. The peptide was introduced into this box and all water molecules with any atom within 0.15 nm of the peptide were removed. Because the lysine residues were regarded as charged (pH 7), two water molecules were replaced by two chloride ions to obtain an electrically neutral system. The final simulation box contains the peptide, a total of 1403 water molecules, and two chloride ions. The GROMOS-87 force field (van Gunsteren and Berendsen 1987), with modifications suggested in van Buuren et al. (1993), was used for the peptide and chloride ions. For the solvent, the SPC/E (Berendsen et al. 1987) water model was used. The LINCS algorithm was used to constrain all bond lengths in the peptide (Hess, et al. 1997). For the water molecules, we used the SETTLE algorithm to constrain the bond length as well as the bond angle (Miyamoto and Kollman 1992). The simulation was performed under Ewald boundary conditions using the PME method (Darden et al. 1993) with a real space cutoff of 0.9 nm, a grid spacing of 0.12 nm, and a cubic interpolation. A dielectric permitivity, ɛ = 1, was assumed and the van der Waals interactions were cut off at 0.9 nm. To release steric clashes, we performed 1000 steepest descent cycles. To this final conformation we applied positions restraints of 2000 kJ mole−1 Å2 to all of the atoms in the main chain of the peptide, including amide hydrogens. The simulation was carried out at constant temperature and pressure using the Berendsen thermostat and barostat (Berendsen et al. 1984). The peptide and the solvent were weakly coupled separately to the temperature bath with a reference temperature of 300 K and a relaxation constant of 0.1 psec, while the pressure was maintained constant by isotropic coupling to a reference pressure of 1 bar with a relaxation constant of 1.0 psec. Using a time step of 5 fsec to integrate the equations of motion (Feenstra et al. 1999), and updating the nonbonded list every four steps, a trajectory of 16.5-nsec long was generated. The first 500 psec were discarded for the analysis. Another simulation of 20-nsec long was made with the charged peptide in vacuum and no counterions. For this simulation, we used the conditions described earlier except that the electrostatics interactions were cut off at 3.0 nm, a distance long enough to ensure that all the atoms of the peptide can interact with each other. The simulations and part of the analysis of the trajectory were performed using the GROMACS 2.0 software package (Berendsen et al. 1995).
Conformational analysis of the lysine side chains
This analysis was performed in a similar way to the one described by O’Donohue et al. (2000). In brief, the dihedral space of every rotable bond of the lysine side chains were partitioned in three regions: t (χ > 120° and χ < ∼120), g+ (0° < χ ≤ 120°), and g−(−120° < χ ≤ 0°). Every frame in the trajectory was labeled according to this definition. For example, when all of the angles of the two chains are t, the frame is labeled ‘t,t,t,t | t,t,t,t’ because there are four rotable bonds per lateral chain. When a single or several dihedrals angles change, the conformation of the system also changes only if the new label lasts longer than a given cutoff time (here we used 5–10 psec). In this way, a "conformational trajectory" was obtained, and, from the overall duration times of each conformer, we have computed their relative populations.
Acknowledgments
We are indebted to Dr. Ezequiel Leiva for insightful discussions and critical reading of the manuscript. This work was supported by grants from CONICET, FONCYT, SECYT-UNC, and Agencia Córdoba Ciencia. M.V. is a fellow from SECYT-UNC.
The publication costs of this article were defrayed in part by payment of page charges. This article must therefore be hereby marked "advertisement" in accordance with 18 USC section 1734 solely to indicate this fact.
Article and publication are at http://www.proteinscience.org/cgi/doi/10.1110/ps.0203002.
References
- Åqvist, J., Luecke, H., Quiocho, F.A., and Warshel, A. 1991. Dipoles localized at helix termini of proteins stabilize charges. Proc. Natl. Acad. Sci. 88 2026–2030. [DOI] [PMC free article] [PubMed] [Google Scholar]
- Bader, J.S. and Chandler, D. 1992. Computer simulation study of the mean force between ferrous and ferric ions in water. J. Phys. Chem. 96 6423–6427. [Google Scholar]
- Barlow D.J. and Thornton, J. M. 1983. Ion-pairs in proteins. J. Mol. Biol. 168 867–885. [DOI] [PubMed] [Google Scholar]
- Berendsen, H.J.C., Postma, J.P.M., DiNola, A., and Haak, J.R. 1984. Molecular dynamics with coupling to an external bath. J. Chem. Phys. 81 3684–3690. [Google Scholar]
- Berendsen, H.J.C., Grigera, J.R., and Straatsma, T.P. 1987. The missing term in effective pair potentials. J. Phys. Chem. 91 6269–6271. [Google Scholar]
- Berendsen, H.J.C., van der Spoel, D., and van Drunen, R. 1995. GROMACS: A message passing parallel molecular dynamics implementation. Comput. Phys. Commun. 91 43–56. [Google Scholar]
- Boudon, S., Wipff, G., and Maigret, B. 1990. Monte Carlo simulations on the like-charged guanidinium-guanidinium ion pair in water. J. Phys. Chem. 94 6056–6061. [Google Scholar]
- Brady, P. and Sharp, K.A. 1997. Entropy in protein folding and in protein-protein interactions. Curr. Opin. Struct. Biol. 7 215–221. [DOI] [PubMed] [Google Scholar]
- Brooks, C.L. and Karplus, M. 1987. Theoretical approaches to solvation of biopolymers. Methods Enzymol. 127 369–400. [DOI] [PubMed] [Google Scholar]
- Brooks, C.L. and Karplus, M. 1989. Solvent effects on protein motions and protein effects on solvent motions. Dynamics of the active site of region of lysozyme. J. Mol. Biol. 208 159–181. [DOI] [PubMed] [Google Scholar]
- Brünger, A.T., Brooks, C.L., and Karplus, M. 1985. Active site dynamics of ribonuclease. Proc. Natl. Acad. Sci. 82 8458–8462. [DOI] [PMC free article] [PubMed] [Google Scholar]
- Buckner J.K. and Jorgensen, W.L. 1989. Energetics and hydration of the constituent ion pairs of tetramethylammonium chloride. J. Am. Chem. Soc. 111 2507–2516. [Google Scholar]
- Cho, K.H., No, K.T., and Scheraga, H.A. 2000. Ion pair interactions in aqueous solution: Self-consistent reaction field (SCRF) calculations with some explicit water molecules. J. Phys. Chem. A . 104 6505–6509. [Google Scholar]
- Cramer, T.P. and Rose, G.D. 1992. Side-chain entropy opposes α-helix formation but rationalizes experimentally determined helix-forming propensities. Proc. Natl. Acad. Sci. 89 5937–5941. [DOI] [PMC free article] [PubMed] [Google Scholar]
- Dang, L.X. and Pettitt, B.M. 1987. Chloride ion pairs in water. J. Am. Chem. Soc. 109 5531–5532. [Google Scholar]
- Dang, L.X. and Pettitt, B.M. 1990. A theoretical study of like ion pairs in solution. J. Phys. Chem. 94 4303–4308. [Google Scholar]
- Darden, T., York, D., and Pedersen, L. 1993. Particle mesh Ewald: An N-log(N) method for Ewald sums in large systems. J. Chem. Phys. 98 10089–10092. [Google Scholar]
- Dunbrack, R.L. and Cohen, F.E. 1997. Bayesian statistical analysis of protein side-chain rotamer preferences. Protein Sci. 6 1661–1681. [DOI] [PMC free article] [PubMed] [Google Scholar]
- Feenstra, K.A., Hess, B., and Berendsen, H.J.C. 1999. Improving efficiency of large time-scale molecular dynamics simulations of hydrogen-rich systems. J. Comput. Chem. 20 786–798. [DOI] [PubMed] [Google Scholar]
- Groebke, K., Renold, P., Tsang, K.Y., Allen, T.J., McClure, K.F., and Kemp, D.S. 1996. Template nucleated alanine-lysine helices are stabilized by position-dependent interactions between the lysine side-chain and the helix barrel. Proc. Natl. Acad. Sci. 93 4025–4029. [DOI] [PMC free article] [PubMed] [Google Scholar]
- Hendsch, Z.S. and Tidor, B. 1994. Do salt bridges stabilize proteins? A continuum electrostatic analysis. Protein Sci. 3 211–226. [DOI] [PMC free article] [PubMed] [Google Scholar]
- Hess, B., Bekker, H., Berendsen, H.J.C., and Fraaije, J.G.E.M. 1997. LINCS: A linear constraint solver for molecular simulations. J. Comp. Chem. 18 1463–1472. [Google Scholar]
- Honig, B. and Nicholls, A. 1995. Classical electrostatics in biology and chemistry. Science. 268 1144–1149. [DOI] [PubMed] [Google Scholar]
- Hummer, G., Soumpasis, D.M., and Neumann, M. 1993. Computer simulations do not support Cl-Cl pairing in aqueous NaCl solution. Mol. Phys. 81 1155–1163. [Google Scholar]
- Kumar, S. and Nussinov, R. 1999. Salt bridge stability in monomeric proteins. J. Mol. Biol. 293 1241–1255. [DOI] [PubMed] [Google Scholar]
- Laaksonen, L. 1992. A graphics program for the analysis and display of molecular dynamics trajectories. J. Mol. Graph. 10 33–38. [DOI] [PubMed] [Google Scholar]
- Levi, R.M. and Gallicchio, E. 1998. Computer simulations with explicit solvent. Recent progress in the thermodynamic decomposition of free energies and in modeling electrostatic effects. Annu. Rev. Phys. Chem. 49 531–567. [DOI] [PubMed] [Google Scholar]
- Magalhaes, A., Maigret, B., Hoflack, J., Gomes, J.N.F., and Scheraga, H.A. 1994. Contribution of unusual arginine-arginine short-range interactions to stabilization and recognition in proteins. J. Protein Chem. 13 195–215. [DOI] [PubMed] [Google Scholar]
- Marqusee, S. and Baldwin, R.L. 1987. Helix stabilization by Glu-. . .Lys+ salt bridges in short peptides of de novo design. Proc. Natl. Acad. Sci. 84 8898–8902. [DOI] [PMC free article] [PubMed] [Google Scholar]
- Marqusee, S., Robbins, V.H., and Baldwin, R.L. 1989. Unusually stable helix formation in short alanine-based peptides. Proc. Natl. Acad. Sci. 86 5286–5290. [DOI] [PMC free article] [PubMed] [Google Scholar]
- Miyamoto, S. and Kollman, P. 1992. SETTLE: An analytical version of the SHAKE and RATTLE algorithms for rigid water models. J. Comput. Chem. 13 952–962. [Google Scholar]
- Murphy, K.P. and Freire, E. 1992. Thermodynamics of structural stability and cooperative folding behavior of proteins. Adv. Protein Chem. 43 313–361. [DOI] [PubMed] [Google Scholar]
- No, K.T., Nam, K.Y., and Scheraga, H.A. 1997. Stability of like and oppositely charged organic ion pairs in aqueous wolution. J. Am. Chem. Soc. 119 12917–12922. [Google Scholar]
- O’Donohue, M.F., Miasian, E., Leach, S.J., Burgess, A.W., and Treutlein, H.R. 2000. PEPCAT—A new tool for conformational analysis of peptides. J. Comput. Chem. 21 446–461. [Google Scholar]
- Olson, C.A., Spek, E.J., Shi, Z., Vologodskii, A., and Kallenbach, N.R. 2001. Cooperative helix stabilization by complex Arg-Glu salt bridges. Proteins 44 123–132. [DOI] [PubMed] [Google Scholar]
- Perutz, M.F. 1978. Electrostatic effects in proteins. Science 201 1187–1191. [DOI] [PubMed] [Google Scholar]
- Pettitt, B.M. and Rosky, P.J. 1986. Alkali halides in water: Ion-solvent correlations and ion-ion potentials of mean force at infinite dilution. J. Chem. Phys. 84 5836–5844 [Google Scholar]
- Sitkoff, D., Lockhart, D.J., Sharp, K.A. and Honig, B. 1994. Calculation of electrostatic effects at the amino terminus of an alpha helix. Biophys. J. 67 2251–2260. [DOI] [PMC free article] [PubMed] [Google Scholar]
- Smith, J.S. and Scholtz, J.M. 1998. Energetics of polar side-chain interactions in helical peptides: Salt effects on ion pairs and hydrogen bonds. Biochemistry 37 33–40. [DOI] [PubMed] [Google Scholar]
- Soetens, J-C., Millot, C., Chipot, C., Jansen, G., |fAngyán, J., and Maigret, B. 1997. Effect of polarizability on the potential of mean force of two cations. The guanidinium-guanidinium ion pair in water. J. Phys. Chem. B. 101 10910–10917. [Google Scholar]
- Takano, K., Tsuchimori, K., Yamagata, Y., and Yutani, K. 2000. Contribution of salt bridges near the surface of a protein to the conformational stability. Biochemistry 39 12375–12381. [DOI] [PubMed] [Google Scholar]
- van Buuren, A.R., Marrink, S.J., and Berendsen, H.J.C. 1993. A molecular dynamics study of the decane/water interface. J. Phys. Chem. 97 9206–9212. [Google Scholar]
- van Gunsteren, W.F. and Berendsen, H.J.C. 1987. Gromos-87 manual. Biomos BV Nijenborgh 4, 9747 AG Groningen, The Netherlands.
- Vila, J.A., Ripoll, D.R., Villegas, M.E., Vorobjev, Y.N., and Scheraga, H.A. 1998. Role of hydrophobicity and solvent-mediated charge-charge interactions in stabilizing α-helices. Biophys. J. 75 2637–2646. [DOI] [PMC free article] [PubMed] [Google Scholar]
- Wada, A. and Nakamura, M. 1981. Nature of the charge distribution in proteins. Nature (London) 293 757–758. [DOI] [PubMed] [Google Scholar]
- Warshel, A. and Aqvist, J. 1991. Electrostatic energy and macromolecular function. Annu. Rev. Biophys. Biophys. Chem. 20 267–298. [DOI] [PubMed] [Google Scholar]
- Weng, Z., Delisi, C., and Vajda, S. 1997. Empirical free energy calculation: Comparison to calorimetric data. Protein Sci. 6 1976–1984. [DOI] [PMC free article] [PubMed] [Google Scholar]