

Abstract
The local and global dynamics of the Sulfolobus solfataricus β-glycosidase were studied by electron spin resonance and time-resolved fluorescence techniques. For electron paramagnetic resonance (EPR) investigations, the protein was covalently modified by the maleimido nitroxide spin label, which is specific for cysteine -SH groups, at position 344 and at position 101, where Ser-101 was changed into a cysteine by site-directed mutagenesis. The greater reactivity of exposed Cys-101 suggested the exclusive modification of this amino acid compared with Cys-344. The labeled proteins underwent temperature perturbation in the range 290–335 K and the values of the spin-label rotation correlation frequencies (νc) ranged from 6 × 10⁷ to 2 × 10⁸ sec−1 for the protein labeled at position C344 and from 5.62 × 10⁷ to 1.10 × 10⁸ sec−1 for the protein labeled at C101. These rotation correlation values are related to the local dynamic characteristics of the protein matrix. The temperature dependence of rotation correlation frequencies expressed in terms of Arrhenius coordinates (log (νc) vs. 1/T) for the protein labeled at C344 exhibited a linear dependence but with a change in the slope at 311 K. For the protein labeled at C101, no change in the slope was observed at the same temperature. General dynamic information was deduced from the analysis of the fluorescence emission decay of the tryptophanyl residues that are present in each region of the protein structure. Fluorescence data analysis highlighted a bimodal distribution of fluorescence lifetimes arising from the contribution of two emitting groups: one consisting of closely clustered tryptophans responsible for the long-lived emission component (7.1 nsec) and the other composed of tryptophans nearer to the protein surface, which can be associated to the short-lived component (2.5 nsec). The temperature dependence of lifetime distribution parameters linked to the long-lived and short-lived components, expressed in Arrhenius coordinates, showed two different points in which the change in the slope occurred (i.e., 328 K and 338 K, respectively). The Arrhenius analysis of data provided the activation energy relative to the conformational changes characterizing the local and global movements running through the protein matrix.
Keywords: Dynamics, chemical modification, mutant, electron paramagnetic resonance, frequency domain fluorometry
Proteins are aperiodic long-chain polymers whose tertiary structure is determined by a large variety of weak noncovalent interactions. Structural fluctuations occur intrinsically around an average atomic configuration that characterizes the native form. The conformational dynamics of proteins have become a matter of great interest among biologists and biochemists (Nishimoto et al. 1998). As a matter of fact, the flexibility of proteins, often referred to as mobility or dynamics, is an intrinsic property observed both in the crystals and in solution, and regulates important biological events such as allowing a substrate to enter buried cavities or triggering movements of different protein segments (Carugo and Argos 1997). In their natural environments, enzymes need to be stable to maintain their native structures, yet must also be flexible to allow conformational changes during catalysis. Such opposing requirements are particularly important for enzymes from extremophiles, which must be both stable and active under extreme conditions of salt, pH, and temperature (Hober et al. 2001). Hyperthermophilic β-glycosidase from Sulfolobus solfataricus (Sβgly) is a homotetramer of 240,000 Mr (Nucci et al. 1993) whose gene was cloned and expressed in mesophilic Escherichia coli (EcSβgly) to obtain the proper amount for our investigations (Moracci et al. 1995). The protein is barely active up to 30°C and demonstrates maximal activity near 95°C, at pH 6.5. Studies of its X-ray three-dimensional structure (Pearl et al. 1993; Aguilar et al. 1997), suggested that its "resilience", a factor emphasizing the arrangement of ion pairs, could explain the protein thermostability. This observation was not surprising as conformation fluctuations had already been found necessary for the catalytic function of some thermophilic enzymes (Zavodsky et al. 1998). Although the increased rigidity of β-glycosidase as a plausible explanation for such high thermostability had been previously advanced, only poor and indirect evidence was obtained.
This paper examines the conformational flexibility/rigidity of β-glycosidase from S. solfataricus by both spin labeling electron paramagnetic resonance (EPR) and by frequency domain fluorometry. To perform EPR investigations, the protein was labeled at Cys-344 and at Cys-101, in a mutant in which Ser-101 was changed into cysteine. Labels bound to a certain site of the protein provide local information about the occurrence in the vicinity (Likhtenshtein 1976,Likhtenshtein 1993). Nevertheless, the labeling of biological objects by nitroxide spin labels proves highly useful, as the rotational correlation time of the bound spin label undergoes changes that reflect even the slightest modifications in the protein structure.
Time-resolved fluorescence techniques are powerful tools for studying the structural and dynamic aspects of protein macromolecules (Beechem and Brand 1985; Alcalà et al. 1987). These allow the analysis of emission decay arising from a great number of emitting species (e.g β-glycosidase), which possesses 17 tryptophans for each subunit homogeneously dispersed in the primary structure, thus making it possible to investigate the dynamic behavior of the whole protein macromolecule.
Results
Protein obtainment
Table 1 shows the purification scheme of S. solfataricus β-glycosidase (mutant S101C) expressed in Escherichia coli (EcSβgly_S101C) highlighting its similarity to that of the wild-type protein previously expressed, after cloning, in E. coli (Moracci et al. 1995). Sonication on bacterial pulp and a thermoprecipitation step on the homogenate made it possible to purify β-glycosidase from the major fraction of proteins contained in E. coli. Further hydrophobic and gel filtration chromatography steps were needed to obtain the homogeneous enzyme. Purity was tested by reverse phase HPLC and SDS-PAGE. The specific activity at 75°C of EcSβgly_S101C was 175 u /mg, thus comparable to that of EcSβgly (180 u/mg) (Moracci et al. 1995).
Table 1.
Purification report of EcSβgly_S101Ca
| Purification step | Total proteins (mg) | Total activity (units) | Specific activity (units/mg) | Yield (%) | Purification (fold) |
| Heat precipitation | 45.6 | 1368 | 30 | 100.0 | 1.0 |
| Hydrophobic chromatographyb | 12.2 | 1350 | 110 | 98.6 | 3.7 |
| Gel filtrationc | 6.5 | 1150 | 175 | 84.0 | 5.8 |
a Data are based on enzyme from 10 g of bacterial pellet.
b Hydrophobic chromatography was carried out on phenyl-Sepharose 26/10 column (Amersham Pharmacia Biotech, Uppsala, Sweden).
c Gel filtration chromatography was performed on a Superdex 200 HR 26/60 column (Amersham Pharmacia Biotech, Uppsala, Sweden).
Structural considerations
According to the X-ray structure, the β-glycosidase from S. solfataricus possesses a single cysteine/monomer at position 344 (shown in yellow in Fig. 1 ▶) in the proximity of the catalytic tunnel, with the -SH groups located away from the -COOH of the essential nucleophile Glu-387 in the active site, for about 19.67 Å. The Ser-101 is located in a nonstructured and solvent-exposed region of the protein structure. After substitution with a cysteine, if a similar spatial disposition is assumed for the SH group with respect to the OH group of serine maintains, C101 (shown orange in Fig. 1 ▶) is distant 38 Å from the catalytic nucleophile Glu-387.
Fig. 1.

(A) The tetrameric structure of Sulfolobus solfataricus β-glycosidase. The protein structure is shown in a stick representation and for clarity only the backbone (in black) is drawn. The positions of labeling sites Ser-101 (mutated in cysteine in EcSβgly_S101C) and Cys-344 are represented in spacefill and colored in orange and yellow, respectively. In red and blue (in a spacefill representation) are the Trp assigned to long-lived and short-lived components of the lifetime distribution, respectively. (B) Representation of labeling residues in the EcSβgly subunit. The picture represents a zoom of the structure of EcSβgly subunit where the transparent surface is colored to represent the amino acidic residue distances from the center of the macromolecule and the shift from red to blue indicates an increased distance from the center. The residues Ser-101, Cys-344, and Glu-387 are drawn in spacefill and colored by atom type. The pictures were done with the program SwissPDB Viewer ver. 3.7b2 (Guex and Peitsch 1997; http://www.expasy.ch/spdbv/) in the POV format and rendered by the program POV-Ray™ Version 3.1g (Persistence of Vision™Ray Tracer; copyright 1991,1999 by the POV-Ray Team™; http://www.povray.org).
Functional and chemical characterization of protein samples
The Arrhenius plot of EcSβgly catalytic activity (Fig. 2 ▶) does not indicate a discontinuity point in the slope in the temperature range 298–358 K. The same occurs for mutant protein (data not shown). These results do not suggest any conformational change induced by temperature in the investigated range. The insert of Figure 2 ▶ shows the temperature dependence of the catalytic activity of EcSβgly_S101C and EcSβgly in the range 20°–90°C. It would appear that the curves can be superimposed and reversed in the explored range of temperature, thus demonstrating that the substitution does not alter the function of the enzyme.
Fig. 2.

Arrhenius plot of log kcat against the inverse of temperature in K of β-glycosidase (open circles). (Insert) Thermophilic plots for EcSβgly (open circles) and EcSβgly_S101C (closed circles) expressed as initial rate of reaction.
The quantitative analysis of free -SH groups, which are available for modification, in EcSβgly and EcSβgly_S101C was performed by Ellman reaction, and is described in the Materials and Methods section.
The kinetics of the reaction with the 5,5′-dithio-bis (2-nitrobenzoic acid) (DTNB) reagent is shown in Figure 3 ▶. The reaction time observed in EcSβgly (4 cysteines saturated after 3 h) suggests that the reactivity of these cysteines is very low in agreement with their solvent exposition of 11.9%. However, EcSβgly_S101C, which possesses two free cysteines/subunit, reacted with four molecules of DTNB/tetramer with a biphasic kinetics, involving a first step occurring after 5 min and a slower step occurring after ∼3 h. The large difference in the reaction rate of Cys-344 and Cys-101 made it possible to selectively label EcSβgly_S101C at position 101. The specific activity of EcSβgly and EcSβgly_S101C labeled by the spin label is not modified after labeling.
Fig. 3.

Time course of DTNB reaction with the free SH groups of EcSβgly (a) and EcSβgly_S101C (b) cysteines. The absorbance increase is measured at 412 nm. Other experimental conditions are described in Materials and Methods.
Far and near UV-CD
The far and near UV-CD spectra of EcSβgly and EcSβgly_S101C appear to be very similar. This result indicates that the protein’s secondary and tertiary structures undergo no modification after substitution in the temperature range investigated. Furthermore, the addition of Maleimido nitroxide radical (MAR•) spin label to -SH groups 344 of EcSβgly (EcSβgly-MAR•) and 101 of EcSβgly_S101C (EcSβgly_S101C-MAR•), respectively, produced no differences in both far and near CD spectra in comparison with nonlabeled proteins (data not shown). Figure 4 ▶ shows the temperature dependence of far and near UV CD spectra of EcSβgly in the interval ranging from 20° to 80°C. Only small changes are observed in the CD spectra suggesting that both secondary and tertiary structures of the enzyme are poorly affected by the temperature increase.
Fig. 4.

(A) Far and (B) near UV CD spectra of EcSβgly at the temperatures of 20°C (continuous line), 40°C (dashed line), 60°C (dotted line), and 80°C (dash–dotted line). Experimental conditions are described in Materials and Methods.
Spin-labeling study of the protein local dynamics
EPR first derivative spectra of EcSβgly-MAR• and EcSβgly_S101C-MAR• are shown in Figure 5A ▶ (spectra a and b, respectively) at temperature of 298 K. Both the spectra consist of two sets of hyperfine lines: three strong components indicated by B−1, B0, and B+1, and less intensive and broad peaks indicated by A1 and A2. The EPR spectra were performed in a temperature range of 20°–70°C. The spectra repeated on protein samples after cooling to room temperature were superimposable, thus indicating the reversibility of the changes observed in the EPR spectra. The parallel hyperfine splitting (A′zz) between the low (A1) and high field (A2) components is the relevant experimental parameter for the dynamic characterization of the spin label bound to the protein macromolecule, which is measured by the rotational correlation time τc. The rotation correlation times τc are calculated from the equation
Fig. 5.

(A) EPR first derivative spectra at ν = 9.4GHz and T = 295K of EcSβgly-MAR• (a) and EcSβgly_S101C-MAR• (b). (B) Arrhenius plot of log (vc) against the inverse of temperature in K of EcSβgly-MAR• (open circles) and EcSβgly_S101C-MAR• (closed circles).
 |
where, taking the model of Brownian diffusion, a = 5.4 × 10⁻¹⁰ sec, b = −1.36, A′zz is the parallel hyperfine splitting between the low (A1) and high field (A2) components of the spin-label signal bound to the protein in solution at the temperature examined and Azz is the same parameter measured in the spectra of the frozen sample (Freed 1976). The rotation frequencies of S101C-MAR• plotted against the temperature, expressed in Arrhenius coordinates, is shown in Figure 5B ▶ and compared to that of EcSβgly-MAR•. Within the temperature range under investigation, the νc = 1/τc values vary from 6 × 10⁷ to 2 × 10⁸ sec−1 for EcSβgly-MAR•, and from 5.62 × 10⁷ to 1.1 × 10⁸ sec-1 for EcSβgly_S101C-MAR•. These values are essentially lower than 5 × 10¹⁰ sec−1, which is a typical value of frequency rotation for free nitroxides in nonviscous solutions. On the other hand, they are significantly higher than the rotation frequency of the enzyme globule as a whole, which was estimated for a protein with molecular weight of 240,000 Mr as νc ≈ 5 × 10⁶ sec−1. Thus, the νc value is determined by the mobility of the nitroxide itself on the protein matrix reflecting the local protein dynamics in the vicinity of -SH groups. The Arrhenius plot for EcSβgly-MAR•, which is shown as wide circles in Figure 5B ▶, highlights a discontinuity point at 311 K in the slope, whereas the EcSβgly_S101C-MAR• shows a monotone increase in the motional regime below and above the same temperature. Consequently, it is possible to calculate the enthalpy and entropy related to the spin-label rotation inside the protein matrix activation using the different lines and slopes, on the base of the equation
 |
taking kT/h = 6 × 10¹² sec−1. The activation enthalpy and entropy of the spin-label rotation for EcSβgly-MAR• and for EcSβgly_S101-MAR• are reported in Table 2. For EcSβgly-MAR•, the values of apparent enthalpy activation are 9.88 kJ/mol at temperatures below 311 K and 6.68 kJ/mol at higher temperatures. The corresponding values for the apparent activation entropy are −5.88 e.u. and −11.12 e.u. for temperatures below and above the inflection point, respectively.
Table 2.
Apparent activation parameters and inflection temperatures range of spin label bound to EcSβgly-MAR•and to EcSβgly_S101C-MAR•compared with the model systems
| System | ΔH# app (kJ • mol−1) | ΔS# app (e.u.) |
| EcSβgly-MAR• | 20.79 ± 0.58a | −5.88 ± 0.51a |
| 14.06 ± 1.55b | −11.12 ± 1.10b | |
| EcSβgly_S101C-MAR• | 15.69 ± 0.33 | −10.09 ± 0.26 |
| Nitroxides in soft polymer systems with cross-linksc | 20.9–92.0 | 0–31 |
| Nitroxides in rigid polymer systems with many cross-linksc | 10.9–11.7 | −5–0 |
a Related to temperatures below the inflection point at 311 K.
b Related to temperatures above the inflection point at 311 K.
c from Likhtenshtein 1993.
In the case of EcSβgly_S101-MAR•, the linear motional regime is characterized by the apparent activation enthalpy value of 7.45 kJ/mol and −10.09 e.u. for the entropy. At temperatures above 322 K, an abrupt decrease in the rotation correlation frequency is observed. The unexpected decrease in the values of rotation correlation frequencies at higher temperatures is compatible with a reduced room volume for spin-label rotation or with an increased viscosity of the local medium.
Frequency domain fluorometry studies of tryptophanylic residues
The tryptophanyl emission decay properties of EcSβgly at neutral pH were investigated by frequency domain fluorometry. The phase shifts and the demodulation factors were collected upon excitation at 295 nm to exclude tyrosine contribution to the whole emission and were analyzed as described in Materials and Methods. The upper part of Figure 6 ▶ shows the fluorescence lifetime distribution at 25°C. The tryptophanyl lifetime distribution observed for the β-glycosidase from S. solfataricus but expressed in E. coli appears to be similar to that reported for the β-glycosidase wild type (Bismuto et al. 1997). The temperature dependence of lifetime distribution parameters also appears to be superimposable. Table 3 shows the distribution center values of long-lived and short-lived components of EcSβgly at increasing temperatures. An Arrhenius plot of these values is shown in the lower part of Figure 6 ▶. Two different slopes are observed for both the lifetime distribution components. The different linear dependences of the center values are analyzed on the basis of the equation:
Fig. 6.
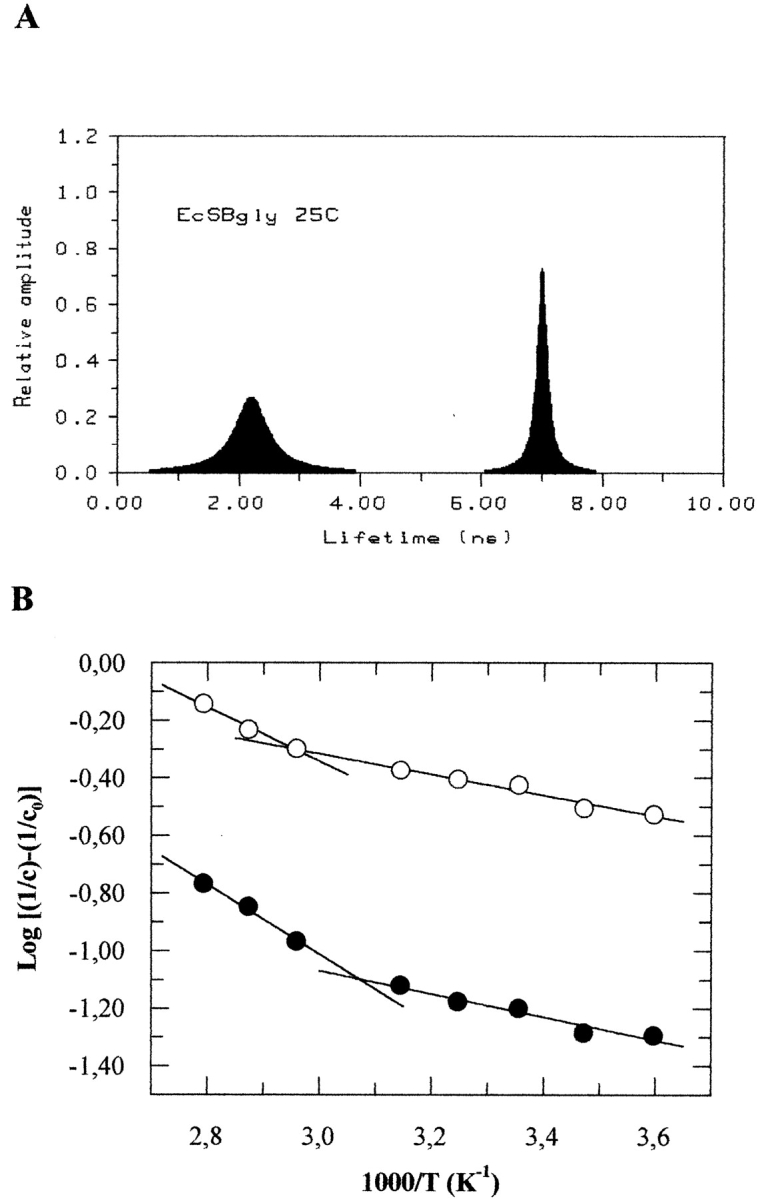
(A) Tryptophanyl lifetime distribution pattern of EcSβgly at temperature of 298K. (B) Arrhenius plots of the bimodal lifetime distribution parameters of EcSβgly at pH 7.0. Long-lived distribution component (closed circles), short-lived distribution component (open circles). The experimental conditions are described in Materials and Methods.
Table 3.
Temperature dependence of the bimodal lifetime distribution parameters of intrinsic fluorescence decay of EcSβgly
| Short-lived component | Long-lived component | |||||
| Temperature (°C) | Fraction intensity | Lifetime centers (nsec) | Width (nsec) | Fraction intensity | Lifetime centers (nsec) | Width (nsec) |
| 5.0 | 0.295 | 2.71 | 0.095 | 0.705 | 8.18 | 0.802 |
| 15.0 | 0.320 | 2.60 | 0.105 | 0.680 | 8.11 | 0.721 |
| 25.0 | 0.310 | 2.24 | 0.120 | 0.690 | 7.44 | 0.619 |
| 35.0 | 0.338 | 2.15 | 0.121 | 0.662 | 7.24 | 0.532 |
| 45.0 | 0.397 | 2.02 | 0.195 | 0.603 | 6.79 | 0.501 |
| 65.0 | 0.455 | 1.74 | 0.211 | 0.545 | 5.57 | 0.496 |
| 75.0 | 0.460 | 1.52 | 0.220 | 0.540 | 4.68 | 0.505 |
| 85.0 | 0.499 | 1.26 | 0.222 | 0.501 | 4.12 | 0.510 |
 |
where c is the lifetime of distribution center component, c0 is a temperature-independent factor, assumed to be 14 nsec (Bismuto et al. 2000), A is the Arrhenius pre-exponential factor, and Ea is the activation energy. Table 4 reports the activation energies of the different slopes of the centers.
Table 4.
Apparent activation energy for the short- and long-lived components
| Apparent activation energy (kJ/mol) | ||
| Short-lived component | 6.93 ± 0.85a | 18.03 ± 1.97a |
| Long-lived component | 7.69 ± 1.06b | 23.22 ± 2.14b |
a Fits relative to temperatures below and above the inflection point at 328 K.
b Fit relative to temperatures below and above the inflection point at 336 K.
Discussion
Discontinuity points in the slope of lines in Arrhenius plots, when plotting functional data, are believed to reflect conformational changes that directly affect the catalytic events occurring at the protein active center. In the case of EcSβgly, a monotonic linear increase in the Arrehenius plot of the catalytic activity on temperature is observed (Fig. 2 ▶). Moreover, temperature increase does not cause significant structural rearrangements in the secondary and tertiary organization of the protein as observed by circular dichroism measurements either in the far or near UV regions. However, the inability to observe discontinuity points in the temperature dependence of enzymatic activity does not correspond to the absence of changes in the conformational dynamics of the protein structure. A protein solution undergoes constant random thermal motions within a stable equilibrium structure. These motions involve displacements of individual atoms, bonds, functional groups, side chains, local regions of the backbone, secondary structure elements, and entire folded domains. However, the links between the dynamics and catalysis remain unclear. In fact, in a given protein macromolecule, only a subset of motions is important for biological function. The challenge is to identify functionally relevant motions. Effective and detailed approaches to investigate local and global motions that run across the protein structure are obtained by means of modern EPR labeling and time-resolved fluorescence techniques (Likhtenshtein 1976,Likhtenshtein 1993; Alcalà et al. 1987). The EPR measurements of rotation correlation times of EcSβgly-MAR• and EcSβgly_S101-MAR•, mainly concern the local dynamics at 344 and 101 residues. A different behavior is observed in the Arrhenius plot of frequency correlation of EPR spin-label rotation that appears to be monotonic linearly dependent on temperature for EcSβgly_S101-MAR•, in contrast with the biphasic linear dependence observed for EcSβgly-MAR•, which shows a discontinuity in the slope at 311 K, indicating different local dynamics of the protein at different sites. The change in the slope above 311 K suggests a transition to a different local spatial arrangement of thermophilic β-glycosidase and, because of this, a decrease in flexibility occurs. This conclusion is corroborated by the activation parameters ΔH≠ and ΔS≠ obtained from the two different regions of the Arrhenius plot. In fact, the observed values of apparent enthalpy and entropy activation of rotation were found to be smaller at T > Tin than those for the low temperature region (Table 2). This means that the protein structure becomes more rigid as suggested by the values of model compounds (Table 2) and in agreement with the known and accepted models for the thermostable proteins that are intrinsically rigid polymers as a necessary condition for their thermostability (Fontana 1988). However, the Arrhenius plot relative to residue 101 shows intermediate values (7.45 kJ/mol for the apparent activation enthalpy and −10.09 u.e for entropy, respectively) suggesting that the local flexibility/rigidity as seen at position 101 is comparable to the conformational mobility observed at position 344 at temperatures higher than 311 K.
The global structural dynamics of EcSβgly can be studied by examining the tryptophanyl emission decay by frequency domain fluorometry (Beechem and Brand 1985; Alcalà et al. 1987; Nishimoto et al. 1998). The sensitivity of tryptophanyl fluorescence lifetime to a wide variety of microenvironmental conditions has been well documented. Solvent molecules and intramolecular groups likely to interact with tryptophan residues can quench the fluorescence and nonradiative energy transfer processes also can occur (Chen and Barkley 1998). The dynamic quenching processes that decrease the fluorescence lifetime are determined by structural fluctuations in the protein matrix. The emission decay of EcSβgly is heterogeneous and can be interpreted in terms of a bimodal distribution of fluorescence lifetimes (Fig. 4A ▶). The center and width values of the components of the bimodal lifetime distribution of EcSβgly are similar to those obtained for the Sβgly, which were associated with two different classes of tryptophanyl residues: The long-lived distribution component, whose center was at 7.4 nsec, includes tryptophanyl residues located in buried regions with high rigidity (blue in Fig. 1 ▶); the short distribution component, whose center was at 2.6 nsec, corresponds to tryptophans embedded in more flexible and exposed regions (red in Fig. 1 ▶) (Bismuto et al. 1997, 1999; D’Auria et al. 1997). Molecular dynamic simulation was used to calculate the tryptophanyl lifetime of each of the 17 residues per subunit of EcSβgly and the comparison with the values observed confirms the above reported structural and dynamical conclusions (Bismuto et al. 2000). Table 3 shows the centers of the short- and long-lived distribution component of EcSβgly emission decay as a function of temperature, which also appear to be close to those reported for the Sβgly (Bismuto et al. 1997). The Arrhenius plot of the center values reported in Table 3 are shown in Figure 6B ▶. Both the dependences of long-lived and short-lived components of the lifetime distribution show a discontinuity in the slope at 328 K and 336 K, respectively. Table 4 shows the Arrhenius parameters obtained by linear best-fits regarding data reported in Figure 6B ▶. At temperatures below 328 K, the apparent activation energy of the dynamic processes induced by temperature increase and causing fluorescence quenching is quite similar for both the long-lived and short-lived components of the fluorescence lifetime distribution (i.e., 7.69 and 6.93 kJ/mol, respectively). The same occurs for the activation energies above 336 K, where the values are 23.22 and 18.03 kJ/mol for long-lived and short-lived components, respectively. This observation proves that the changes in the slope indicate conformational changes involving the entire protein matrix, which increases its susceptibility to the thermal insult as a consequence of larger flexibility. Therefore, the conformational changes observed in the temperature range 328–336 K for long- and short-lived distribution components, respectively, produce a decrease in the average of the energetic barriers relative to the collisional processes causing fluorescence quenching.
Conclusion
According to our experimental data, the Arrhenius plots of log kcat against the inverse of temperature do not provide any useful information toward better understanding of possible structural transitions occurring during the catalytic event in thermophilic proteins. With regard to the local dynamics, in accordance with EPR data, the more deeply buried (side-chain solvent exposure of 11.9%) Cys-344 gives local information on a sharp transition versus a less flexible local structure at a temperature of 311 K. In the vicinity of the more solvent-exposed Cys-101 (43.5%), flexibility appears to increase until 322 K. Above this temperature, an abrupt increase in the correlation time of the probe occurs, which is probably related to a local change in physicochemical parameters, such as free room volume and viscosity, which influence the spin-label rotation. In the temperature range 328–336 K, the global protein dynamics are strongly affected by the increase observed in the collisional quenching processes, both in buried as well as in more exposed classes of tryptophans, thus proving greater flexibility in the protein globule. Using powerful techniques such as dynamic fluorescence and site-specific labeling EPR, this study on a hyperthermophilic protein has made it possible to collect information on the global and local dynamics in view of a full understanding of topology and motion hierarchy in proteins. A future goal should be the identification of functionally relevant protein motions by detecting cross-correlation among fluctuating segments of the protein macromolecule using nondestructive probes for advanced spectroscopic techniques such as EPR and time-resolved fluorescence.
Materials and methods
Materials
All chemicals used were of analytical grade and obtained from commercial sources. MAR•-nitroxide and the enzyme substrates o-nitro-phenyl-β-d-galactopyranoside (ONPG) and p-nitro-phenyl-β-d-glucopyranoside (PNPG) were from Sigma (St. Louis, MO). Centricon centrifugal filter devices with YM-30 membranes were from the Millipore Corporation (Bedford, MA, USA). The G-25 gel filtration column 1.6-cm by 8-cm was from Pharmacia (Uppsala, Sweden). β-Glycosidase (EcSβgly) and its mutant (EcSβgly_S101C) were expressed in E. coli and purified as described in (Moracci et al. 1995), except for the presence in buffers used for mutant of a reducing agent such as dithioerythrytol (DTT).
Site-directed mutagenesis
The EcSβgly_S101C was prepared by site-directed mutagenesis following the Mikaelian and Sergeant method (Mikaelian and Sergeant 1992) based on the polymerase chain reaction (PCR). The mutagenic oligonucleotide (Amersham Pharmacia) was as follows (mismatches are underlined): 5′-AAACTTTGATGAATGCAAA CAAGATGTGA-3′.
The amplified product was cloned in a plasmid vector pGEM3 (Promega) so that the gene was under the control of a T7 RNA polymerase promoter. The mutation was identified by direct sequencing and the correctness of the mutagenized gene was confirmed by sequencing the complete gene.
Protein concentration, enzymatic assay, and kinetic constants
Protein concentration was determined by Bradford (1976) and by Lowry et al. (1951) methods, using bovine serum albumin as standard. For EPR, circular dichroism, and fluorescence analyses, the protein concentration was determined at 280 nm using an ɛM of 9.5 × 105 cm−1 M−1. The activity of protein samples that were free and modified by the spin label was tested according to the standard procedure described in Nucci et al. (1993). The kinetic constants of free and MAR•-labeled protein samples were measured under standard assay conditions using the substrate (ONPG or PNPG) in the concentration range of 0.2–24 mM, from 30°–70°C. All the protein kinetics were repeated several times and all data were analyzed by the program Grafit 3.0 (Erithacus Software- R.J. Leatherbarrow).
SH group determination in EcSβgly and S101C by Ellman analysis
The number of the free thiols in the EcSβgly and EcSβgly_S101C was performed by DTNB reaction according to Ellman assay (1959). Aliquots of EcSβgly_S101C had been initially subjected to G25 gel filtration chromatography and dyalised against 0.1 M sodium phosphate buffer at pH 7.5 to remove the DTT from the sample. Two and 4 nM of EcSβgly or EcSβgly_S101C samples were transferred into a quartz cuvette (1-cm length path) containing 0.1 M sodium phosphate buffer at pH 7.5 and 0.25 mM DTNB for a final volume of 1 mL. The reaction was followed spectrophotometrically at 25°C by a Varian spectrophotometer Cary 1. After 4 h of incubation, the increase in absorbance at 412 nm due to the release of the 2-nitro-5-thiobenzene anion (ɛ412 = 13.6 × 10³ M−1 cm−1) was detected against a reference cuvette containing all reactants except the proteins.
Enzyme thermal activities
EcSβgly and EcSβgly_S101C dependence on temperature of enzymatic activity was determined by assaying enzyme aliquots of 4.1 pmoles in a 1-mL sample mixture containing 50 mM sodium phosphate buffer at pH 6.5 and 2.8 mM ONPG as substrate in the temperature range of 25°–90°C. To determine the Arrhenius plot for EcSβgly and EcSβgly_S101C, the data of enzymatic activity were acquired in the above condition every 2.5°C ± 0.1°C.
Far and near UV-CD spectroscopy
Circular dichroism measurements were performed on samples of EcSβgly and EcSβgly_S101C, which were both labeled and not labeled by MAR•, at protein concentrations of 0.41 μM (far-UV) and 1.67 μM (near-UV) in 50 mM sodium phosphate at pH 7.0. A model J-710 spectropolarimeter (Jasco, Tokyo, Japan), which was equipped with a Neslab RTE-110 temperature controller (Neslab Instruments, Portsmouth, NH) and calibrated with a standard solution of (+)-10-camphorsulfonic acid. The cuvettes of 0.1- and 1.0-cm path length (Hellma, Jamaica, NY) were used in the far (190–240 nm) and near UV (250–310 nm) region, respectively. Photomultiplier absorbance did not exceed 600 V in the spectral regions measured. Each spectrum was signal-averaged at least five times, smoothed with Spectropolarimeter System Software Ver. 1.00 (Jasco), and baseline-corrected by subtracting the buffer spectrum. All measurements were performed at the temperatures indicated under a nitrogen flow (3 L/h).
Preparation of samples for EPR measurements
A mixture of 400 μM MAR• and 16.3 μM EcSβgly in a 0.1 M phosphate buffer at pH 6.5 was incubated in a thermostatic bath at 35°C for 96 h until the saturation of the protein by MAR•, monitored by the EPR signal, was achieved. The excess of free MAR• was removed from the solution by gel filtration chromatography (G25 Pharmacia). The sample was concentrated on Centricon 30 (Amicon) at 3,000g and the final concentration of EcSβgly was estimated to be 16.6 μM by UV (Varian spectrophotometer Cary 1) at 280 nm (ɛ = 9.5 × 105 cm−1 M−1).
To prepare samples of EcSβgly_S101C for MAR• labeling, the DTT was removed from aliquots of 4.1 μM of EcSβgly_S101C by gel filtration chromatography on G25 Pharmacia (Amersham Pharmacia Biotech) and the sample was concentrated by Centricon 30 at 3,000g. A mixture of 400 μM MAR• and 15.8 μM of S101C in 0.1 M sodium phosphate buffer at pH 6.5 was incubated in a thermostatic bath at 35°C for 24 h until the saturation of mutated cysteines by MAR• was achieved. The modification process was monitored by electron spin resonance. The excess of free MAR• was removed from the solution by gel filtration chromatography (G25 Pharmacia) and the sample concentrated on Centricon 30 at the final concentration of 17 μM.
The number of MAR• label per one molecule of EcSβgly-MAR• and EcSβgly_S101C-MAR• (e.g., the degree of modification) was calculated as a ratio of moles of bound label on moles of protein by double integration of the EPR spectrum of purified labeled proteins.
EPR spectroscopy
EPR spectra were measured by a Bruker EMX-220 X-band (ν = 9.4 GHz) digital EPR spectrometer equipped with Bruker ET 4210 variable temperature accessories. For all measurements, the liquid samples were placed in the narrow (1-mm innerdiameter) end of glass Pasteur pipettes, with no EPR signal within the region of interest (g = 2.00). The sealed capillary tube was filled to >20 mm in length (∼100 μL) and centered in the rectangular TE102 cavity. To prevent samples overheating during the measurement of temperature dependencies, the stabilization of the temperature at each point was performed with the sample obtained from the cavity. The sample was then returned and kept at least 10 min for temperature equilibrium purposes before the recording was taken. The deviation from the setting point during the measurements did not exceed 0.1 K.
All spectra were recorded at a nonsaturating microwave power of 20 mW, 100 kHz magnetic field modulation of 2 G amplitude, and receiver gains in a range from 2 × 10⁴ to 1 × 10⁵. Digital field resolution was 1,024 points per spectrum, allowing all hyperfine splittings to be measured directly with an accuracy >0.1 G. Spectra processing (spectral algebra, digital filtering, differentiation, numerical integration, and so on) and measurements of the splitting constants were performed using Bruker WIN-EPR software.
Fluorescence -emission decay measurements
Frequency-domain techniques were used to measure the fluorescence decay of the EcSβgly sample in the range 5–200 Mhz using a multifrequency phase shift and modulation cross-correlation fluorometer GREG 200 (ISS). The emission was observed using an optical filter combination of UV 34 and U340 (Oriel Corp.) and the reference was a glycogen solution used as a scatterer. The temperature was monitored continuously during measurements by attaching a thermocouple to the sample cuvette. Readings of the thermocouple were monitored by an Omega Digicator (=mega Engineering) with an accuracy of ±0.1°C. The absorbance of the protein solution did not exceed 0.1 at the excitation wavelength. The lifetime analysis was performed by Global Unlimited (University of Illinois at Urbana) according to Beechem (1992).
Structural analysis
The structural calculation of atomic distances and secondary structure assignment on the β-glycosidase three-dimensional structure (PDB code 1GOW) were performed by the software Swiss-PdbViewer ver. 3.7 (Guex and Peitsch 1997), whereas the solvent-exposed surface was calculated by the software Molmol ver 2k.1 (Koradi et al. 1996) using a standard radius of 1.4 Å.
Acknowledgments
We express gratitude to Dr. Marco Moracci for supplying the plasmid containing the mutagenized β-glycosidase gene. This project was supported by the Scientific Agreement between the National Research Council (Italy) and the Ministry of Science and Arts (Israel), and by Italian Ministry of Health (SVE.4-ICSA/RF00–448, 2000).
The publication costs of this article were defrayed in part by payment of page charges. This article must therefore be hereby marked "advertisement" in accordance with 18 USC section 1734 solely to indicate this fact.
Abbreviations
Sβgly, Sulfolobus solfataricus β-glycosidase
EcSβgly, Sulfolobus solfataricus β-glycosidase expressed in E. coli
MAR•, Maleimido nitroxide radical
EcSβgly_S101C, mutant protein at position 101 in which serine was substituted with cysteine
EcSβgly-MAR•, EcSβgly labeled by MAR•
EcSβgly_S101C-MAR•, mutant protein labeled by MAR•
EPR, electron paramagnetic resonance
ONPG, o-nitro-phenyl-β-D-galactopyranoside
PNPG, p-nitro-phenyl-β-D-glucopyranoside
DTT, dithioerythrytol
DTNB, 5,5′-dithio-bis (2-nitrobenzoic acid)
Article and publication are at http://www.proteinscience.org/cgi/doi/10.1110/ps.0212802.
References
- Aguilar, C.F., Sanderson, I., Moracci, M., Ciaramella, M., Nucci, R., Rossi, M., and Pearl, L.H. 1997. Crystal structure of the β-glycosidase from the hyperthermophilic archaeon Sulfolobus solfataricus. Resilience as a key factor in thermostability. J. Mol. Biol. 271 789–802. [DOI] [PubMed] [Google Scholar]
- Alcalà, R., Gratton, E., and Prendergast, F. 1987. Fluorescence life-time distribution in proteins. Biophys. J. 51 597–604. [DOI] [PMC free article] [PubMed] [Google Scholar]
- Beechem, J. 1992. Global analysis of biochemical and biophysical data. Methods Enzymol. 210 37–54. [DOI] [PubMed] [Google Scholar]
- Beechem, J. and Brand, L. 1985. Time resolved fluorescence decay in proteins. Annu. Rev. Biochem. 54 43–71. [DOI] [PubMed] [Google Scholar]
- Bismuto, E., Irace, G., D’Auria, S., Rossi, M., and Nucci, R. 1997. Multitryptophan-fluorescence decay of β-glycosidase from the extremely thermophilic archaeon Sulfolobus solfataricus. Eur. J. Biochem. 244 53–58. [DOI] [PubMed] [Google Scholar]
- Bismuto, E., Nucci, R., Rossi, M., and Irace, G. 1999. Structural and dynamic aspects of β-glycosidase from mesophilic and thermophilic bacteria by multitryptophanyl emission decay studies. Proteins 2 35–45. [PubMed] [Google Scholar]
- Bismuto, E., Martelli, P.L., Casadio, R., and Irace, G. 2000. Tryptophanyl fluorescence lifetime distribution of hyperthermophilic β-glycosidase from molecular dynamics simulation: A comparison with the experimental data. Prot. Sci. 9 1730–1742. [DOI] [PMC free article] [PubMed] [Google Scholar]
- Bradford, M.M. 1976. A rapid and sensitive method for the quantitation of microgram quantities of protein utilizing the principle of protein-dye binding. Anal. Biochem. 72 248–254. [DOI] [PubMed] [Google Scholar]
- Carugo, O. and Argos, P. 1997. TITOLO. Protein Engineering 10 777–787. [DOI] [PubMed] [Google Scholar]
- Chen, Y. and Barkley, M. 1998. Toward understanding tryptophan fluorescence in proteins. Biochemistry 37 9976–9982. [DOI] [PubMed] [Google Scholar]
- D’Auria, S., Rossi, M., Nucci, R., Irace, G., and Bismuto, E. 1997. Perturbation of conformational dynamics, enzymatic activity, and thermostability of β-glycosidase from Archaeon Sulfolobus solfataricus by pH and sodium dodecyl sulphate detergent. Proteins 27 71–79. [PubMed] [Google Scholar]
- Ellman, G.L. 1959. Tissue sulfydryl groups. Arch. Biochem. Biophys. 82 70–77. [DOI] [PubMed] [Google Scholar]
- Freed, J.H. 1976. Theory of slow tumbling ESR spectra for nitroxides. In: Spin Labelling. Theory and Applications (ed. L.J. Berliner), pp. 64–155. Academic Press, New York, NY.
- Fontana, A. 1988. Structure and stability of thermophilic enzymes. Biophys. Chem. 29 181–183. [DOI] [PubMed] [Google Scholar]
- Gratton, E. and Limkeman, M. 1983. A continuously variable frequency cross-correlation phase fluorometer with picosecond resolution. Biophys. J. 44 315–324. [DOI] [PMC free article] [PubMed] [Google Scholar]
- Guex, N. and Peitsch, M.C. 1997. SWISS-MODEL and the Swiss-PdbViewer: An environment for comparative protein modeling. Electrophoresis 18 2714–2723. [DOI] [PubMed] [Google Scholar]
- Hober, B., Jurgens, C., Wilmanns, M., and Sterner, R. 2001. Stability, catalytic versatility and evolution of the (βα)8 barrel fold. Curr. Opin. Biotechnol. 12 376–381. [DOI] [PubMed] [Google Scholar]
- Koradi, R., Billeter, M., and Wüthrich, K. 1996. MOLMOL: A program for display and analysis of macromolecular structures J. Mol. Graphics 14 51–55. [DOI] [PubMed] [Google Scholar]
- Likhtenshtein, G.I. 1976. Water and protein dynamics. In Spin labelling: Theory and application, Vol. 2 (ed. L.J. Berliner), pp. 45–53. Academic Press, New York, NY.
- ———. 1993. Biophysical labelling method in molecular biology. Cambridge University Press, New York, NY.
- Lowry, O.H., Rosebrough, N.J., Farr, A.L., and Randall, R.J. 1951. Protein measurement with the folin phenol reagent. J. Biol. Chem. 193 265–275. [PubMed] [Google Scholar]
- Mikaelian, I. and Sergeant, A. 1992. A general and fast method to generate multiple site directed mutations. Nucleic Acid Res. 20 376. [DOI] [PMC free article] [PubMed] [Google Scholar]
- Moracci, M., Nucci, R., Febbraio, F., Vaccaro, C., Vespa, N., La Cara, F., and Rossi, M. 1995. Expression and extensive characterization of a β-glycosidase from the extreme thermoacidophilic archaeon Sulfolobus solfataricus in Escherichia coli. Enzyme Microb. Technol. 17 992–997. [DOI] [PubMed] [Google Scholar]
- Nishimoto, E., Yamashita, S., Szabo, A.G., and Imoto, T. 1998. Internal motion of lysozime studied by time-resolved fluorescence depolarization of tryptophan residues. Biochemistry 37 5599–5607. [DOI] [PubMed] [Google Scholar]
- Nucci, R., Moracci, M., Vaccaro, C., Vespa, N., and Rossi, M. 1993. Exo-glucosidase activity and substrate specificity of the β-glycosidase from Sulfolobus solfataricus. Biotechnol. Appl. Bioch. 17 239–250. [PubMed] [Google Scholar]
- Pearl, L.H, Hemmings, A.M., Nucci, R., and Rossi, M. 1993. Crystallisation and preliminary X-ray analysis of the β-galactosidase from the extreme thermophilic archaebacterium Sulfolobus solfataricus. J. Mol. Biol. 229 561–563. [DOI] [PubMed] [Google Scholar]
- Zavodsky, P., Kardos, J., Svingor, A., and Petsko, G.A. 1998. Adjustment of conformational flexibility is a key event in the thermal adaptation of proteins. Proc. Natl. Acad. Sci. 95 7406–7411. [DOI] [PMC free article] [PubMed] [Google Scholar]