Abstract
Background
Available information on the prevalence and management of hypertension in the Canadian population dates back to 1986–1992 and probably does not reflect the current status of this major risk factor for cardiovascular disease. We sought to evaluate the current prevalence and management of hypertension among adults in the province of Ontario.
Methods
Potential respondents from randomly selected dwellings within target neighbourhoods in 16 municipalities were contacted at their homes to request participation in the study. For potential respondents who agreed to participate, blood pressure was measured with an automated device. Estimation weights were used to obtain representative estimates of population parameters. Responses were weighted to the total adult population in Ontario of 7 996 653.
Results
From 6436 eligible dwellings, contact was made with 4559 potential participants, of whom 2992 agreed to participate. Blood pressure measurements were obtained for 2551 of these respondents (age 20–79 years). Hypertension, defined as systolic blood pressure of 140 mm Hg or more, diastolic blood pressure of 90 mm Hg or more, or treatment with an antihypertensive medication, was identified in 21.3% of the population overall (23.8% of men and 19.0% of women). Prevalence increased with age, from 3.4% among participants 20–39 years of age to 51.6% among those 60–79 years of age. Hypertension was more common among black people and people of South Asian background than among white people; hypertension was also associated with higher body mass index. Among participants with hypertension, 65.7% were undergoing treatment with control of hypertension, 14.7% were undergoing treatment but the hypertension was not controlled, and 19.5% were not receiving any treatment (including 13.7% who were unaware of their hypertension). The extent of control of hypertension did not differ significantly by age, sex, ethnic background or comorbidities.
Interpretation
In Ontario, the overall prevalence of hypertension is high in the older population but appears not to have increased in recent decades. Hypertension management has improved markedly among all age groups and for both sexes.
Hypertension is a major risk factor for premature cardiovascular morbidity and mortality. Epidemiologic studies have indicated that, for people 40–69 years of age, each increase of 20 mm Hg in usual systolic blood pressure is associated with a doubling of mortality rates for stroke and ischemic heart disease.1 In 2002 the World Health Organization estimated that at least 50% of cases of cardiovascular disease and at least 75% of strokes were caused by elevated blood pressure.2 At the same time, randomized clinical trials have demonstrated that these risks can be markedly reduced by antihypertensive drug therapy. The substantial burden of suffering associated with hypertension, combined with the availability of feasible and accurate means of detection and a clear benefit from treatment have led to worldwide recommendations for hypertension screening and management.
Currently available Canadian data on the prevalence and management of hypertension are based on Canadian Heart Health Surveys that took place between 1986 and 1992. At that time, 22% of adult Canadians had hypertension, but only 16% of these had their blood pressure treated and controlled.3 These data are clearly out of date, and there has been no way of assessing the impact of changes in lifestyle, including higher rates of obesity and a sedentary lifestyle, on the prevalence of hypertension or determining whether hypertension management has improved with the widespread use of newer classes of antihypertensive drugs such as calcium antagonists and blockers of the renin–angiotensin system.
We sought to evaluate the current prevalence and management of hypertension among adults in the province of Ontario.
Methods
Study design
We surveyed a random sample of the adult population in Ontario to determine blood pressure status and the extent of management of hypertension. To achieve a reliable population-wide, cross-sectional sample, the principal investigators established a partnership with the Statistical Consultation Group of Statistics Canada. The survey had 3 major objectives: to determine the prevalence of hypertension in a representative random sample of adult residents, to determine the level of blood pressure control among those being treated for hypertension and to evaluate possible determinants (demographic characteristics, comorbidities and risk factors) of hypertension and its control.
Target population
The Ontario Survey on the Prevalence and Control of Hypertension targeted the adult population, 20–79 years of age. This community-based cross-sectional study was specifically designed to gather data from 3 visible-minority groups for which high-quality information about hypertension is dated or nonexistent: East Asian (Chinese, Japanese, Korean, Vietnamese, Thai), South Asian (Indian, Sri Lankan, Pakistani, Bangladeshi) and black (mainly of Caribbean origin). The sample represented the population of Ontario, excluding people living in institutions, Aboriginals living on reserves and, for reasons of cost and efficiency, those living in the far north. Pregnant women (more than 20 weeks' gestation) and people with physical or cognitive disabilities that would prevent them from giving accurate information were also excluded.
Sampling frame and identification of potential respondents
The sampling frame consisted of the municipalities and dissemination areas (small areas composed of one or more neighbouring blocks, with a population of 400–700) of the 2001 Canadian census included within 7 health regions of interest in Ontario. The health regions of interest were Central East; Central South; Central West; East; North; South West; and the city of Toronto. Together, these areas covered 94% of the province's population. First, the municipalities of Ottawa, Sudbury and Toronto were selected with certainty. Then, 13 additional municipalities were selected from the other regions of interest, with probability proportional to their population size, for a total of 16 municipalities.4
In each selected municipality, population counts by ethnic group were available through 2001 census data. This information was used to target dissemination areas with higher proportions of specific minority groups. A sample of dissemination areas was then selected from the entire municipality or, when stratification was possible, from within each of the ethnic strata within that municipality. A systematic random sample of dwellings was selected, and the eligible adult with the most recent birthday was selected as the respondent. One respondent was chosen per household, to minimize confounding related to hereditary and environmental variables.
The municipalities and dissemination areas were selected using publicly available census information. The dwellings were selected from lists drawn up by field enumerators, who used relevant census maps and customized forms for listing dwellings.
Data collection
Potential respondents from randomly selected dwellings within the target neighbourhoods received a letter of information, which an experienced interviewer delivered by hand (initial contact between April and November 2006). If the designated person was at home and agreed to participate, the interviewer conducted the home visit immediately. During the home visit, the interviewer recorded the respondent's answers to the survey questions and set up a clinic visit for measurement of blood pressure and certain physical characteristics. If the designated individual was not at home, the interviewer attempted to reach him or her on 3 more occasions.
The survey included questions pertaining to the person's history of blood pressure measurement, hypertension diagnosis, management and adherence to prescribed antihypertensive medications, comorbidities, personal health practices, ethnic background (self-declared) and socioeconomic status. All comorbidities were self-reported and included stroke, myocardial infarction, heart failure, kidney disease and diabetes.
The clinic visits (Figure 1) were conducted at ad hoc clinic establishments in conveniently accessible areas near where respondents resided. The clinics ran simultaneously with the data-collection phase, to allow respondents to participate within a 1- to 2-week timeframe. A registered nurse or a registered practical nurse who had received proper training in blood pressure measurement and physical measurements conducted the clinic visit.
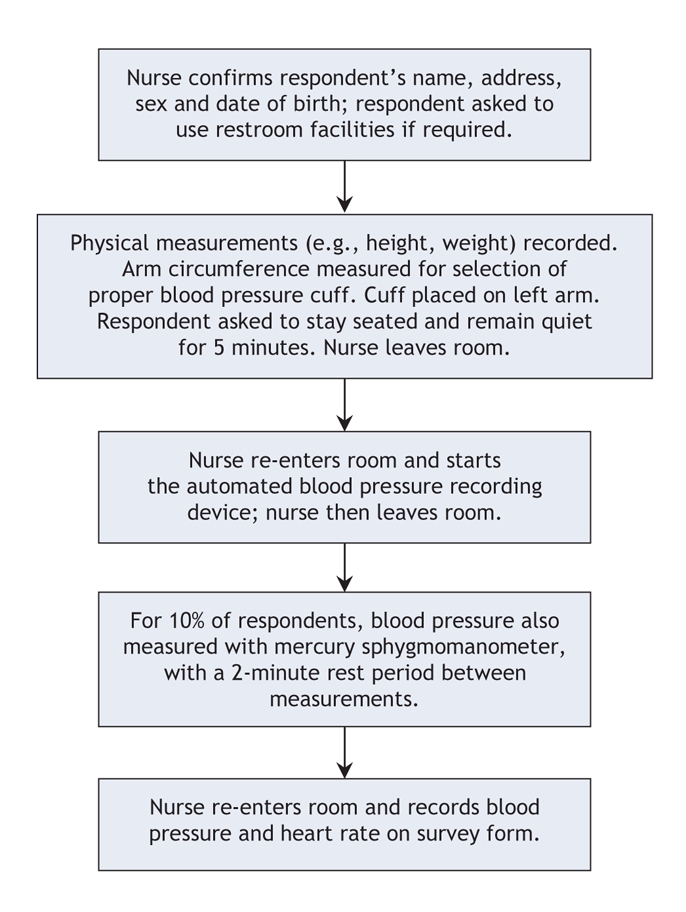
Figure 1: Clinic flow for participants in the Ontario Survey on the Prevalence and Control of Hypertension. The blood-pressure recording device was the BpTRU unit. For respondents whose blood pressure was measured by means of both the blood pressure cuff and the BpTRU unit, the first-used instrument was alternated from one patient to the next. “Nurse” means a registered nurse or a registered practice nurse.
Measurements
Five physical measurements (height, weight, waist, hip and arm circumference) were obtained for each participant.
Participants were instructed to avoid physical activity and stressors such as alcohol and caffeine before measurement of blood pressure. For all participants, blood pressure was measured with the BpTRU device (BpTRU Medical Devices Ltd., Coquitlam, British Columbia), an electronic oscillometric blood pressure monitor intended for office use. This device has been previously validated by Wright and colleagues.5 In addition, for every 10th participant, blood pressure was also measured with a mercury sphygmomanometer (W.A. Baum Co. Inc., Copiague, New York); for these participants, the order in which the 2 devices were used was alternated. When the BpTRU device was used, an initial reading was obtained with the observer (the nurse) present to verify that the device was functioning properly. Thereafter, the patient was left alone in the examination room, and 5 additional readings were taken at 1-minute intervals. The mean of these 5 readings was recorded. When blood pressure was being measured, the patient was seated comfortably with the blood pressure cuff at heart level, and readings were recorded without conversation. The appropriate cuff size was used with both measurement techniques, and all blood pressure measurements were obtained from the same arm. Values recorded by the BpTRU device were adjusted for consistency with sphygmomanometer readings, as described below, so that conclusions drawn from this study would be comparable to those of other studies. All BpTRU measurements were adjusted according to a linear regression equation derived from the subsample of participants whose blood pressure was measured with both the sphygmomanometer and the BpTRU device. All further references to blood pressure represent the adjusted BpTRU values derived from the following equations: adjusted systolic blood pressure = 11.4 + (0.93 × BpTRU systolic blood pressure) and adjusted diastolic blood pressure = 15.6 + (0.83 × BpTRU diastolic blood pressure).6
For the purposes of this study, hypertension was defined as a mean systolic blood pressure of 140 mm Hg or higher, a mean diastolic blood pressure of 90 mm Hg or higher, or current treatment with antihypertensive medication. Individuals who remembered being told by a health care professional that they had high blood pressure were deemed to be aware of their hypertension. Those who had high blood pressure at the clinic visit but did not recall being informed about their condition by a health care professional were deemed unaware. Those who had been told they had hypertension but were not receiving pharmacologic treatment and had systolic blood pressure less than 140 mm Hg and diastolic blood pressure less than 90 mm Hg at the clinic visit were not included in the hypertensive group. A participant's hypertension was considered as being “treated” if the person was taking antihypertensive drugs; hypertension was considered “treated and controlled” if systolic blood pressure was less than 140 mm Hg and diastolic blood pressure was less than 90 mm Hg. Hypertension that was being treated was considered “not controlled” if either value was elevated (systolic blood pressure ≥ 140 mm Hg or diastolic blood pressure ≥ 90 mm Hg).
Weighting, post-stratification, estimation and sampling error
All individuals aged 20–79 years for whom blood pressure was recorded were included in the analysis (n = 2551). Given that the survey did not involve a self-weighted simple random sample, estimation weights were used to obtain representative estimates of population parameters. The basic estimation weight was created so that each respondent represented the adults of his or her household, the household represented the households of the particular dissemination area, the dissemination area represented those of its municipality, and the municipality represented all municipalities in the region of interest. In the end, each responding adult carried one estimation weight representing a number of other “similar” adults in the region of interest. The sum of the estimation weights corresponded to the adult population.4 We oversampled the 3 ethnic subgroups, and thereby undersampled white people. Therefore, each of the 3 minority ethnic groups is overrepresented in the survey (black people represented 9% of respondents but only 3% of the population, South Asian people 15% and 5%, and East Asian people 10% and 3%). The actual numbers of participants in various subgroups within the survey sample (by age and sex) and their mean blood pressure appear in Appendix 1 (available at www.cmaj.ca/cgi/content/full/178/11/1441/DC2). The number of participants with hypertension (by age, sex and ethnic group) is shown in Appendix 2 (available online at www.cmaj.ca/cgi/content/full/178/11/1441/DC2).
Given the nature of the required information and given that (in contrast to the Canadian Heart Health Survey and the US National Health and Nutrition Examination Survey) the study sponsor was a nongovernmental organization, a substantial degree of nonresponse was both anticipated and experienced. Furthermore, the patterns of nonresponse differed according to age, sex and ethnic group. Thus, the estimation weights were adjusted at the lowest geographic level possible to account for nonresponse. A further step of weight adjustment was executed by post-stratification4 of the sample to the age × sex × ethnicity distribution of the 2001 census. The post-stratification weights ensured that the percentages of men and women and of younger and older people, as well as the distribution among ethnic groups estimated from the current survey corresponded to those of the 2001 census (adjusted to match the 6.6% population growth from 2001 to 2006).
Sampling errors were estimated for all the estimates computed in this study. Given the complexity of the sampling plan and of the adjustments to the estimation weights, sampling errors were estimated with the use of a replication method known as “jackknife.”4,7 Replication weights were created using the WesVar 4.2 software (Westat, Rockville, Maryland); the same software was used to create all cross tables and regression models. The χ2 analysis was used to test for differences in proportions by age, sex, ethnic group and comorbidities. Continuous measures are presented as weighted means (and standard errors); t tests were used to test for differences in blood pressure between age groups and sexes. To measure the independent association of age, sex, ethnic group and body mass index with hypertension, a multiple logistic regression was performed, with hypertension as the dependent variable. A similar analysis was performed to identify predictors of treated and controlled hypertension.
The coefficient of variation was calculated as the standard deviation of an estimate divided by its mean. Estimates with a coefficient of variation greater than 0.33 or cells with a sample size less than 10 were considered unreliable.8
Results
From the original sample of 6951 dwellings, 515 were out of scope (mainly vacant dwellings or potential participants out of desired age range). Interviewers made contact with 4559 potential participants. Of the 2992 (65.6%) who agreed to participate in the survey, 2551 had their blood pressure measured. Of the 441 who did not have their blood pressure measured, 94 had been told by a health care professional that they had hypertension; of these, 72 were receiving antihypertensive medication. Responses were weighted to the total adult population in Ontario of 7 996 653.
Systolic blood pressure increased significantly with age among both men and women, but it was significantly lower among women than among men in the groups aged 20–39 and 40–59 years (Table 1). For both men and women, diastolic blood pressure was significantly greater among those 40–59 years of age than among those 20–39 years of age; however, it declined significantly among women 60–79 years of age. Diastolic blood pressure was significantly lower among women than men in the groups aged 40–59 years and 60–79 years.
Table 1
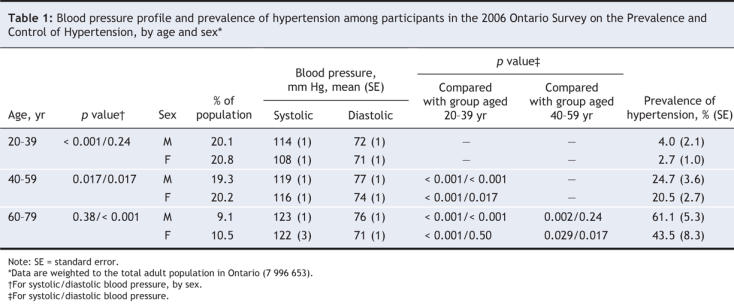
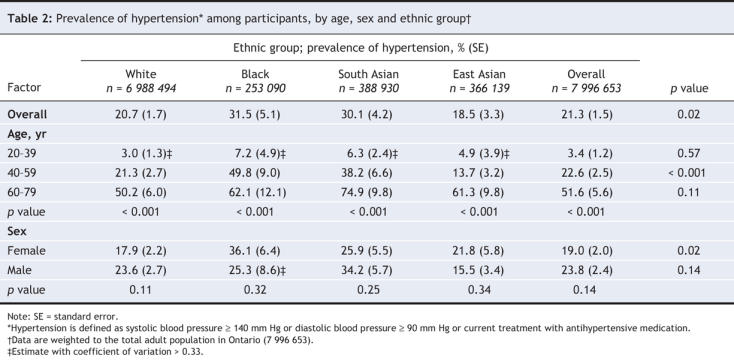
Hypertension was present in 21.3% of the adult population (Table 2). Prevalence increased with age, from 3.4% among those 20–39 years of age to 22.6% among those 40–59 years of age to 51.6% among those 60–79 years of age. Hypertension was present in 23.8% of men and 19.0 % of women; in addition, the rate tended to be higher among men than among women in all 3 age groups (p = 0.1) (Table 1). A significant difference between ethnic groups was observed among those 40–59 years of age, whereby the rate of hypertension was highest among black people (49.8%) and lowest among East Asian people (13.7%) (Table 2). By sex, the prevalence of hypertension tended to be higher among South Asian and white males than among women with the same ethnic background. Among black and East Asian people, the prevalence of hypertension by sex was reversed (i.e., higher among women than among men). These results were not corrected for age; mean age was higher among white people (45 years) than among black people (40 years, p = 0.002) and people of South Asian background (41 years, p = 0.047).
Table 2
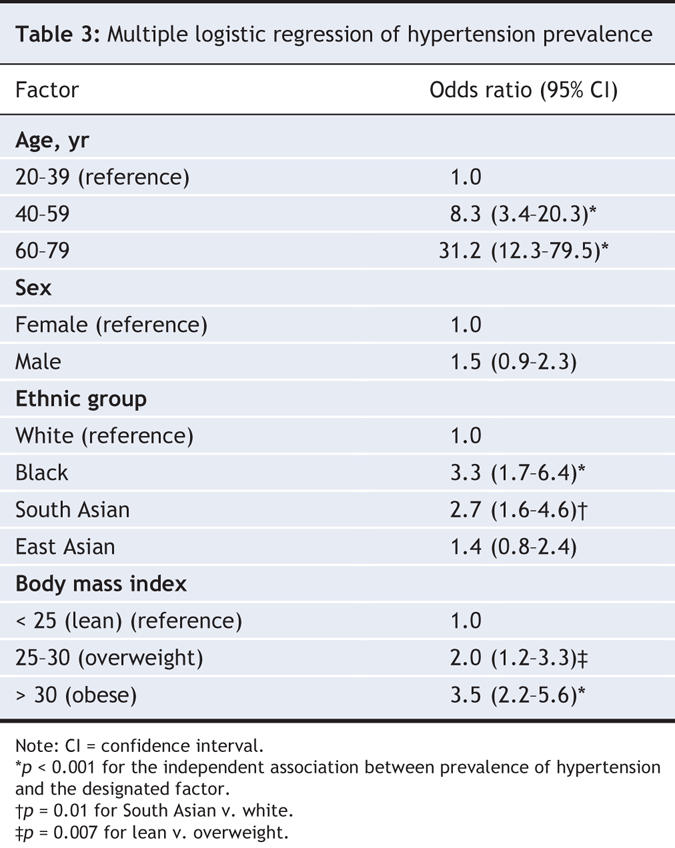
To assess the specific impact of age, sex, ethnic background and body mass index on prevalence of hypertension, we performed logistic regression analysis. This analysis showed that, compared with participants 20–39 years of age, those 60–79 years of age were 31.2 times more likely and those 40–59 years of age 8.3 times more likely to have hypertension (Table 3). Black people were 3.3 times more likely and South Asians 2.7 times more likely than white people to have hypertension.
Table 3
Participants with hypertension who were 40–79 years of age had significantly higher rates of myocardial infarction, heart failure, stroke, kidney disease and diabetes mellitus than those who did not have hypertension (Table 4). Conversely, the prevalence of hypertension was significantly higher among those with any comorbidity or with diabetes, obesity or high cholesterol (as indicated by use of cholesterol-lowering medication) than among those without (Table 5).
Table 4
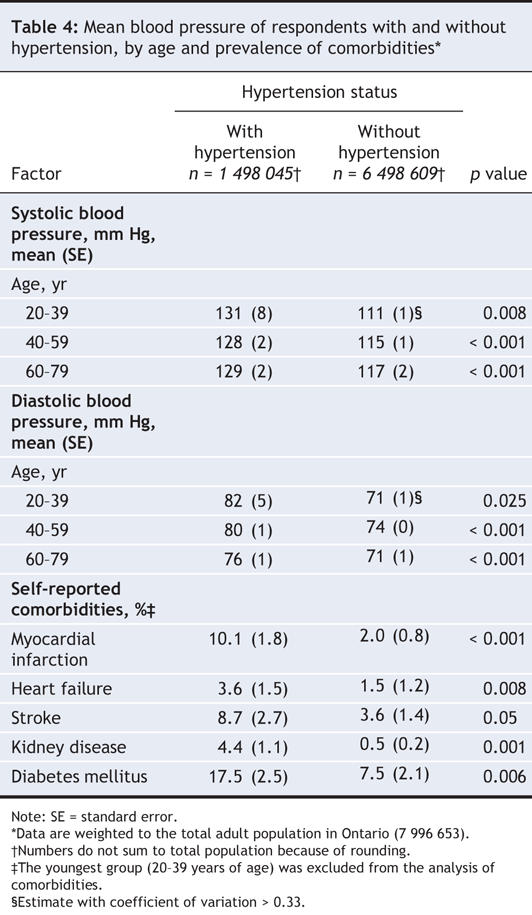
Table 5
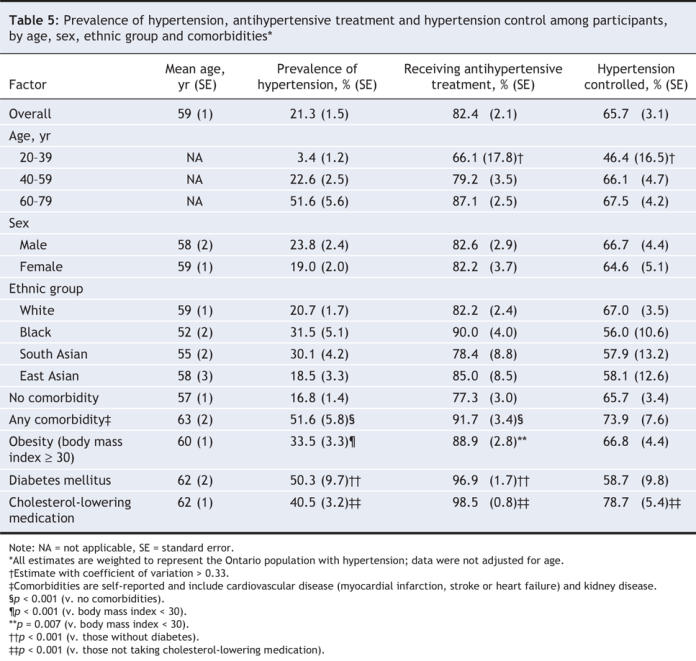
Among participants with hypertension, most (82.4%) were receiving antihypertensive drug therapy, with no significant differences by age, sex or ethnic background (Table 5). Treatment rates tended to increase with age (p = 0.09). In addition, participants with hypertension who had one or more comorbidities or risk factors were significantly more likely to be taking antihypertensive medication than those without such comorbidities or risk factors (91.7% v. 77.3%).
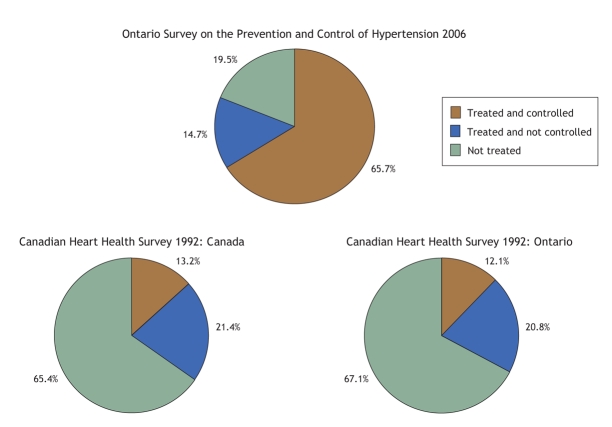
Overall, 65.7% of the participants with hypertension were receiving treatment and their hypertension was being controlled (Figure 2). There were no significant differences by age, sex or ethnic group in the percentage of individuals with controlled hypertension, and there were only modest variations by presence or absence of comorbidities or major risk factors (Table 5). Logistic regression models of hypertension control on predictors such as age, sex, ethnic background, body mass index (< 30 v. ≥ 30), comorbidities and drug therapy (monotherapy v. 2 or more drugs) were not significant. High correlation among key explanatory variables and the scarcity of the relevant subsample are likely causes of the insignificance in the models. About one-sixth (14.7%) of participants with hypertension were receiving treatment and their hypertension was not controlled (Figure 2), with modest (nonsignificant) variations by age, sex and ethnic background (data not shown). In the group receiving treatment without control, 67.7% had systolic hypertension, 20.2% had diastolic hypertension and 12.1% had combined systolic and diastolic hypertension.
Figure 2: Treatment and control of hypertension as determined in 2006 by the Ontario Survey on the Prevalence and Control of Hypertension and in 1992, for Ontario and Canada as a whole, in the Canadian Heart Health Survey (1992 data supplied by Dr. Michel Joffres, Simon Fraser University, personal communication, July 31, 2007). The data are presented as percentage of the population with diagnosed hypertension. Both sets of Ontario data were weighted to the Ontario population, and the national data were weighted to the Canadian population. For consistency of comparison, “treatment” in the Canadian Heart Health Survey refers to drug therapy only.
Among participants with both hypertension and diabetes, we compared those whose blood pressure was at least 130/80 mm Hg with those whose blood pressure was at least 140/90 mm Hg. In these 2 groups, 34.7% versus 58.7% were receiving treatment and had controlled hypertension, 37.4% versus 37.5% were receiving treatment but hypertension remained uncontrolled, and 27.9% versus 3.7% were not being treated.
Among the 19.5% of participants with hypertension whose condition was untreated, 70.2% (i.e., 13.7% of all participants who had hypertension) were unaware of their hypertension, and 29.8% (i.e., 5.8% of all participants who had hypertension) were aware. There were no significant differences by age, sex or ethnic background for the percentage not treated and the percentage unaware, but most of the coefficients of variation were greater than 0.33 (data not shown).
Interpretation
The Ontario Survey on the Prevalence and Control of Hypertension has yielded 2 important findings. First, the overall prevalence of hypertension remains high, particularly among older people. However, somewhat surprisingly, prevalence appears not to have increased in recent decades. Second, hypertension management has improved markedly, with substantial increases in both treatment rates and control rates. On a global scale, the current control rates appear to be among the highest.
In the 1992 Canadian Heart Health Survey, there was a marked increase in systolic blood pressure with age and a lesser increase in diastolic blood pressure. These age-related increases were similar for all of Canada and for Ontario (Figure 3). Since then, both systolic and diastolic blood pressures appear to have decreased substantially, by 5/6 mm Hg among those 20–39 years of age and by 20/10 mm Hg among those 60–79 years of age (Figure 3). These lower blood pressures may reflect lower prevalence of hypertension or better management. In the present study, the overall prevalence of hypertension was 21.3%, and prevalence increased from 3.4% in the youngest group to 51.6% in the oldest group. For each age group, these rates are a few percentage points lower than in the 1992 Canadian survey, which counted subjects with blood pressure controlled by nonpharmacologic treatment as having hypertension (these subjects accounted for 6% of the hypertensive population).3,9 For a comparison using the same definition (i.e., those with blood pressure controlled nonpharmacologically excluded from rates of hypertension in the earlier survey), the rates were similar: 21.3% in the present study and 21% in the 1992 survey.
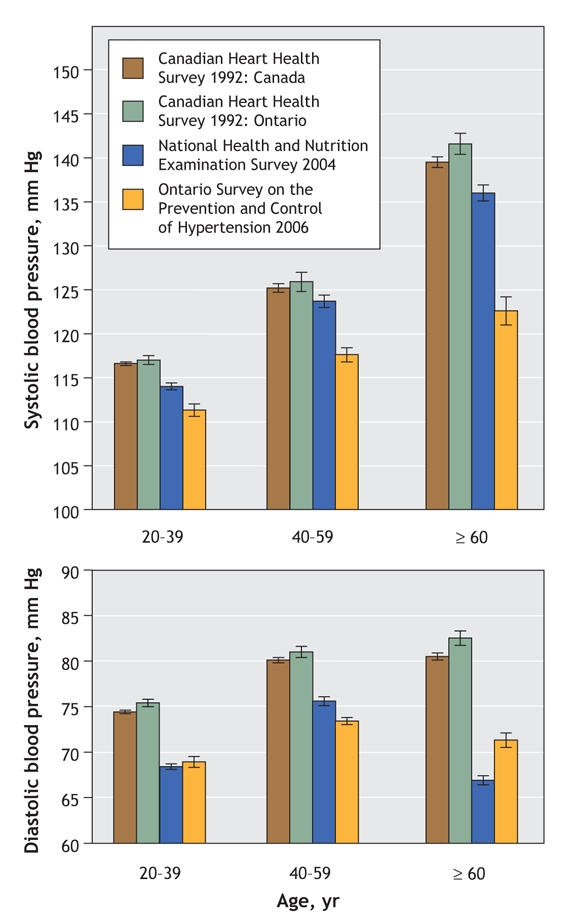
Figure 3: Systolic and diastolic blood pressure by age in the 1992 Canadian Heart Health Survey (for Ontario and Canada), the National Health and Nutrition Examination Survey (2004), and the Ontario Survey on the Prevalence and Control of Hypertension (2006). Data were weighted to the respective population in each survey and are expressed as mean and standard error.
The present study provides no clear evidence that rates of hypertension are higher than they were 15–20 years ago. It is possible that prevalence increased in recent decades because of factors such as higher rates of obesity but that the increase was offset by factors such as improvements in general socioeconomic health. The current rates appear substantially lower than those in the United States, which are 5% higher among adults 20–39 years of age and nearly 20% higher among those 60–79 years of age.8 These higher prevalence rates may relate in part to measurement of blood pressure by physicians in the US National Health and Nutrition Examination Survey, a situation that tends to increase blood pressure.10
Similar to the 1992 Canadian survey, the prevalence of hypertension tended to be higher among men (23.8%) than among women (19.0%). The prevalence was lower not only among younger, premenopausal women but also, perhaps more markedly, among older women (Table 1). With respect to ethnic groups, after adjustment for age, sex and body mass index, our study showed a generally similar prevalence among white people and those of East Asian background. Rates in the latter group were consistent with those reported in the China Health and Nutrition Survey.11 In contrast, black people and those of South Asian background were 3 times more likely than white people to have hypertension. These findings are consistent with, for black people, the results of the US National Health and Nutrition Examination Survey and, for South Asian people, the rates reported in the SUNSET study12 and by Primatesta and colleagues.13
The management of hypertension appears to have dramatically improved in Ontario in recent years (Figure 2). Whereas the 1992 survey showed that only 13% of people with hypertension had their blood pressure controlled to less than 140/90 mm Hg by drug therapy, the overall rate of control in the present survey was 65.7%, with only minor variations by age, sex, ethnic group and presence of cardiovascular disease, diabetes, obesity and high cholesterol. This marked improvement in blood pressure control is consistent with the substantial increase in prescriptions for antihypertensive drugs in Ontario (data derived from administrative databases) and with large increases in self-reported prevalence and treatment of hypertension for adult Canadians.14,15 The latest National Health and Nutrition Examination Survey reported control rates of 37% in the United States for 2003–2004, with only minor differences between men and women, between whites and blacks and among different age groups.8 Earlier surveys in the same series reported control rates of 25% for 1990–1994.9,16 In parallel, in Ontario, the percentage of people with hypertension not being treated at all has decreased considerably, from 61% in 1990 to only 19.5% in 2006, whereas awareness has increased, from 60% in 1990 to nearly 90% today. In the United States the percentage of people with untreated hypertension decreased from 48% to 35% and awareness increased from 70% to 75% between 1990–1994 and 2003–2004. Thus, both treatment and control rates have improved in both countries but the extent of improvement is markedly higher in Ontario. Whereas in the early 1990s the United States system appeared to perform better, subsequent improvements in Ontario in both detection and treatment appear to have been more substantial than those in the United States.
In our study, people with diabetes accounted for 6.5% of the population, and 50.3% of them also had hypertension. Nearly everyone who had both diabetes and hypertension was receiving treatment for the hypertension; of those receiving treatment, 58.7% had blood pressure less than 140/90 mm Hg and only 36.1% had blood pressure less than 130/80 mm Hg. More intense therapeutic effort appears needed to achieve the latter, more aggressive goal.
The improvement in control rates achieved in Ontario in recent years is comparable to those achieved in community-based clinical trials such as ALLHAT17 and those achieved in the US Veterans' Administration system.18 Further improvements are still essential if one considers that the 30% of people with uncontrolled hypertension represent nearly 500 000 Ontarians (mainly middle-aged and older), who remain unnecessarily at increased risk for premature cardiovascular disease. In a small percentage of cases, there may be good reasons for not initiating therapy or not lowering blood pressure to below 140/90 mm Hg, but this is clearly not the case for 30% of the hypertensive population under 80 years of age.
In the 1992 Canada-wide survey, blood pressure distribution was similar in Ontario and the whole of Canada (Figure 3). Given that the same public health care system exists across Canada, it is likely that the present results obtained for Ontario (population 12 160 282) are representative of Canada (population 31 612 897, according to the 2006 census). The prevalence of hypertension in the population is determined by both genetic and lifestyle factors. Regional differences may therefore exist because of differences in factors such as salt intake and body weight. Similarly, control rates may show variations related to differences in the physician to population ratio or socioeconomic status.
Treatment and control rates in Ontario and presumably in Canada are now substantially higher than in the United States,8 and rates in both countries are higher than those in western European countries.19,20 The survey methodology for all of these studies was essentially similar. Recent European surveys also used automated blood pressure devices.19 Guidelines for the management of hypertension are similar as well. Both Canada and the western European countries have efficient, publicly funded health care systems. It appears that good blood pressure control in the community is possible, but adequate access to health care is required, as is a focus on prevention, which may be more advanced in North America than in Western Europe.
The primary strengths of the present study were the use of direct observations for both blood pressure and medical history in a representative sample of the population, with oversampling of specific ethnic groups. A standardized approach, including the use of recommended procedures for measurement of blood pressure by trained nurses, was a major strength. The use of fully automated electronic measuring devices eliminated inter-observer and intra-observer error, the digital preference and the “white coat effect.” In contrast, the data on blood pressure in administrative databases is usually obtained by physicians, who may markedly overdiagnose (uncontrolled) hypertension.10 Such databases also miss individuals who do not visit a physician. Conversely, participants may become more adherent to therapy before attending a blood pressure clinic (the “Hawthorne effect”), which leads to the appearance of better control rates. However, this phenomenon probably also occurs when a patient is visiting his or her physician.
Several possible limitations should be considered. First, as with all surveys of this nature, nonresponse may introduce volunteer bias. To obtain representative estimates of the population, estimation weights were adjusted for age, sex and ethnicity at the lowest possible geographic level. Moreover, actual participation rates and final sample size were comparable to those of the 1992 Canadian Heart Health Survey in Ontario, which sampled 5817 persons and located 3639, with home visits for 2538 persons and clinic visits for 2039.21 Second, results from several subgroup analyses showed large coefficients of variation; these data should be interpreted with caution. Third, blood pressure was measured during a single visit, but this may overestimate rather than underestimate actual blood pressure values.
In conclusion, the community-based cross-sectional survey reported here showed a substantial improvement in age-associated high systolic blood pressure: from 141 mm Hg among participants 60–79 years of age in 1992 to only 122 mm Hg in this age group in 2006. This overall decrease in blood pressure in the population is not related to a decrease in the prevalence of hypertension but rather to a marked improvement in management of the condition. Long-term decreases in blood pressure of this magnitude likely contributed to a substantial extent to the lower rates of hospital admission and death from stroke and myocardial infarction in Canada in the past decade.22
@ See related articles, pages 1429, 1436 and 1458
Supplementary Material
Acknowledgments
We thank Rosemary LaRose, RN, and Sharilyne Anderson for their excellent assistance with the coordination of the clinic sites and collection of the survey data. We also thank Dr. Michel Joffres for providing unpublished data from the 1992 Canadian Heart Health Survey and for his feedback on this manuscript. Finally, we thank the Prevalence Study Advisory Group of the Heart and Stroke Foundation of Ontario (Dr. Arun Chockalingam, chair, and members Sarah Connor-Gorber, Dr. Ross Feldman, Dr. Steven Grover, Dr. Karen Tu and Eugene Wen) for their helpful comments during the development of this paper.
Footnotes
Une version française de ce résumé est disponible à l'adresse www.cmaj.ca/cgi/content/full/178/11/1441/DC1
This article has been peer reviewed.
Contributors: Frans Leenen and George Fodor developed the design for the project and directed its execution. Kathleen Nemeth and Natalie McInnis were responsible for managing the project. Penelope Turton contributed to all phases of the survey. Frans Leenen and Natalie McInnis wrote the manuscript. Jean Dumais and Lori Stratychuk were responsible for data analysis. All of the authors were involved in critical revisions of the manuscript and approved the final version for publication.
This study was supported by a contract from the Heart and Stroke Foundation of Ontario awarded to Frans Leenen and George Fodor. Frans Leenen holds the Pfizer Chair in Hypertension Research, an endowed chair supported by Pfizer Canada, the University of Ottawa Heart Institute Foundation and the Canadian Institutes of Health Research.
Competing interests: None declared.
Correspondence to: Dr. Frans H.H. Leenen, University of Ottawa Heart Institute, 40 Ruskin St., Rm. 360A, Ottawa ON K1Y 4W7; telephone 613 761-4521; fleenen@ottawaheart.ca
REFERENCES
- 1.Lewington S, Clarke R, Qizilbash N, et al. Age-specific relevance of usual blood pressure to vascular mortality: a meta-analysis of individual data for one million adults in 61 prospective studies. Lancet 2002;360:1903-13. [DOI] [PubMed]
- 2.World Health Organization. The world health report 2002. Reducing risks, promoting healthy life. Geneva: The Organization; 2002.
- 3.Joffres MR, Ghadirian P, Fodor JG, et al. Awareness, treatment, and control of hypertension in Canada. Am J Hypertens 1997;10:1097-102. [DOI] [PubMed]
- 4.Lohr S. Sampling: design and analysis. Pacific Grove (CA): Duxbury Press; 1999.
- 5.Wright JM, Mattu GS, Perry TL, et al. Validation of a new algorithm for the BPM-100 electronic oscillometric office blood pressure monitor. Blood Press Monit 2001;6:161-5. [DOI] [PubMed]
- 6.Myers MG, McInnis NH, Fodor GJ, et al. Comparison between an automated and manual sphygmomanometer in a population survey. Am J Hypertens 2008;21:280-3. [DOI] [PubMed]
- 7.Wolter K. Introduction to variance estimation. New York: Springer Verlag; 1985.
- 8.Ong KL, Cheung BMY, Man YB, et al. Prevalence, awareness, treatment, and control of hypertension among United States adults 1999–2004. Hypertension 2007;49:69-75. [DOI] [PubMed]
- 9.Joffres MR, Hamet P, MacLean DR, et al. Distribution of blood pressure and hypertension in Canada and the United States. Am J Hypertens 2001;14:1099-105. [DOI] [PubMed]
- 10.La Batide-Alanore A, Chatellier G, Bobrie G, et al. Comparison of nurse-and physician-determined clinic blood pressure levels in patients referred to a hypertension clinic: implications for subsequent management. J Hypertens 2000;18:391-8. [DOI] [PubMed]
- 11.Colin Bell A, Adair LS, Popkin BM. Ethnic differences in the association between body mass index and hypertension. Am J Epidemiol 2002;155:346-53. [DOI] [PubMed]
- 12.Agyemang C, van Valkengoed I, Koopmans R, et al. Factors associated with hypertension awareness, treatment and control among ethnic groups in Amsterdam, The Netherlands: the SUNSET study. J Hum Hypertens 2006;20:874-81. [DOI] [PubMed]
- 13.Primatesta P, Bost L, Poulter NR. Blood pressure levels and hypertension status among ethnic groups in England. J Hum Hypertens 2000;14:143-8. [DOI] [PubMed]
- 14.Tu K, Campbell NRC, Duong-Hua M, et al. Hypertension management in the elderly has improved — Ontario prescribing trends, 1994 to 2002. Hypertension 2005;45:1113-8. [DOI] [PubMed]
- 15.Onysko J, Maxwell C, Eliasziw M, et al. Large increases in hypertension diagnosis and treatment in Canada after a healthcare professional education program. Hypertension 2006;48:853-60. [DOI] [PubMed]
- 16.Burt VL, Whelton P, Roccella EJ, et al. Prevalence of hypertension in the US adult population. Results from the Third National Health and Nutrition Examination Survey, 1988–1991. Hypertension 1995;25:305-13. [DOI] [PubMed]
- 17.Leenen FHH. ALLHAT: What has it taught us so far? [editorial]. CMAJ 2004;171:719-20. [DOI] [PMC free article] [PubMed]
- 18.Berlowitz DR, Cushman WC, Glassman P. Hypertension in adults across age groups. JAMA 2005;294:2970-1. [DOI] [PubMed]
- 19.Meisinger C, Heier M, Volzke H, et al. Regional disparities of hypertension prevalence and management within Germany. J Hypertens 2006;24:293-9. [DOI] [PubMed]
- 20.Sehestedt T, Ibsen H, Jorgensen T. Awareness, treatment and control of hypertension in Denmark. The Inter99 study. Blood Press 2007;16:312-9. [DOI] [PubMed]
- 21.Canadian Heart Health Survey, 1986–1992. Available: http://data.library.ubc.ca/java/jsp/database/production/detail.jsp?id=975 (accessed 2008 Mar 18).
- 22.Campbell NRC, Onysko J, Johansen H, et al. Changes in cardiovascular deaths and hospitalization in Canada. Can J Cardiol 2006;22:425-7. [DOI] [PMC free article] [PubMed]
Associated Data
This section collects any data citations, data availability statements, or supplementary materials included in this article.


