Abstract
Sound coding at the auditory inner hair cell synapse requires graded changes in neurotransmitter release, triggered by sustained activation of presynaptic Cav1.3 voltage-gated Ca2+ channels. Central to their role in this regard, Cav1.3 channels in inner hair cells show little Ca2+-dependent inactivation, a fast negative feedback regulation by incoming Ca2+ ions, which depends on calmodulin association with the Ca2+ channel α1 subunit. Ca2+-dependent inactivation characterizes nearly all voltage-gated Ca2+ channels including Cav1.3 in other excitable cells. The mechanism underlying the limited autoregulation of Cav1.3 in inner hair cells remains a mystery. Previously, we established calmodulin-like Ca2+-binding proteins in the brain and retina (CaBPs) as essential modulators of voltage-gated Ca2+ channels. Here, we demonstrate that CaBPs differentially modify Ca2+ feedback to Cav1.3 channels in transfected cells and explore their significance for Cav1.3 regulation in inner hair cells. Of multiple CaBPs detected in inner hair cells (CaBP1, CaBP2, CaBP4 and CaBP5), CaBP1 most efficiently blunts Ca2+-dependent inactivation of Cav1.3. CaBP1 and CaBP4 both interact with calmodulin-binding sequences in Cav1.3, but CaBP4 more weakly inhibits Ca2+-dependent inactivation than CaBP1. Ca2+-dependent inactivation is marginally greater in inner hair cells from CaBP4−/− than from wild-type mice, yet CaBP4−/− mice are not hearing-impaired. In contrast to CaBP4, CaBP1 is strongly localized at the presynaptic ribbon synapse of adult inner hair cells both in wild-type and CaBP4−/− mice and therefore is positioned to modulate native Cav1.3 channels. Our results reveal unexpected diversity in the strengths of CaBPs as Ca2+ channel modulators, and implicate CaBP1 rather than CaBP4 in conferring the anomalous slow inactivation of Cav1.3 Ca2+ currents required for auditory transmission.
In the cochlea, Cav1.3 voltage-gated Ca2+ channels are essential for the proper development and function of inner hair cells (IHCs) as mechanosensory transducers of acoustic stimuli. Cav1.3 channels mediate L-type Ca2+ currents that trigger exocytosis of neurotransmitter from IHCs onto auditory nerve afferents (Platzer et al. 2000; Brandt et al. 2003, 2005) and Ca2+ action potentials in IHCs before the onset of hearing (Brandt et al. 2003; Marcotti et al. 2003). Mice lacking Cav1.3 are congenitally deaf (Platzer et al. 2000; Dou et al. 2004), illustrating how factors that regulate these channels can affect sound coding at this first synapse in the auditory pathway.
Most features of IHC Cav1.3 channels, including their fast activation kinetics and relatively negative thresholds for activation, are reproduced in recombinant systems (Xu & Lipscombe, 2001; Koschak et al. 2001). However, Cav1.3 Ca2+ currents in IHCs show considerably less Ca2+-dependent inactivation (CDI) than in transfected cells (Platzer et al. 2000; Xu & Lipscombe, 2001; Koschak et al. 2001). CDI is manifest as faster inactivation of Ca2+ currents (ICa) than Ba2+ currents (IBa) and depends on calmodulin binding to the IQ domain in the C-terminal domain of the pore-forming Cav1 α1-subunit (Qin et al. 1999; Peterson et al. 1999; Zühlke et al. 1999). Mutations of the IQ domain in the Cav1.3 α1-subunit (α11.3) inhibit CDI, and a α11.3 splice variant lacking the IQ domain was identified in the cochlea (Shen et al. 2006). However, this α11.3 variant is expressed mainly in outer hair cells (OHCs) and not IHCs, suggesting an alternative mechanism for the limited CDI of native Cav1.3 channels in IHCs.
We have shown previously that Ca2+ binding proteins related to calmodulin (CaBP1 and CaBP4) can physically displace calmodulin from Cav channels, but with distinct functional consequences (Lee et al. 2002; Zhou et al. 2004; Haeseleer et al. 2004; Zhou et al. 2005). CaBP1 is expressed primarily in the brain and retina and abolishes CDI of Cav1.2 channels (Zhou et al. 2004, 2005). CaBP4 is localized in photoreceptor nerve terminals, where its association with Cav1.4 causes the channels to activate at more hyperpolarized membrane potentials required for normal visual transduction (Haeseleer et al. 2004). Considering the analogous functions of Cav1.3 in IHCs and Cav1.4 in photoreceptors, we hypothesized that CaBP4 might be expressed in IHCs and confer the native phenotype of Cav1.3 Ca2+ current in these cells. Evidence favouring this hypothesis was provided in a recent study (Yang et al. 2006). Here, we further investigated the role of CaBPs in the regulation of Cav1.3 Ca2+ currents in IHCs. Our results show that CaBP4 has relatively minor effects on Cav1.3 CDI, which alone cannot account for the slowly inactivating properties of Cav1.3 in IHCs. Instead, the data implicate CaBP1 as a key candidate for regulating CDI in IHCs.
Methods
Ethical approval
All procedures involving animals were approved by the Institutional Animal Care and Use Committee at Emory University in accordance with National Institutes of Health guidelines and animal welfare guidelines at the University of Göttingen and the State of Lower Saxony. After killing the mice by cervical dislocation the skull was opened, and the cochlea was removed and opened at the apex so that the apical coil could be harvested for immuncytochemical or electrophysiological experiments.
Constructs and molecular biology
The following Cav subunit cDNAs were used: α11.3 containing exon 42 (GenBank no. AF370009 and AF370010 for additional sequence encoded by exon 42), β1b (GenBank no. NM017346), α11.2 (GenBank no. M67515), β2A (GenBank no. NM053581), β3 (GenBank no. NM012838), β4 (GenBank no. L02315), and α2δ (GenBank no. M21948). FLAG-α11.3 and GST (glutathione-S-transferase)-tagged α11.3 C-terminal construct (GST-α11.3 CT: nucleotides 5886–6465) were previously described (Calin-Jageman et al. 2007). The I-E mutation was introduced at position 1608 in α11.3 and CT by quick-change mutagenesis with specific oligonucleotide primers. GST-NT corresponds to amino acids 1–117 of α11.3 subcloned into BamHI/NotI sites of pGEX4T-1. CaBP1, CaBP2, CaBP4 and CaBP5 constructs used for mammalian cell expression were previously described (Haeseleer et al. 2004; Zhou et al. 2004).
Cell culture, transfection, and lysate preparation
Culture and transfection of HEK293T cells by Geneporter transfection reagent (Genlantis, San Diego, CA, USA) was as previously described (Calin-Jageman et al. 2007). For immunoprecipitation, HEK293T cells were transfected with cDNAs encoding Cav1.3 (FLAG-α11.3 (6 μg), β2A, and α2δ (2 μg each) with or without CaBP4 (2 μg). For electrophysiological experiments, HEK293T cells plated on 35 mm dishes were transfected with ∼3 μg total DNA (FLAG-α11.3 or FLAG-α11.2 (1.5 μg), β (0.8 μg), α2δ (0.8 μg) ± GFP-tagged CaBP1 (0.1 μg), GFP-tagged or untagged CaBP4 (0.1 μg) or GFP expression plasmid (0.01 μg)). These transfection conditions have been optimized to compensate for the inhibitory effect of CaBPs on Cav current density, and yield measurable whole-cell currents (0.1−0.5 nA) that are easily amenable to biophysical analysis. For electrophysiological recording, GFP fluorescence was used to identify cells cotransfected with Cav1 subunits and CaBPs. Due to the inherently weak fluorescence associated with the GFP-tagged CaBP4 construct, we generally used untagged CaBP4 in combination with GFP expression plasmid (0.01 μg) for detection of cotransfected cells. Since there was no significant difference in the effects of GFP-CaBP4 or untagged CaBP4, data resulting from both transfection methods were pooled.
Binding and coimmunoprecipitation assays
Methods for pull-down of CaBP1 or CaBP4 from transfected HEK293T cell lysates by GST-α11.3 proteins immobilized on beads were published previously (Zhou et al. 2005; Zhou et al. 2004). Co-immunoprecipitation of Cav1.3 and CaBP4 from transfected HEK293T cells was also as previously described (Calin-Jageman et al. 2007). Western blotting was performed with appropriate antibodies (CaBP1 1: 1000, CaBP4 1: 2000) followed by HRP-conjugated anti-rabbit antibodies (1: 2000) and enhanced chemiluminescent detection reagents (Amersham Biosciences, Piscataway, NJ, USA).
Immunohistochemistry
For Figs 1A and B and 5B, C and E and online supplemental material Supplemental Fig. 1b (CaBP2 and CaBP5), immunostaining and confocal analysis of whole-mount mouse organ of Corti (P14–15, P28, or 2 months old as indicated) were performed essentially as described (Sendin et al. 2007). The following antibodies were used: mouse anti-CtBP2 IgG1 (1: 200; BD Biosciences, San Jose, CA, USA), anti-CaBP2, 4 and 5 (1: 400 (Haeseleer et al. 2000) and AlexaFluor488- and AlexaFluor568-labelled secondary antibodies (1: 200; Invitrogen, Carlsbad, CA, USA). For Fig. 5A and Supplemental Fig. 1a and b (CaBP1), cochleae were fixed with 4% paraformaldehyde/phosphate-buffered saline (PBS) and decalcified with 10% EDTA/PBS for 24 h prior to immunostaining with rabbit anti-CaBP1 or CaBP4 antibodies (Haeseleer et al. 2000; 1: 500) and FITC donkey anti-rabbit IgG (1: 200; Jackson ImmunoResearch, West Grove, PA, USA). Before mounting, most samples were incubated in Hoechst 34580 (1: 1000, Invitrogen) for 5–10 min. Confocal images were acquired using a Leica SP2 or SP5 (Leica Microsystems, Mannheim, Germany) or Zeiss LSM 510 laser scanning confocal microscope. Processed images were assembled for display in Adobe Photoshop and Illustrator or Macromedia Freehand software.
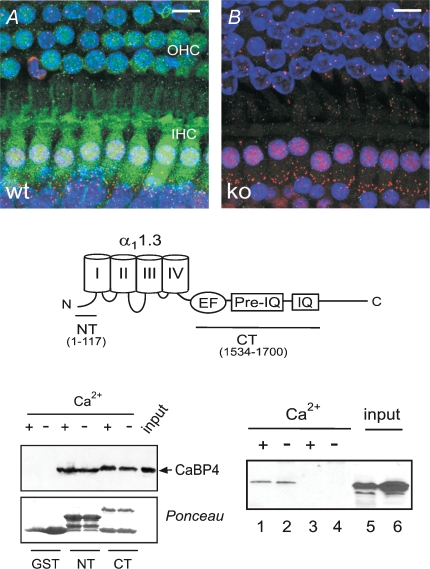
Figure 1. CaBP4 is localized in IHCs and functionally interacts with Cav1.3.
A, immunofluorescence of CaBP4 in the organ of Corti from WT (A) and CaBP4−/− (B) mice. Projections of confocal sections show immunofluorescence for CaBP4 (green) and CtBP2/RIBEYE (red) in IHCs and OHCs. Hoechst staining (blue) marks cell nuclei. Scale bars, 10 μm. Results shown are representative of at least 2 experiments performed with 6 organs of Corti. C, schematic diagram of Cav1.3 α1 subunit indicating CT and NT fragments used for binding assays with CaBP4. D, CaBP4 pull-down with GST-tagged CT or NT. GST or GST-CT or NT was immobilized on glutathione beads and incubated with lysates from HEK293T cells transfected with CaBP4 in the presence (+) or absence of (−) of Ca2+. Bound CaBP4 was detected by Western blot with CaBP4 antibodies (top). Input represents ∼5% of protein used in assay. Ponceau staining shows levels of GST proteins used in assay. Results shown are representative of 3 experiments. E, co-immunoprecipitation of CaBP4 with Cav1.3. HEK293T cells were transfected with Cav1.3 + CaBP4 (lanes 1, 2, 5) or with CaBP4 alone (lanes 3, 4, 6), lysed, and subjected to immunoprecipitation with Cav1.3 antibodies with (+) or without (−) Ca2+. Input represents ∼5% of lysate used for assay. Co-immunoprecipitated CaBP4 was detected by Western blot with CaBP4 antibodies. Results shown are representative of three experiments.
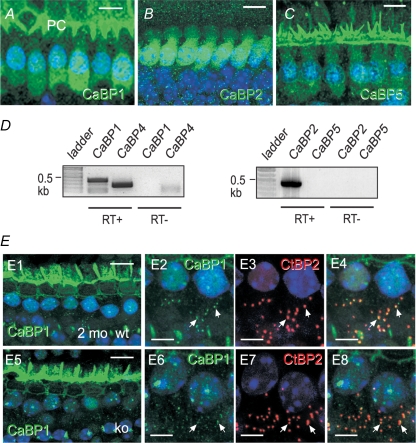
Figure 5. CaBP1, 2, and 5 are localized in IHCs.
A–C, confocal micrographs of whole-mount preparations of mouse organ of Corti (P14–P15) labelled with antibodies against CaBP1 (A), CaBP2 (B), or CaBP5 (C) and FITC-secondary antibodies (green) followed by Hoechst staining of nuclei (blue). Images represent single (A), or projections of, confocal section(s) (B and C). CaBP1 staining was detected in IHC soma and overlying pillar cells (PC). Scale bars, 10 μm. Results shown are representative of experiments performed with at least 6 organs of Corti. D, RT-PCR analysis of CaBP variants in mouse cochlear extracts. Reactions were performed with (+RT) or without reverse transcriptase (−RT) as a negative control. E, presynaptic localization of CaBP1 in IHCs from 2-month-old WT and CaBP4−/− (KO) IHCs. Confocal micrographs show whole-mounts of organs of Corti double labelled with antibodies against CaBP1 (green, E1, 2, 5, 6) and CtBP2 (red, E3, E7). Examples of colocalization are indicated with arrows and appear yellow in the merged images (E4, 8). Scale bars, 10 μm in E1, E2; 5 μm in E2−4, E6 −8. Results shown are representative of experiments performed with 4 organs of Corti.
RT-PCR
RNA was isolated from mouse (P14) cochlea with Trizol reagent (Invitrogen) and subject to RT-PCR with primers specific for CaBP1, 2, 4, or 5. Amplification of CaBP1 was performed with standard primers, while that for CaBP2, 4, and 5 required nested primers. Amplicons were analysed on agarose gels and were detected alongside negative control reactions that lacked reverse transcriptase. The following primer sets were used: CaBP1 forward: GACAAAGACAAGGATGGTTAC, reverse: CTCTTCAAAGTCCACTCGTCC; CaBP2 forward 1: ATGGTTCAGAGACCCATGG, reverse 1: CCGAGACATCATCCGAACAAA, forward 2: GCATGCATCTTCCTTCGACCC, reverse 2: GGTCAATGTCTTGGAGTATC; CaBP4 forward 1: GAGTTTGACACTGACCAGGAC, reverse 1: CTCGTCAAAGTCTATGGTGC, forward 2: CAGCACGTGAAGATGCGCATG, reverse 2: CAACATCTCATCCAGTTCAGTG; CaBP5 forward 1: ATGCAGTTTCCAATGGGTCCTG, reverse 1: CGAGACATCATCTTCACAAACA, forward 2: CAGGATGAGCTTGATGAGCTC, reverse 2: TGCTGCAG TTCT GCCAGTGT.
Electrophysiology
Electrophysiological data were acquired with EPC-9 patch-clamp amplifiers driven by Pulse software (HEKA Elektronik, Lambrecht/Pfalz, Germany) and analysed with Igor Pro software (Wavemetrics, Lake Oswego, OR, USA). For transfected HEK293T cells, extracellular recording solutions contained (mm): 150 Tris, 1 MgCl2, and 10 BaCl2 or 10 CaCl2. Intracellular solutions consisted of (mm): 140 N-methyl-d-glucamine, 10 Hepes, 2 MgCl2, 2 Mg-ATP, and 5 EGTA. The pH of intracellular and extracellular recording solutions was adjusted to 7.3 with methanesulphonic acid. Electrode resistances were typically 1–2 MΩ in the bath solution, and series resistance was ∼2–4 MΩ, compensated up to 80%. Current density was measured by dividing the amplitude of the Ca2+ current by the cell capacitance. For this purpose, the Ca2+ current was evoked by −90 to −20 mV (for Cav1.3), −80 to −10 mV (for Cav1.2), and −90 to +10 mV (for Cav1.3I-E). For analysis of I–V curves, currents were evoked by 20 ms pulses to varying test voltages from a holding voltage of −90 mV. Current amplitudes were plotted against test voltage and fitted with the Boltzmann function:
where g is the maximum conductance, V is the test potential, E is the apparent reversal potential, V1/2 is the potential of half-activation, k is the slope factor, and b is the baseline. Statistical comparisons were by t test.
For IHCs, perforated patch-clamp recordings were made from the apical coil of freshly dissected organs of Corti from NMRI, C57Bl/6, or CaBP4−/− mice (2–4 weeks of age) at the basolateral face of IHCs at room temperature. The intracellular recording solutions contained (mm), for exocytosis: 140 caesium gluconate, 13 TEA-Cl, 10 CsOH-Hepes; for CDI: 130 caesium gluconate, 10 TEA-Cl, 10 4-AP, 10 NaOH-Hepes, 1 MgCl2. Both solutions contained amphotericin B (250 μg ml−1). The extracellular solutions contained (mm), for exocytosis: 105 NaCl, 35 TEA-Cl, 2.8 KCl, 2 CaCl2, 1 MgCl2, 10 NaOH-Hepes, 10 d-glucose; for CDI: 104 NaCl, 35 TEA-Cl, 2.8 KCl, 1 MgCl2, 1 CsCl, 5 4-AP, 10 NaOH-Hepes, 10 d-glucose and 5 Ca2+ or 5 Ba2+. All solutions were adjusted to pH 7.2. With these solutions, electrode resistances were typically 4–6 MΩ. All voltages were corrected for liquid junction potentials. Cm was measured as previously described (Moser & Beutner, 2000) and ΔCm was estimated as the difference between the mean Cm over 60–400 ms after the end of the depolarization and the mean prepulse capacitance (400 ms). Integrals of the Ca2+ current were calculated from the total depolarization-evoked inward current, including Ca2+ tail currents after leak subtraction. Cells with a membrane current exceeding −50 pA at the standard holding potential of −86 mV were discarded from the analysis.
All averaged data are presented as the mean ± s.e.m. Statistical significance of differences between two groups was determined by Student's t test or ANOVA as indicated (SigmaStat, Systat Software Inc., San Jose, CA, USA).
In vivo analysis of auditory function in CaBP4+/− and CaBP4−/− mice
The development and characterization of CaBP4−/− mice were previously described (Haeseleer et al. 2004). For auditory brainstem responses (ABR) and distortion product otoacoustic emissions (DPOAE), mice (4 weeks old) were measured essentially as previously described (Khimich et al. 2005). Briefly, for ABR, tone bursts (4/6/8/12/16/24/32 kHz, 10 ms plateau, 1 ms rise/fall) or clicks (of 0.03 ms) were applied in the free field at 20 Hz (System 2, Tucker-Davis Technology, Gainesville, FL, USA and high frequency speaker: Monacor International, Bremen, Germany). Intensities are displayed as sound pressure level (dB root mean square for tone bursts, dB peak equivalent for clicks). Thresholds were estimated with 10 dB precision by visual inspection of average ABR traces.
Results
CaBP4 interactions with Cav1.3
By immunohistochemistry, CaBP4 was expressed in both IHCs and OHCs after the onset of hearing (Fig. 1A), while it was absent early in development (P0, data not shown). Within P15 IHCs, CaBP4 labelling was distributed throughout the soma (Fig. 1A), which was also the case at later ages (P28; online supplemental material, Supplemental Fig. 1a). CaBP4 immunofluorescence was not restricted to presynaptic sites, identified by double-labelling with antibodies against CtBP2 (Fig. 1A). The absence of CaBP4 immunofluorescence in IHCs from CaBP4−/− mice (Fig. 1B and Supplemental Fig. 1a) confirmed the specificity of the antibodies for detecting CaBP4 in cochlear tissue.
Next, we tested if CaBP4 directly interacts with Cav1.3 in pull-down assays with GST-tagged fragments of α11.3. We focused on the cytoplasmic N-terminal (NT) and C-terminal (CT) domains of α11.3 (Fig. 1C), since they serve as the primary CaBP interaction sites in other Cavα1 subunits (Lee et al. 2002; Haeseleer et al. 2004; Zhou et al. 2004, 2005). In these experiments, CaBP4 associated with NT and CT, but not the GST control both in the presence and absence of Ca2+ (Fig. 1D). Ca2+-independent association of CaBP4 with the intact channel was also shown by coimmunoprecipitation from lysates of HEK293T cells (Fig. 1E). Together with previous findings that CaBP1 and CaBP4 do not require Ca2+ for binding to Cav channels (Lee et al. 2002; Haeseleer et al. 2004; Zhou et al. 2004; Zhou et al. 2005), these results suggest that CaBPs are constitutive subunits of Cav channels under basal Ca2+ conditions.
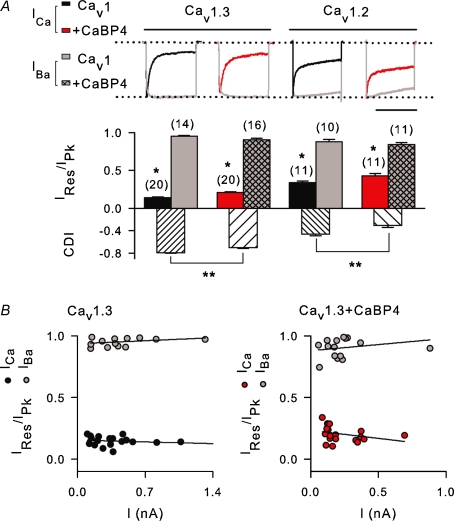
Since the NT and CT are modulatory sites for CDI in Cav1.2 (Ivanina et al. 2000; Zhou et al. 2005), we tested if CaBP4 binding to these regions affects CDI of Cav1.3. Inactivation was measured as Ires/Ipk, which was the current amplitude at the end of a 300 ms test pulse normalized to the peak current amplitude. CDI was calculated as the difference between Ires/Ipk for ICa and IBa. CaBP4 caused a small but significant inhibition of CDI (∼13% compared to Cav1.3 alone, P < 0.0001; Fig. 2A). CaBP4 inhibited inactivation of ICa (Ires/Ipk= 0.21 ± 0.02 for Cav1.3 + CaBP4 versus 0.14 ± 0.01 for Cav1.3 alone; P < 0.001) but not IBa (Ires/Ipk= 0.91 ± 0.02 for Cav1.3 + CaBP4 versus 0.95 ± 0.01 for Cav1.3 alone; P = 0.06), indicating a selective effect on CDI. However, CDI was still quite prominent in cells cotransfected with CaBP4 and Cav1.3 (Fig. 2A). CaBP4 also caused a modest inhibition of CDI for Cav1.2 (Fig. 2A), but this was in contrast to the complete blockade of Cav1.2 CDI caused by CaBP1 (Zhou et al. 2005; Zhou et al. 2004).
Figure 2. aBP4 is a weak modulator of Cav CDI.
A, inhibitory effect of CaBP4 on CDI of Cav1.3 and Cav1.2. Ca2+ or Ba2+ currents (ICa, IBa) were recorded in HEK293T cells transfected with Cav1.3 (α11.3, β2a, α2δ) or Cav1.2 (α11.2, β2a, α2δ) alone or cotransfected with CaBP4. Test pulses were 300 ms steps from −90 to −20 mV for Cav1.3 or 1 s steps from −80 to −10 mV for Cav1.2. Inactivation was measured as Ires/Ipk, which was the residual current amplitude at the end of the pulse normalized to the peak current amplitude. CDI is the difference in Ires/Ipk for ICa and IBa. Representative current traces for ICa (black or red) and IBa (grey) are shown. *P < 0.01 compared to IBa by t test; **P < 0.005 compared to Cav1.3 or Cav1.2 alone, by ANOVA and post hoc Bonferroni t test. Number of cells in each group indicated in parentheses. Scale bar, 0.2 s for Cav1.3 and Cav1.3 + CaBP4; 0.65 s for Cav1.2. Representative current traces are shown above. Scale bar, 800 ms for Cav1.2, 250 ms for Cav1.3. B, current independence of Cav1.3 inactivation. Ires/Ipk for cells obtained in A was plotted against peak current amplitude for ICa and IBa in cells transfected with Cav1.3 alone (left) or cotransfected with CaBP4 (right). Each point represents Ires/Ipk for a single cell. Data were linear as determined by Run's test, with regression line indicated. For both Cav1.3 alone and Cav1.3 + CaBP4, the slopes of the regression line did not differ significantly from zero (for Cav1.3 alone, P = 0.08 for ICa, P = 0.28 for IBa; for Cav1.3 + CaBP4, P = 0.58 for ICa, P = 0.29 for IBa; by ANOVA).
In these experiments and as noted previously (Yang et al. 2006), CaBP4 also significantly inhibited Cav1.3 current density (Table 1). If CDI of Cav1.3 depended on global Ca2+ signals resulting from multiple open channels, it was possible that CaBP4 inhibited CDI indirectly via secondary effects on channel density. If so, then as shown for Cav2 channels (Kreiner & Lee, 2006; Soong et al. 2002), inactivation of Cav1.3 ICa, but not IBa, should increase nonlinearly with whole-cell current amplitude. In addition, CaBP4 would not change the parameters of this relationship, but rather the range of current amplitudes sampled. In this case, the mean value for Ires/Ipk for ICa in cells with Cav1.3 + CaBP4 would be greater than that in cells transfected with Cav1.3 alone since smaller currents show less CDI. However, in cells transfected with Cav1.3 alone or cotransfected with CaBP4, inactivation of ICa and IBa did not vary significantly with current amplitude (Fig. 2B). For both groups, the relationship between current amplitude and Ires/Ipk was linear, with a slope not significantly different from zero. Thus, like Cav1.2 channels (Neely et al. 1994), CDI of Cav1.3 is independent of channel expression levels, perhaps due to a reliance on very local increases in Ca2+ through individual channels. This result argues against a role for the CaBP4-mediated decrease in current density in the mechanism by which CaBP4 inhibits CDI.
Table 1.
Current-densities measured in cells transfected with Cav1.3 ± CaBPs
| Transfection | Current-density (pA pF−1) | P value | n |
|---|---|---|---|
| Cav1.3 β1 | 48.3 ± 10.1 | — | 9 |
| + CaBP4 | 36.8 ± 10.5 | 0.44 | 9 |
| + CaBP1 | 23.9 ± 6.3 | 0.05 | 10 |
| + CaBP2 | 28.9 ± 7.3 | 0.13 | 12 |
| + CaBP5 | 25.2 ± 8.6 | 0.08 | 12 |
| Cav1.3 β2 | 30.0 ± 6.9 | — | 20 |
| + CaBP4 | 14.7 ± 2.3 | 0.03 | 20 |
| Cav1.3 β3 | 28.8 ± 4.3 | — | 9 |
| + CaBP4 | 16.9 ± 4.9 | 0.09 | 9 |
| Cav1.3 β4 | 39.8 ± 7.9 | — | 12 |
| + CaBP4 | 32.2 ± 6.9 | 0.48 | 12 |
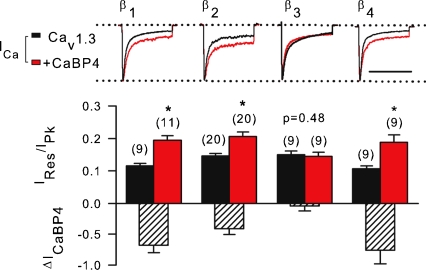
Because modulation of CDI can vary with the identity of the auxiliary Cavβ subunit (Lee et al. 2000), we tested if CaBP4 might have stronger effects on CDI of Cav1.3 channels comprised of different β subunits. CaBP4 caused a significant but still modest level of inhibition of ICa inactivation in channels with β1, β2 and β4 without any effects on IBa (Fig. 3). Interestingly, CaBP4 did not influence inactivation of ICa for Cav1.3 channels containing β3. In contrast to the stimulatory effects of CaBP4 on voltage-dependent activation of Cav1.4 (Haeseleer et al. 2004), CaBP4 did not similarly influence Cav1.3 channels, regardless of Cavβ (Table 2). In addition, the negative effects of CaBP4 on current density were significant only for Cav1.3 channels containing Cavβ2 (Table 1). These data indicate that CaBP4 differentially modulates Cav1.3 compared to Cav1.4, and has weak modulatory effects on CDI for Cav1.3 containing most Cavβ subunits.
Figure 3. Weak modulation by CaBP4 is independent of Cavβ subunit.
Ires/Ipk was determined for ICa as in Fig. 2A in cells cotransfected with Cav1.3 (α11.3, β, α2δ) alone or cotransfected with CaBP4. Inhibition of inactivation by CaBP4 was measured as ΔICaBP4=[(Ires/Ipk for Cav1.3) − (Ires/Ipk for Cav1.3 + CaBP4)]/(Ires/Ipk for Cav1.3). *P < 0.02 compared to Cav1.3 alone by t test. Representative current traces are shown above. Scale bar, 250 ms. Number of cells indicated in parentheses.
Table 2.
Parameters for activation of Cav1.3 from I–V relationships
| Transfection | V1/2 (mV) | P value | k | P value | n |
|---|---|---|---|---|---|
| IBa | |||||
| Cav1.3 β1 | −15.35 ± 1.86 | −6.77 ± 0.32 | 10 | ||
| + CaBP4 | −17.60 ± 1.87 | 0.40 | −6.97 ± 0.47 | 0.73 | 8 |
| Cav1.3 β2 | −13.55 ± 1.35 | −8.52 ± 0.18 | 10 | ||
| + CaBP4 | −10.02 ± 1.09 | 0.058 | −8.71 ± 0.23 | 0.53 | 10 |
| Cav1.3 β3 | −14.05 ± 2.25 | −9.90 ± 0.63 | 10 | ||
| + CaBP4 | −13.36 ± 2.07 | 0.83 | −7.53 ± 0.50 | 0.01 | 7 |
| Cav1.3 β4 | −17.28 ± 1.87 | −7.23 ± 0.29 | 9 | ||
| + CaBP4 | −14.58 ± 1.77 | 0.78 | −7.09 ± 0.24 | 0.72 | 9 |
| ICa | |||||
| Cav1.3 β1 | −7.31 ± 0.66 | −7.44 ± 0.37 | 10 | ||
| + CaBP4 | −7.32 ± 0.86 | 0.99 | −7.80 ± 0.23 | 0.42 | 12 |
| Cav1.3 β2 | −6.86 ± 1.09 | −8.43 ± 0.31 | 10 | ||
| + CaBP4 | −6.55 ± 1.04 | 0.84 | −8.84 ± 0.28 | 0.33 | 12 |
| Cav1.3 β3 | −5.44 ± 0.73 | −8.73 ± 0.21 | 9 | ||
| + CaBP4 | −7.29 ± 1.63 | 0.33 | −8.39 ± 0.35 | 0.41 | 7 |
| Cav1.3 β4 | −8.68 ± 1.44 | −7.39 ± 0.39 | 11 | ||
| + CaBP4 | −8.23 ± 0.75 | 0.31 | −8.31 ± 0.33 | 0.085 | 12 |
Normal hair cell synaptic transmission in mice lacking CaBP4
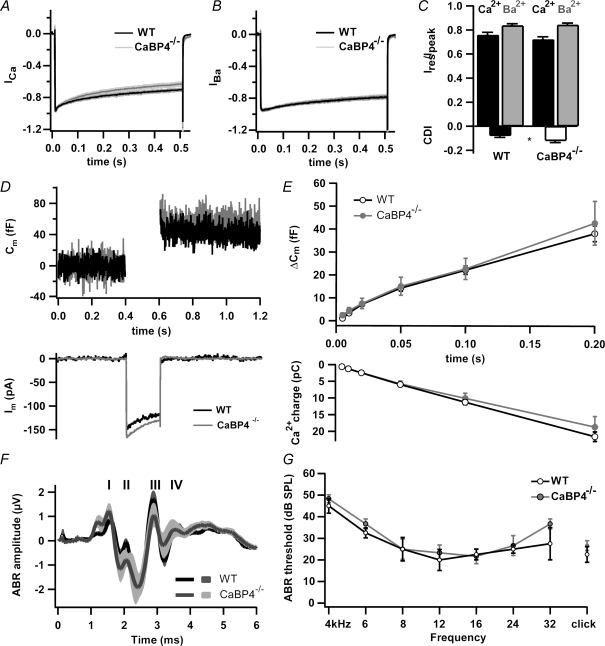
To address the significance of CaBP4 as a modulator of auditory Cav1.3 channels, we tested if the absence of CaBP4 affected CDI of IHCs and sound coding at the IHC afferent synapses. Patch-clamp recordings of IHCs in the apical coil of the organ of Corti monitored ICa and exocytic membrane capacitance changes (ΔCm) reflecting neurotransmitter release (Moser & Beutner, 2000) from wild-type (WT, C57Bl/6) and CaBP4−/− mice. As predicted from our results in transfected cells (Figs 2 and 3), CDI was marginally, but significantly enhanced (from −0.08 in WT to −0.13 in CaBP4−/− IHCs, P = 0.036), while inactivation of IBa was not affected in CaBP4−/− IHCs (P = 0.553; Fig. 4A–C). In addition, voltage-dependent activation and peak amplitudes of ICa were not different in WT and CaBP4−/− IHCs (data not shown). As expected, analyses of ICa integrals and ΔCm (Fig. 4D and E) revealed that Ca2+ influx and exocytosis were comparable in CaBP4−/− and WT IHCs for depolarizations up to 200 ms (Fig. 4D and E).
Figure 4. Hearing is not impaired in CaBP4 knockout mice.
A and B, mean ICa (A) and IBa (B) of WT (black, n = 12) and CaBP4−/− (grey, n = 14) IHCs evoked by 500 ms depolarizations to −16 mV. Currents were normalized to their peak amplitude and displayed with standard errors. C, Ires/Ipk and CDI were determined as in Fig. 2A except that currents were evoked as in (A and B) and residual current amplitude was measured at 300 ms. D, representative ICa and baseline-subtracted Cm traces (200 ms step to −16 mV). E, grand average of ΔCm (top) and ICa integrals (bottom) plotted against pulse duration for WT (n = 25) and CaBP4 −/− (n = 7) IHCs. F, grand average of ABR evoked by suprathreshold clicks (80 dB) in WT (black) and CaBP4−/− mice (grey). Roman numerals denominate the individual ABR peaks arising from the neurons of the ascending auditory pathway. G, ABR audiograms of WT (black) and CaBP4−/− mice (grey) obtained by tone burst and click stimulation.
Consistent with these findings, we found normal auditory brainstem responses (ABR) to click or short tone burst stimuli in CaBP4−/− mice. ABR waveforms (Fig. 4F), latencies (data not shown) and thresholds (Fig. 4G) were not different from WT mice. Distortion product otoacoustic emissions were also unaltered in CaBP4−/− mice, indicating intact cochlear amplification (data not shown). These findings confirm that CaBP4 is a relatively modest suppressor of Cav1.3 CDI in IHCs, but is not essential for normal IHC development and IHC function in auditory transduction.
CaBP1 is a candidate modulator of Cav1.3 CDI in IHCs
To explore alternative mechanisms for inhibiting CDI in IHCs, we assessed the expression other CaBP isoforms by immunohistochemistry in the mouse organ of Corti. In addition to that for CaBP4, immunolabelling for CaBP1, CaBP2 and CaBP5 was detected in IHCs (Fig. 5A–C). The specificity of the immunostaining was supported by the substantial reduction of signal upon preadsorption of the CaBP antibodies with the corresponding immunogen (Supplemental Fig. 1b). The expression of CaBP1, CaBP2 and CaBP4 in cochlear extracts was confirmed by RT-PCR analysis (Fig. 5D). However, CaBP5 was not detected by this method perhaps due to the low expression levels of CaBP5 relative to other CaBPs in IHCs. Interestingly, CaBP1 showed a punctate distribution at the base of IHCs from older mice (P28, data not shown, and 2 months old; Fig. 5E) in contrast to the diffuse localization of CaBP1 in IHCs from younger mice (P14; Fig. 5A). The CaBP1-labelled puncta strongly colocalized with labelling for CtBP2. These data suggested the likely colocalization of CaBP1 with presynaptic Cav1.3 channels, which show a similar subcellular distribution (Brandt et al. 2005). The presynaptic localization of CaBP1 was qualitatively similar in CaBP4−/− IHCs (Fig. 5E, lower panels). If CaBP1 more prominently suppressed CDI of Cav1.3 in IHCs, CaBP1/Cav1.3 interactions could explain the relatively normal auditory phenotype in CaBP4−/− mice.
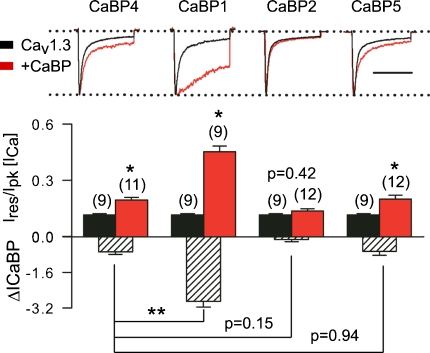
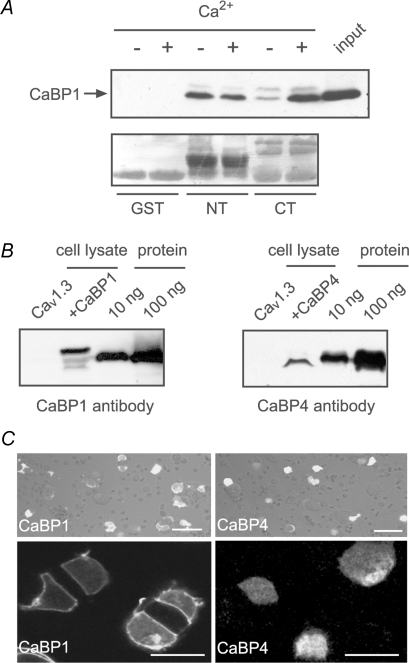
To test this, we compared the capacities of CaBP1, 2 and 5 as modulators of Cav1.3 CDI in transfected HEK293T cells. While CaBP5 had modest effects on CDI that were not significantly different from those of CaBP4 (P = 0.94), CaBP2 had no impact in this regard (Ires/Ipk= 0.14 ± 0.01 for + CaBP2 versus 0.12 ± 0.01 for Cav1.3 alone; P = 0.42; Fig. 6). However, CaBP1 caused a significantly stronger suppression of CDI than CaBP4 (P < 0.001; Fig. 6). Similar to CaBP4, CaBP1 interacted with the NT and CT of α11.3 in a Ca2+-independent manner in pull-down assays (Fig. 7A). Thus, while CaBP1 and CaBP4 may bind to the same sites in α11.3, they exhibit distinct modulatory strengths with respect to inactivation of ICa.
Figure 6. CaBP1 causes robust suppression of ICa inactivation compared to other CaBP variants.
Distinct effects of CaBP1, 2, 4 and 5 on inactivation of Cav1.3 in transfected HEK293T cells. Measurements of ICa, Ires/Ipk, and ΔICaBP were as in Fig. 3 for cells transfected with Cav1.3 (α11.3, β2a, α2δ) alone or cotransfected with CaBP1, 2, 4, or 5. *P < 0.02 compared to Cav1.3 alone by t test. **P < 0.001 compared to CaBP4 by ANOVA and post hoc t test. Number of cells indicated in parentheses.
Figure 7. CaBP1 binds to same sites in α11.3, but shows stronger expression levels and cell-surface targeting compared to CaBP4.
A, CaBP1 pull-down with GST-tagged CT or NT performed in the presence (+) or absence (−) of Ca2+ as in Fig. 1D. Results shown are representative of 3 experiments. B, Western blot of lysates from cells used for electrophysiological recording shows decreased levels of CaBP4 compared to CaBP1 in cells cotransfected with Cav1.3. Lanes 1 and 2 represent lysates of cells transfected with Cav1.3 alone (lane 1) or cotransfected with CaBP (lane 2). Lanes 3 and 4 contain purified GST-tagged CaBP1 (left panel) or His-tagged CaBP4 (right panel) at the indicated quantities. Western blotting was with CaBP1 or CaBP4 antibodies. Results shown are representative of 3 experiments. C, confocal micrographs of GFP-tagged CaBP1 or CaBP4 cotransfected with Cav1.3 as for electrophysiological experiments. Top panels show fluorescence images overlaying DIC image (scale bars, 50 μm). Higher magnification views in lower panels reveal GFP fluorescence restricted to the plasma membrane of cells cotransfected with GFP-CaBP1 (left) as compared to diffuse localization of GFP-CaBP4 (scale bars, 20 μm). Results shown are representative of 3 experiments.
Our electrophysiological results could also be explained by differences in the relative expression levels and/or transfection efficiency of CaBP1 and CaBP4. To address these possibilities, we performed Western blot analyses of lysates of cells transfected with Cav1.3 alone or cotransfected with CaBP1 or CaBP4. To control for differences in immunoblotting efficiencies of CaBP1 and CaBP4 antibodies, signals were qualitatively compared to those corresponding to known quantities of the purified proteins. With this approach, we consistently observed lower levels of CaBP4 than CaBP1 in transfected cell lysates (Fig. 7B). However, when GFP-tagged CaBP1 or CaBP4 constructs were cotransfected with Cav1.3 as for electrophysiological experiments, we did not find significantly weaker transfection efficiency of CaBP4 compared to CaBP1 (Fig. 7C upper panels). We did note that GFP-CaBP4 fluorescence was generally weaker and diffusely localized, in contrast to the strong localization of GFP-CaBP1 at the plasma membrane (Fig. 7C, lower panels). These results suggest that the weak effects of CaBP4 in modulating Cav1.3 could be influenced by limited cell-surface targeting and/or lower expression levels of CaBP4 compared to CaBP1 in transfected cells.
Differential modulation of Cav1.3 CDI by CaBP4 and CaBP1
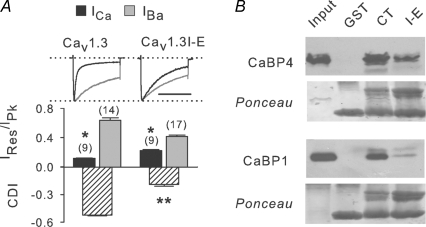
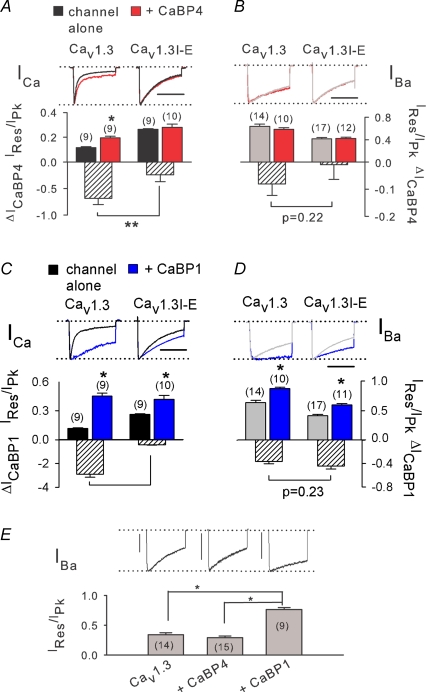
The distinct effects of CaBP1 and CaBP4 could also be mediated by separate molecular determinants for each in the NT or CT of α11.3. If so, then alterations in the NT or CT should differentially affect modulation by CaBP1 and CaBP4. To test this, we initially deleted portions of the NT from α11.3, since similar deletions in α11.2 abolished modulation of Cav1.2 by CaBP1 (Zhou et al. 2005). Small and large deletions of the α11.3 NT resulted in non-functional channels, which precluded functional analyses of this region. Therefore, we focused our efforts on the α11.3 CT and substituted the isoleucine with glutamate in the IQ domain in the CT, since similar mutations in α11.2 inhibit binding and modulation of Cav1.2 by CaBP1 (Zhou et al. 2004, 2005). Consistent with the essential role of the IQ domain in transducing CDI of Cav1 channels (Peterson et al. 1999; Zühlke et al. 1999; Qin et al. 1999), the I-E mutation disrupted, although not completely, CDI of Cav1.3 (Cav1.3I-E, Fig. 8A). In addition, GST-tagged CT fusion proteins containing the I-E mutation showed weaker binding to CaBP4 and CaBP1 in pull-down assays (Fig. 8B), which suggested that Cav1.3I-E would show limited regulation by these CaBPs. While Cav1.3I-E channels were completely insensitive to modulation by CaBP4 (Fig. 9A and B), there were residual effects of CaBP1 in that ICa inactivated ∼2 times less in cells transfected with Cav1.3I-E + CaBP1 than with Cav1.3 alone (P < 0.001; Fig. 9C).
Figure 8. Mutation of the IQ domain in α11.3 inhibits CDI and binding of CaBP1 and CaBP4.
A, effect of I-E mutation on CDI. HEK293T cells were transfected with wild-type Cav1.3 or channels containing α11.3 with I-E substitution in IQ domain (+β1b, α2δ). Same analysis as in Fig. 2A for CDI. *P < 0.001 compared to IBa; **P < 0.001 compared to Cav1.3; by t test. Number of cells indicated in parentheses. B, effect of I-E mutation on CaBP binding. Pull-down of CaBP1 or CaBP4 by GST, CT, or CT containing I-E mutation was performed as in Fig. 7A. Results shown are representative of 3 experiments.
Figure 9. I-E mutation in α11.3 blocks effects of CaBP4 but partially spares modulation by CaBP1.
A and B, loss of CaBP4 effects on inactivation of Cav1.3I-E. HEK293T cells were cotransfected with CaBP4 and Cav1.3 or Cav1.3I-E (α11.3 or α11.3I-E, β1b, α2δ). Same analysis as in Fig. 3 for inactivation of ICa (A) and IBa (B). By t test, *P < 0.02 compared to Cav1.3 alone; **P < 0.001 compared to Cav1.3. C and D, effects of CaBP1 on inactivation are partially spared in Cav1.3I-E. Cells were cotransfected with CaBP1 and Cav1.3 or Cav1.3I-E (α11.3 or α11.3I-E, β1b, α2δ). Same analysis as in C. *P < 0.01, **P < 0.0001 compared to Cav1.3, by t test. In A–D, scale bars, 200 ms. E, decreased VDI of IBa in cells cotransfected with CaBP1 but not CaBP1. IBa was evoked by 1 s pulses from −90 mV to −20 mV in cells transfected with Cav1.3 alone, +CaBP4, or +CaBP1. *P < 0.001 by ANOVA and post hoc Bonferroni test. Vertical scale bars, 0.2 nA. In A–E, number of cells is indicated in parentheses.
Unexpectedly, and in contrast to CaBP4, CaBP1 significantly inhibited voltage-dependent inactivation (VDI) exhibited by IBa (∼36% compared to Cav1.3 alone, P < 0.001). In these experiments, CaBP regulation of VDI was probed with channels containing the Cavβ1 subunit, which show more prominent VDI than those with Cavβ2 (compare Fig. 9B to Fig. 2A). The effect of CaBP1 on VDI was completely spared by the I-E mutation (P = 0.23 for Cav1.3 versus Cav1.3I-E; Fig. 9D). During longer depolarizations (1 s), the inhibitory effect of CaBP1 on VDI was particularly apparent. While CaBP4 had no effect on inactivation of IBa (Ires/Ipk= 0.29 ± 0.03 for Cav1.3 + CaBP4 versus 0.34 ± 0.03 for Cav1.3 alone; P = 0.86), CaBP1 caused IBa to inactivate significantly less than in cells transfected with Cav1.3 alone or cotransfected with CaBP4 (Fig. 9E). These data reveal distinct molecular mechanisms by which CaBP1 and CaBP4 regulate Cav1.3 inactivation: while required for effects of CaBP4 on ICa, the IQ domain is necessary but not sufficient for the full modulation of ICa and IBa by CaBP1.
Discussion
Our study provides new insights into the physiological roles of CaBPs as integral subunits and modulators of Cav channels. First, CaBPs are not equally effective modulators of CDI. Second, CaBP4 and CaBP1 differ in how they suppress inactivation of Cav1.3: CaBP4 moderately limits inactivation of ICa through interactions with the α11.3 IQ domain, while CaBP1 strongly inhibits inactivation of ICa and IBa through interactions with the IQ domain and some other region, perhaps the NT, of α11.3. Third, CaBP4 contributes to, but alone does not account for, the unusually slow inactivation of Cav1.3 ICa in IHCs. The dispensability of CaBP4 for auditory function most likely results from additional modulation of Cav1.3 by CaBP1 and potentially other CaBPs, which are localized with CaBP4 in IHCs. Differential modulation of Cav1.3 by CaBPs may endow IHCs with a diverse repertoire of Ca2+ signals that may fine-tune transmission of acoustic stimuli.
Our results extend but also differ from those of Yang et al. (2006), who found that CaBP4 and CaBP1 both abolished CDI of Cav1.3 channels in transfected HEK293 cells. We employed the long variant of α11.3 with exon 42, which contains an additional ∼500 amino acids downstream of the IQ domain compared to the shorter α11.3 variant with exon 42A (Xu & Lipscombe, 2001) used by Yang et al. However, we did not find significant differences in CaBP modulation of Cav1.3 containing these α11.3 variants (data not shown). The discrepancy may arise from the use of an inducible CaBP4 expression system in which high levels of Cav1.3 expression by transient transfection were achieved prior to induction of CaBP4 in the previous study. This method, and higher permeant ion concentrations (20 mmversus 10 mm in our study) during electrophysiological recordings, overcomes the inhibitory effects we have noted of CaBPs on Cav expression levels (Lee et al. 2002; Zhou et al. 2004). At the same time, this approach may also mask functional differences in CaBPs, which might prevail under non-saturating CaBP expression levels, such as in our experiments where Cav1.3 was transiently cotransfected with CaBP1 or CaBP4.
In transfected cells, the decreased plasma membrane targeting of CaBP4 compared to CaBP1 may limit the modulatory potential of CaBP4. Unlike CaBP4, CaBP1 is N-terminally myristoylated (Haeseleer et al. 2000), which may aid in its cell-surface targeting and coassembly with Cav1.3 channels. Lack of this modification may weaken CaBP4 interactions with functional Cav1.3 channels, which may negatively influence the stability and net expression levels of CaBP4 in cotransfected cells. While electrophysiological analysis with Cav1.3I-E mutants suggest fundamental distinctions in how CaBP1 and CaBP4 interact with Cav1.3 channels, we cannot rule out that differential expression/targeting of these CaBPs also contributes to their strengths as Cav1.3 modulators.
Regardless of how differences in CaBP4 and CaBP1 in IHCs influence their roles in Cav1.3 regulation, our results argue against CaBP4 as the primary regulator of Cav1.3 in IHCs. Mouse IHCs lacking CaBP4 showed only a minor increase in CDI, indicating that CaBP4 is not essential for, but may contribute to, the peculiar slow CDI of Cav1.3 channels in IHCs. This may reflect the relatively weak effects of CaBP4 as a Cav1 modulator and/or limited presynaptic targeting/expression levels compared to other CaBPs. The dispensability of CaBP4 for hair cell sound coding is further demonstrated by the normal auditory brainstem responses in mice lacking CaBP4. The auditory physiology of CaBP4−/− mice was conducted at an age when CaBP1 is strongly localized presynaptically both in WT and CaBP4−/− IHCs. The less intense immunolabelling of CaBP1 in adult IHCs may have been missed by Yang et al. leading to their conclusion that CaBP4 was the critical modulator of Cav1.3 function at later ages (Yang et al. 2006). The use of cryosections in the previous study may have impaired detection of punctate labelling in adult IHCs, since only a few puncta might be visible in a single IHC with this method. In our experiments, presynaptic labelling was readily apparent in an entire row of IHCs in projections of confocal micrographs. Why CaBP1 exhibits a diffuse localization in P14 IHCs and becomes presynaptically clustered at later ages is not clear, but clearly allows CaBP1 to be well-situated to modulate Cav1.3 channels.
We also note that in transfected cells, CaBP1 not only strongly suppresses CDI (inactivation of ICa) but also inhibits VDI (inactivation of IBa), which was not seen with CaBP4 (Fig. 9). This latter point is relevant since Cav1.3 currents in IHCs show dramatically slower CDI and VDI than in recombinant systems (Platzer et al. 2000; Koschak et al., 2001). The fact that cotransfection of Cav1.3 with CaBP1 fully reproduces the native properties of Cav1.3 channels further implicates CaBP1 as a modulator of Cav1.3 in IHCs, which may support the crucial roles of Cav1.3 channels in hearing.
Acknowledgments
This work was supported by grants from the NIH (NS044922 to A.L., DC008417 to I.C.J., EY014561 to F.H.); the Deafness Research Foundation (to I.C.J. and A.L.); the DFG (Center for Molecular Physiology of the Brain), the HFSP (RGY0019), the BMBF (Bernstein Center for Computational Neuroscience Goettingen) and the EC (Eurohear) to T.M. We would like to thank C. Ruediger, M. Koeppler and A. Gonzalez (Moser Laboratory) for excellent technical assistance, G. Géléoc (U. Virginia) for advice on processing cochlear tissue, and F. Gregory (Lee Laboratory) for comments on the manuscript.
Supplemental material
Online supplemental material for this paper can be accessed at: http://jp.physoc.org/cgi/content/full/jphysiol.2007.142307/DC1 and http://www.blackwell-synergy.com/doi/suppl/10.1113/jphysiol.2007.142307
References
- Brandt A, Khimich D, Moser T. Few CaV1.3 channels regulate the exocytosis of a synaptic vesicle at the hair cell ribbon synapse. J Neurosci. 2005;25:11577–11585. doi: 10.1523/JNEUROSCI.3411-05.2005. [DOI] [PMC free article] [PubMed] [Google Scholar]
- Brandt A, Striessnig J, Moser T. CaV1.3 channels are essential for development and presynaptic activity of cochlear inner hair cells. J Neurosci. 2003;23:10832–10840. doi: 10.1523/JNEUROSCI.23-34-10832.2003. [DOI] [PMC free article] [PubMed] [Google Scholar]
- Calin-Jageman I, Yu K, Hall RA, Mei L, Lee A. Erbin enhances voltage-dependent facilitation of Cav1.3 Ca2+ channels through relief of an autoinhibitory domain in the Cav1.3 α1 subunit. J Neurosci. 2007;27:1374–1385. doi: 10.1523/JNEUROSCI.5191-06.2007. [DOI] [PMC free article] [PubMed] [Google Scholar]
- Dou H, Vazquez AE, Namkung Y, Chu H, Cardell EL, Nie L, Parson S, Shin HS, Yamoah EN. Null mutation of α1D Ca2+ channel gene results in deafness but no vestibular defect in mice. J Assoc Res Otolaryngol. 2004;5:215–226. doi: 10.1007/s10162-003-4020-3. [DOI] [PMC free article] [PubMed] [Google Scholar]
- Haeseleer F, Imanishi Y, Maeda T, Possin DE, Maeda A, Lee A, Rieke F, Palczewski K. Essential role of Ca2+-binding protein 4, a Cav1.4 channel regulator, in photoreceptor synaptic function. Nat Neurosci. 2004;7:1079–1087. doi: 10.1038/nn1320. [DOI] [PMC free article] [PubMed] [Google Scholar]
- Haeseleer F, Sokal I, Verlinde CL, Erdjument-Bromage H, Tempst P, Pronin AN, Benovic JL, Fariss RN, Palczewski K. Five members of a novel Ca2+-binding protein (CABP) subfamily with similarity to calmodulin. J Biol Chem. 2000;275:1247–12460. doi: 10.1074/jbc.275.2.1247. [DOI] [PMC free article] [PubMed] [Google Scholar]
- Ivanina T, Blumenstein Y, Shistik E, Barzilai R, Dascal N. Modulation of L-type Ca2+ channels by Gβγ and calmodulin via interactions with N and C termini of α1C. J Biol Chem. 2000;275:39846–39854. doi: 10.1074/jbc.M005881200. [DOI] [PubMed] [Google Scholar]
- Khimich D, Nouvian R, Pujol R, Tom Dieck S, Egner A, Gundelfinger ED, Moser T. Hair cell synaptic ribbons are essential for synchronous auditory signalling. Nature. 2005;434:889–894. doi: 10.1038/nature03418. [DOI] [PubMed] [Google Scholar]
- Koschak A, Reimer D, Huber I, Grabner M, Glossmann H, Engel J, Striessnig J. α1D (Cav1.3) subunits can form L-type Ca2+ channels activating at negative voltages. J Biol Chem. 2001;276:22100–22106. doi: 10.1074/jbc.M101469200. [DOI] [PubMed] [Google Scholar]
- Kreiner L, Lee A. Endogenous and exogenous Ca2+ buffers differentially modulate Ca2+-dependent inactivation of Cav2.1 Ca2+ channels. J Biol Chem. 2006;281:4691–4698. doi: 10.1074/jbc.M511971200. [DOI] [PubMed] [Google Scholar]
- Lee A, Scheuer T, Catterall WA. Ca2+/calmodulin-dependent facilitation and inactivation of P/Q-type Ca2+ channels. J Neurosci. 2000;20:6830–6838. doi: 10.1523/JNEUROSCI.20-18-06830.2000. [DOI] [PMC free article] [PubMed] [Google Scholar]
- Lee A, Westenbroek RE, Haeseleer F, Palczewski K, Scheuer T, Catterall WA. Differential modulation of Cav2.1 channels by calmodulin and Ca2+-binding protein 1. Nat Neurosci. 2002;5:210–217. doi: 10.1038/nn805. [DOI] [PMC free article] [PubMed] [Google Scholar]
- Marcotti W, Johnson SL, Rusch A, Kros CJ. Sodium and calcium currents shape action potentials in immature mouse inner hair cells. J Physiol. 2003;552:743–761. doi: 10.1113/jphysiol.2003.043612. [DOI] [PMC free article] [PubMed] [Google Scholar]
- Moser T, Beutner D. Kinetics of exocytosis and endocytosis at the cochlear inner hair cell afferent synapse of the mouse. Proc Natl Acad Sci U S A. 2000;97:883–888. doi: 10.1073/pnas.97.2.883. [DOI] [PMC free article] [PubMed] [Google Scholar]
- Neely A, Olcese R, Wei X, Birnbaumer L, Stefani E. Ca2+-dependent inactivation of a cloned cardiac Ca2+ channel α1 subunit (α1C) expressed in Xenopus oocytes. Biophys J. 1994;66:1895–1903. doi: 10.1016/S0006-3495(94)80983-X. [DOI] [PMC free article] [PubMed] [Google Scholar]
- Peterson BZ, DeMaria CD, Adelman JP, Yue DT. Calmodulin is the Ca2+ sensor for Ca2+-dependent inactivation of L-type calcium channels. Neuron. 1999;22:549–558. doi: 10.1016/s0896-6273(00)80709-6. [DOI] [PubMed] [Google Scholar]
- Platzer J, Engel J, Schrott-Fischer A, Stephan K, Bova S, Chen H, Zheng H, Striessnig J. Congenital deafness and sinoatrial node dysfunction in mice lacking class D L-type Ca2+ channels. Cell. 2000;102:89–97. doi: 10.1016/s0092-8674(00)00013-1. [DOI] [PubMed] [Google Scholar]
- Qin N, Olcese R, Bransby M, Lin T, Birnbaumer L. Ca2+-induced inhibition of the cardiac Ca2+ channel depends on calmodulin. Proc Natl Acad Sci U S A. 1999;96:2435–2438. doi: 10.1073/pnas.96.5.2435. [DOI] [PMC free article] [PubMed] [Google Scholar]
- Sendin G, Bulankina AV, Riedel D, Moser T. Maturation of ribbon synapses in hair cells is driven by thyroid hormone. J Neurosci. 2007;27:3163–3173. doi: 10.1523/JNEUROSCI.3974-06.2007. [DOI] [PMC free article] [PubMed] [Google Scholar]
- Shen Y, Yu D, Hiel H, Liao P, Yue DT, Fuchs PA, Soong TW. Alternative splicing of the Cav1.3 channel IQ domain, a molecular switch for Ca2+-dependent inactivation within auditory hair cells. J Neurosci. 2006;26:10690–10699. doi: 10.1523/JNEUROSCI.2093-06.2006. [DOI] [PMC free article] [PubMed] [Google Scholar]
- Soong TW, DeMaria CD, Alvania RS, Zweifel LS, Liang MC, Mittman S, Agnew WS, Yue DT. Systematic identification of splice variants in human P/Q-type channel α12.1 subunits: implications for current density and Ca2+-dependent inactivation. J Neurosci. 2002;22:10142–10152. doi: 10.1523/JNEUROSCI.22-23-10142.2002. [DOI] [PMC free article] [PubMed] [Google Scholar]
- Xu W, Lipscombe D. Neuronal CaV1.3α1 L-type channels activate at relatively hyperpolarized membrane potentials and are incompletely inhibited by dihydropyridines. J Neurosci. 2001;21:5944–5951. doi: 10.1523/JNEUROSCI.21-16-05944.2001. [DOI] [PMC free article] [PubMed] [Google Scholar]
- Yang PS, Alseikhan BA, Hiel H, Grant L, Mori MX, Yang W, Fuchs PA, Yue DT. Switching of Ca2+-dependent inactivation of Cav1.3 channels by calcium binding proteins of auditory hair cells. J Neurosci. 2006;26:10677–10689. doi: 10.1523/JNEUROSCI.3236-06.2006. [DOI] [PMC free article] [PubMed] [Google Scholar]
- Zhou H, Kim SA, Kirk EA, Tippens AL, Sun H, Haeseleer F, Lee A. Ca2+-binding protein-1 facilitates and forms a postsynaptic complex with Cav1.2 (L-type) Ca2+ channels. J Neurosci. 2004;24:4698–4708. doi: 10.1523/JNEUROSCI.5523-03.2004. [DOI] [PMC free article] [PubMed] [Google Scholar]
- Zhou H, Yu K, McCoy KL, Lee A. Molecular mechanism for divergent regulation of Cav1.2 Ca2+ channels by calmodulin and Ca2+-binding protein-1. J Biol Chem. 2005;280:29612–29619. doi: 10.1074/jbc.M504167200. [DOI] [PubMed] [Google Scholar]
- Zühlke RD, Pitt GS, Deisseroth K, Tsien RW, Reuter H. Calmodulin supports both inactivation and facilitation of L-type calcium channels. Nature. 1999;399:159–162. doi: 10.1038/20200. [DOI] [PubMed] [Google Scholar]
Associated Data
This section collects any data citations, data availability statements, or supplementary materials included in this article.


