Abstract
Neuronal activity is tightly coupled with brain energy metabolism. Numerous studies have suggested that lactate is equally important as an energy substrate for neurons as glucose. Lactate production is reportedly triggered by glutamate uptake, and independent of glutamate receptor activation. Here we show that climbing fibre stimulation of cerebellar Purkinje cells increased extracellular lactate by 30% within 30 s of stimulation, but not for briefer stimulation periods. To explore whether lactate production was controlled by pre- or postsynaptic events we silenced AMPA receptors with CNQX. This blocked all evoked rises in postsynaptic activity, blood flow, and glucose and oxygen consumption. CNQX also abolished rises in lactate concomitantly with marked reduction in postsynaptic currents. Rises in lactate were unaffected by inhibition of glycogen phosphorylase, suggesting that lactate production was independent of glycogen breakdown. Stimulated lactate production in cerebellum is derived directly from glucose uptake, and coupled to neuronal activity via AMPA receptor activation.
Local increases in neuronal activity are accompanied by non-oxidative glucose consumption as indicated by rises in glucose consumption that are in excess of oxygen use (Fox & Raichle, 1986). This idea has been supported by observations of activity-dependent rises in lactate in cerebral grey matter during activation under some (Fellows et al. 1993; Hu & Wilson, 1997; Mangia et al. 2007), but not all conditions (Ueki et al. 1988). Glutamate uptake into astrocytes stimulates lactate production in vitro independent of AMPA receptor blockade (Pellerin & Magistretti, 1994), and whole brain studies in rodents have revealed a stochiometric coupling between glutamate cycling and glucose turnover rates (Sibson et al. 1998). This has led to the hypothesis that astrocytes feed neurons with lactate and that this mechanism controls the energy metabolism of neurons (Magistretti et al. 1999). The lactate-shuttling hypothesis implies lactate release via specific monocarboxylic transporters in astrocytes and uptake via similarly specific transporters in the postsynaptic neuronal plasma membrane (Bergersen et al. 2001, 2005). This model of a control mechanism for brain energy metabolism emphasizes glutamate uptake – a process that controls the time course of glutamate in the synapse – as a key element. This idea is supported by the observation that glucose utilization induced by activation of the whisker-to-barrel pathway is decreased in the somatosensory cortex of Postnatal 10 mutant mice deficient in glial glutamate transporters (Voutsinos-Porche et al. 2003).
In comparison, activity-dependent rises in blood flow and oxygen metabolism in the rat cerebellum, olfactory cortex and sensory cortex are dependent on preserved activity of neuronal postsynaptic glutamate AMPA or NMDA receptors (Akgoren et al. 1994; Iadecola et al. 1996; Mathiesen et al. 1998; Matsuura & Kanno, 2001; Nielsen & Lauritzen, 2001; Sheth et al. 2004; Hoffmeyer et al. 2007; Devor et al. 2007; Chaigneau et al. 2007), and metabotropic glutamate receptors on astrocytes may contribute to the vascular response via Ca2+-dependent mechanisms in vivo (Takano et al. 2006). This has led to the hypothesis that local, activity-dependent rises in blood flow in most networks depend on interaction of glutamate with its postsynaptic receptors (Lauritzen, 2005). Therefore, postsynaptic mechanisms may control the supply of glucose to the brain during activation, which is important since glucose is the only blood-borne energy substrate used by the brain in the normal state (Pellerin & Magistretti, 2004). The objective of this study was to test the hypothesis that lactate produced and consumed by increases in synaptic activity at the climbing fibre–Purkinje cell synapse was related to activity at the level of the AMPA glutamate receptors. The results indicated that lactate produced by activation of the climbing fibre–Purkinje cell synapse depended on activation of AMPA receptors and subsequent processes they activate, including action potentials in Purkinje cells. This suggests that blood flow, substrate supply, lactate production and oxygen metabolism in this neuronal circuit are controlled by postsynaptic mechanisms. Our data could not confirm that astrocytic glutamate uptake is the sole mechanism providing lactate for neurons in vivo.
Methods
Animal preparation
This study was performed in full compliance with the guidelines of the European Council's Convention for the Protection of Vertebrate Animals Used for Experimental and Other Scientific Purposes and was approved by the Danish National Ethics Committee. Experiments were performed in 28 male Wistar rats (250–350 g). Anaesthesia was induced with isoflurane (5.0% induction, 1.5% during surgery). After surgery, anaesthesia was switched to intravenous α-chloralose (45 mg kg−1 h−1) for at least 1 h before data acquisition. Extra supplements of α-chloralose were given upon pilo-erection, increased blood pressure (> 10%) or positive corneal reflex. The trachea was cannulated for mechanical ventilation (30% O2–70% N2O during surgery; oxygen-enriched air thereafter). Catheters were placed into the left femoral artery and vein and perfused with physiological saline. Continuous monitoring of arterial blood pressure and hourly blood samples of arterial pH, and PCO2 assured maintenance of basic physiological parameters. The head was fixed in a stereotaxic frame and an open cranial window preparation over the vermis region was made as previously described (Caesar et al. 2003). At the end of the experiment, rats were killed by an intravenous injection of air.
Electrophysiological recordings
We used single-barrelled glass microelectrodes filled with 2 m saline (impedance, 2–3 MΩ; tip, 2 μm). Local field potentials (LFP) of Purkinje cells were recorded at a digital sampling rate of 5 kHz with a single glass microelectrode at a depth of 300–600 μm in the cerebellar cortex of vermis segments 5 or 6. An Ag–AgCl ground electrode was placed in the neck muscle. The pre-amplified (×10) signal was A/d converted, amplified and filtered (spikes: 300–2400 Hz bandwidth; LFP: 1–1000 Hz bandwidth), and digitally sampled using the 1401plus interface (Cambridge Electronic Design (CED), Cambridge, UK) connected to a PC running the Spike 2.5 software (CED). LFPs were averaged and amplitudes were calculated as the difference between peak and baseline, defined as the mean of the 15 ms before stimulation onset.
Climbing fibre stimulation
A coated, bipolar stainless-steel electrode (SNEX 200, RMI, Woodland Hills, CA, USA; 0.25 mm contact separation) was stereotaxically lowered into the caudal part of the inferior olive as previously described (Caesar et al. 2003). Positioning was optimized by means of the maximal response of LFP in the cerebellar vermis region to continuous low-frequency stimulation (0.5 Hz). Pulses of 200 μs constant current with an intensity of 0.15 mA (ISO-flex, A.M.P.I., Israel) were used. Control stimulation trains at 5, 7.5 and 10 Hz for 15 s were given to test the reactivity of the brain (and ensure reproducible responses).
Cerebellar cortical blood flow (CBF) measurement
CBF was recorded continuously using a LDF probe at fixed position ∼0.3 mm above the pial surface in a region devoid of large vessels (780 nm wavelength, 250 μm fibre separation; PeriMed, Järfälla, Sweden). The probe, measuring CBF changes down to a depth of 1000 μm2, was placed as close as possible to the micro- and oxygen electrode. The LDF signal was smoothed with a time constant of 0.2 s (PeriFlux 4001 Master, PeriMed), sampled with 10 Hz, A/D converted and digitally recorded using Spike 2.5 software (CED).
Tissue PO2 measurements
PO2 was recorded with a modified Clark-type polarographic oxygen microelectrode (OX-10, Unisense A/S, Aarhus, Denmark). The small tip size (3–5 μm in this study) assured reliable tissue PO2 measurements and its built-in guard cathode removed all oxygen from the electrolyte reservoir (Revsbech, 1989). Calibration of each electrode was performed in air-saturated and oxygen-free saline (0.9% at 37°C) before and after each experiment with reproducible oxygen measurements. The oxygen electrodes were connected to a high impedance pico-ampermeter (PA 2000, Unisense A/S) sensing the currents of the oxygen electrodes. Signals were A/D converted and recorded at 100 Hz (Power 1401 and Spike 2.5 (CED)). Offline filtering using a low-pass filter of 0.3 Hz was used to remove noise induced by heartbeat and mechanical ventilation (Masamoto et al. 2003).
Determination of local cerebral glucose utilization by the [14C]-2DG method
The stimulation protocol was adjusted in these experiments to give a continuous stimulation at 5 Hz for 50 min, starting at 5 min prior to the i.v. injection of the [14C]-2-deoxyglucose (2DG) to ensure a steady state with respect to CBF and LFP response amplitudes. Thus, under these conditions, changes in the 2DG autoradiogram could be interpreted in terms of changes in metabolism. The following groups were examined: (1) animals in which climbing fibres were stimulated at 5 Hz for more than 50 min; (2) sham group in which no stimulation was applied (except for control stimulations before injection of isotope); (3) animals in which stimulation was given and CNQX was applied topically for 30 min before injection of isotope to examine the effect of blockade of this glutamate receptor for glucose consumption; (4) CNQX sham group in which the CNQX procedure from protocol 3 was followed but no stimulation was given during the 2DG injection.
Glucose use was determined by the quantitative [14C]-2DG method. The measurement was initiated by intravenous infusion of 0.9 ml of a solution containing 125 μCi (kg body weight)−1 of 2DG (55 mCi mmol−1, PerkinElmer) for a period of 60 s. During the subsequent 45 min, 20–25 timed arterial blood samples (15–30 μl) were collected. Blood samples were immediately centrifuged for the determination of the glycaemia and the [14C] radioactivity. At the end of the experimental period the rat was killed, and the brain was removed and frozen in isopentane at −40°C. The frozen brains were stored at −80°C until cut into 20-μm-thick coronal sections in a cryostat maintained at −20°C. The sections were thaw-mounted on glass coverslips, immediately dried on a hot plate at about 60°C, and exposed onto an autoradiographic film (Kodak BioMax MR, Kodak, Rochester, NY, USA) for 7 days, with calibrated [14C]-standards (146C, American Radiochemical Company, St Louis, MO, USA). The same brain sections were then stained with cresyl violet. Autoradiograms were digitized and analysed using a computer-based image analysis system (MCID Analysis, St Catharines, Ontario, Canada). Optical densities determined on the autoradiograms were calibrated using the co-exposed densitometric microscales and converted to nCi g−1 of tissue and then to glucose consumption values using the modified operational equation of Sokoloff (Sokoloff, 1979).
Microdialysis
A microdialysis probe (MAB 4.15.1, Microbiotech AB, Stockholm; diameter, 0.18 mm, 1 mm membrane length) was stereotaxically lowered slowly into the cerebellar cortex to a depth of approximately 1 mm, placing the molecular layer in the middle of the membrane. It was perfused at 1 μl min−1 with ACSF (146 mm NaCl, 2.7 mm KCl, 1.2 mm CaCl2, 1.0 mm MgCl2, filtered using 25 nm pore membrane, Anopore, Whatman). In the protocol described below, each of the stimulation trains was followed by a recovery period of 30 min. The resulting dialysate was monitored with the on-line analyser for glucose and lactate via a 10 cm length of low volume connection tube (Parkin et al. 2005). The microdialysis probe was allowed to stabilize for 1 h before data acquisition. The stimulation was synchronized with the sampling. All values are reported as microdialysis levels as these should not be corrected to tissue values using in vitro recovery data (Parkin et al. 2003). In fact, the combination of small probe diameter and membrane length gives a low extraction fraction in vitro. In vitro values were used to correct for the lag time between dialysate leaving the probe and appearing as an analysis peak.
Three different animal groups were examined: (1) Control group in which climbing fibres were stimulated at 5 Hz in trains lasting for 20 min. Each animal received three to four stimulations, separated by 30 min intervals. (2) A group in which glutamate receptors were blocked by CNQX, which was topically applied (after control stimulations) for 35 min before stimulation again (20 min, 5 Hz) up to three times. The wash-out period of the drug from the tissue was approximately 2 h. (3) A group in which glycogen phosphorylase was inhibited with DAB. Control stimulations were followed by topical application of DAB (300 μm). After 1.5 h, the cerebellum was stimulated again (20 min, 5 Hz) up to three times.
Calculation of the cerebral metabolic rate of oxygen (CMRO2)
To evaluate the effect of stimulation on spontaneous tissue oxygen partial pressure (tPO2) and CBF, the traces were divided into the following time periods: Baseline was taken as the 60 s immediately preceding stimulation while calculations during stimulation were divided into bins of 60 s duration, and for each rat, the time, CBF and tPO2 for each interval were averaged across rats (Figs 2A and 4A), and normalized to their respective baselines. Oxygen consumption (CMRO2) was calculated from CBF and tPO2 measurements as described by Gjedde (Gjedde et al. 2005). The relationship between the three variables is
where P50 is the half-saturation tension of the oxygen–haemoglobin dissociation curve, H the Hill coefficient of the same dissociation curve, Ca the arterial oxygen concentration, and L the effective diffusion coefficient of oxygen in brain tissue. The value of L was determined from baseline values of rats in similar conditions of anaesthesia in which CBF and CMRO2 were reported in the literature to be 53 ml (100 g)−1 min−1 and 219 μmol (100 g)−1 min−1 (Zhu et al. 2002). The corresponding value of L was 5.45 μmol (100 g)−1 min−1 mmHg−1 for standard values of P50 (36 mmHg), H (2.7) and Ca (8 μmol ml−1). These values were subsequently used to calculate CMRO2 for each time interval using the corresponding values of tPO2 in mmHg and CBF, scaled proportionately to CBF baseline.
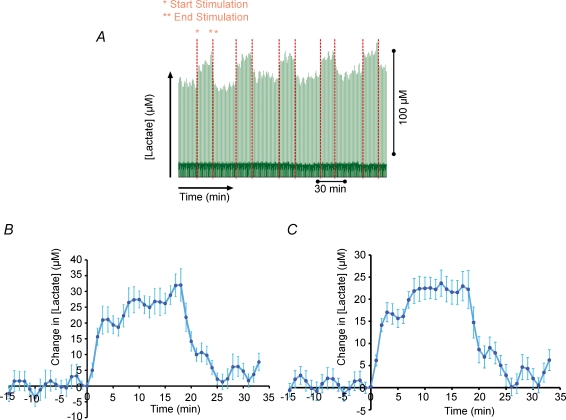
Figure 2. Climbing fibre stimulation evokes extracellular lactate increases in cerebellar cortex.
A, raw data displaying lactate responses as result of stimulation. The trace is compressed 3 h time window displaying lactate current peaks at every 30 s. The start and end of the stimulations are denoted by red dotted lines. B, average lactate response signature to 5 Hz climbing fibre stimulation. Readings are averaged lactate readings adjusted and zeroed for time and concentration for ∼20 min (n = 7 in 1 animal). C, averaged lactate response signature to 5 Hz climbing fibre stimulation. Averaged stimulations (n = 16 in 5 animals) for ∼20 min. Values are mean ±s.e.m. of raw lactate readings zeroed for start time of stimulation and pre-stimulus lactate concentration.
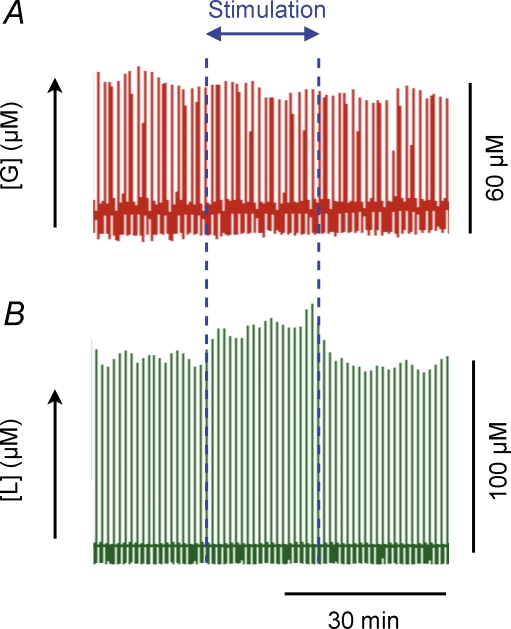
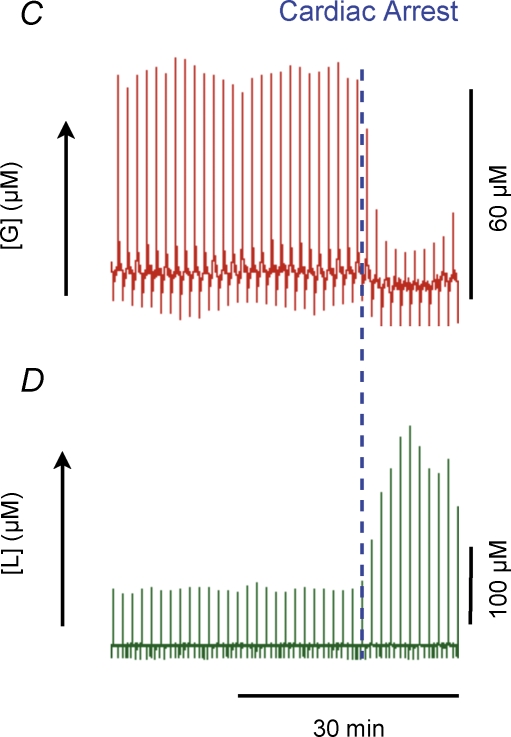
Figure 4. Extracellular glucose is clamped during stimulation, but decreases rapidly during cardiac arrest.
Raw data showing lactate and glucose responses to climbing fibre stimulation and cardiac arrest. Traces represent a compressed 1 h time window displaying glucose and lactate current peaks at every 30 s. The start and end of the stimulations are denoted by the blue dotted lines in A and B. During stimulation extracellular glucose remained constant (A), while extracellular lactate increased (B). Cardiac arrest was induced immediately and also dramatic decreases in extracellular glucose (C) simultaneously with large rises in extracellular lactate (D). This demonstrates the ability of our system to record dynamic glucose changes. Onset of cardiac arrest is indicated by the blue dotted line in C and D.
Drug application
6-Cyano-7-nitroquinoxaline-2,3-dione (CNQX), a non-specific antagonist of AMPA ionotropic glutamate receptors, was dissolved in artificial CSF at a concentration of 1 mm and topically applied to the vermis region. In separate experiments, 1,4-dideoxy-1,4-amino-d-arabinitol (DAB), an inhibitor of glycogen phosphorylase, was applied topically at a concentration of 300 μm (Andersen et al. 1999; Oikonomakos et al. 2006).
Statistics
Statistical analysis of the effect of bicuculline on tPO2, CBF and CMRO2 were performed using 2- and 3-way ANOVA with levels of significance determined by Friedman ANOVA on repeated measurements. Paired t tests were used to analyse effects on LFP and lactate levels. LFP amplitudes and areas were log-transformed to ensure normal distribution of data and are therefore given as means and 95% confidence intervals (CI). Values are expressed as means ±s.e.m. Changes were considered statistically significant at P < 0.05.
Results
Cerebellar blood flow and metabolism are coupled during activity
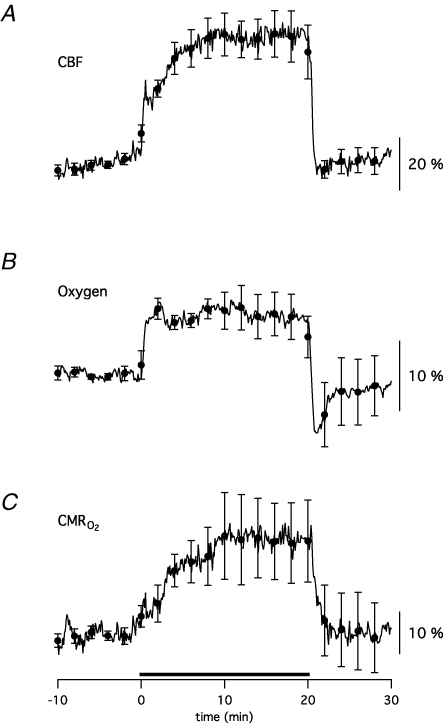
Stimulation of cerebellar climbing fibres (CF) via electrical stimulation of the inferior olive (in the following text denoted climbing fibre stimulation) caused widespread increases in neuronal and metabolic activity in the cerebellar cortex. Electrophysiological recordings of LFPs were combined with simultaneous recordings of cerebral blood flow (CBF) and tissue oxygen partial pressure (tPO2) in response to CF stimulation at 5 Hz in order to trace the evoked activity. Figure 1 depicts averaged traces of CBF, tPO2 and CMRO2, reaching new steady-state values after 5–10 min of stimulation, i.e. during the time of recording of extracellular lactate and glucose, and glucose use by the 2-deoxyglucose (2DG) method. The LFP amplitude remained stable during long-term stimulation (data not shown), indicating a constant synaptic input in the climbing fibre–Purkinje cell system during data collection. The averaged evoked rises for six animals were 46.7 ± 5.9% and 6.1 ± 0.5% for CBF and tPO2, respectively, and 33.4 ± 8.4% for CMRO2.
Figure 1. Synaptic activity, substrate supply and metabolism are coupled during cerebellar climbing fibre stimulation.
The figure shows averaged data sets from 6 animals taken during 20 min climbing fibre stimulation at 5 Hz. The figure displays transient, simultaneous changes in CBF (A), tPO2 (B) and CMRO2 (C). CMRO2 values were calculated on the basis of CBF and tPO2 traces as previously described (Gjedde et al. 2005). All parameters reached a plateau ∼5 min after onset of stimulation and remained elevated until the end of stimulation. After the end of stimulation, tPO2 exhibited a profound undershoot before returning to baseline. Taken together, prolonged stimulation induced a new steady-state condition in the cerebellar cortex with respect to CBF, tPO2 and CMRO2.
Extracellular lactate levels increase by climbing fibre stimulation
The basal level of dialysate lactate from the cerebellum was 112.3 ± 13.15 μm (n = 9). Long-term stimulations induced a profound and reproducible increase in lactate amounting to 32.2 ± 4.0 μm. Figure 2A depicts a raw trace of extracellular lactate recorded over ∼4 h including five long-term stimulations at 5 Hz for 20 min. An average of seven consecutive lactate responses from the same animal (Fig. 2B) demonstrated a steep rise in lactate of 21.1 ± 4.0 μm within the first 60 s of stimulation, followed by a slow continuous increase for the rest of the stimulation period. After stimulus cessation the lactate level returned to normal with a slope similar to the initial rise. Figure 2C depicts the average of 16 separate stimulation traces of lactate originating from five different animals. The lactate response occurred with a similar profile as CBF and CMRO2. The latter is noteworthy, as it indicates an association between lactate production and consumption as seen in the dialysate levels and the rate as oxygen utilization. Concordant with the averaged trace from Fig. 2B, the trace exhibits a steep initial rise of 16.5 ± 2.3 μm and a secondary less steep increase of around 11.1 μm. At the end of the stimulation, the lactate response settles a little above baseline.
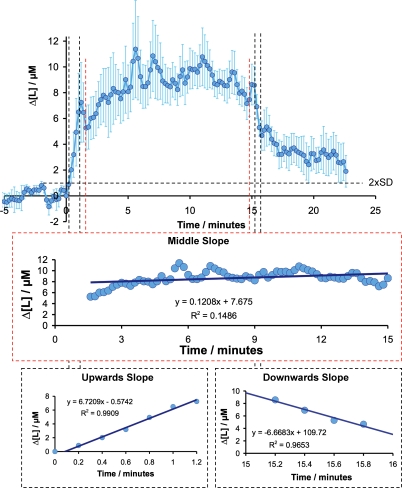
One set of experiments (n = 10 in 3 animals) was performed at a particularly high time resolution in order to calculate the rate of change in the lactate response. An average of these responses is depicted in Fig. 3. The initial lactate rise is linear and exhibits a slope of 6.72 ± 0.32 μm min−1 for 72 s, which implies that an initial production of lactate happens at minimum at that rate. After this, lactate continues to increase at a rate of 0.12 ± 0.46 μm min−1 until the end of the stimulation (at 15 min) where it initially drops linearly at a rate of −6.66 ± 0.89 μm mol−1, and subsequently tails off back to baseline.
Figure 3. Supply and consumption of lactate are coupled during prolonged stimulation.
High time resolution of lactate responses at 5 Hz climbing fibre stimulation. Measurements were at 12 s intervals. Values are mean ±s.e.m. (n = 10 in 3 animals) of raw lactate readings zeroed for start time of stimulation and pre-stimulus lactate concentration. The three lines of best fit were calculated using linear regression of the time periods indicated using Microsoft Excel. Upwards slope was 6.72 ± 0.32 μmol min−1 (F = 3.45 × 10⁻⁶), middle slope was 0.1209 ± 0.46 μmol min−1 (F = 0.0069), downward slope was 6.66 ± 0.89 μmol min−1 (F = 0.0175). This particular set of experiments yielded a slightly lower lactate transient than the averaged response. Also, due to the nature of sampling at high time resolution, responses were noisier, and this is reflected in the larger error bars in comparison to the averaged lactate trace shown in Fig. 2D. Dashed line indicates 2 ×s.d. of 5 min baseline period.
Extracellular levels of glucose are constant during stimulation, but decrease rapidly at circulatory arrest
The simultaneous registration of electrophysiological variables, CBF and tPO2 were combined with measurements of extracellular lactate and glucose levels on a real time basis, to establish the energy source in the cerebellar cortex during increased metabolic activity. The basal level of cerebellum dialysate glucose was 67.4 ± 6.43 μm (n = 12). We found no discernible change in glucose in response to any climbing fibre stimulation. Figure 4A and B depict raw traces of glucose and lactate, respectively, in response to 20 min of climbing fibre stimulation. The small fluctuations in the glucose level throughout the ∼1 h depicted in the figure are accounted for by flow variations in the analysis system. However, a change in glucose was observed after cardiac arrest as shown in Fig. 4C. Following cardiac arrest, glucose dropped to almost zero, whereas lactate levels increased by ∼200% (Fig. 4D).
Glucose use increases during long-lasting climbing fibre stimulation
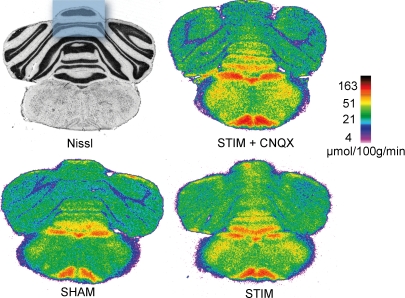
We next measured the metabolic demand posed by the sustained synaptic input to Purkinje cells during prolonged climbing fibre stimulation. Electrophysiological parameters as well as CBF were simultaneously recorded in all animals to verify the efficacy of climbing fibres stimulation. Glucose use was measured using the quantitative [14C]-2DG method in different regions of the cerebellum and in particular in the superior part of the cerebellar cortex, the region sampled by the CBF and microdialysis probes (Fig. 5). Activation of climbing fibres for 50 min at 5 Hz induced a significant increase in glucose use in a restricted area of the cerebellar cortex compared to the sham control group (24.8 ± 4.3 μmol (100 g)−1 min−1, n = 6, versus 20.0 ± 1.2 μmol (100 g)−1 min−1, n = 5, +24%, P < 0.05, ANOVA and Student–Newman–Keuls test, see Fig. 5). The increase in glucose use was abolished by the AMPA receptor antagonist CNQX (19.5 ± 3.8 μmol (100 g)−1 min−1, n = 6), while CNQX alone had no effect on baseline glucose use (18.0 ± 1.0 μmol (100 g)−1 min−1, n = 3).
Figure 5. Activity-dependent rises in glucose use are blocked by AMPA receptor antagonists.
Compared to the SHAM non-stimulated brain, climbing fibre stimulation (STIM) evoked modest but significant increases in glucose use, as measured by the 2DG method, in particular in the superior part of the cerebellar cortex, the region sampled by the CBF and microdialysis probes (blue box on the Nissl-stained section). Topical application of CNQX abolished this metabolic response (STIM + CNQX). All autoradiograms are colour-coded according to the same quantitative scale.
AMPA receptors mediate stimulation-induced increases in lactate
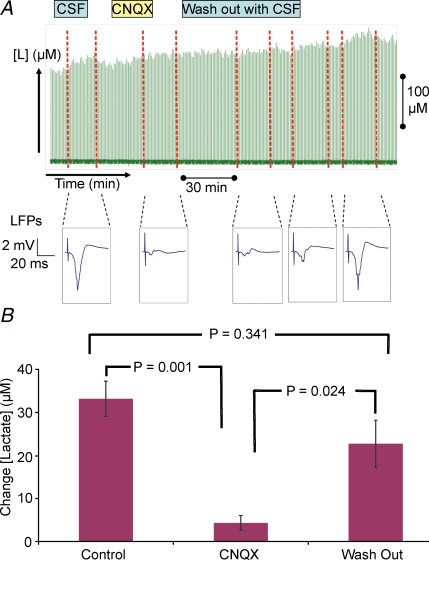
We then assessed the role of postsynaptic activity on evoked increases in lactate. Glutamate uptake by astrocytes via glutamate (Glu) transporters is believed to trigger glycolysis (Pellerin & Magistretti, 1994). As CNQX is not transported by Glu transporters (Duan et al. 1999), local application cleanly blocks AMPA receptors without affecting glutamate uptake (Pellerin & Magistretti, 1994). Our results showed that the increase in lactate evoked by stimulation was abolished by the AMPA receptor antagonist CNQX and returned to normal following wash-out of the drug. Figure 6 shows an original recording of lactate before, during and after CNQX application. Individual traces of LFP response amplitudes were used to verify the effect of the drug. The LFP recovered during wash-out, returning to near normal size by the final stimulation, at the same time as the lactate response. The data for the effect of CNQX on lactate for 10 responses from six animals is shown in Fig. 6. The increase in lactate during control stimulations was 33.1 ± 4.0 μm. After CNQX application, the increase was reduced to 4.3 ± 1.7 μm, and after wash-out, the increase in lactate returned to 22.5 ± 5.4 μm. The results suggest that glycolysis may not be restricted to one cell type only and may occur in both Purkinje cells and astroytes where it is triggered by an AMPA receptor-mediated process either in Purkinje cells or astrocytes.
Figure 6. Activity-dependent rises in lactate are triggered by postsynaptic currents and blocked by AMPA receptor antagonists.
Effect of topical application of CNQX on climbing fibre stimulation-evoked rises in extracellular lactate and LFP response amplitudes. A, top panel illustrates the times of superfusion with CSF, CSF + drug and wash-out of drug with CSF. The green forest of peaks below this correspond to the raw lactate levels, the red dotted lines indicate the start and end of stimulation. Below this are individual traces of LFPs; a typical example has been chosen for the designated time period. The figure shows that under control conditions (CSF) climbing fibre stimulation induced LFP responses and increases in extracellular lactate, while CNQX, a specific blocker of AMPA receptors, abolished both responses. Following a prolonged wash-out period, both LFP and lactate responses returned to control levels. B, histogram summarizing effect of CNQX on lactate response. The figure shows the averaged responses (n = 10 in 6 animals); values are mean ±s.e.m. displayed as a difference from zero. CNQX readings are taken from stimulations after 35 min of drug application. Wash-out readings were taken when the LFP response amplitudes began to gain amplitude. P values are calculated as a result of paired Student's t tests between individual values of the same animal.
Evoked increases in lactate are independent of glycogen breakdown
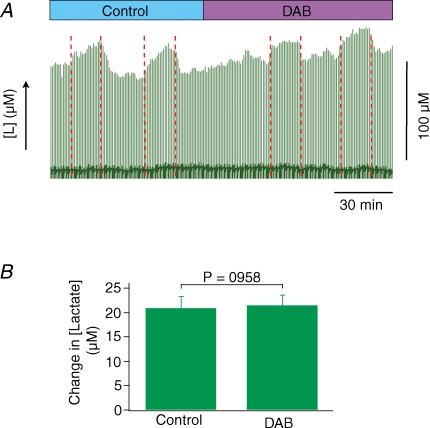
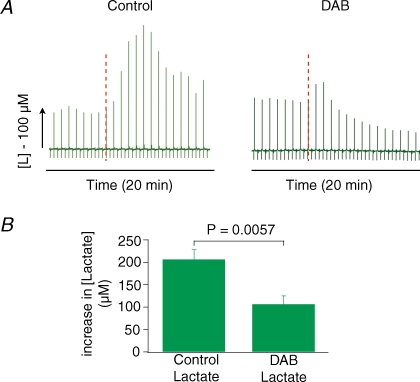
Since glucose levels remained unchanged during stimulation, we aimed to examine whether lactate was produced from glycogen breakdown during increased neuronal activity. For this purpose DAB, a glycogen breakdown inhibitor, was applied topically and left on the brain for the rest of the experiment. Figure 7A depicts raw data on lactate for a typical DAB experiment. Application of DAB did not affect the increases in lactate in response to stimulation, suggesting that glycogen is not the source for lactate production during stimulation. Figure 7B shows the average of five DAB responses from three animals. The mean values for control and DAB responses were 20.9 ± 2.5 μm and 21.4 ± 2.2 μm, respectively. Since none of the recorded parameters could be used to verify that DAB was working, our finding could be seen as an artefact of a non-working drug. We did, however, find a difference in the ‘death-peak’, i.e. the large increase in lactate following terminal cardiac arrest, which turned out to be much smaller in the DAB experiments suggesting that glycogen was no longer available for breakdown, and hence transformation into lactate. This was taken as evidence for a biological effect of DAB on the glycogen phosphorylase as shown in Fig. 8.
Figure 7. Glycogen breakdown does not contribute to evoked rises in extracellular lactate.
Extracellular lactate rises in live rat cerebellum evoked by stimulation was unaffected by topical application of DAB, a glycogen phosphorylase inhibitor. A, original data from one animal illustrating lactate responses under control conditions and following application of DAB. The green forest of peaks below this correspond to the raw lactate levels, the red dotted lines indicate the start and end of stimulation. DAB did not alter the baseline and the stimulated lactate increase remained unchanged following DAB. B, histogram showing effect of DAB on lactate response. Data are mean ±s.e.m. (n = 5 in 3 animals) of lactate increase for the control and DAB stimuli. DAB readings were taken from stimulations after 1.5 h of drug application. P values are calculated as a result of paired Student's t tests between individual values of the same animal.
Figure 8. Rises in extracellular lactate following cardiac arrest depend on glycogen breakdown.
Response amplitude of lactate peak following cardiac arrest in control animals and in animals treated with DAB. A, raw lactate peaks from 2 experiments. In the control animal lactate increased ∼200% after cardiac arrest and stayed elevated for ∼5 min. After this it decreased slowly over the next 20 min until end of data acquisition, but never reaching baseline. In the DAB animal the cardiac arrest peak was ∼20% (a factor of 10 less), and persisted for only 1 min whereupon it decreased over the next 20 min to below baseline. The cardiac arrest response was reproducible in each of the animals that had received the drug. B, histograms showing the mean ±s.e.m. cardiac arrest peak amplitude of lactate in control animals (n = 6) versus DAB animals (n = 6). Following DAB treatment this peak virtually disappeared. This documents that DAB was effective in blocking glycogen phosphorylase in our experiments, and that the rises in lactate following cardiac arrest, but not during activation, were dependent on glycogen breakdown. P values are from unpaired Students t tests between the DAB and control groups
Discussion
This study provides the first evidence that lactate rises evoked by stimulation depend on preserved activity of AMPA receptors in rat cerebellum in vivo. CNQX, an AMPA receptor blocker, abolished the evoked increases in lactate, CBF and glucose use, suggesting that AMPA receptors have a key role for initiating the production of lactate. Thus, in this network, glucose consumption and lactate production was controlled by the same mechanisms as blood flow and oxygen consumption (Offenhauser et al. 2005). This indicates that the provision of substrates for Purkinje cell neurons and their ultimate combustion in the presence of oxygen are functionally integrated via mechanisms that are related to activation of AMPA receptors.
Activity-dependent changes in lactate and glucose
Stimulation of the climbing fibres at 5 Hz for 20 min showed a reliable increase in the concentration of lactate in the microdialysate of the lactate probe and hence in the extracellular fluid (ECF) of the brain. This suggested an increased production of lactate during neuronal activity. A weakness of the microdialysis method is that the absolute delivery and utilization rates cannot be separated. With respect to lactate, its levels in a unit volume of the ECF (such as that sampled by the microdialysis probe) are a balance of the in and out fluxes according to eqn (1).
| (1) |
where flux is measured in mol s−1. For the brain, under non-pathological stimulation conditions, transport rates of lactate to or from the blood are very small compared to the rates of local production and utilization (see, e.g. Madsen et al. 1999). Hence we can interpret Fluxin as local supply of lactate by the brain and Fluxout as local utilization of lactate by the brain.
The observation that lactate levels increase in response to stimulation implies that the supply outstrips the utilization during the initial phase. The decrease in lactate levels at the end of stimulation implies that utilization outstrips production. In the middle section of the stimulation, a steady state is reached between the rates of production and utilization.
The experiments performed at a particularly high time resolution showed that a minimum stimulation period of 30 s was needed to evoke a measurable increase in lactate. The initial lactate rise at the onset of stimulation was linear with a slope of 6.72 μm min−1 for 72 s, indicating the minimum production rate of lactate. After this, the increase rate for lactate amounted to 0.12 μm min−1 until the end of stimulation, where the lactate level decreased at a rate of −6.66 μm min−1.
The synaptic activity, reflected by the LFP response amplitude, was stable throughout the stimulation period, suggesting a consistent energy demand during the middle section. If we assume that the energy demand immediately after the end of stimulation is the same as during stimulation, the rate of utilization can be assumed to be constant. As the measured balance of supply and utilization is 0.12 μm min−1, a rate of supply can be estimated according to eqn (1) to be 0.12 – (−6.6) = 6.78 μm min−1. This rate corresponds nicely to the rate of supply measured during the initial rise in lactate of 6.72 μm min−1. These results point towards a coupled increase in supply and consumption of lactate during prolonged stimulation.
The levels of glucose remained unchanged throughout stimulation, which can be interpreted either as no change in delivery and utilization, or an equal increase in both delivery and utilization (increased flux) without a change in the extracellular concentration.
In a study from Hu and Wilson, 5 s stimulation of the perforant path in the hippocampus was reported to produce an initial dip of 7% in lactate (Hu & Wilson, 1997). The initial dip lasted for 12 s and was followed by a 180% increase in lactate for 14 min. Unfortunately, the study holds no information of absolute values (basal or induced changes) of the lactate concentration. The maximum lactate reduction seen by Hu and Wilson in their continuous measurement was 7.5% for a single data value. Our recordings were carefully gated with the stimulus so that the entire dip seen by Hu and Wilson could be fitted entirely into one of our sample intervals of 12 s. From this we reasoned that a similar dip in our case would have amounted to an averaged response of 3.75% within this bin (approx. half of Wilson's signal), which equals 3.12 μm (= 3.75% of 112 μm baseline). This is well above our baseline noise level of 0.9 μm (shown as 2 ×s.d. in Fig. 3) and indicates that our detection system would have observed a dip if there had been any. One of the main differences between the Hu and Wilson study and the present one is the stimulation intensity. In the former study a 5 s stimulation of 1 ms pulses of 250 μA at 40 Hz was applied, whereas we used a stimulation of 200 μs pulses of 150 μA at 5 Hz. This difference implies, that within 1 s, Hu and Wilson stimulated for 40 ms at 250 μA whereas we stimulated for 1 ms at 150 μA. Wilson's argument for a 5 s stimulation was that shorter stimulus duration produced no or just a negligible and irreproducible change in lactate. This suggests that the lactate dip and subsequent large increase found in that study was the result of extreme stimulation conditions.
Focusing on the overall increase in lactate found in the present study and the study of Hu and Wilson, the profile of increase looks similar in having a general rise phase at the start of stimulation, a gentler rise phase in the middle of the simulation and a fall phase at the end of the stimulation. The big difference lies in the overall increase, amounting to 200% in the study of Hu and Wilson and on average 24% in our study. Again, the extreme stimulation condition used by Hu and Wilson may explain this discrepancy. The ∼24% increase in lactate reported in our study is in accordance with studies in which cortical lactate changes are measured during a spontaneous grooming event (Parkin et al. 2003). Conversely, the increase in lactate of 200% reported by Hu and Wilson compares more to pathological stimuli, such as a 500% increase in studies of mild hypoxia (Jones et al. 2000) and 4000% increase for hypoxia and glutamate infusion (Ros et al. 2002).
Postsynaptic activity and lactate production
In order to elucidate the role of postsynaptic activity on lactate production, we topically applied the AMPA receptor antagonist CNQX 30 min prior to stimulation. The effect of CNQX was verified by the disappearance of the LFP and CBF responses as described in details previously (Mathiesen et al. 1998). In 1994 Pellerin and Magistretti put forward the hypothesis that released glutamate in response to neuronal activity stimulated glycolysis, i.e. glucose utilization and lactate production, in astrocytes. They further proposed that this metabolic action was mediated by activation of a Na+-dependent uptake system for glutamate and not by interaction of glutamate with appropriate receptors (Pellerin & Magistretti, 1994). On the contrary, we found that the lactate responses disappeared in the presence of CNQX. This indicates that AMPA receptor-related mechanisms are necessary for initiating the production of lactate in relation to signalling at this glutamatergic synapse in rat cerebellum. Furthermore, as CNQX does not block glutamate transporters, the uptake of glutamate was unaffected in the AMPA experiments implying that in the intact cerebellum lactate production is coupled to post- rather than presynaptic activity.
AMPA receptors are present both on Purkinje cells and Bergman glia (Petralia & Wenthold, 1992; Martin et al. 1993; Baude et al. 1994). We suggest that activation of Ca2+ -permeable AMPA receptors on Bergmann glia might at the same time cause increases in CBF and in lactate production (Piet & Jahr, 2007). The Ca2+ influx activates NOS, which produces NO – a main mediator of CBF in the cerebellum (Akgoren et al. 1994; Yang & Iadecola, 1997). At the same time we expected that rises in intracellular Ca2+ in Bergmann glia would activate the astrocytic glycogen phosphorylase kinase (Ozawa, 1973; Kishimoto et al. 1977; Psarra et al. 1998), and turn on the activity of glycogen phosphorylase and lactate production, but DAB had no effect on the activity-dependent rises in extracellular lactate. This suggests that the lactate production was unrelated to glycogen breakdown. The 2DG experiments indicated an increase in glucose use by 24% during stimulation, which compares well with the observed rises in extracellular lactate of 20–30%. Furthermore, we observed no changes with respect to the extracellular glucose concentration at the same time as the large rises in lactate. This could be because DAB was ineffective – however, the lactate peak following cardiac arrest was dramatically reduced by DAB indicating a clear decrease in the availability of glycogen. This suggests that DAB was effective. Our data are consistent with a recent study of cerebellar astrocytes in vitro which showed that a positive modulator of AMPA receptors increased glucose use and lactate release in cerebellar astrocytes independent of glutamate uptake (Pellerin & Magistretti, 2005). We suggest that the lactate released in response to stimulation comes directly from glucose as described in a recent model of lactate compartmentalization (Sickmann et al. 2005).
In conclusion, we here provide evidence that stimulation of glutamatergic synapses in the rat cerebellar cortex gives rise to increments in extracellular lactate that closely follows the calculated increases in CMRO2, blood flow and synaptic activity. We suggest that the evoked rises in lactate relate to interaction of glutamate with AMPA receptors on Purkinje cells and/or Bergmann glia and subsequent processes which are activated, including action potentials in Purkinje cells. We interpret our data to suggest that glutamate receptor-mediated mechanisms are both necessary and sufficient for activity-related lactate production in the cerebellum. This interpretation of our data respects the possibility that the production of lactate is astrocytic and that shuttling of lactate from Bergmann glia to neurons may be a mechanism by which astrocytes feed energy-demanding neurons (Pellerin & Magistretti, 1994).
Acknowledgments
This study was supported by The Danish Medical Research Council, the Lundbeck Foundation Centre for Neurovascular Signalling, the Research Council of the Copenhagen County, the NOVO-Nordisk Foundation, the Commissariat à l'Energie Atomique (CEA) and the Centre National de la Recherche Scientifique (CNRS), the UK Engineering and Physical Science Research Council.
References
- Akgoren N, Fabricius M, Lauritzen M. Importance of nitric oxide for local increases of blood flow in rat cerebellar cortex during electrical stimulation. Proc Natl Acad Sci U S A. 1994;91:5903–5907. doi: 10.1073/pnas.91.13.5903. [DOI] [PMC free article] [PubMed] [Google Scholar]
- Andersen B, Rassov A, Westergaard N, Lundgren K. Inhibition of glycogenolysis in primary rat hepatocytes by 1,4-dideoxy-1,4-imino-d-arabinitol. Biochem J. 1999;342:545–550. [PMC free article] [PubMed] [Google Scholar]
- Baude A, Molnar E, Latawiec D, Mcilhinney RAJ, Somogyi P. Synaptic and nonsynaptic localization of the Glur1 subunit of the AMPA-type excitatory amino-acid receptor in the rat cerebellum. J Neurosci. 1994;14:2830–2843. doi: 10.1523/JNEUROSCI.14-05-02830.1994. [DOI] [PMC free article] [PubMed] [Google Scholar]
- Bergersen L, Waerhaug O, Helm J, Thomas M, Laake P, Davies AJ, Wilson MC, Halestrap AP, Ottersen OP. A novel postsynaptic density protein: the monocarboxylate transporter MCT2 is co-localized with δ-glutamate receptors in postsynaptic densities of parallel fiber-Purkinje cell synapses. Exp Brain Res. 2001;136:523–534. doi: 10.1007/s002210000600. [DOI] [PubMed] [Google Scholar]
- Bergersen LH, Magistretti PJ, Pellerin L. Selective postsynaptic co-localization of MCT2 with AMPA receptor GluR2/3 subunits at excitatory synapses exhibiting AMPA receptor trafficking. Cerebr Cortex. 2005;15:361–370. doi: 10.1093/cercor/bhh138. [DOI] [PubMed] [Google Scholar]
- Caesar K, Thomsen K, Lauritzen M. Dissociation of spikes, synaptic activity, and activity-dependent increments in rat cerebellar blood flow by tonic synaptic inhibition. Proc Natl Acad Sci U S A. 2003;100:16000–16005. doi: 10.1073/pnas.2635195100. [DOI] [PMC free article] [PubMed] [Google Scholar]
- Chaigneau E, Tiret P, Lecoq J, Ducros M, Knopfel T, Charpak S. The relationship between blood flow and neuronal activity in the rodent olfactory bulb. J Neurosci. 2007;27:6452–6460. doi: 10.1523/JNEUROSCI.3141-06.2007. [DOI] [PMC free article] [PubMed] [Google Scholar]
- Devor A, Tian P, Nishimura N, Teng IC, Hillman EMC, Narayanan SN, Ulbert I, Boas DA, Kleinfeld D, Dale AM. Suppressed neuronal activity and concurrent arteriolar vasoconstriction may explain negative blood oxygenation level-dependent signal. J Neurosci. 2007;27:4452–4459. doi: 10.1523/JNEUROSCI.0134-07.2007. [DOI] [PMC free article] [PubMed] [Google Scholar]
- Duan S, Anderson CM, Stein BA, Swanson RA. Glutamate induces rapid upregulation of astrocyte glutamate transport and cell-surface expression of GLAST. J Neurosci. 1999;19:10193–10200. doi: 10.1523/JNEUROSCI.19-23-10193.1999. [DOI] [PMC free article] [PubMed] [Google Scholar]
- Fellows LK, Boutelle MG, Fillenz M. Physiological stimulation increases nonoxidative glucose-metabolism in the brain of the freely moving rat. J Neurochem. 1993;60:1258–1263. doi: 10.1111/j.1471-4159.1993.tb03285.x. [DOI] [PubMed] [Google Scholar]
- Fox PT, Raichle ME. Focal physiological uncoupling of cerebral blood flow and oxidative metabolism during somatosensory stimulation in human subjects. Proc Natl Acad Sci U S A. 1986;83:1140–1144. doi: 10.1073/pnas.83.4.1140. [DOI] [PMC free article] [PubMed] [Google Scholar]
- Gjedde A, Johannsen P, Georg E, Cold GE, Østergaard L. Cerebral metabolic response to low blood flow: possible role of cytochrome oxidase inhibition. J Cereb Blood Flow Metab. 2005;25:1183–1196. doi: 10.1038/sj.jcbfm.9600113. [DOI] [PubMed] [Google Scholar]
- Hoffmeyer HW, Enager P, Thomsen KJ, Lauritzen MJ. Nonlinear neurovascular coupling in rat sensory cortex by activation of transcallosal fibers. J Cereb Blood Flow Metab. 2007;27:575–587. doi: 10.1038/sj.jcbfm.9600372. [DOI] [PubMed] [Google Scholar]
- Hu Y, Wilson GS. A temporary local energy pool coupled to neuronal activity: fluctuations of extracellular lactate levels in rat brain monitored with rapid-response enzyme-based sensor. J Neurochem. 1997;69:1484–1490. doi: 10.1046/j.1471-4159.1997.69041484.x. [DOI] [PubMed] [Google Scholar]
- Iadecola C, Li J, Xu S, Yang G. Neural mechanisms of blood flow regulation during synaptic activity in cerebellar cortex. J Neurophysiol. 1996;75:940–950. doi: 10.1152/jn.1996.75.2.940. [DOI] [PubMed] [Google Scholar]
- Jones DA, Ros J, Landolt H, Fillenz M, Boutelle MG. Dynamic changes in glucose and lactate in the cortex of the freely moving rat monitored using microdialysis. J Neurochem. 2000;75:1703–1708. doi: 10.1046/j.1471-4159.2000.0751703.x. [DOI] [PubMed] [Google Scholar]
- Kishimoto A, Takai Y, Nishizuka Y. Activation of glycogen-phosphorylase kinase by a calcium-activated, cyclic nucleotide-independent protein-kinase system. J Biol Chem. 1977;252:7449–7452. [PubMed] [Google Scholar]
- Lauritzen M. Opinion: Reading vascular changes in brain imaging: is dendritic calcium the key? Nat Rev Neurosci. 2005;6:77–85. doi: 10.1038/nrn1589. [DOI] [PubMed] [Google Scholar]
- Madsen P, Cruz N, Sokoloff L, Dienel G. Cerebral oxygen/glucose ratio is low during sensory stimulation and rises above normal during recovery: excess glucose consumption during stimulation is not accounted for by lactate efflux from or accumulation in brain tissue. J Cereb Blood Flow Metab. 1999;19:393–400. doi: 10.1097/00004647-199904000-00005. [DOI] [PubMed] [Google Scholar]
- Magistretti PJ, Pellerin L, Rothman DL, Shulman RG. Energy on demand. Science. 1999;283:496–497. doi: 10.1126/science.283.5401.496. [DOI] [PubMed] [Google Scholar]
- Mangia S, Tkac I, Gruetter R, Van de Moortele P-F, Maraviglia B, Ugurbil K. Sustained neuronal activation raises oxidative metabolism to a new steady-state level: evidence from 1H NMR spectroscopy in the human visual cortex. J Cereb Blood Flow Metab. 2007;27:1055–1063. doi: 10.1038/sj.jcbfm.9600401. [DOI] [PubMed] [Google Scholar]
- Martin LJ, Blackstone CD, Levey AI, Huganir RL, Price DL. AMPA glutamate receptor subunits are differentially distributed in rat brain. Neurosci. 1993;53:327–358. doi: 10.1016/0306-4522(93)90199-p. [DOI] [PubMed] [Google Scholar]
- Masamoto K, Takizawa N, Kobayashi H, Oka K, Tanishita K. Dual responses of tissue partial pressure of oxygen after functional stimulation in rat somatosensory cortex. Brain Res. 2003;979:104–113. doi: 10.1016/s0006-8993(03)02882-8. [DOI] [PubMed] [Google Scholar]
- Mathiesen C, Caesar K, Akgoren N, Lauritzen M. Modification of activity-dependent increases of cerebral blood flow by excitatory synaptic activity and spikes in rat cerebellar cortex. J Physiol. 1998;512:555–566. doi: 10.1111/j.1469-7793.1998.555be.x. [DOI] [PMC free article] [PubMed] [Google Scholar]
- Matsuura T, Kanno I. Quantitative and temporal relationship between local cerebral blood flow and neuronal activation induced by somatosensory stimulation in rats. Neurosci Res. 2001;40:281–290. doi: 10.1016/s0168-0102(01)00236-x. [DOI] [PubMed] [Google Scholar]
- Nielsen A, Lauritzen M. Coupling and uncoupling of activity-dependent increases of neuronal activity and blood flow in rat somatosensory cortex. J Physiol. 2001;533:773–785. doi: 10.1111/j.1469-7793.2001.00773.x. [DOI] [PMC free article] [PubMed] [Google Scholar]
- Offenhauser N, Thomsen K, Caesar K, Lauritzen M. Activity-induced tissue oxygenation changes in rat cerebellar cortex: interplay of postsynaptic activation and blood flow. J Physiol. 2005;565:279–294. doi: 10.1113/jphysiol.2005.082776. [DOI] [PMC free article] [PubMed] [Google Scholar]
- Oikonomakos NG, Tiraidis C, Leonidas DD, Zographos SE, Kristiansen M, Jessen CU, Norskov-Lauritsen L, Agius L. Iminosugars as potential inhibitors of glycogenolysis: Structural insights into the molecular basis of glycogen phosphorylase inhibition. J Med Chem. 2006;49:5687–5701. doi: 10.1021/jm060496g. [DOI] [PubMed] [Google Scholar]
- Ozawa E. Activation of phosphorylase kinase from brain by small amounts of calcium-ion. J Neurochem. 1973;20:1487–1488. doi: 10.1111/j.1471-4159.1973.tb00263.x. [DOI] [PubMed] [Google Scholar]
- Parkin MC, Hopwood SE, Jones DA, Hashemi P, Landolt H, Fabricius M, Lauritzen M, Boutelle MG, Strong AJ. Dynamic changes in brain glucose and lactate in pericontusional areas of the human cerebral cortex, monitored with rapid sampling on-line microdialysis: relationship with depolarisation-like events. J Cereb Blood Flow Metab. 2005;25:402–413. doi: 10.1038/sj.jcbfm.9600051. [DOI] [PubMed] [Google Scholar]
- Parkin MC, Hopwood SE, Strong AJ, Boutelle MG. Resolving dynamic changes in brain metabolism using biosensors and on-line microdialysis. Trends Analyt Chem. 2003;22:487–497. [Google Scholar]
- Pellerin L, Magistretti PJ. Glutamate uptake into astrocytes stimulates aerobic glycolysis: a mechanism coupling neuronal activity to glucose utilization. Proc Natl Acad Sci U S A. 1994;91:10625–10629. doi: 10.1073/pnas.91.22.10625. [DOI] [PMC free article] [PubMed] [Google Scholar]
- Pellerin L, Magistretti PJ. Neuroscience. Let there be (NADH) light. Science. 2004;305:50–52. doi: 10.1126/science.1100428. [DOI] [PubMed] [Google Scholar]
- Pellerin L, Magistretti PJ. Ampakine™ CX546 bolsters energetic response of astrocytes: a novel target for cognitive-enhancing drugs acting as α-amino-3-hydroxy-5-methyl-4-isoxazolepropionic acid (AMPA) receptor modulators. J Neurochem. 2005;92:668–677. doi: 10.1111/j.1471-4159.2004.02905.x. [DOI] [PubMed] [Google Scholar]
- Petralia RS, Wenthold RJ. Light and electron immunocytochemical localization of AMPA-selective glutamate receptors in the rat brain. J Comp Neurol. 1992;318:329–354. doi: 10.1002/cne.903180309. [DOI] [PubMed] [Google Scholar]
- Piet R, Jahr CE. Glutamatergic and purinergic receptor-mediated calcium transients in bergmann glial cells. J Neurosci. 2007;27:4027–4035. doi: 10.1523/JNEUROSCI.0462-07.2007. [DOI] [PMC free article] [PubMed] [Google Scholar]
- Psarra AMG, Pfeiffer B, Giannakopoulou M, Sotiroudis TG, Stylianopoulou F, Hamprecht B. Immunocytochemical localization of glycogen phosphorylase kinase in rat brain sections and in glial and neuronal primary cultures. J Neurocyt. 1998;27:779–790. doi: 10.1023/a:1006970429961. [DOI] [PubMed] [Google Scholar]
- Revsbech NP. An oxygen microsensor with a guard cathode. Limnol Oceanogr. 1989;34:474–478. [Google Scholar]
- Ros J, Jones D, Pecinska N, Alessandri B, Boutelle M, Landolt H, Fillenz M. Glutamate infusion coupled with hypoxia has a neuroprotective effect in the rat. J Neurosci Meth. 2002;119:129–133. doi: 10.1016/s0165-0270(02)00174-7. [DOI] [PubMed] [Google Scholar]
- Sheth SA, Nemoto M, Guiou M, Walker M, Pouratian N, Toga AW. Linear and nonlinear relationships between neuronal activity, oxygen metabolism, and hemodynamic responses. Neuron. 2004;42:347–355. doi: 10.1016/s0896-6273(04)00221-1. [DOI] [PubMed] [Google Scholar]
- Sibson NR, Dhankhar A, Mason GF, Rothman DL, Behar KL, Shulman RG. Stoichiometric coupling of brain glucose metabolism and glutamatergic neuronal activity. Proc Nat Acad Sci U S A. 1998;95:316–321. doi: 10.1073/pnas.95.1.316. [DOI] [PMC free article] [PubMed] [Google Scholar]
- Sickmann HM, Schousboe A, Fosgerau K, Waagepetersen HS. Compartmentation of lactate originating from glycogen and glucose in cultured astrocytes. Neurochem Res. 2005;10:1295–1304. doi: 10.1007/s11064-005-8801-4. [DOI] [PubMed] [Google Scholar]
- Sokoloff L. The [14C]deoxyglucose method: four years later. Acta Neurol Scand Suppl. 1979;72:640–649. [PubMed] [Google Scholar]
- Takano T, Tian GF, Peng WG, Lou NH, Libionka W, Han XN, Nedergaard M. Astrocyte-mediated control of cerebral blood flow. Nat Neurosci. 2006;9:260–267. doi: 10.1038/nn1623. [DOI] [PubMed] [Google Scholar]
- Ueki M, Linn F, Hossmann KA. Functional activation of cerebral blood flow and metabolism before and after global ischemia of rat brain. J Cereb Blood Flow Metab. 1988;8:486–494. doi: 10.1038/jcbfm.1988.89. [DOI] [PubMed] [Google Scholar]
- Voutsinos-Porche B, Bonvento G, Tanaka K, Steiner P, Welker E, Chatton JY, Magistretti PJ, Pellerin L. Glial glutamate transporters mediate a functional metabolic crosstalk between neurons and astrocytes in the mouse developing cortex. Neuron. 2003;37:275–286. doi: 10.1016/s0896-6273(02)01170-4. [DOI] [PubMed] [Google Scholar]
- Yang G, Iadecola C. Obligatory role of NO in glutamate-dependent hyperemia evoked from cerebellar parallel fibers. Am J Physiol Regul Integr Comp Physiol. 1997;272:R1155–R1161. doi: 10.1152/ajpregu.1997.272.4.R1155. [DOI] [PubMed] [Google Scholar]
- Zhu XH, Zhang Y, Tian RX, Lei H, Zhang NY, Zhang XL, Merkle H, Ugurbil K, Chen W. Development of O-17 NMR approach for fast imaging of cerebral metabolic rate of oxygen in rat brain at high field. Proc Nat Acad Sci U S A. 2002;99:13194–13199. doi: 10.1073/pnas.202471399. [DOI] [PMC free article] [PubMed] [Google Scholar]


