Abstract
Flagella are sensory organelles that interact with the environment through signal transduction and gene expression networks. We used microarray profiling to examine gene regulation associated with flagellar length change in the green alga Chlamydomonas reinhardtii. Microarrays were probed with fluorescently labeled cDNAs synthesized from RNA extracted from cells before and during flagellar assembly or disassembly. Evaluation of the gene expression profiles identified >100 clones showing at least a twofold change in expression during flagellar length changes. Products of these genes are associated not only with flagellar structure and motility but also with other cellular responses, including signal transduction and metabolism. Expression of specific genes from each category was further characterized at higher resolution by using quantitative real-time PCR (qRT–PCR). Analysis and comparison of the gene expression profiles coupled to flagellar assembly and disassembly revealed that each process involves a new and uncharacterized whole-cell response to flagellar length changes. This analysis lays the groundwork for a more comprehensive understanding of the cellular and molecular networks regulating flagellar length changes.
CELLS monitor and respond to changes in the environment through tight coordination of signal transduction and gene expression networks. Cilia and flagella, similar complex organelles that receive and integrate extracellular signals, play a major role in mediating how a cell interacts with its environment (reviewed by Ainsworth 2007 and by Christensen et al. 2007). Recently, studies of such diverse model systems as Chlamydomonas reinhardtii, Caenorhabditis elegans, Drosophila melanogaster, and Mus musculus (reviewed by Davenport and Yoder 2005; Pan et al. 2005) have linked defects in ciliary structure and function directly to known human diseases such as polycystic kidney disease and Bardet–Biedl syndrome (Pazour et al. 2000, 2005; Li et al. 2004; Sun et al. 2004; Stolc et al. 2005). Identification of the components and mechanisms involved in flagellar structure and function has begun to elucidate the signal transduction networks, but the genes involved remain incompletely understood (Davenport and Yoder 2005).
The unicellular green alga C. reinhardtii provides an excellent model system for investigating flagellar gene expression network responses. It has two flagella that act as environmental sensors for the cell. Changing the cell's environment in various ways causes changes in flagellar morphology. For example, experimental acidification of the medium (acid shock) induces flagellar excision (Witman et al. 1972) followed by regrowth (hereafter referred to as assembly) of new flagella within 2 hr (Rosenbaum et al. 1969; Lefebvre et al. 1978). Stimulation with either isobutyl methylxanthine (IBMX) (Lefebvre et al. 1980) or sodium pyrophosphate (Lefebvre et al. 1978) induces resorption or shortening of the flagella (hereafter referred to as disassembly).
Many previous investigations have demonstrated coordination between flagellar gene expression and flagellar assembly. During the course of flagellar assembly, for example, genes encoding α- and β-tubulin are transiently upregulated and return to prestimulation levels as the regenerating flagella reach full length (Lefebvre et al. 1980; Silflow et al. 1982; Baker et al. 1984; Keller et al. 1984; Schloss et al. 1984). Recent genomic and proteomic studies by Stolc et al. (2005) and Pazour et al. (2005) have profiled similar expression patterns for large numbers of additional genes during flagellar assembly. Although the coordination of structure and gene expression is well characterized for flagellar assembly, known gene regulation during disassembly is largely limited to a decrease in expression of α- and β-tubulin mRNA levels (Lefebvre et al. 1980; Silflow et al. 1982).
An important aspect of understanding coordination of flagellar structure and function is identification of genes whose expression is regulated during flagellar assembly and disassembly. We used a genomics approach to identify C. reinhardtii genes showing changes in expression during flagellar disassembly. By evaluating a large gene set, we established an expression profile for flagellar disassembly. Furthermore, we compared the expression profile for disassembly to that for assembly to determine whether common sets of genes are coordinately or differentially regulated. Because many structural genes are already characterized, uncovering genes associated with the regulatory mechanism was of particular interest. Evaluation of assembly and disassembly expression profiles provides a necessary step for defining the complex cellular and molecular networks involved in regulating flagellar length change.
MATERIALS AND METHODS
Cell culture:
C. reinhardtii wild-type strain 137c− (CC-124) (Chlamydomonas Center, http://www.chlamy.org) was cultured in medium I (Sager and Granick 1953) at 25° with continuous aeration on a 14:10-hr light:dark cycle. Before stimulation, cells were harvested by centrifugation (∼4000 × g, 6 min) and then resuspended in a buffer containing 10 mm piperazine-N,N′-bis[2-ethanesulfonic acid]–potassium hydroxide (PIPES–KOH), pH 7.2, 500 μm CaCl2. Cells recovered under fluorescent light at room temperature for 2 hr. To monitor cell viability and flagellar lengths, we fixed a cell sample in an equal volume of 2% glutaraldehyde and examined the sample by phase-contrast microscopy (Carl Zeiss, Thornwood, NY). Flagellar lengths were measured with an ocular micrometer.
Cell stimulation and total RNA extraction:
For measurement of flagellar assembly, acetic acid (0.2 n) was added to the cell culture to lower the sample pH to <4.3 and then, after 30 sec, KOH (0.2 n) was added to return the sample to pH 7.2 (Evans and Keller 1997). This acid shock experimentally induced flagellar excision, which was followed by assembly. For measurement of disassembly, disassembly was experimentally stimulated by IBMX (Sigma, St. Louis). IBMX was dissolved in dimethyl sulfoxide (DMSO; Sigma) to a stock concentration of 200 mm. Cells were stimulated by addition of IBMX to a final concentration of 0.4 mm (Lefebvre et al. 1980). At 30, 60, and 90 min after stimulation, live cells were examined, and the percentages of deflagellation and flagellar length were determined on fixed cells. Total RNA was extracted before and at 30, 60, and 90 min after stimulation with the RNeasy mini kit (QIAGEN, Valencia, CA). The concentration of total RNA was determined by measurement of the A260/A280 with UV spectrophotometry (NanoDrop, Wilmington, DE) and RNA integrity was assessed with guanidine thiocyanate denaturing gels. For each stimulus, total RNA at each time point was extracted on three different days.
Fabrication of microarray:
C. reinhardtii cDNA clones were prepared from a cDNA library (Chlamydomonas Center, http://www.chlamy.org) cloned into a Stratagene (La Jolla, CA) Uni-ZAP mass excision vector system. This cDNA library was prepared from RNA isolated 15, 30, and 60 min after deflagellation by acid shock treatment. Plasmids were isolated with a 96-well vacuum manifold to produce 960 clones (Eppendorf, Westbury, NY, and Millipore, Billerica, MA). cDNA inserts from each clone were PCR amplified (Eppendorf Master Taq) with T3 and T7 primers in a 96-well format according to this protocol: 94° for 1 min; 30 cycles of 94° for 30 sec, 50° for 1 min, and 72° for 2 min; followed by an extension phase of 72° for 10 min. Every PCR reaction produced a single band on a 1% agarose gels. As controls, purified PCR products from α- and β-tubulins, radial spoke proteins (RSP3, RSP4, and RSP6), and pcf8-13 were included.
PCR products were suspended in 50% DMSO, which promotes hybridization (Hegde et al. 2000), and distributed into 384-well microtiter plates (Genetix, Boston) to a final concentration of 100 ng/μl (Yue et al. 2001). Arrays were printed with a 16-quill pin tool on the MicroGrid robot (BioRobotics, Cambridgeshire, UK) at a 0.4-mm pitch. In the custom spotting pattern, each sample was duplicated as a control for quality and variability across the slide (Yang and Speed 2002; Bowtell and Sambrook 2003). To ensure uniform spot morphology, we controlled temperature (20°–35°) and relative humidity (45–55%) levels throughout the array printing (Hegde et al. 2000). Purified PCR products were spotted onto Corning (Corning, NY) CMT-GAPS II slides, with an average spot diameter of 200 μm, and immobilized by baking at 80° for 5 hr (Corning CMT-GAPS II DMSO protocol). The printed slides were stored until use in a desiccator at room temperature.
Fluorescent labeling and hybridization:
Total RNA (20 μg) was converted into first-strand cDNA with the SuperScript Indirect cDNA labeling system (Invitrogen, Carlsbad, CA). Immediately after cDNA synthesis, the original template was hydrolyzed and cDNA products purified with the S.N.A.P. column purification module (Invitrogen). The amino-allyl-modified cDNA from each time point was coupled to one of four different Alexa Fluor dyes (Invitrogen): Alexa Fluor 555 for untreated, Alexa Fluor 647 for 30 min, Alexa Fluor 594 for 60 min, and Alexa Fluor 488 for the 90-min time point. The microarray slides were prehybridized in 5× SSC (Fisher Scientific, Waltham, MA), 0.1% SDS (Sigma), and 25% formamide (Fisher Scientific) for 45 min at 42°; rinsed in distilled water; allowed to dry; and then placed in a hybridization chamber (ArrayIt, Telechem International, Sunnyvale, CA). Each microarray slide was then cohybridized with a mixture of the four Alexa-Fluor-labeled cDNAs at 42° for 18 hr in the dark. After hybridization, the slides were washed once in 1× SSC, 0.2% SDS, at 55° for 10 min; twice in 0.1× SSC, 0.2% SDS, at 55° for 10 min; twice in 0.1× SSC at room temperature for 1 min; and once in dH2O at room temperature for 10 sec. (Amersham Biosciences protocol). The slides were allowed to dry and then laser scanned with the ScanArray 5000XL scanner (GSI Lumonics, Moorpark, CA). Labeling and hybridization for each time course were repeated three independent times.
Microarray data analysis:
QuantArray imaging software (BD Biosciences, San Jose, CA) was used to quantify fluorophore intensity. Background intensity was subtracted from spot intensity by a fixed-circle segmentation method. The resulting data were exported, and GeneSifter web-based software (http://www.genesifter.net) normalized them (Global Adjust) to correct for systematic differences in the intensity of the channels (Bowtell and Sambrook 2003). Fold change for each time point was calculated by comparing to the untreated sample. Selection criteria for evaluation of expression included a pairwise comparison of biological and on-slide replicates as well as a cutoff of twofold or greater change in relative abundance. The clones that met these criteria were chosen for DNA sequencing and characterization by database searches at the Joint Genome Institute (JGI, http://genome.jgi-psf.org/Chlre3/Chlre3.home.html) and National Center for Biotechnology Information (NCBI, http://www.ncbi.nlm.nih.gov).
Quantitative real-time polymerase chain reaction:
On the basis of the selection criterion outlined above, several genes showing differential expression were chosen for further analysis by quantitative real-time polymerase chain reaction (qRT–PCR). Primer sets with a melting temperature of 59°–60° and a product size between 90 and 150 bp were designed using Primer Quest (Integrated DNA Technologies, Coralville, IA, http://www.idtdna.com). Forward and reverse primer sets for each gene (Operon, Huntsville, AL; see supplemental Table 1 at http://www.genetics.org/supplemental/) were diluted to 10 μm and tested for a single product of the correct size with standard PCR and gel electrophoresis. The same total RNA used for the microarray profiles was used for qRT–PCR. First-strand cDNA synthesis was performed with 2 μg total RNA from each time point according to the manufacturer's protocol (SuperScript first-strand synthesis system for RT–PCR, Invitrogen). cDNA diluted 20-fold was combined with primer pairs and SYBR Green PCR master mix (Applied Biosystems, Foster City, CA) on an Applied Biosystems 7500 Fast Real-Time PCR system (Foster City, CA) according to the following protocol: 50° for 2 min; 95° for 10 min; 40 cycles of 95° for 15 sec, 60° for 30 sec, 68° for 30 sec; followed by a dissociation cycle. For each biological repetition, qRT–PCR was performed on all genes, including technical replicates and nontemplate controls. For each gene, a common threshold setting applied to each of the three biological replicates determined the threshold cycle (CT). Relative abundance of each gene was determined by the 2−ΔΔCt method (Livak and Schmittgen 2001). pcf8-13 (Schloss 1990) was used as the endogenous control for calculation of relative abundance. Relative abundances for time points 30, 60, and 90 min after stimulation were then standardized to that for untreated cells. Fold change and standard error (SE) were log transformed for graphical representation.
RESULTS
Microarray construction and preliminary data analysis:
We constructed our array using a cDNA library prepared from C. reinhardtii RNA isolated at 15, 30, and 60 min during flagellar assembly. The strategic use of the cDNA library that we used created an inherent bias in our analysis because known flagellar genes are induced during assembly, but it also increased the probability of identifying genes involved in the response to flagellar length change.
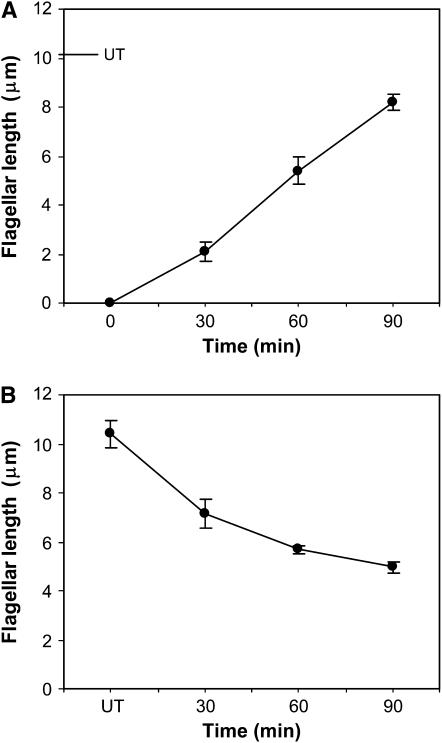
After experimentally induced flagellar excision, flagella assembled to ∼80% of the length of those of untreated cells by 90 min (Figure 1). After experimental stimulation of disassembly, flagella disassembled to ∼50% the length of those of untreated cells by 90 min (Figure 1). Control cells treated with DMSO, the solvent for IBMX, demonstrated no change in flagellar length (data not shown).
Figure 1.—
Changes in flagellar length during acid shock and IBMX-induced flagellar assembly and disassembly. Flagellar lengths were measured with an ocular micrometer before and 30, 60, and 90 min after stimulation. Data are the arithmetic means and standard deviations of the length measurements. (A) Cells were stimulated by acid shock, which induced flagellar excision followed by assembly. UT (untreated) is prestimulation flagellar length. (B) Cells were stimulated with 0.4 mm IBMX, which induced flagellar disassembly.
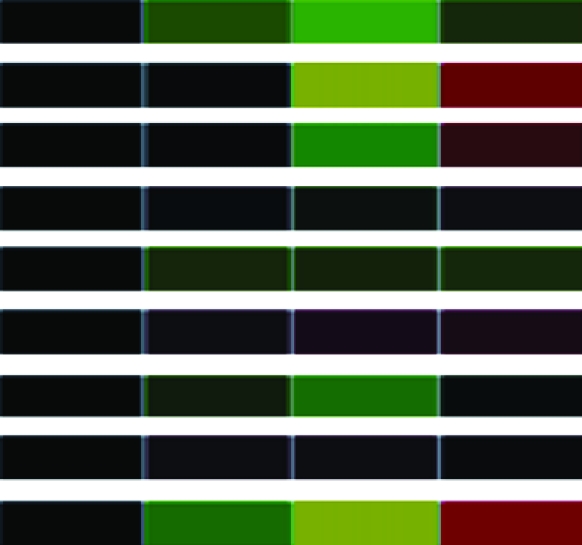
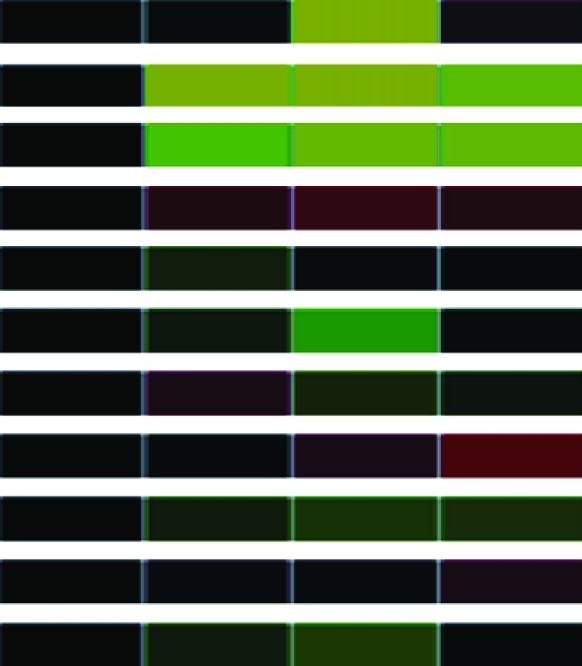
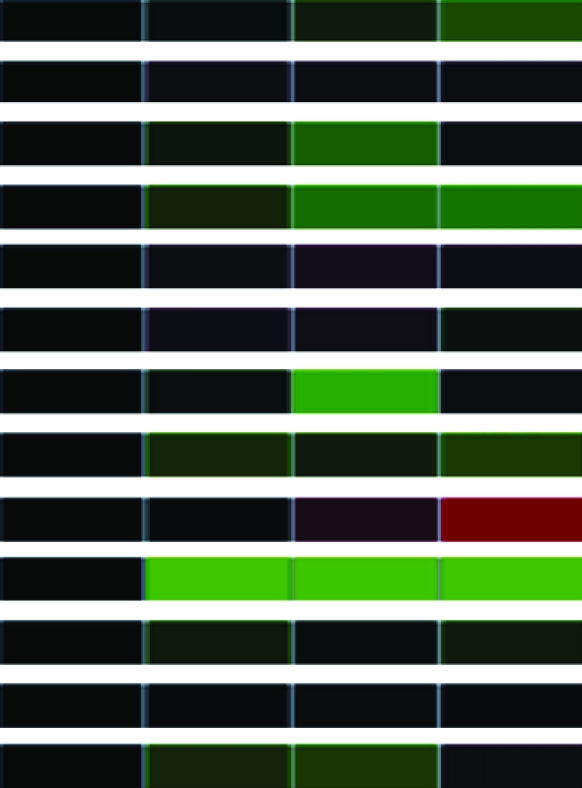
To assess differential gene expression over time, we extracted total RNA from cells before and at 30, 60, and 90 min following stimulation. Fluorescently labeled cDNAs synthesized from these RNAs were hybridized to the microarray. For each stimulus, the kinetics of how each gene responded was tracked over time through changes in relative abundance. The signal intensity at each time point compared to that of untreated cells reflects relative mRNA abundance. For each gene studied, the collective data from three independent experiments are visually represented in a heat map (Table 1) in which upregulation is represented in red, downregulation in green, and no change in black. Analysis of the 960 unique clones revealed that 118 showed a change in intensity of twofold or greater (Table 1). These 118 clones were sequenced and characterized by means of JGI and NCBI database searches; genes showing less than a twofold change in intensity were not characterized further. The constitutively expressed pcf8-13 gene was included as a control. The expression patterns of the genes selected for characterization are described below.
TABLE 1.
Gene identification and expression profiles of selected genes
| Name
|
Description
|
NCBI accession no.
|
JGI v3.0 gene model name ID
|
Microarray heat mapa
|

|
||||||
|---|---|---|---|---|---|---|---|---|---|---|---|
| Acid shock (assembly)
|
IBMX (disassembly)
|
||||||||||
| 0′ | 30′ | 60′ | 90′ | 0′ | 30′ | 60′ | 90′ | ||||
| Cellular processes and signaling | |||||||||||
| Cell motility | |||||||||||
| DHC1bc | Dynein heavy chain 1 α (PF9) | AJ243806.1 | estExt_GenewiseH_1.C_880001 | 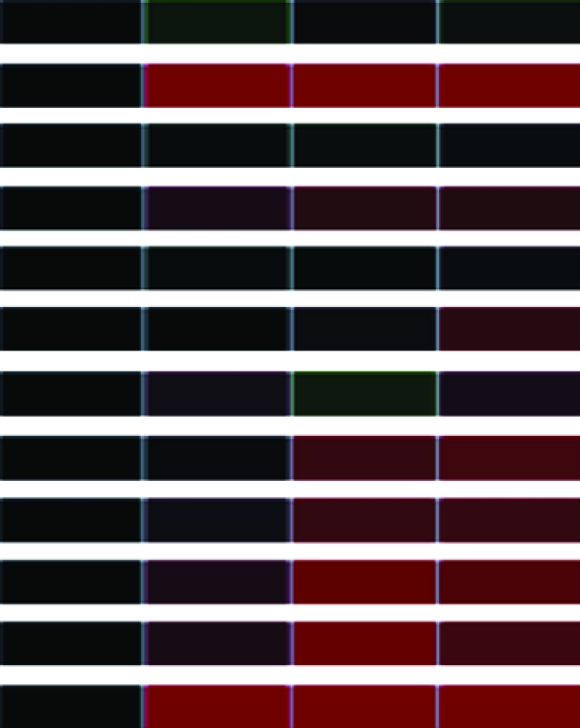 |
 |
||||||
| DLC7bc | LC7b, similar to the Roadblock/LC7 family | AY457969 | SAN_chlre3.20.7.3.11 | ||||||||
| IFT52bc | Intraflagellar transport 52 (BLD1) | AF420244 | estExt_fgenesh1_pm.C_150001 | ||||||||
| PF16c | Central pair-associated protein | U40057 | e_gwH.23.36.1 | ||||||||
| RSP3bc | Radial spoke protein 3 | X14549 | estExt_gwp_1W.C_260138 | ||||||||
| RSP4bc | Radial spoke protein 4 | M87526 | estExt_fgenesh1_pm.C_60005 | ||||||||
| RSP6bc | Radial spoke protein 6 | M87526 | estExt_GenewiseH_1.C_60055 | ||||||||
| TUA1bc | α-Tubulin 1 | M11447 | estExt_gwp_1H.C_140050 | ||||||||
| TUA2c | α-Tubulin 2 | M11448 | estExt_fgenesh2_kg.C_860004 | ||||||||
| TUB1bcd | β-Tubulin 1 | M10064 | estExt_gwp_1H.C_200099 | ||||||||
| TUB2bcd | β-Tubulin 2 | K03281 | estExt_gwp_1H.C_200090 | ||||||||
| VFL2bc | Centrin (caltractin) | X57973 | acegs_kg.scaffold_48000029 | ||||||||
| Post-translational modification, protein turnover, chaperones | |||||||||||
| HSP22A | Heat-shock protein 22A | X15053 | estExt_gwp_1W.C_60086 |  |
 |
||||||
| HSP22B | Heat-shock protein 22B | Chlre2_kg.scaffold_6000241 | |||||||||
| HSP22D | Heat-shock protein 22D | estExt_fgenesh2_pg.C_10198 | |||||||||
| HSP90A | Heat-shock protein 90A, localized to cytosol | estExt_gwp_1W.C_250014 | |||||||||
| HSP90C | Heat-shock protein 90C, localized to chloroplast | AY705371 | Chlre2_kg.scaffold_83000033 | ||||||||
| FAP277c | Flagellar-associated protein, protease inhibitor | SKA_Chlre2_kg.scaffold_28000189 | |||||||||
| LF4c | Long flagella protein | AY231293 | Chlre2_kg.scaffold_2000376 | ||||||||
| —e | Tyrosine-specific protein phosphatase | estExt_fgenesh2_pg.C_60262 | |||||||||
| —e | Unknown: AMPKbeta_GBD_like | fgenesh2_kg.C_scaffold_22000004 | |||||||||
| Signal transduction mechanisms | |||||||||||
| CRT2 | Calreticulin 2 | AJ000765 | estExt_GenewiseW_1.C_10142 | 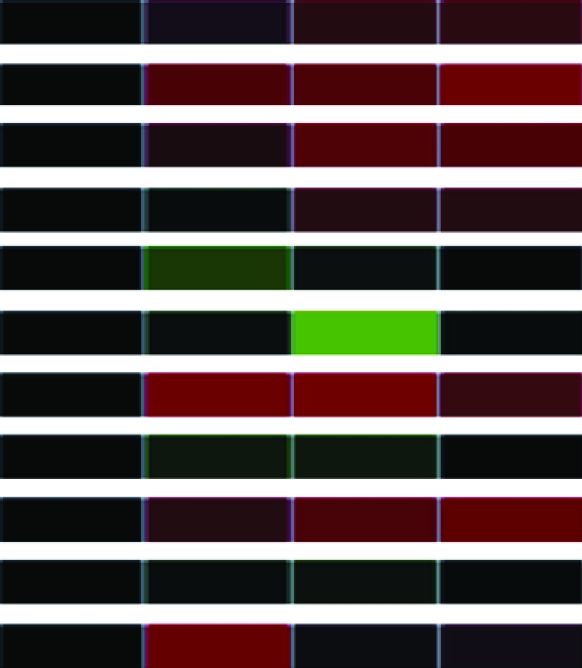 |
 |
||||||
| FAP12c | Flagellar-associated, lipase domain (pcf3-21) | estExt_fgenesh2_kg.C_240073 | |||||||||
| —e | G-protein-coupled seven transmembrane receptor | estExt_gwp_1H.C_310074 | |||||||||
| —de | GPR1/FUN34/yaaH, five transmembrane domains | e_gwH.13.239.1 | |||||||||
| —e | GPR1/FUN34/yaaH, six transmembrane domains | estExt_gwp_1W.C_130172 | |||||||||
| GUN4 | Similar to Gun4 (genomes uncoupled 4) | SKA_estExt_fgenesh2_pg.C_60106 | |||||||||
| MIPSd | Myo-inositol-1-phosphate synthase | estExt_fgenesh2_pg.C_90007 | |||||||||
| NDA3b | Putative mitochondrial NADH dehydrogenase | PIE_e_gwH.76.22.1 | |||||||||
| —de | Putative membrane protein, five transmembrane domains | estExt_fgenesh2_pg.C_20320 | |||||||||
| RACK1b | Receptor of activated protein kinase C 1 (pcf8-13) | e_gwH.38.29.1 | |||||||||
| —de | Thylakoid membrane protein, PGR5-like | estExt_gwp_1H.C_60062 | |||||||||
| Intracellular trafficking, secretion, vesicular transport | |||||||||||
| ARFA1ac | Small Arf-related GTPase | U27120 | estExt_fgenesh2_kg.C_110094 |  |
 |
||||||
| RABE1 | Small Rab-related GTPase | SAN_163210 | |||||||||
| Information storage and processing | |||||||||||
| Translation, ribosomal structure, and biogenesis | |||||||||||
| IF4Ac | Putative eukaryotic IF4A subunit (EIF41) | estExt_fgenesh2_pg.C_120244 | 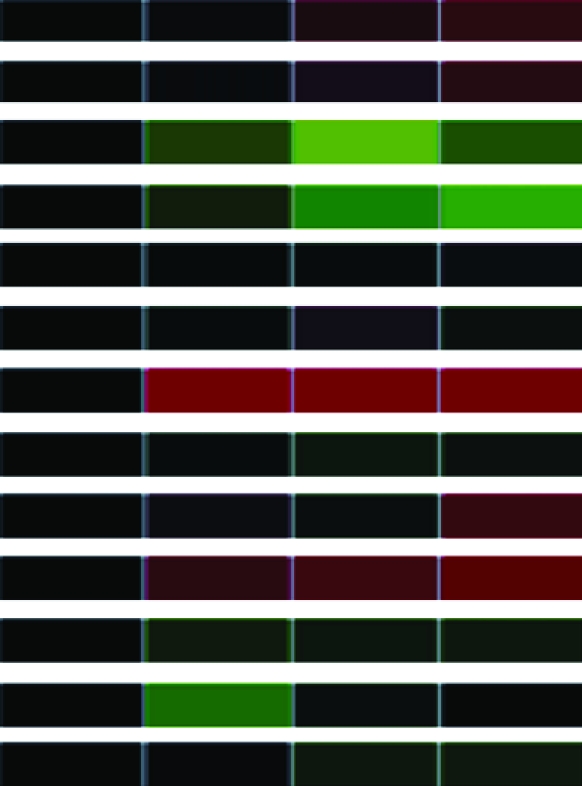 |
 |
|||||||
| MTT1 | Mitochondrial transcription termination factor like | estExt_fgenesh2_kg.C_390018 | |||||||||
| NOP56 | Nucleolar protein, component of C/D snoRNPs | estExt_gwp_1H.C_310180 | |||||||||
| PRPL7/L12 | Chloroplast ribosomal protein L7/L12 | e_gwH.2.436.1 | |||||||||
| RPL13 | Ribosomal protein L13 | estExt_gwp_1H.C_170118 | |||||||||
| RPL15 | Ribosomal protein L15 | estExt_GenewiseW_1.C_70201 | |||||||||
| RPL17 | Ribosomal protein L17 | estExt_GenewiseW_1.C_20197 | |||||||||
| RPL23a | Ribosomal protein L23a | fgenesh2_pg.C_scaffold_26000093 | |||||||||
| RPL27a | Ribosomal protein L27a | acegs_kg.scaffold_5000022 | |||||||||
| RPS16 | Ribosomal protein S16 | MAY_e_gwW.2.213.1 | |||||||||
| RPS19 | Ribosomal protein S19 | Chlre2_kg.scaffold_5000208 | |||||||||
| RPS3a | Ribosomal protein S3a | fgenesh2_pg.C_scaffold_2000130 | |||||||||
| —e | Small subunit ribosomal RNA-18S rDNA | M32703 | estExt_gwp_1H.C_4800003f | ||||||||
| Transcription | |||||||||||
| FAP280cd | Flagellar-associated, transcriptional coactivator-like | estExt_GenewiseW_1.C_50164 |  |
 |
|||||||
| —de | Putative zinc-finger protein, A20-like and AN1-like | OVA_e_gwH.25.97.1 | |||||||||
| —e | Putative zinc-finger domain, RING | Chlre2_kg.scaffold_11000031 | |||||||||
| Metabolism | |||||||||||
| Energy production and conversion | |||||||||||
| ANT1d | Adenine nucleotide translocator 1 | X65194 | JLM_estExt_gwp_1W.C_250131 | 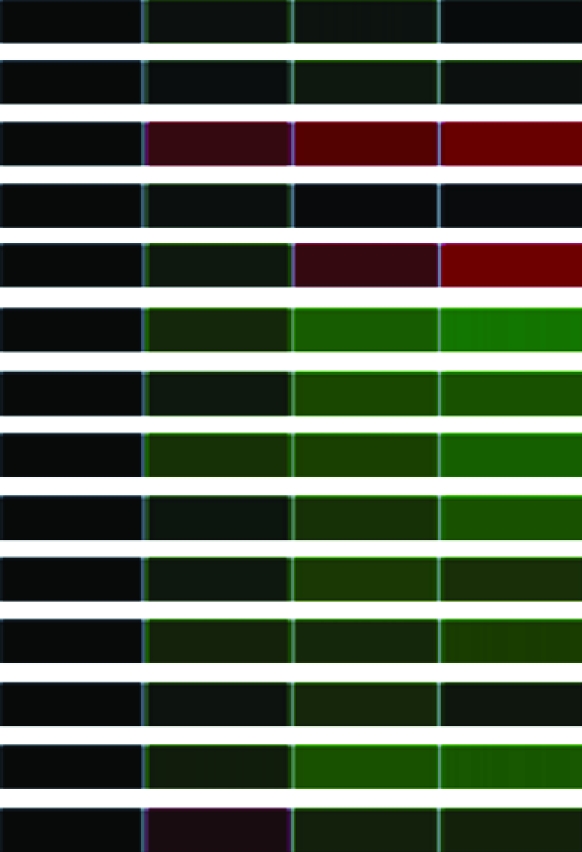 |
 |
||||||
| COX2b | Cytochrome c oxidase subunit IIb (2b) | AF305540 | estExt_fgenesh2_pg.C_10741 | ||||||||
| CYB5_1 | Putative cytochrome b5 protein | estExt_gwp_1H.C_370036 | |||||||||
| GRX3 | Glutaredoxin 3, CGFS type, probably chloroplastic | estExt_fgenesh2_pg.C_810010 | |||||||||
| ICL1c | Isocitrate lyase | U18765 | estExt_fgenesh2_pg.C_260094 | ||||||||
| LHCA2 | Light-harvesting protein of photosystem I | Chlre2_kg.scaffold_11000154 | |||||||||
| LHCA5 | Light-harvesting protein of photosystem I | DQ370095 | estExt_fgenesh2_pg.C_80188 | ||||||||
| LHCB5 | Minor chlorophyll a-b-binding protein of PSII (CP26) | AB050007 | estExt_fgenesh2_kg.C_280035 | ||||||||
| LHCBM2d | Light-harvesting complex II chlorophyll a-b binding | AB051205 | estExt_fgenesh2_kg.C_200058 | ||||||||
| LHCBM3d | Light-harvesting complex II chlorophyll a-b binding M3 | AB051208 | estExt_fgenesh2_pg.C_940011 | ||||||||
| LHCBM9d | Light-harvesting complex II chlorophyll a-b binding | AF495472 | estExt_fgenesh2_kg.C_260046g | ||||||||
| PSAH | Subunit H of photosystem I (protein P28) | X15164 | estExt_fgenesh2_kg.C_100106 | ||||||||
| PSAI | Photosystem I subunit VIII, chloroplast-targeted | Chlre2_kg.scaffold_9000287 | |||||||||
| PTOX2 | Putative plastid terminal oxidase | AF494290 | SKA_estExt_fgenesh2_pg.C_90141 | ||||||||
| Amino acid transport and metabolism | |||||||||||
| —e | Asp/Glu racemase | estExt_fgenesh2_kg.C_10277 |  |
 |
|||||||
| HPD2 | 4-Hydroxyphenylpyruvate dioxygenase | AJ431261 | Chlre2_kg.scaffold_23000178 | ||||||||
| Carbohydrate transport and metabolism | |||||||||||
| PFK2 | Phosphofructokinase family (EC 2.7.1.11 or 2.7.1.90) | MHS_estExt_gwp_1W.C_200088 |  |
 |
|||||||
| RBCS2B | RuBisCO small subunit 2 | X04472 | estExt_GenewiseH_1.C_790027 | ||||||||
| UPTG1 | UDP-glucose:protein transglucosylase | estExt_fgenesh2_pg.C_20070 | |||||||||
| Coenzyme transport and metabolism | |||||||||||
| PDX1 | Pyridoxin biosynthesis protein | estExt_fgenesh2_pg.C_590022 | |||||||||
| Lipid transport and metabolism | |||||||||||
| SPT1 | Serine palmitoyltransferase | e_gwW.15.128.1 | |||||||||
| Ion transport and metabolism | |||||||||||
| ATS1 | ATP-sulfurylase | U57088 | HAL_estExt_fgenesh2_kg.C_190083 |  |
 |
||||||
| COP3d | Light-gated proton channel rhodopsin | AF508967 | Chlre2_kg.scaffold_43000011 | ||||||||
| Secondary metabolite biosynthesis, transport, and catabolism | |||||||||||
| HDS | 1-Hydroxy-2-methyl-2-(E)-butenyl4-diphosphate synthase | AY860817 | estExt_GenewiseH_1.C_110006 |  |
 |
||||||
| LAO1 | l-Amino acid oxidase | U78797 | estExt_fgenesh2_kg.C_200072 | ||||||||
| Poorly characterized | |||||||||||
| General function prediction only | |||||||||||
| CP12 | Small polypeptide associating with GAPDH and PRK | Chlre2_kg.scaffold_21000100 | 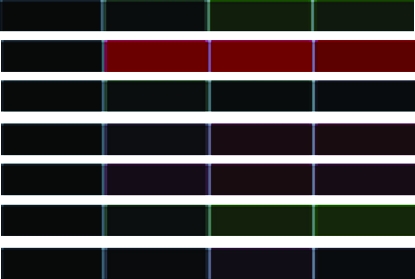 |
 |
|||||||
| FAP294c | Flagellar-associated coiled-coil protein | estExt_fgenesh2_pg.C_250096 | |||||||||
| FTTc | Fourteen-three-three, 14-3-3-like protein GF14 nu | X79445 | estExt_fgenesh2_kg.C_800003 | ||||||||
| LCI12 | Low-CO2-inducible protein | acegs_kg.scaffold_389000001 | |||||||||
| SMT1 | Similar to sterol-C24-methyltransferase | fgenesh2_kg.C_scaffold_11000008 | |||||||||
| ULP1 | Uncharacterized lumenal polypeptide | X96877 | estExt_fgenesh2_pg.C_10774 | ||||||||
| —e | Unknown, patatin domain | Chlre2_kg.scaffold_19000064 | |||||||||
| Function unknown | |||||||||||
| —e | Unknown | fgenesh2_pg.C_scaffold_60000034 | 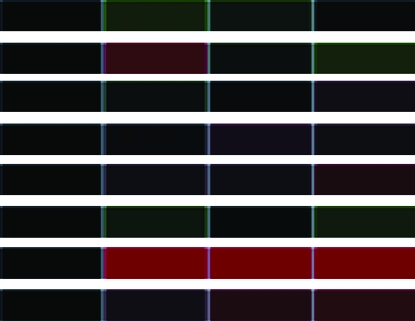 |
 |
|||||||
| —e | Unknown | estExt_fgenesh2_kg.C_710007 | |||||||||
| —e | Unknown | estExt_fgenesh2_pg.C_230120 | |||||||||
| —e | Unknown | estExt_fgenesh2_pg.C_20470 | |||||||||
| —e | Unknown, three transmembrane domains | estExt_fgenesh2_kg.C_70077 | |||||||||
| —e | Unknown, eight transmembrane domains | Chlre2_kg.scaffold_12000168 | |||||||||
| —e | Unknown | OVA_Chlre2_kg.scaffold_21000142 | |||||||||
| Chlre2_kg.scaffold_8000021f | |||||||||||
| —e | Unknown, phosphoprotein-like | Chlre2_kg.scaffold_124000001 | |||||||||
Clones (118) sequenced and characterized by JGI and NCBI database searches were grouped into eukaryotic orthologous groups. Heat maps show relative mRNA abundance at each time point compared to that of untreated cells. Upregulation is represented in red, downregulation in green, and no change in black.
Heat maps generated using GeneSifter represent the collective data from three independent experiments.
PCR products were included on microarray for control purposes.
Found in the flagellar proteome according to Pazour et al. (2005) and/or JGI.
Genes represent more than one clone on microarray.
Genes not yet named.
Maps to multiple scaffolds on JGI.
Also maps on JGI to LHCBM4 (estExt_fgenesh2_pg.C_260118) and to LHCBM6 (estEXT_fgenesh2_kg.C_260057).
Microarray expression profiling of flagellar assembly and disassembly:
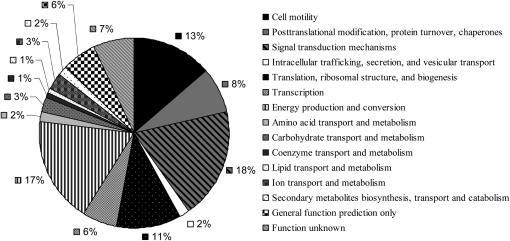
Our genomic expression profiling uncovered differential expression of several genes involved in the cellular response to flagellar assembly and disassembly. We organized these genes into four eukaryotic orthologous groups (KOG): cellular processes and signaling, information storage and processing, metabolism, and poorly characterized genes (Table 1). Within each category, genes were subcategorized on the basis of their cellular or molecular functions. Figure 2 displays the distribution in each subcategory. The largest groups included cell motility (13%), energy production and conversion (17%), and signal transduction mechanisms (18%).
Figure 2.—
Distribution into eukaryotic orthologous groups of the 118 clones on the microarray whose mRNAs exhibited at least a twofold change in abundance. Also included is the RACK1 clone, which showed no differential expression. Categories listed in the key correspond to sectors of the graph shown clockwise from the top. The largest eukaryotic orthologous groups included cell motility (13%), energy production and conversion (17%), and signal transduction mechanisms (18%).
The levels of α- and β-tubulin mRNA abundance increased after acid shock (Table 1), confirming previous studies of α- and β-tubulin expression during flagellar assembly (Lefebvre et al. 1980; Silflow et al. 1982; Baker et al. 1984; Cheshire et al. 1994; Schloss et al. 1984; Evans and Keller 1997; Stolc et al. 2005). In contrast, the abundance of α- and β-tubulin mRNA decreased during flagellar disassembly (Table 1), confirming previous in vitro translation studies (Lefebvre et al. 1980; Silflow et al. 1982).
We also extended the expression profile of disassembly to include other structural components of the flagellum. For example, cell motility genes (including but not limited to structural genes of the flagellum) encoding radial spoke proteins; the central pair-associated protein PF16; and DLC7b, a member of the LC7/Roadblock family of dynein light chains, demonstrated downregulation during flagellar disassembly (Table 1). Genes in several other gene categories—for example, signal transduction genes, such as calreticulin (CRT) and myo-inositol-1-phosphate synthase (MIPS), and several transmembrane receptors—also displayed mRNA abundance decreases during flagellar disassembly (Table 1).
Genes in other categories showed different expression patterns. For example, genes encoding components of the light-harvesting complex (LHC) showed a similar downregulation of expression during both assembly and disassembly (Table 1). In contrast, genes encoding the heat-shock proteins (HSPs) 22B, 22D, and 90C each showed a unique expression pattern (Table 1). These genes have not previously been associated with flagellar structure or function, so this result suggests a new potential expression network associated with changes in flagellar length.
qRT–PCR expression profiling of selected genes:
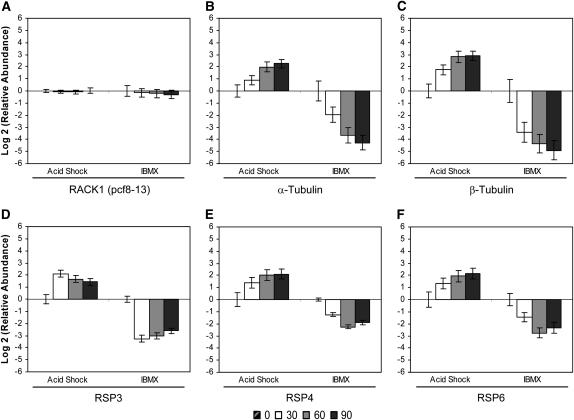
We selected several genes from various categories that demonstrated differential regulation in the microarray assay for characterization at higher resolution by qRT–PCR. The Chlamydomonas β-subunit-like polypeptide (CβLP/pcf8-13) (Schloss 1990) was used as an endogenous control because it is constitutively expressed during flagellar assembly as shown here in Figure 3A and previously (Schloss et al. 1984; Schloss 1990; Cheshire et al. 1994; Evans and Keller 1997). Sequence analysis revealed that pcf8-13 (CβLP) is RACK1, a receptor of activated protein kinase C 1 (data not shown). RACK1 was constitutively expressed throughout the time course of flagellar disassembly (Figure 3A).
Figure 3.—
Change in relative mRNA abundance of cell-motility genes during flagellar assembly (acid shock) and disassembly (IBMX) as measured by qRT–PCR. Relative abundance for each gene was determined by the 2−ΔΔCt method. Fold change and standard error were log transformed for graphical representation. (A) RACK1 (pcf8-13) showed no change in relative mRNA abundance during flagellar assembly or disassembly and was used as the endogenous control for calculation of relative abundance. Changes in relative mRNA abundance for time points 30, 60, and 90 min after stimulation, standardized to untreated cells, were determined for (B) α-tubulin, (C) β-tubulin, (D) RSP3, (E) RSP4, and (F) RSP6.
Cellular processes and signaling—cell motility:
We chose the well-characterized structural genes α- and β-tubulin for further analysis with qRT–PCR. Because of sequence similarity in the genes encoding the two α-tubulins (Silflow et al. 1985) and two β-tubulins (Youngblom et al. 1984), the relative mRNA abundance changes represent the contribution of both genes for each tubulin. As expected, the transcript levels of α- and β-tubulin increased during flagellar assembly and conversely decreased during disassembly, but the relative changes in α- and β-tubulin mRNA abundance were greater during disassembly (Figure 3, B and C). In addition, β-tubulin mRNA abundance was greater than that of α-tubulin during both assembly and disassembly (Figure 3, B and C).
To expand the expression profile of structural genes during flagellar disassembly, we assessed the relative levels of radial spoke protein (RSP) mRNAs. Radial spoke proteins form a structural complex in the flagellum essential for motility as well as signal transduction (Yang et al. 2006). mRNAs encoding RSP3, a component of the radial spoke stalk (Luck et al. 1977; Williams et al. 1989; Diener et al. 1993), and RSP4 and RSP6, components of the radial spoke head, showed increased abundance during assembly in previous studies (Williams et al. 1986; Curry et al. 1992). We demonstrated that, after IBMX treatment, RSP3, RSP4, and RSP6 mRNA abundances decreased during flagellar disassembly (Figure 3, D, E, and F). In both acid shock and IBMX, the kinetics of RSP3 expression differed somewhat from those of RSP4 and RSP6. By 30 min, RSP3 reached its maximal change in mRNA abundance and then declined (Figure 3D). In contrast, RSP4 and RSP6 transcripts were maximally expressed later in the time course at 60 min (Figure 3, E and F). Because the RSP4 and RSP6 genes encode components of the same complex, the similarity of their expression profiles is reasonable.
Flagellar-associated genes:
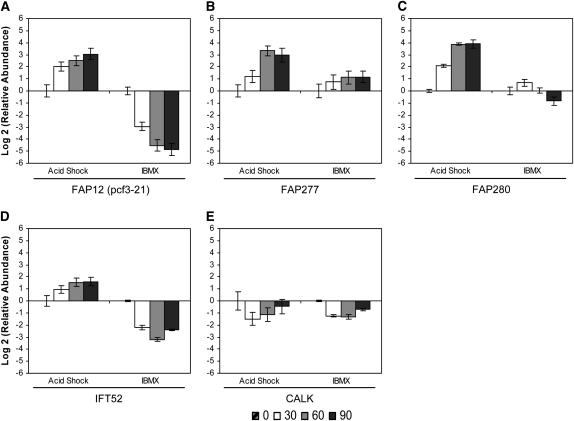
We profiled expression of several less well-characterized genes recently shown to be present in the flagellar proteome (Pazour et al. 2005). FAP12, a partially characterized flagellar-associated protein with a lipase domain, was downregulated during flagellar disassembly to a greater degree than it was upregulated during assembly (Figure 4A). In our study, FAP12 mRNA reached its maximal abundance 90 min after either stimulation. We also found that FAP12 and pcf3-21, characterized in a previous study (Schloss et al. 1984), are encoded by the same gene (data not shown). In accordance with previous work (Schloss et al. 1984; Evans and Keller 1997; supplemental data for Pazour et al. 2005), the FAP12 (pcf3-21) gene was strongly upregulated during flagellar assembly and showed an expression profile similar to those of the major flagellar structural components.
Figure 4.—
Change in relative mRNA abundance of flagellar-associated genes during flagellar assembly (acid shock) and disassembly (IBMX) as measured by qRT–PCR. Relative abundance for each gene was determined by the 2−ΔΔCt method. Fold change and standard error were log transformed for graphical representation. Changes in relative mRNA abundance for time points 30, 60, and 90 min after stimulation, standardized to untreated cells, were determined for (A) FAP12, (B) FAP277, (C) FAP280, (D) IFT52, and (E) CALK.
Two other flagellar associated genes, FAP277 and FAP280, each showed a unique pattern of expression (Figure 4, B and C) and are thus exceptions to the characteristic profile of upregulation during assembly and downregulation during disassembly. The FAP277 gene was upregulated during both disassembly and assembly, but the magnitude of the mRNA abundance change during disassembly was less than half that during assembly (Figure 4B). In addition, a distinct increase in relative abundance occurred between 30 and 60 min during assembly but was not evident during disassembly. The FAP280 gene exhibited a more complex pattern. Its abundance was slightly increased 30 min into flagellar disassembly but returned to baseline by 60 min and then decreased by 90 min (Figure 4C). Therefore, not all genes associated with the flagellar proteome show the coordinated pattern of abundance upregulation during assembly and downregulation during disassembly.
Intraflagellar transport (IFT) plays important roles in flagellar assembly and disassembly. It transports flagellar components along the length of the axoneme (reviewed by Scholey 2003) and may act to regulate length (Marshall and Rosenbaum 2001; Marshall et al. 2005). IFT52 (BLD1/osm-6), an essential component for flagellar assembly (Brazelton et al. 2001), has been localized predominately around the basal body in two horseshoe-shaped rings (Deane et al. 2001). We found that the IFT52 gene was downregulated maximally at 60 min during disassembly (Figure 4D). In contrast, it was upregulated during assembly and maintained elevated expression as flagella reached pretreatment lengths (Figure 4D). We have therefore confirmed earlier reports of the abundance increase of IFT52 mRNA after flagellar loss (Brazelton et al. 2001; Stolc et al. 2005) and have extended the expression profile to include the 60- and 90-min time points (Figure 4D).
CALK, a Chlamydomonas aurora kinase, is a crucial element in the cell's ability to regulate flagellar excision and disassembly (Pan et al. 2004). CALK mRNA abundance decreased at 30 min in both assembly and disassembly but returned to near-pretreatment levels at 90 min (Figure 4E). Pan et al. (2004) demonstrated that the CALK protein acts in an early step in both flagellar loss and disassembly, so its downregulation is correlated with downregulation of its activity later in both assembly and disassembly.
Cellular processes and signaling—intracellular trafficking:
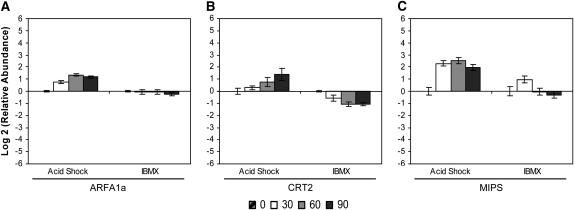
We also found effects on expression of genes whose products are involved in a variety of other cellular activities beyond an association with flagellar function. Members of the ARF (ADP-ribosylation factor) family function in membrane trafficking (Nie and Randazzo 2006) and have known homologs linked to human ciliary disease. In C. reinhardtii, ARFA1a mRNA abundance decreased slightly during flagellar disassembly (Figure 5A), but during assembly, the relative abundance of ARFA1a mRNA clearly increased (Figure 5A). ARFA1a mRNA abundance reached its maximal at 60 min into flagellar assembly and then began to decline by 90 min (Figure 5A).
Figure 5.—
Change in relative mRNA abundance of cellular processes and signaling genes during flagellar assembly (acid shock) and disassembly (IBMX) as measured by qRT–PCR. Relative abundance for each gene was determined by the 2−ΔΔCt method. Fold change and standard error were log transformed for graphical representation. Changes in relative mRNA abundance for time points 30, 60, and 90 min after stimulation, standardized to untreated cells, were determined for (A) small ARF-related GTPase (ARFA1a), (B) CRT2, and (C) MIPS.
Cellular processes and signaling—signal transduction mechanisms:
Previous work from our lab has demonstrated that the processes of flagellar excision, gene induction, and outgrowth are each independently regulated by calcium (Ca2+) (Cheshire and Keller 1991; Cheshire et al. 1994). Calreticulin (CRT2) is a calcium-binding protein localized to the endoplasmic/sarcoplasmic reticulum (reviewed by Michalak et al. 1992). The relative abundance of CRT2 mRNA decreased by 30 min into flagellar disassembly and then plateaued throughout the remainder of the time course (Figure 5B). In contrast, the relative abundance of CRT2 mRNA steadily increased to a peak at 90 min during assembly (Figure 5B).
The gene encoding MIPS (EC 5.5.1.4), the first enzyme in the biosynthesis of inositol (Majumder et al. 2003), exhibited a unique pattern of mRNA abundance during flagellar assembly and disassembly. During disassembly, the relative abundance of MIPS mRNA increased at 30 min but then was downregulated to pretreatment levels by 60 and 90 min (Figure 5C). In contrast, during flagellar assembly, MIPS mRNA abundance increased by 30 min, peaked, and then had begun to decline at 90 min (Figure 5C).
Metabolism—energy production and conversion:
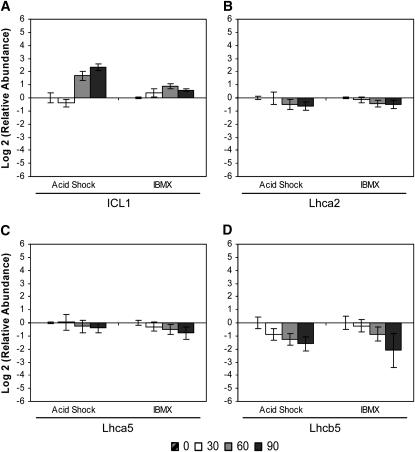
Several metabolism-related genes displayed similar expression profiles during both assembly and disassembly of the flagellum. The abundance of mRNA encoding isocitrate lyase (ICL1; EC 4.1.3.1), an enzyme in the glyoxylate pathway, increased after both acid shock and IBMX treatment (Figure 6A), whereas mRNAs encoding components of the photosynthetic apparatus decreased (Figure 6, B–D). The abundance of Lhca2 and Lhca5 mRNAs, encoding polypeptides of photosystem I (Elrad and Grossman 2004), showed similar decreases (Figure 6, B and C). Expression of Lhcb5 mRNA, encoding CP26 of the minor chlorophyll a-b binding protein of photosystem II (Minagawa et al. 2001; Elrad and Grossman 2004), decreased to a greater magnitude than that of Lhca2 and Lhca5 (Figure 6D). The expression profiles of the LHC genes therefore reveal coregulation of the individual components and suggest a common regulatory mechanism in response to external stimuli.
Figure 6.—
Change in relative mRNA abundance of metabolism-related genes during flagellar assembly (acid shock) and disassembly (IBMX) as measured by qRT–PCR. Relative abundance for each gene was determined by the 2−ΔΔCt method. Fold change and standard error were log transformed for graphical representation. Changes in relative mRNA abundance for time points 30, 60, and 90 min after stimulation, standardized to untreated cells, were determined for (A) ICL1, (B) light-harvesting protein of PSI (Lhca2), (C) light-harvesting protein of PSI (Lhca5), and (D) minor chlorophyll a-b binding protein of PSII (Lhcb5/CP26).
DISCUSSION
Microarray technology is generally agreed to be a valuable tool for high-throughput, parallel analysis of gene expression changes. Our custom microarray assay identified >100 clones showing distinct expression patterns. The products of these genes participate in activities such as cell motility, signal transduction, intracellular trafficking, and metabolism. Through characterization of these clones, we have established a global expression profile for flagellar disassembly.
As expected, we found expression of genes encoding major flagellar components during assembly, in accordance with many previous studies (Lefebvre et al. 1980; Silflow et al. 1982; Baker et al. 1984; Keller et al. 1984; Schloss et al. 1984). In addition, our comparison of assembly and disassembly expression profiles for known flagellar genes (Table 1) reveals an overall trend of increased expression during flagellar assembly and decreased expression during disassembly. Thus, our study has expanded the expression profile of disassembly to include other genes encoding structural components of the flagellum and has established a coordination between changes in gene expression and changes in flagellar length.
The flagellar proteome consists of known structural proteins, as well as less well-characterized signal transduction proteins and flagellar associated proteins (FAPs) (Pazour et al. 2005). The genes encoding some FAPs show regulation during assembly (Schloss et al. 1984; Pazour et al. 2005; Stolc et al. 2005), but whether these genes are regulated also during disassembly had not been explored before the study reported here. Among the genes we found to show regulation during assembly and disassembly are 21 whose products were identified by Pazour et al. (2005) as part of the flagellar proteome. For example, the expression profile of FAP12 is similar to that of known flagellar structural components. Alternatively, genes encoding the less well-characterized FAP277 and FAP280 exhibited unique regulation profiles that are not characteristic of known flagellar structural genes. Microarray technology has the ability to predict genes involved in regulatory networks on the basis of similar expression profiles (Derisi et al. 1997). The product of the FAP12 gene may therefore serve a structural role, whereas the products of FAP277 and -280 may play regulatory roles, perhaps in regulating flagellar length.
Among the genes that we identified as associated with flagellar assembly and disassembly are several linked to ciliary disease. For example, the ARFA1a gene showed a unique expression profile in C. reinhardtii during flagellar length changes. Other ARF family members have previously been linked to human ciliary disease. Scorpion, a zebrafish cystic kidney gene, is a small GTPase in the ARF family (Pazour et al. 2005) necessary for ciliary assembly (Sun et al. 2004). In addition, C. elegans ARL6, a member of the ARF-like (ARL) family of GTPases, is linked directly to Bardet–Beidl syndrome (Fan et al. 2004). ARL6 is specifically expressed in ciliated cells and undergoes bidirectional IFT (Fan et al. 2004). On the basis of the link between ARL6 and IFT, Fan et al. (2004) proposed a role in trafficking not only in the cytosol but also in the axoneme. The regulation of ARF expression that we found supports the possibility that ARF plays a similar role in C. reinhardtii IFT.
The expression profiles presented here demonstrate regulation of genes relating to information storage/processing and various types of metabolism, functions not normally associated with flagellar structure. These expression profiles yield clues to a molecular basis for the whole-cell response to stimulus-induced changes. The fact that only 21 of the 118 strongly regulated genes reported here are found in the flagellar proteome suggests that this whole-cell response is larger than previously recognized. For example, the expression profile that we constructed revealed upregulation of mRNAs encoding ICL1, a key enzyme in the glyoxylate pathway, and downregulation of mRNAs encoding the LHC components. Others (Zhang et al. 2004; Stolc et al. 2005; Moseley et al. 2006) have also noted the decrease in relative abundance of LHC genes in response to various stimuli. Petridou et al. (1997) showed that the relative abundance of ICL transcripts decreases within 30 min of exposure to light, suggesting a switch from stored energy (glyoxylate pathway) to photosynthetic energy use. We found a similar inverse relationship between the mRNA abundance of ICL and photosynthetic components in response to external stimuli. Cells may therefore switch to a stored form of energy while recovering from stimulation.
Our study characterizes known flagellar genes, flagellar-associated genes, and genes connected with the flagellum in ways not yet understood. This research begins to define the interrelationship between the cellular and molecular networks regulating flagellar length changes. Through global expression studies of the genes associated with flagellar assembly and disassembly, we can begin to dissect the intricacies of this complex organelle and to uncover fundamental regulatory mechanisms that are part of a whole-cell response to stimulation.
Acknowledgments
The authors thank Amber Brown, Holly Sikes, Danielle Sherdan, and Andre Irsigler for advice and assistance. This work represents partial fulfillment of the requirements for the dissertation of K.L.C. It was supported by a Florida State University (FSU) Committee on Faculty Research Support grant to L.R.K. and an FSU dissertation grant to K.L.C.
References
- Ainsworth, C., 2007. Cilia: tails of the unexpected. Nature 448 638–641. [DOI] [PubMed] [Google Scholar]
- Baker, E. J., J. A. Schloss and J. L. Rosenbaum, 1984. Rapid changes in tubulin RNA synthesis and stability induced by deflagellation in Chlamydomonas. J. Cell Biol. 99 2074–2081. [DOI] [PMC free article] [PubMed] [Google Scholar]
- Bowtell, D., and J. Sambrook, 2003. DNA Microarrays: A Molecular Cloning Manual. Cold Spring Harbor Laboratory Press, Cold Spring Harbor, NY.
- Brazelton, W. J., C. D. Amundsen, C. D. Silflow and P. A. Lefebvre, 2001. The bld1 mutation identifies the Chlamydomonas osm-6 homolog as a gene required for flagellar assembly. Curr. Biol. 11 1591–1594. [DOI] [PubMed] [Google Scholar]
- Cheshire, J. L., and L. R. Keller, 1991. Uncoupling of Chlamydomonas flagellar gene expression and outgrowth from flagellar excision by manipulation of Ca2+. J. Cell Biol. 115 1651–1659. [DOI] [PMC free article] [PubMed] [Google Scholar]
- Cheshire, J. L., J. H. Evans and L. R. Keller, 1994. Ca2+ signaling in the Chlamydomonas flagellar regeneration system: cellular and molecular responses. J. Cell Sci. 107 2491–2498. [DOI] [PubMed] [Google Scholar]
- Christensen, S. T., L. B. Pedersen, L. Schneider and P. Satir, 2007. Sensory cilia and integration of signal transduction in human health and disease. Traffic 8 97–109. [DOI] [PubMed] [Google Scholar]
- Curry, A. M., B. D. Williams and J. L. Rosenbaum, 1992. Sequence analysis reveals homology between two proteins of the flagellar radial spoke. Mol. Cell. Biol. 12 3967–3977. [DOI] [PMC free article] [PubMed] [Google Scholar]
- Davenport, J. R., and B. K. Yoder, 2005. An incredible decade for the primary cilium: a look at a once-forgotten organelle. Am. J. Physiol. Renal Physiol. 289 F1159–F1169. [DOI] [PubMed] [Google Scholar]
- Deane, J. A., D. G. Cole, E. S. Seeley, D. R. Diener and J. L. Rosenbaum, 2001. Localization of intraflagellar transport protein IFT52 identifies basal body transitional fibers as the docking site for IFT particles. Curr. Biol. 11 1586–1590. [DOI] [PubMed] [Google Scholar]
- DeRisi, J. L., V. R. Iyer and P. O. Brown, 1997. Exploring the metabolic and genetic control of gene expression on a genomic scale. Science 278 680–686. [DOI] [PubMed] [Google Scholar]
- Diener, D. R., L. H. Ang and J. L. Rosenbaum, 1993. Assembly of flagellar radial spoke proteins in Chlamydomonas: identification of the axoneme binding domain of radial spoke protein 3. J. Cell Biol. 123 183–190. [DOI] [PMC free article] [PubMed] [Google Scholar]
- Elrad, D., and A. R. Grossman, 2004. A genome's-eye view of the light-harvesting polypeptides of Chlamydomonas reinhardtii. Curr. Genet. 45 61–75. [DOI] [PubMed] [Google Scholar]
- Evans, J. H., and L. R. Keller, 1997. Calcium influx signals normal flagellar RNA induction following acid shock of Chlamydomonas reinhardtii. Plant Mol. Biol. 33 467–481. [DOI] [PubMed] [Google Scholar]
- Fan, Y., M. A. Esmail, S. J. Ansley, O. E. Blacque, K. Boroevich et al., 2004. Mutations in a member of the Ras superfamily of small GTP-binding proteins causes Bardet-Biedl syndrome. Nat. Genet. 36 989–993. [DOI] [PubMed] [Google Scholar]
- Hegde, P., R. Qi, K. Abernathy, C. Gay, S. Dharap et al., 2000. A concise guide to cDNA microarray analysis. BioTechniques 29 548–556. [DOI] [PubMed] [Google Scholar]
- Keller, L. R., J. A. Schloss, C. D. Silflow and J. L. Rosenbaum, 1984. Transcription of α- and β-tubulin genes in isolated Chlamydomonas nuclei. J. Cell Biol. 98 1138–1143. [DOI] [PMC free article] [PubMed] [Google Scholar]
- Lefebvre, P. A., S. A. Nordstrom, J. E. Moulder and J. L. Rosenbaum, 1978. Flagellar elongation and shortening in Chlamydomonas. IV. Effects of flagellar detachment, regeneration, and resorption on the induction of flagellar protein synthesis. J. Cell Biol. 78 8–27. [DOI] [PMC free article] [PubMed] [Google Scholar]
- Lefebvre, P. A., C. D. Silflow, E. D. Wieben and J. L. Rosenbaum, 1980. Increased levels of mRNAs for tubulin and other flagellar proteins after amputation or shortening of Chlamydomonas flagella. Cell 20 469–477. [DOI] [PubMed] [Google Scholar]
- Li, J. B., J. M. Gerdes, C. Haycraft, Y. Fan, T. M. Teslovich et al., 2004. Comparative genomics identifies a flagellar and basal body proteome that includes the BBS5 human disease gene. Cell 117 541–552. [DOI] [PubMed] [Google Scholar]
- Livak, K. J., and T. D. Schmittgen, 2001. Analysis of relative gene expression data using real-time quantitative PCR and the 2−ΔΔCt method. Methods 25 402–408. [DOI] [PubMed] [Google Scholar]
- Luck, D., G. Piperno, Z. Ramanis and B. Huang, 1977. Flagellar mutants of Chlamydomonas: studies of radial spoke-defective strains by dikaryon and revertant analysis. Proc. Natl. Acad. Sci. USA 74 3456–3460. [DOI] [PMC free article] [PubMed] [Google Scholar]
- Majumder, A. L., A. Chatterjee, K. Ghosh Dastidar and M. Majee, 2003. Diversification and evolution of L-myo-inositol 1-phosphate synthase. FEBS Lett. 553 3–10. [DOI] [PubMed] [Google Scholar]
- Marshall, W. F., and J. L. Rosenbaum, 2001. Intraflagellar transport balances continuous turnover of outer doublet microtubules: implications for flagellar length control. J. Cell Biol. 155 405–414. [DOI] [PMC free article] [PubMed] [Google Scholar]
- Marshall, W. F., H. Qin, M. R. Brenni and J. L. Rosenbaum, 2005. Flagellar length control system: testing a simple model based on intraflagellar transport and turnover. Mol. Biol. Cell 16 270–278. [DOI] [PMC free article] [PubMed] [Google Scholar]
- Michalak, M., R. E. Milner, K. Burns and M. Opas, 1992. Calreticulin. Biochem. J. 285 681–692. [DOI] [PMC free article] [PubMed] [Google Scholar]
- Minagawa, J., K. C. Han, N. Dohmae, K. Takio and Y. Inoue, 2001. Molecular characterization and gene expression of lhcb5 gene encoding CP26 in the light-harvesting complex II of Chlamydomonas reinhardtii. Plant Mol. Biol. 46 277–287. [DOI] [PubMed] [Google Scholar]
- Moseley, J. L., C. W. Chang and A. R. Grossman, 2006. Genome-based approaches to understanding phosphorus deprivation responses and PSR1 control in Chlamydomonas reinhardtii. Eukaryot. Cell 5 26–44. [DOI] [PMC free article] [PubMed] [Google Scholar]
- Nie, Z., and P. A. Randazzo, 2006. Arf GAPs and membrane traffic. J. Cell Sci. 119 1203–1211. [DOI] [PubMed] [Google Scholar]
- Pan, J., Q. Wang and W. J. Snell, 2004. An aurora kinase is essential for flagellar disassembly in Chlamydomonas. Dev. Cell 6 445–451. [DOI] [PubMed] [Google Scholar]
- Pan, J., Q. Wang and W. J. Snell, 2005. Cilium-generated signaling and cilia-related disorders. Lab. Invest. 85 452–463. [DOI] [PubMed] [Google Scholar]
- Pazour, G. J., B. L. Dickert, Y. Vucica, E. S. Seeley, J. L. Rosenbaum et al., 2000. Chlamydomonas IFT88 and its mouse homologue, polycystic kidney disease gene Tg737, are required for assembly of cilia and flagella. J. Cell Biol. 151 709–718. [DOI] [PMC free article] [PubMed] [Google Scholar]
- Pazour, G. J., N. Agrin, J. Leszyk and G. B. Witman, 2005. Proteomic analysis of a eukaryotic cilium. J. Cell Biol. 170 103–113. [DOI] [PMC free article] [PubMed] [Google Scholar]
- Petridou, S., K. Foster and K. Kindle, 1997. Light induces accumulation of isocitrate lyase mRNA in a carotenoid-deficient mutant of Chlamydomonas reinhardtii. Plant Mol. Biol. 33 381–392. [DOI] [PubMed] [Google Scholar]
- Rosenbaum, J. L., J. E. Moulder and D. L. Ringo, 1969. Flagellar elongation and shortening in Chlamydomonas: the use of cycloheximide and colchicine to study the synthesis and assembly of flagellar proteins. J. Cell Biol. 41 600–619. [DOI] [PMC free article] [PubMed] [Google Scholar]
- Sager, R., and S. Granick, 1953. Nutritional studies with Chlamydomonas reinhardtii. Ann. NY Acad. Sci. 56 831–838. [DOI] [PubMed] [Google Scholar]
- Schloss, J. A., 1990. A Chlamydomonas gene encodes a G protein β subunit-like polypeptide. Mol. Gen. Genet. 221 443–452. [DOI] [PubMed] [Google Scholar]
- Schloss, J. A., C. D. Silflow and J. L. Rosenbaum, 1984. mRNA abundance changes during flagellar regeneration in Chlamydomonas reinhardtii. Mol. Cell. Biol. 4 424–434. [DOI] [PMC free article] [PubMed] [Google Scholar]
- Scholey, J. M., 2003. Intraflagellar transport. Annu. Rev. Cell Dev. Biol. 19 423–443. [DOI] [PubMed] [Google Scholar]
- Silflow, C. D., P. A. Lefebvre, T. W. McKeithan, J. A. Schloss, L. R. Keller et al., 1982. Expression of flagellar protein genes during flagellar regeneration in Chlamydomonas. Cold Spring Harb. Symp. Quant. Biol. 46 157–169. [DOI] [PubMed] [Google Scholar]
- Silflow, C. D., R. L. Chisholm, T. W. Conner and L. P. Ranum, 1985. The two alpha-tubulin genes of Chlamydomonas reinhardi code for slightly different proteins. Mol. Cell. Biol. 5 2389–2398. [DOI] [PMC free article] [PubMed] [Google Scholar]
- Stolc, V., M. P. Samanta, W. Tongprasit and W. F. Marshall, 2005. Genome-wide transcriptional analysis of flagellar regeneration in Chlamydomonas reinhardtii identifies orthologs of ciliary disease genes. Proc. Natl. Acad. Sci. USA 102 3703–3707. [DOI] [PMC free article] [PubMed] [Google Scholar]
- Sun, Z., A. Amsterdam, G. J. Pazour, D. G. Cole, M. S. Miller et al., 2004. A genetic screen in zebrafish identifies cilia genes as a principal cause of cystic kidney. Development 131 4085–4093. [DOI] [PubMed] [Google Scholar]
- Williams, B. D., D. R. Mitchell and J. L. Rosenbaum, 1986. Molecular cloning and expression of flagellar radial spoke and dynein genes of Chlamydomonas. J. Cell Biol. 103 1–11. [DOI] [PMC free article] [PubMed] [Google Scholar]
- Williams, B. D., M. A. Velleca, A. M. Curry and J. L. Rosenbaum, 1989. Molecular cloning and sequence analysis of the Chlamydomonas gene coding for radial spoke protein 3: flagellar mutation pf-14 is an ochre allele. J. Cell Biol. 109 235–245. [DOI] [PMC free article] [PubMed] [Google Scholar]
- Witman, G. B., K. Carlson, J. Berliner and J. L. Rosenbaum, 1972. Chlamydomonas flagella: I. Isolation and electrophoretic analysis of microtubules, matrix, membranes, and mastigonemes. J. Cell Biol. 54 507–539. [DOI] [PMC free article] [PubMed] [Google Scholar]
- Yang, P., D. R. Diener, C. Yang, T. Kohno, G. J. Pazour et al., 2006. Radial spoke proteins of Chlamydomonas flagella. J. Cell Sci. 119 1165–1174. [DOI] [PMC free article] [PubMed] [Google Scholar]
- Yang, Y. H., and T. Speed, 2002. Design issues for cDNA microarray experiments. Nat. Rev. Genet. 3 579–588. [DOI] [PubMed] [Google Scholar]
- Youngblom, J., J. A. Schloss and C. D. Silflow, 1984. The two beta-tubulin genes of Chlamydomonas reinhardtii code for identical proteins. Mol. Cell. Biol. 4 2686–2696. [DOI] [PMC free article] [PubMed] [Google Scholar]
- Yue, H., P. S. Eastman, B. B. Wang, J. Minor, M. H. Doctolero et al., 2001. An evaluation of the performance of cDNA microarrays for detecting changes in global mRNA expression. Nucleic Acids Res. 29 E41. [DOI] [PMC free article] [PubMed] [Google Scholar]
- Zhang, Z., J. Shrager, M. Jain, C. W. Chang, O. Vallon et al., 2004. Insights into the survival of Chlamydomonas reinhardtii during sulfur starvation based on microarray analysis of gene expression. Eukaryot. Cell 3 1331–1348. [DOI] [PMC free article] [PubMed] [Google Scholar]


