

Summary
As many key proteins evade crystallization and remain too large for nuclear magnetic resonance spectroscopy, electron paramagnetic resonance (EPR) spectroscopy combined with site-directed spin labeling offers an alternative approach for obtaining structural information. Such information must be translated into geometric restraints to be used in computer simulations. Here, distances between spin labels are converted into distance ranges between β-carbons using a “motion-on-a-cone” model, and a linear-correlation model links spin label accessibility to the number of neighboring residues. This approach was tested on T4-lysozyme and αA-crystallin with the de novo structure prediction algorithm Rosetta. The results demonstrate the feasibility of obtaining highly-accurate, atomic-detail models from EPR data by yielding 1.0Å and 2.6Å full-atom models, respectively. Distance restraints between amino acids far apart in sequence but close in space are most valuable for structure determination. The approach can be extended to other experimental techniques such as fluorescence spectroscopy, substituted cysteine accessibility method, or mutational studies.
Introduction
The accelerated pace of genome sequencing has sparked the development of rapid structure determination methods and ambitious proposals for genome-scale structure determination utilizing primarily X-ray crystallography and nuclear magnetic resonance (NMR) spectroscopy (Stevens, Yokoyama et al. 2001; Berman, Battistuz et al. 2002; Lesley, Kuhn et al. 2002; Westbrook, Feng et al. 2003). However, it has become clear that static and dynamic structural information for a significant subspace of the protein universe continues to evade these tools. Important examples include the static structure of membrane proteins (Tusnady, Dosztanyi et al. 2004), conformationally heterogeneous water-soluble proteins (Haley, Bova et al. 2000), and large protein complexes involved in major cellular processes (Harrison 2004). Insight into conformational motions that mediate function is restricted to proteins amenable to NMR spectroscopy or to crystallization in multiple intermediate states. Furthermore, the absence of representative structures of entire protein families, whose members often share difficulties in structure determination, reduces the efficiency and accuracy of comparative modeling (Sali 1998).
A complement of methods with intrinsically lower resolution can provide insight into these problems. Among them are probe-based approaches such as electron paramagnetic resonance (EPR) spectroscopy in combination with site-directed spin labeling (SDSL) (Hubbell, Mchaourab et al. 1996; Mchaourab, Berengian et al. 1997; Koteiche, Berengian et al. 1998; Perozo, Cortes et al. 1999; Liu, Sompornpisut et al. 2001; Brown, Sale et al. 2002; Dong, Yang et al. 2005). EPR analysis of spin labeled proteins results in a set of structural restraints that describes, in a native-like setting, local environments as well as aspects of the global fold of the protein. Spin label accessibility and mobility can be used to determine secondary structure location and topology (Farahbakhsh, Altenbach et al. 1992; Altenbach, Froncisz et al. 2005). Distance measurements between pairs of spin labels in the range from 5−60Å (Rabenstein and Shin 1995; Borbat, Mchaourab et al. 2002) reflect the relative packing of domains and secondary structures. In cases where these parameters are obtained in various conformational intermediates of the protein, they allow for a detailed mapping of structural changes involved in function (Dong, Yang et al. 2005). There are relatively few limits on the size and environment of the protein, particularly when compared to X-ray crystallography and NMR spectroscopy.
Despite the widespread application of SDSL (Fanucci and Cafiso 2006), the use of EPR restraints for structure determination has not been systematically explored. A central question is the number and nature of EPR restraints necessary to obtain a structural model at a biologically relevant resolution. The most extensive use of spectroscopic data along with computational methods for structure determination is in NMR spectroscopy (Wüthrich 1986). Typically consisting of distances not greater than 5−6Å with upper and lower bounds, the geometric information is derived from NOE-based experiments. The number of such restraints required for the determination of a structure depends on the range and quality of such restraints, but is generally assumed to be above 15 restraints per residue (Nederveen, Doreleijers et al. 2005).
Although EPR distance restraints have a longer range than their NMR counterparts, they are fundamentally less accurate since they report distances between probes introduced into the protein sequence. The significant length of the spin label linking arm implies that the EPR distances will have a rather large uncertainty when translated into distances between α- or β-carbons unless the conformation of the spin label is known at every site. Therefore, previous efforts have focused on either using molecular dynamics simulations to define their trajectories (Sale, Song et al. 2005) or on determining a library of rotamers from crystal structures of spin labeled T4-lysozyme (Langen, Oh et al. 2000). These studies are critical since spin label conformations are likely stabilized by weak specific interactions with neighboring amino acid side chain or backbone atoms. However, such calculations are time and resource intensive and not practical without a high-resolution structural model of the protein.
Sparse experimental data, such as EPR restraints, aid computational protein structure prediction algorithms by restricting the conformational space that must be considered in order to obtain the correct structure. For instance, the Rosetta de novo protein structure prediction algorithm (Simons, Kooperberg et al. 1997; Bonneau, Strauss et al. 2001; Bonneau, Tsai et al. 2001; Bradley, Chivian et al. 2003; Rohl, Strauss et al. 2004; Bradley, Malmstrom et al. 2005) predicts high-resolution (better than 1.5Å) structures of proteins with less than 80 amino acids in the absence of experimental restraints (Bradley, Misura et al. 2005). In combination with sparse (less than one restraint per amino acid) NMR NOE distances and/or residual dipolar couplings (Bowers, Strauss et al. 2000; Rohl and Baker 2002), the structure of proteins with up to 200 amino acids can be determined to medium-high-resolution (1.5−3.0Å).
In the present work, Rosetta is combined with sparse EPR distance restraints and solvent accessibility measures for high-resolution structure determination of the mostly helical T4-lysozyme (Weaver and Matthews 1987) and the all β-sheet protein αA-crystallin (Horwitz 1992; Horwitz 1993). We address the question of whether the EPR restraints can restrict the protein conformational space without assuming an atomic-detail model for the spin label's dynamics and without accounting for its context-dependent specific interactions. Also addressed are the questions of how many restraints are needed to obtain a high-resolution structure and what type of EPR restraint is most efficient.
The results demonstrate that sparse EPR restraints derived from a non-atomic model of the spin label lead Rosetta to high-resolution structures for both proteins. Also, distance restraints are more efficient in restricting conformational space than spin label accessibilities. Further analysis reveals that those between two amino acids far apart in sequence but close in Euclidian space are the most valuable.
Results
EPR distance and accessibility data were transformed into structural restraints as described in Experimental Procedures. Briefly, distances between spin labels were translated into distances between β-carbons using a motion-on-a-cone model of the spin label location relative to the a-carbon. The accessibilities of spin labels were computationally interpreted in terms of the exposed surface area. The effectiveness of the restraints to aid Rosetta in the folding process was then evaluated. Because distance restraints proved vastly more efficient in preliminary experiments, accessibility data was not used during modeling. De novo models were compared to the crystal structure of T4-lysozyme and a comparative model of aA-crystallin.
Evaluation of the “Motion-on-a-cone” model for interpretation of distance restraints
The ‘‘motion-on-a-cone’’ model (see Figure 1) yields a predicted distribution for the difference between the distance separating the spin labels (dSL) and that separating the two corresponding Cβs carbons (Cβs; dCβ). Comparison of the predicted dSL - dCβ distribution with the dSL - dCβ obtained from the T4-lysozyme and αA-crystallin structures (Figure 1D) demonstrate that they essentially encompass the same range of dSL - dCβ and reveals a common bias in experiment and model for dSL > dCβ. The comparison also reveals that the model over-predicts the frequency with which large (> 4Å) dSL - dCβ values occur and underestimates the frequency with which low (< 4Å) dSL - dCβ values occur. However, the present application depends only on the ability of the model to predict the appropriate range of values for dSL - dCβ; the frequency with which these values occur is not a part of the utility of this simple model.
Figure 1.
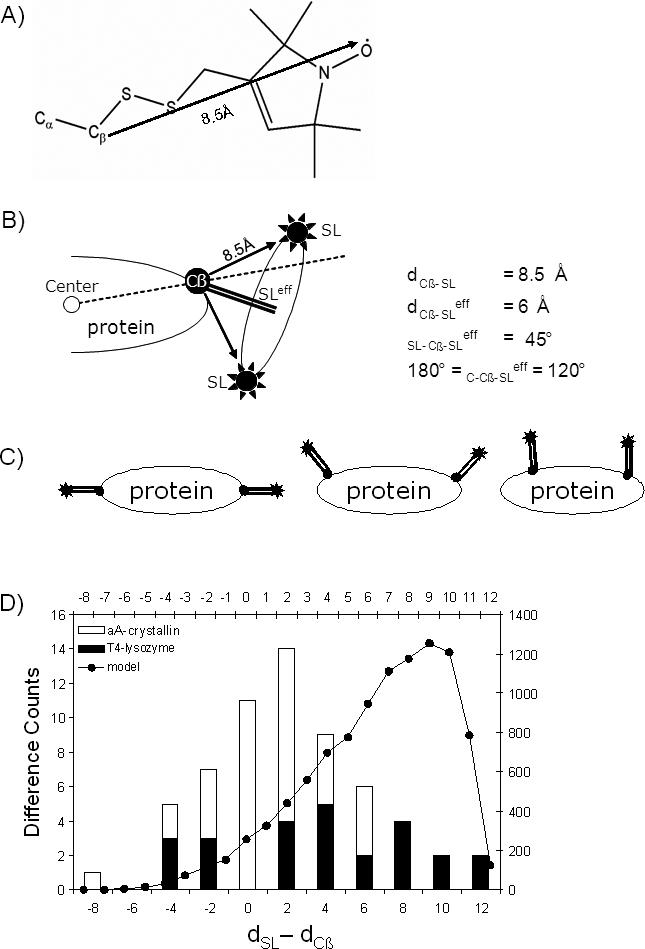
Rational for translating dSL into dCβ for use as a restraint. A) Chemical structure of a nitroxide spin label side chain with the distance from the Cβ atom to the spin label atom indicated (Borbat, Mchaourab et al. 2002). B) Illustration of how the maximum distance from Cβ to spin label, SL, is reduced to an effective distance, SLeff (depicted by a double line). C) dSL is a starting point for the upper estimate of dCβ, and subtracting the effective distance of 6Å twice from dSL gives a starting point for the lower estimate of dCβ. D) A histogram compares T4-lysozyme crystal structure (black bars, left y-axis, bottom x-axis) and αA-crystallin comparative model (white bars, left y-axis, bottom x-axis) dSL–dCβ values with those obtained from the simple cone model (circles and line, right y-axis, top x-axis).
Given a dSL, the “motion-on-a-cone” model provides a restraint in the form of a predicted range for dCβ. The accuracy of the range can be evaluated by comparing it to the dCβ calculated from the T4-lysozyme structure and the αA-crystallin comparative model. Practically all calculated dCβ lie within the range predicted by the model (Figure 2C, G).
Figure 2.
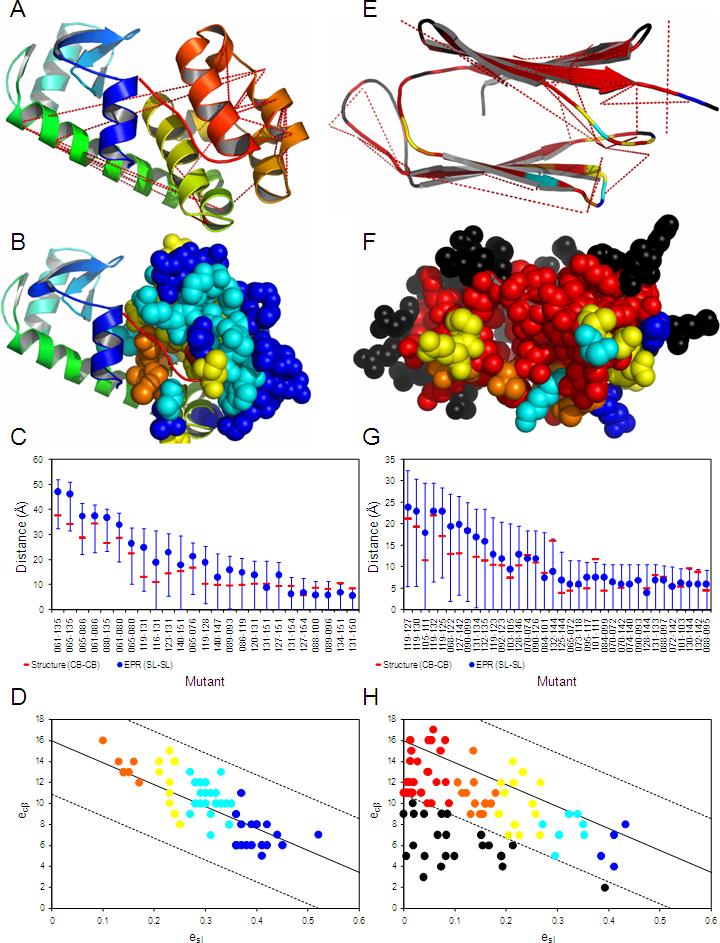
Map of the EPR restraints on the T4-lysozyme crystal structure (A-D) and on the αA-crystallin comparative model (E-H). A and E) Red dotted lines show dCβ distances, which are restrained by respective dSL. B and F) Residues for which accessibilities eSL were measured are depicted as space-filling models. C and G) Diagram shows dSL (blue circle), the range of the derived distance restraints (blue), and the corresponding crystal/comparative model dCβ (red bar). D and H) Diagram illustrating the correlation of eSL with eCβ. The lines indicate the consensus model fit ±3•σCβ, where σCβ, was recalculated based on the consensus fit to be 1.70Å. In B, F, D, and H the residues are color-coded with decreasing eSL from blue – cyan – yellow – orange – red; black indicates amino acids in αA-crystallin that show reduced experimental accessibility due to intermolecular contacts with other αA-crystallin units in the oligomeric protein.
A Linear Regression Relation for Interpretation of Accessibility Restraints
Analogous to an experimental distance measurement, the experimental accessibility of a spin label (eSL) needs to be translated into accessible surface areas of the protein structure for use as a restraint. For this purpose, a consensus linear regression relation between eSL and the number of Cβ atoms within 8Å of the Cβ of the corresponding amino acid (eCβ) was determined from T4-lysozyme and αA-crystallin structures. The linear relation is given by eCβ = (0.76–eSL)•20.87 and has a correlation coefficient of −0.83 to experimental T4-lysozyme and αA-crystallin data (Figure 2D, H). The strong correlation suggests the simple method of linearly relating eSL to eCβ is a sufficient means for obtaining a structural restraint from EPR accessibility data.
Influence of EPR data on de novo fold determination
To avoid the introduction of noise through unconstrained regions and focus on evaluating the contribution of EPR restraints in structure prediction, regions in both proteins that were not probed with spin labels were excluded from the calculations. For T4-lysozyme, the C-terminal 107 residue helical domain (amino acids 58−164) was modeled (Figure 2A). For αA-crystallin, the C-terminal 88-residue β-sandwich domain (amino acids 60−147) was modeled (Figure 2E).
The influence of the experimental EPR restraints on de novo protein folding with Rosetta was evaluated by building 10,000 models for each protein (a) without the use of experimental data, (b) with only the use of distance restraints, (c) with only the use of solvent accessibility restraints, and (d) using both sets of restraints. The average model quality was monitored by the root-mean-square-deviation (RMSD). The results for both T4-lysozyme and αA-crystallin follow the same trends: there is an improvement in the quality of models created using distance restraints compared to models created without distance restraints (Figure 3A and B, T4-lysozyme; Figure 3I and J, αA-crystallin); there is very little to no improvement when accessibility restraints are included (Figure 3A and C, T4-lysozyme; Figure 3I and K, αA-crystallin); using accessibility restraints in conjunction with distance restraints provides little to no improvement over using distance restraints alone (Figure 3B and D, T4-lysozyme; Figure 3J and L, αA-crystallin). It is clear from these analyses that the distance restraints are critical for improving the RMSD distribution of models, while solvent accessibility data only marginally improve the quality of water soluble protein models.
Figure 3.
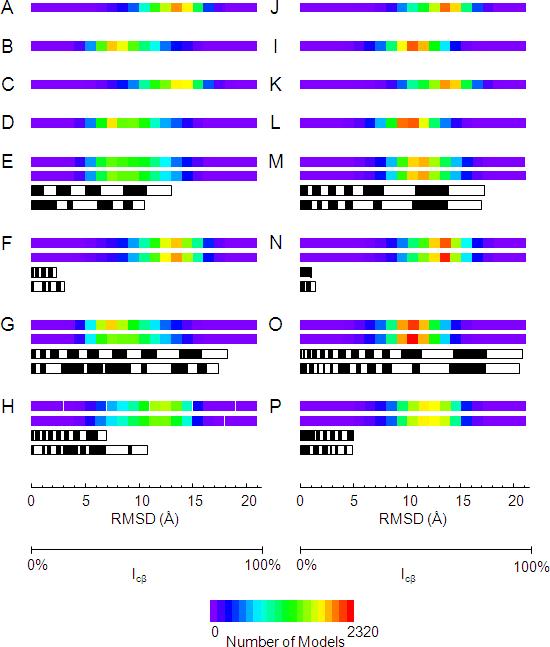
Illustration of the value of the experimental restraints in de novo protein folding for T4-lysozyme (A - H) and αA-crystallin (I - P). The backbone RMSD distribution of 10,000 T4-lysozyme de novo models created A) without the use of EPR restraints, B) with only the use of EPR distance restraints, C) with only the use of EPR accessibility restraints, D) with the use of EPR distance and accessibility restraints. E) The backbone RMSD distribution of 10,000 T4-lysozyme de novo models created with the use of 1/3 of the EPR distance restraints: top bar) those with the largest information content; second bar) those between amino acids furthest apart in sequence. The third and fourth black and white bars denote the sum percent of information content of the restraints used for the top and second bars, respectively. The width of the blocks comprising the black and white bars denotes the information content of individual restraints. F) Same as for E) but using the distance restraints with the lowest information content (top bar) and nearest in sequence (second bar). G) Same as for E) but using 2/3 of the total distance restraints. H) Same as for F) but using 2/3 of the total distance restraints. I – P) Same as A - H but for αA-crystallin.
Influence of spin label placement on de novo fold determination
Spatial contacts of amino acids that are distant in sequence define the protein fold best (Baker 2000; Bonneau, Ruczinski et al. 2002). However, whereas the sequence separation sCβ can be chosen when designing an EPR experiment, the Euclidean distance dCβ is generally unknown. EPR experiments do not provide contact data, but, instead, distances of up to 50Ǻ. Thus, the information content (ICβ) of an EPR distance restraint can be defined as directly proportional to (sCβ) but inversely proportional to ICβ ∼ sCβ/dCβ.
To investigate the influence of spin label location and resulting ICβ on de novo structure determination, two experiments were designed with subgroups of all available restraints. First, all restraints are ranked by ICβ to assess their power in an idealized experiment. Second, all restraints are ranked by sCβ in order to simulate the choices the experimentalist can make when selecting sites for labeling. 10,000 models for T4-lysozyme and αA-crystallin were built which used a) the one-third restraints with highest ICβ, b) the one-third restraints with lowest ICβ, c) the two-third restraints with highest ICβ, and d) the two-third restraints with lowest ICβ. The experiment was then repeated using sCβ instead of ICβ,.
Once again the trends of the results are the same for both proteins and for both ICβ and sCβ experiments. a) Using the one-third restraints with highest ICβ shifts the RMSD distribution into the same range that is obtained when using all of the available distance restraints (Figure 3E and B, T4-lysozyme; Figure 3M and J, αA-crystallin). b) Using the one-third restraints with lowest ICβ only slightly shifts the RMSD distribution towards lower RMSDs and is similar to that in the absence of distance restraints (Figure 3F and A, T4-lysozyme; Figure 3N and I, αA-crystallin). c) There is little shift in the RMSD distribution when the two-third restraints with highest ICβ are used compared to only one-third (Figure 3G and E, T4-lysozyme; Figure 3O and M, αA-crystallin); the extra restraints increase the number of lower RMSD models that are created. d) When the two-third restraints with lowest ICβ are used, there is a small shift in the RMSD distribution compared to when no distance restraints are used (Figure 3H and A, T4-lysozyme; Figure 3P and I, αA-crystallin). However, this shift is not nearly as drastic as the shift obtained when the one-third most informative distant restraints are used.
Using sCβ to select restraints instead of ICβ results in only a slight reduction in model quality and slight variation in total ICβ of the selected restraints compared to that of the restraints employed in the first experiment (Figure 3E – H, T4-lysozyme, Figure 3M – P, αA-crystallin). This indicates maximal sequence separation can be used to effectively define spin label placement and select for restraints with large ICβ. However, it should be noted that some of the sites for spin labeling T4-lysozyme were chosen with the crystal structures at hand which might bias the restraint sets for increased information content. Furthermore, this experiment does not test how spin labels should be distributed along the sequence. Additional experiments indicate that, besides maximizing sCβ, a uniform distribution of spin labels over the sequence is optimal (data not shown).
Rosetta folding of T4-lysozyme and αA-crystallin
No accessibility restraints were used in the large scale folding simulations, due to their minimal influence on structure determination. Of the 500,000 models built for T4-lysozyme, the lowest RMSD obtained was 2.39Å with a total of 117 models having an RMSD value smaller than 3.5Å. Of the 500,000 models built for αA-crystallin, the lowest RMSD obtained was 3.36Å with a total of 46 models having an RMSD value smaller than 4.0Å.
Filtering the 500,000 models of T4-lysozyme and αA-crystallin reduces the number considered for high-resolution refinement to a manageable number and enriches the high-resolution refinement pool for low RMSD models. Enrichment is measured as the fraction of low RMSD models in the filtered ensemble divided by the fraction of low RMSD models in the original ensemble. For T4-lysozyme, requiring full agreement with all distance restraints and an overall Rosetta score better than −35 points prunes down the number of candidate structures to 10,906, keeping 27 models with RMSD values smaller than 3.5Å. This enriches low RMSD (≤ 3.5Å) models in the dataset by a factor of 27 / 10,906 ÷ 117 / 500,000 = 10.6.
For αA-crystallin, in order to keep approximately 10,000 structures for high-resolution refinement, models were required to have an overall Rosetta score better than or equal to −75, β-strand pairing score better than −31, and total sum of all distance violations smaller than 3.0Å. These criteria limit the number of structures to 9,796. Of the 9,796 models, 26 models have an RMSD of less than 4.0Å, which is an enrichment of low RMSD (≤4.0Å) models of 26 / 9,796 ÷ 46 / 500,000 = 28.8.
Structure Determination of T4-lysozyme and αA-crystallin
After high-resolution refinement, models were filtered by agreement with distance restraints. T4-lysozyme models were again required to be in full agreement with all distance restraints. αA-crystallin models were required to have sum total distance restraint violations of less than 1 Å. The remaining models were sorted by Rosetta full-atom energy, and the lowest energy model for each protein was compared to the crystal structure of T4-lysozyme and the comparative model of αA-crystallin. For RMSD analysis, loop regions of the α-helical and β-sandwich domains were disregarded.
In addition to RMSD analysis, the agreement of side chain conformations can be captured by comparing the dihedral angles χ1...4. A specific set of such angles χ1...4 is called a “rotamer” (Dunbrack and Karplus 1993; Dunbrack 2002). If all angles χ1...4 of an amino acid side chain deviate less than 60°, the rotamer is the same and the conformation is closely recovered. The number reported for side chain conformation comparison is the percentage of non-agreeing rotamers (Figure 4B and Figure 4D).
Figure 4.
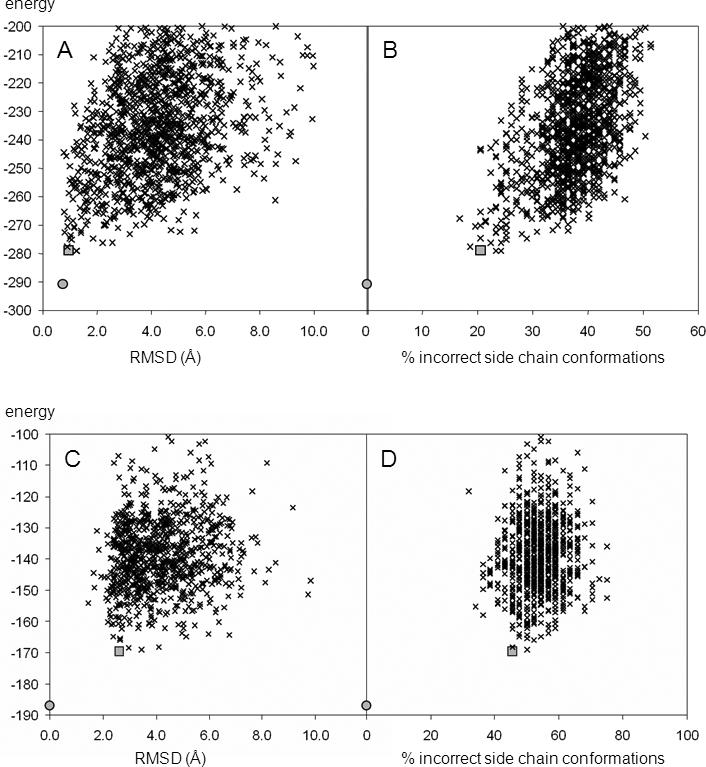
Correlation of de novo models' accuracy with the energy of the de novo models. A) and C) The non-loop RMSD versus Rosetta energy for T4-lysozyme and αA-crystallin models, respectively. B) and D) The percentage of incorrectly built side chain conformations versus Rosetta energy for T4-lysozyme and αA-crystallin models, respectively. In all diagrams the minimized crystal structure or comparative model is depicted as a circle; the lowest energy model is shown as a square.
The Rosetta energy of T4-lysozyme de novo models decreases as their RMSD and side chain rotamer disagreement to the native structure diminish (Figure 4A, Figure 4B). This allows the selection of high-resolution models based on energy alone. The lowest energy de novo model achieves an RMSD to the crystal structure of 1.0Å in the α-helical domain and 2.0Å over all modeled residues (Figure 5A). 80% of all rotamers are in agreement with the crystal structure.
Figure 5.
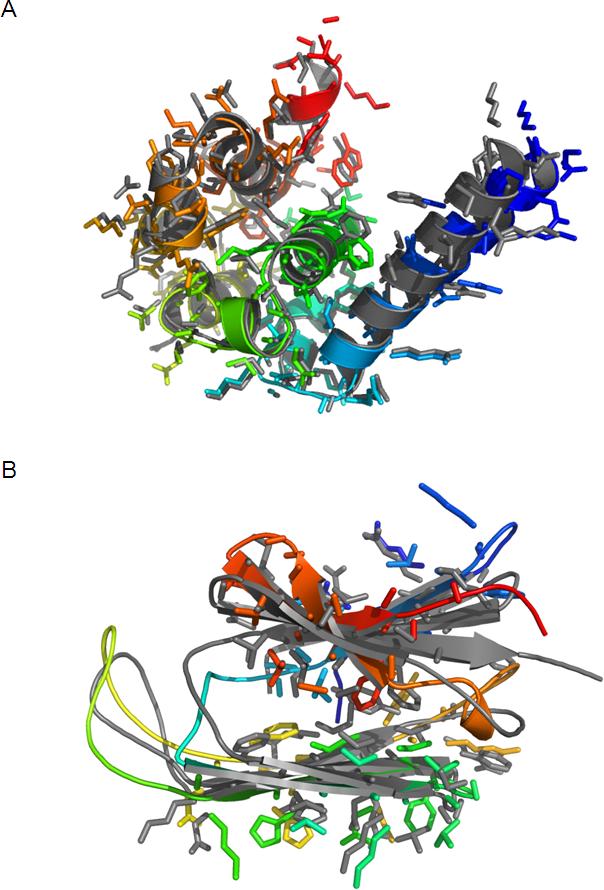
Overlay of lowest energy de novo models on crystal structure or comparative model. A) and B) For T4-lysozyme and αA-crystallin, respectively, superimposition of the lowest energy model (rainbow colored) with the crystal structure or comparative model (gray). The backbone is given as a ribbon diagram. Side chains of T4-lysozyme and of the β-sandwich of αA-crystallin are shown as stick models without hydrogen atoms.
The Rosetta energy of αA-crystallin de novo models decreases as their structure approaches that of the comparative model (Figure 4C). However, side chain rotamer agreement does not correlate with Rosetta energy (Figure 4D). The lowest energy de novo model achieves an RMSD of 2.6Å for the β-sandwich and 4.0Å over the whole protein (Figure 5B). The rotamer agreement in the β-sandwich is 54.5%. Note that similar rmsds and side chain agreements are also found between the comparative model and two additional comparative models based on alternative templates (data not shown).
Discussion
Structure determination from sparse EPR restraints
The major conclusion of this paper is that structural restraints obtained from EPR analysis of spin labeled proteins can be used in combination with de novo prediction methods to determine atomic-detail structures of proteins. Furthermore, the structural interpretation of the EPR data for the purpose of de novo modeling does not require a detailed understanding of the position or conformation of the spin label relative to the backbone. A “motion-on-a-cone” model can provide inter-Cβ distance restraints and the spin label accessibility can restrain the number of close neighbors when building a structural model.
Only a few specific distance restraints are needed in order to add substantial information and restrict the accessible fold space significantly. Using all twenty-five distance restraints, 50% T4-lysozyme models have an RMSD smaller than 8Å compared to less than 5% in their absence. This means that less than one distance restraint per four amino acids was sufficient to focus the de novo structure determination method on sampling the correct fold in more than half of all runs of T4-lysozyme. Only 0.074 distance restraints per residue are needed in order to obtain an equivalent RMSD distribution if the eight restraints between amino acids farthest apart in sequence are used. A significant increase in the quality of models created with distance restraints was also noted for αA-crystallin. By using the distance restraints between amino acids farthest apart in sequence, only 0.136 distance restraints per residue are needed in order to obtain an RMSD distribution similar to that seen when using all restraints. The reduced frequency at which the correct fold is obtained compared with T4-lysozyme can be attributed to the more challenging folding pathway for a β-sandwich.
Relative importance of accessibility and spatial restraints
Distance restraints – even with the comparably large uncertainties resulting from EPR measurements – are more valuable for de novo protein structure determination than solvent accessibility data. Whereas distances reflect specific geometric relationships, the solvent accessibility reflects a convolution of local interactions and rather unspecific interactions with the solvent. The Rosetta energy function already contains knowledge-based terms for these two types of interactions: the amino acid pair potential and the environment potential. The pair potential describes the likelihood of two amino acid types to be spatially close. The environment potential describes the likelihood of an amino acid to be exposed to the solvent or buried in the core. Thus, the EPR accessibility measurements, which reflect the expected buried/exposed distribution, add little information beyond the empirical potentials used in Rosetta.
It should be noted, however, that the importance of the spin label accessibility restraints may be understated by the use of water-soluble proteins as a test case. In general, de novo prediction methods for secondary structure and for sequence–specific residue environment are quite accurate for water soluble proteins (Rost and Sander 1993; Jones 1999; Rost 2001; Meiler 2003). In contrast, the apolar character of the membrane core makes a computational distinction between membrane and protein core more difficult. Thus, experimental accessibilities are expected to be critical in defining the secondary structure and topology of initial models for membrane proteins.
Structural interpretation of EPR parameters
The fundamental assumption in the “motion-on-a-cone” model is that the spin label cannot point towards the interior of the protein. Thus, possible specific interactions of spin label and protein are disregarded. This is manifest as a bias towards over-predicting the frequency with which large (> 4Å) dSL - dCβ values occur. Additionally, the model underestimates the frequency with which low (< 4Å) dSL - dCβ values occur. This is because the spin labels cannot adopt conformations that closely mimic non-spherical arrangements on the surface of proteins such as β-strands and α-helices. A more precise estimation of the distribution of dSL - dCβ values might be possible as a comprehensive understanding of spin label rotamers emerges (Langen, Oh et al. 2000).
While there is a robust linear relation between the experimental spin label accessibility, eSL, and the predicted accessibility, eCβ, the applied consensus fit procedure used to obtain the relation has two disadvantages. First, because a comparative model was used in the development of the consensus linear regression model, using it for de novo folding simulations is somewhat circular. Second, part of the accessibility data for αA-crystallin are influenced by oligomerization and had to be excluded because only a model of monomeric state of αA-crystallin is computationally feasible. Nevertheless, using this relation in simulations is arguably an acceptable test of the usefulness of such data for de novo protein folding.
Conclusion
De novo protein structure prediction samples as much of the conformational space as possible in order to find the native structure; the number of models reflects the extent of sampling. The increase in the number of high quality models indicates that the conformational search space has been reduced by the restraints, which allows the remaining space to be sampled more densely. It is remarkable that sparse distance restraints with as large an uncertainty as those obtained from the “motion-on-a-cone” model provide such a drastic improvement in the RMSD distribution of models. The most efficient reduction in conformational search space results from restraints between residues far apart in the primary sequence but close in Euclidean space. A uniform distribution of restraints throughout the protein sequence should be taken into consideration in order to maximize efficiency. Experimental accessibility data add little for structure elucidation of soluble proteins. Less than 0.25 restraints per amino acid are sufficient for protein structure elucidation at atomic detail.
The tendency for side chains to achieve their native rotamer as the protein model backbone approaches its native conformation has been termed “backbone memory” in protein design (Kuhlman and Baker 2000) and was also observed in very accurate high-resolution de novo protein structure prediction (Bradley, Misura et al. 2005). As a protein model backbone approaches its native conformation, backbone memory allows Rosetta to accurately place side chains into their native rotamer (Kuhlman and Baker 2000). This is demonstrated with T4-lysozyme; 80% of all rotomers are correct in the lowest energy de novo model although no side chain conformational restraints are used. For αA-crystallin definite placement of side chain atoms cannot be conclusively analyzed, since no high-resolution crystal structure is available. The energies between comparative and de novo models are similar; however, no convergence in side chain conformation was achieved. Therefore, it remains unclear whether the rotamers predicted by the comparative or the de novo model are more accurate.
Overall, this benchmark study sets the stage for application of EPR restraints to protein targets where no structural model is yet available. Advancements in protein folding algorithms and incorporation of other experimental techniques will further improve the efficiency and accuracy of de novo protein structure determination from sparse experimental data.
Experimental Procedures
Introduction of site-directed spin labels and EPR conditions
For the introduction of spin labels, cysteine residues were systematically introduced into the (cysteine-free) T4-lysozyme and αA-crystallin amino acid sequences through single or double point mutations (Koteiche, Berengian et al. 1998; Borbat, Mchaourab et al. 2002; Altenbach, Froncisz et al. 2005). After recombinant protein expression and purification, the mutant was reacted with methanethiosulfonate nitroxide reagent. A total of 25 double mutants and 57 single mutants of T4-lysozyme (Table 1, and Table 2) and 36 double mutants and 87 single mutants of αA-crystallin (Table 3, and Table 4) resulted in the restraints used for the current analysis. Sample preparation and EPR measurement have been described elsewhere (Mchaourab, Lietzow et al. 1996; Koteiche and Mchaourab 1999).
Table 1.
T4-lysozyme EPR distance restraints in comparison with crystal structure distances.
| AA1-AA2[a] | dCβ (Å)[b] | dSL (Å)[c] | σSL (Å)[d] | dSL+σSL+ 2.5 (Å)[e] | dSL-σSL−12.5 (Å)[f] | Reference |
|---|---|---|---|---|---|---|
| 061−135 | 37.7 | 47.2 | 2.2 | 51.9 | 32.5 | (Borbat, Mchaourab et al. 2002) |
| 065−135 | 34.3 | 46.3 | 2.2 | 51.0 | 31.6 | (Borbat, Mchaourab et al. 2002) |
| 061−086 | 34.5 | 37.5 | 2.0 | 42.0 | 23.0 | (Borbat, Mchaourab et al. 2002) |
| 065−086 | 28.9 | 37.4 | 2.7 | 42.6 | 22.2 | (Borbat, Mchaourab et al. 2002) |
| 080−135 | 26.7 | 36.8 | 1.0 | 40.3 | 23.3 | (Borbat, Mchaourab et al. 2002) |
| 061−080 | 28.7 | 34.0 | 2.2 | 38.7 | 19.3 | (Borbat, Mchaourab et al. 2002) |
| 065−080 | 22.6 | 26.5 | 3.8 | 32.8 | 10.2 | (Borbat, Mchaourab et al. 2002) |
| 119−131 | 13.2 | 25.0 | 5.0 | 32.5 | 7.5 | new data |
| 123−131 | 14.6 | 23.0 | 5.0 | 30.5 | 5.5 | new data |
| 065−076 | 16.8 | 21.4 | 2.8 | 26.7 | 6.1 | (Borbat, Mchaourab et al. 2002) |
| 116−131 | 11.1 | 19.0 | 10.0 | 31.5 | 0.0 | new data |
| 119−128 | 10.4 | 19.0 | 4.0 | 25.5 | 2.5 | new data |
| 140−151 | 15.5 | 18.0 | 9.0 | 29.5 | 0.0 | new data |
| 089−093 | 9.8 | 16.0 | 3.0 | 21.5 | 0.5 | new data |
| 086−119 | 10.0 | 15.0 | 3.0 | 20.5 | 0.0 | new data |
| 120−131 | 10.5 | 14.0 | 3.0 | 19.5 | 0.0 | new data |
| 127−151 | 9.6 | 14.0 | 2.4 | 18.9 | 0.0 | new data |
| 140−147 | 10.1 | 13.0 | 7.0 | 22.5 | 0.0 | new data |
| 131−150 | 8.7 | 5.7 | 0.4 | 8.6 | 0.0 | new data |
| 127−154 | 5.9 | 7.0 | 3.0 | 12.5 | 0.0 | new data |
| 131−154 | 9.5 | 6.5 | 4.0 | 13.0 | 0.0 | new data |
| 134−151 | 10.7 | 7.0 | 0.8 | 10.3 | 0.0 | new data |
| 131−151 | 10.4 | 9.0 | 8.0 | 19.5 | 0.0 | new data |
| 088−100 | 8.9 | <6.0 | 3.0 | 11.5 | 0.0 | new data |
| 089−096 | 8.4 | <6.0 | 3.0 | 11.5 | 0.0 | new data |
indices of spin labeled amino acids with respect to the crystal structure.
Cβ distance as reported in the crystal structure.
spin label distance as observed by EPR.
standard deviation as observed by EPR.
maximum Cβ atom distance predicted by cone model.
minimum Cβ atom distance predicted by cone model.
Table 2.
T4-lysozyme EPR solvent accessibility in comparison with crystal structure.
| AA[a] | eCβ[b] | eSL[c] | eCβ[d] |
|---|---|---|---|
| 086 | 9 | 0.36 | 7.7 |
| 093 | 6 | 0.41 | 5.8 |
| 094 | 10 | 0.28 | 10.8 |
| 096 | 10 | 0.23 | 12.7 |
| 097 | 12 | 0.17 | 15.0 |
| 100 | 13 | 0.15 | 15.8 |
| 101 | 14 | 0.13 | 16.5 |
| 102 | 13 | 0.14 | 16.2 |
| 103 | 14 | 0.16 | 15.4 |
| 104 | 10 | 0.28 | 10.8 |
| 105 | 10 | 0.33 | 8.9 |
| 106 | 7 | 0.31 | 9.7 |
| 108 | 10 | 0.32 | 9.3 |
| 109 | 6 | 0.45 | 4.3 |
| 111 | 12 | 0.23 | 12.7 |
| 113 | 8 | 0.40 | 6.2 |
| 114 | 11 | 0.30 | 10.0 |
| 115 | 6 | 0.36 | 7.7 |
| 116 | 7 | 0.52 | 1.6 |
| 117 | 10 | 0.29 | 10.4 |
| 118 | 13 | 0.21 | 13.5 |
| 119 | 8 | 0.35 | 8.3 |
| 120 | 11 | 0.23 | 12.7 |
| 121 | 16 | 0.10 | 17.7 |
| 122 | 9 | 0.36 | 7.7 |
| 123 | 6 | 0.39 | 6.6 |
| 124 | 6 | 0.42 | 5.4 |
| 125 | 8 | 0.40 | 6.2 |
| 126 | 11 | 0.32 | 9.3 |
| 127 | 7 | 0.44 | 4.7 |
| 128 | 8 | 0.42 | 5.4 |
| 129 | 13 | 0.14 | 16.2 |
| 130 | 12 | 0.30 | 10.0 |
| 131 | 8 | 0.37 | 7.4 |
| 132 | 10 | 0.35 | 8.1 |
| 133 | 15 | 0.23 | 12.7 |
| 134 | 10 | 0.30 | 10.0 |
| 135 | 6 | 0.38 | 7.0 |
| 136 | 9 | 0.31 | 9.7 |
| 137 | 5 | 0.41 | 5.8 |
| 138 | 11 | 0.29 | 10.4 |
| 139 | 13 | 0.33 | 8.9 |
| 140 | 6 | 0.37 | 7.4 |
| 141 | 8 | 0.25 | 11.9 |
| 142 | 9 | 0.27 | 11.2 |
| 143 | 8 | 0.39 | 6.6 |
| 144 | 6 | 0.36 | 7.7 |
| 145 | 9 | 0.24 | 12.3 |
| 146 | 13 | 0.27 | 11.2 |
| 147 | 11 | 0.31 | 9.7 |
| 148 | 12 | 0.28 | 10.8 |
| 149 | 14 | 0.21 | 13.5 |
| 150 | 12 | 0.29 | 10.4 |
| 151 | 11 | 0.37 | 7.4 |
| 153 | 14 | 0.24 | 12.3 |
| 154 | 10 | 0.34 | 8.5 |
| 155 | 8 | 0.25 | 11.9 |
indices of spin labeled amino acids with respect to the crystal structure.
number of Cβ atom neighbors in the crystal structure.
spin label accessibility as observed by EPR (Sompornpisut, Mchaourab et al. 2002).
number of Cβ atom neighbors predicted by the consensus linear regression relation.
Table 3.
αA-crystallin EPR distance restraints in comparison with comparative model.
| AA1-AA2[a] | dCβ (Å)[b] | dSL (Å)[c] | σSL (Å)[d] | dSL +2.5+ σSL (Å)[e] | dSL—σSL—12.5 (Å)[f] | Reference |
|---|---|---|---|---|---|---|
| 065−072 | 4.5 | 6.0 | 3.0 | 11.5 | 0.0 | (Koteiche and Mchaourab 1999) |
| 068−122 | 13.0 | 19.5 | 5.0 | 27.0 | 2.0 | new data |
| 070−072 | 6.3 | 6.6 | 1.5 | 10.6 | 0.0 | (Koteiche and Mchaourab 1999) |
| 070−074 | 12.8 | 12.0 | 4.0 | 18.5 | 0.0 | (Koteiche and Mchaourab 1999) |
| 070−142 | 5.2 | 6.0 | 2.0 | 10.5 | 0.0 | (Koteiche and Mchaourab 1999) |
| 072−142 | 5.7 | 5.5 | 2.0 | 10.0 | 0.0 | (Koteiche and Mchaourab 1999) |
| 073−118 | 5.6 | 6.0 | 3.0 | 11.5 | 0.0 | new data |
| 074−140 | 6.0 | 6.0 | 2.0 | 10.5 | 0.0 | (Koteiche and Mchaourab 1999) |
| 084−099 | 4.5 | 7.6 | 0.6 | 10.7 | 0.0 | (Koteiche, Berengian et al. 1998) |
| 084−101 | 8.6 | 7.5 | 8.0 | 18.0 | 0.0 | (Koteiche, Berengian et al. 1998) |
| 088−095 | 4.6 | 6.0 | 0.7 | 9.2 | 0.0 | (Koteiche, Berengian et al. 1998) |
| 088−097 | 7.7 | 7.0 | 0.8 | 10.3 | 0.0 | (Koteiche, Berengian et al. 1998) |
| 090−093 | 6.8 | 6.9 | 1.1 | 10.5 | 0.0 | (Koteiche, Berengian et al. 1998) |
| 090−099 | 18.7 | 18.5 | 4.0 | 25.0 | 2.0 | (Koteiche, Berengian et al. 1998) |
| 090−126 | 11.1 | 12.0 | 4.0 | 18.5 | 0.0 | (Koteiche and Mchaourab 1999) |
| 092−123 | 10.4 | 12.0 | 6.0 | 20.5 | 0.0 | (Koteiche and Mchaourab 1999) |
| 095−117 | 5.0 | 7.6 | 1.0 | 11.1 | 0.0 | (Koteiche, Berengian et al. 1998) |
| 101−103 | 5.4 | 6.3 | 0.8 | 9.6 | 0.0 | (Koteiche and Mchaourab 1999) |
| 101−111 | 11.9 | 7.6 | 1.0 | 11.1 | 0.0 | (Koteiche, Berengian et al. 1998) |
| 103−105 | 7.5 | 9.5 | 8.0 | 20.0 | 0.0 | (Koteiche and Mchaourab 1999) |
| 105−111 | 11.6 | 18.0 | 9.0 | 29.5 | 0.0 | (Koteiche and Mchaourab 1999) |
| 119−123 | 10.5 | 13.0 | 6.0 | 21.5 | 0.0 | (Koteiche and Mchaourab 1999) |
| 119−125 | 17.1 | 23.0 | 3.0 | 28.5 | 7.5 | (Koteiche and Mchaourab 1999) |
| 119−127 | 21.2 | 24.0 | 6.0 | 32.5 | 5.5 | (Koteiche and Mchaourab 1999) |
| 119−130 | 19.3 | 23.0 | 5.0 | 30.5 | 5.5 | (Koteiche and Mchaourab 1999) |
| 119−132 | 21.9 | 23.0 | 4.0 | 29.5 | 6.5 | (Koteiche and Mchaourab 1999) |
| 125−144 | 4.0 | 7.0 | 4.0 | 13.5 | 0.0 | (Koteiche and Mchaourab 1999) |
| 127−142 | 13.1 | 20.0 | 4.0 | 26.5 | 3.5 | new data |
| 128−144 | 5.0 | 4.0 | 4.0 | 10.5 | 0.0 | (Koteiche and Mchaourab 1999) |
| 128−146 | 10.4 | 13.0 | 4.0 | 19.5 | 0.0 | (Koteiche and Mchaourab 1999) |
| 130−144 | 9.7 | 6.0 | 1.0 | 9.5 | 0.0 | (Koteiche and Mchaourab 1999) |
| 131−133 | 8.0 | 7.0 | 1.0 | 10.5 | 0.0 | (Koteiche and Mchaourab 1999) |
| 131−134 | 12.3 | 17.0 | 4.0 | 23.5 | 0.5 | (Koteiche and Mchaourab 1999) |
| 132−135 | 11.5 | 16.0 | 5.0 | 23.5 | 0.0 | (Koteiche and Mchaourab 1999) |
| 132−142 | 8.8 | 6.0 | 1.0 | 9.5 | 0.0 | (Koteiche and Mchaourab 1999) |
| 132−144 | 16.1 | 9.0 | 5.0 | 16.5 | 0.0 | (Koteiche and Mchaourab 1999) |
indices of spin labeled amino acids with respect to the protein sequence.
Cβ atom distance in comparative model.
spin label distance as observed by EPR.
standard deviation as observed by EPR.
maximum Cβ atom distance predicted by cone model.
minimum Cβ atom distance predicted by cone model.
Table 4.
αA-crystallin EPR solvent accessibility in comparison comparative model.
| AA[a] | eCβ[b] | eSL[c] | eCβ[d] |
|---|---|---|---|
| 060 | 5 | 0.01 | 10.9 |
| 061 | 5 | 0.04 | 10.5 |
| 062 | 11 | 0.00 | 11.0 |
| 063 | 6 | 0.02 | 10.8 |
| 064 | 10 | 0.05 | 10.5 |
| 065 | 9 | 0.07 | 10.2 |
| 066 | 10 | 0.05 | 10.4 |
| 067 | 9 | 0.04 | 10.6 |
| 068 | 5 | 0.19 | 8.9 |
| 069 | 6 | 0.21 | 8.7 |
| 070 | 10 | 0.16 | 9.3 |
| 071 | 16 | 0.05 | 10.5 |
| 072 | 12 | 0.06 | 10.3 |
| 073 | 15 | 0.07 | 10.2 |
| 074 | 13 | 0.05 | 10.5 |
| 075 | 12 | 0.02 | 10.8 |
| 076 | 11 | 0.02 | 10.8 |
| 077 | 12 | 0.01 | 10.9 |
| 078 | 9 | 0.02 | 10.8 |
| 079 | 11 | 0.03 | 10.6 |
| 080 | 14 | 0.01 | 10.9 |
| 081 | 10 | 0.09 | 10.0 |
| 082 | 8 | 0.27 | 8.0 |
| 083 | 5 | 0.29 | 7.8 |
| 084 | 10 | 0.25 | 8.2 |
| 085 | 16 | 0.05 | 10.4 |
| 086 | 7 | 0.22 | 8.5 |
| 087 | 12 | 0.14 | 9.5 |
| 088 | 8 | 0.35 | 7.2 |
| 089 | 11 | 0.18 | 9.0 |
| 090 | 9 | 0.26 | 8.2 |
| 091 | 4 | 0.41 | 6.5 |
| 092 | 7 | 0.35 | 7.1 |
| 093 | 12 | 0.27 | 8.1 |
| 094 | 17 | 0.06 | 10.4 |
| 095 | 13 | 0.23 | 8.4 |
| 096 | 15 | 0.14 | 9.5 |
| 097 | 12 | 0.21 | 8.6 |
| 098 | 12 | 0.01 | 10.9 |
| 099 | 9 | 0.13 | 9.6 |
| 100 | 16 | 0.01 | 10.9 |
| 101 | 9 | 0.19 | 9.0 |
| 102 | 10 | 0.14 | 9.5 |
| 103 | 6 | 0.17 | 9.2 |
| 104 | 6 | 0.15 | 9.3 |
| 105 | 12 | 0.19 | 8.9 |
| 106 | 5 | 0.10 | 9.9 |
| 107 | 7 | 0.08 | 10.1 |
| 108 | 4 | 0.07 | 10.2 |
| 109 | 10 | 0.17 | 9.1 |
| 110 | 3 | 0.04 | 10.6 |
| 111 | 7 | 0.15 | 9.3 |
| 112 | 9 | 0.00 | 11.0 |
| 113 | 9 | 0.08 | 10.1 |
| 114 | 11 | 0.01 | 10.9 |
| 115 | 9 | 0.15 | 9.4 |
| 116 | 11 | 0.00 | 11.0 |
| 117 | 10 | 0.16 | 9.3 |
| 118 | 12 | 0.01 | 10.9 |
| 119 | 7 | 0.26 | 8.1 |
| 120 | 11 | 0.01 | 10.9 |
| 121 | 5 | 0.19 | 8.9 |
| 122 | 8 | 0.43 | 6.2 |
| 123 | 7 | 0.30 | 7.7 |
| 124 | 16 | 0.08 | 10.1 |
| 125 | 9 | 0.34 | 7.3 |
| 126 | 7 | 0.20 | 8.8 |
| 127 | 5 | 0.38 | 6.8 |
| 128 | 9 | 0.32 | 7.5 |
| 129 | 14 | 0.21 | 8.7 |
| 130 | 9 | 0.18 | 9.0 |
| 131 | 9 | 0.16 | 9.3 |
| 132 | 8 | 0.22 | 8.6 |
| 133 | 11 | 0.12 | 9.7 |
| 134 | 7 | 0.07 | 10.3 |
| 135 | 4 | 0.19 | 8.9 |
| 136 | 5 | 0.08 | 10.1 |
| 137 | 12 | 0.08 | 10.1 |
| 138 | 10 | 0.02 | 10.8 |
| 140 | 13 | 0.05 | 10.5 |
| 141 | 15 | 0.01 | 10.8 |
| 142 | 11 | 0.11 | 9.7 |
| 143 | 14 | 0.03 | 10.7 |
| 144 | 11 | 0.20 | 8.8 |
| 145 | 12 | 0.10 | 9.8 |
| 146 | 7 | 0.41 | 6.5 |
| 147 | 2 | 0.39 | 6.7 |
indices of spin labeled amino acids with respect to the protein sequence.
number of Cβ atom neighbors in the crystal structure.
spin label accessibility as observed by EPR (Koteiche, Berengian et al. 1998; Koteiche and Mchaourab 1999).
number of Cβ atom neighbors predicted from the consensus linear regression relation.
EPR distance measurements
For T4-lysozyme, 25 distances were measured (Table 1, Figure 2A). Distances derived from Double Electron-Electron Resonance (DEER) or DQC experiments (Borbat, Mchaourab et al. 2002; Jeschke 2002; Borbat and Freed 2007) were distributed in different areas of the molecule with predicted distances larger than 25Å. They provide geometric restraints on the global fold. CW-EPR was used to measure distances between neighboring helices. For each pair of interacting helices, doubly labeled mutant sets were created by designating a reference spin label in one helix and moving another spin label along the exposed surface of the second helix.
The αA-crystallin EPR data (CW-EPR, Table 3) consists of 36 distances, including β-strand to β-strand and β-strand to loop distances covering most of the overall topology of the molecule (Koteiche, Berengian et al. 1998; Koteiche and Mchaourab 1999) (Figure 2E). For both T4-lysozyme and αA-crystallin, when measurements provided multiple distances, the most contributing distance was used.
For the CW-EPR experiments, dipolar coupling between spin labels was analyzed both in the liquid state and in frozen solutions using a modification of the deconvolution method (Rabenstein and Shin 1995). This approach requires two EPR spectra of the double mutant: one in the absence and one in the presence of the dipolar interaction (Figure 6A, B, respectively). The former is obtained from the digital sum of the spectra of each single mutant. A Levenberg-Marquardt algorithm was used to minimize the difference between the experimental EPR spectrum of the double mutant and the spectrum obtained from the convolution of a broadening function with the EPR spectrum of the corresponding sum of single mutants. The broadening function consisted of either one or two Gaussian distributions for the distance between spin labels (Figure 6C). The relatively wide distance distributions obtained is consistent with a highly dynamic motional state of the spin label obtained at the predominantly exposed sites. The results obtained in the solid and liquid states are in agreement both in terms of the average distance and the overall distribution as previously reported (Altenbach, Oh et al. 2001).
Figure 6.
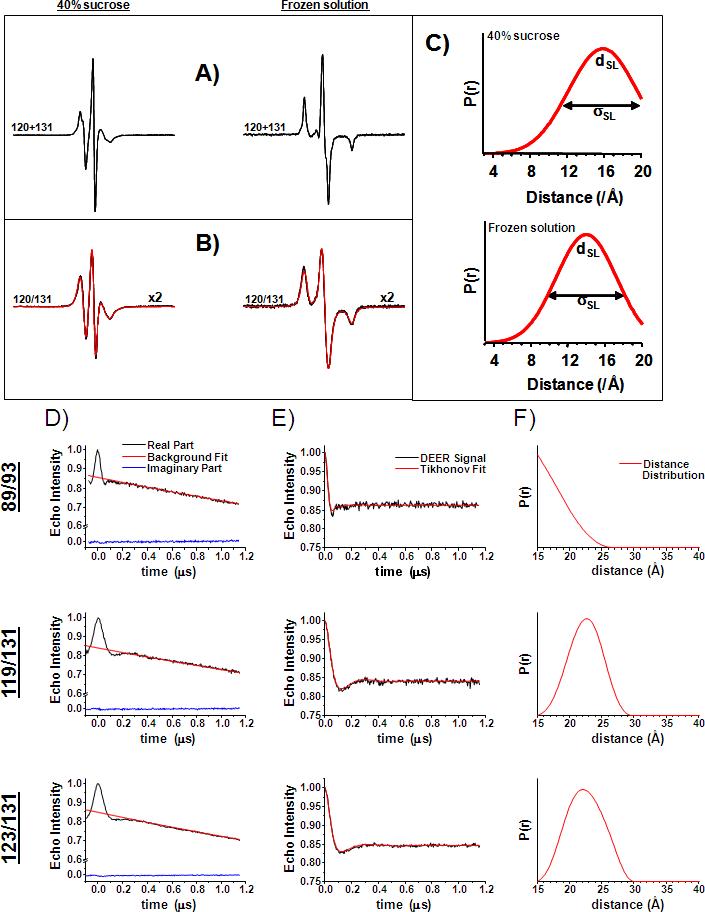
Distance measurements at room temperature and in the solid state between spin labels using EPR. A) Representative reference EPR in the absence of dipolar coupling obtained from the digital sum of the corresponding single mutant spectra. B) Spectra of double mutants along with the non-linear least squares fit obtained by the convolution method as described in the experimental methods section. C) Distance distributions obtained from CW-EPR spectra. D) Distance measurements by DEER for representative double mutants. E) Raw DEER signals were background corrected and then fit using Tikhonov regularization to obtain F) average distances and distance distributions.
DEER measurements were performed on a Bruker 580 pulsed EPR spectrometer, using a standard four pulse protocol (Jeschke 2002). Experiments were performed at 80 K using Ficoll as cryoprotectant. Sample concentration was 200 μM and sample volume 20 μl. DEER signals were analyzed by the Tikhonov regularization (Chiang, Borbat et al. 2005) to determine average distances and distributions in distance, P(r), as illustrated in Figure 6 D, E, and F.
EPR accessibility measurements
For T4-lysozyme, eSL of 57 spin labels was measured (Sompornpisut, Mchaourab et al. 2002) (Table 2). For αA-crystallin, eSL of 87 spin labels was measured (Table 4). Accessibility is assessed by measuring the Heisenberg exchange rate between the nitroxide spin label and either molecular oxygen, in the case of T4-lysozyme, or NiEDDA, in the case of αA-crystallin. For the latter, power saturation measurements were carried out under nitrogen and in the presence of 3 mM NiEDDA (Farahbakhsh, Altenbach et al. 1992). eSL was calculated as previously described (Farahbakhsh, Altenbach et al. 1992; Altenbach, Froncisz et al. 2005).
αA-crystallin comparative model preparation
The 88 amino acid C-terminal domain of αA-crystallin was submitted to the BioInfo metaserver (Fischer 2000; Kelley, MacCallum et al. 2000; Shi, Blundell et al. 2001; Ginalski, Elofsson et al. 2003; Karplus, Karchin et al. 2003; McGuffin and Jones 2003; Ginalski, von Grotthuss et al. 2004; Rost, Yachdav et al. 2004; Bryson, McGuffin et al. 2005; Soding, Biegert et al. 2005; Finn, Mistry et al. 2006). The server identified three heat shock proteins (PDB identifiers 1gmeA (van Montfort, Basha et al. 2001), 1shsA (Kim, Kim et al. 1998), and 2bolA (Stamler, Kappe et al. 2005)) as possible templates with a 3D-Jury score of over 60, where a score over 40 indicates a ∼90% chance that the identified proteins have the same fold as the submitted amino acid sequence (Ginalski, Elofsson et al. 2003). Obtaining the correct fold is the most important and difficult aspect of de novo protein folding, so having such a large likelihood that the identified proteins have the same fold as αA-crystallin is essential to ensuring the comparative model provides an adequate benchmark with which the fold of de novo models can be compared. There was approximately 20% sequence homology between the αA-crystallin amino acid sequence and the three template sequences.
A multiple sequence alignment was performed for the αA-crystallin amino acids with the template proteins. The aligned αA-crystallin amino acids were then mapped onto the template proteins' atomic coordinates and Rosetta was used to reconstruct the loop regions of αA-crystallin while holding the β-sandwich region fixed. Afterwards, Rosetta was used to perform a high-resolution refinement of the αA-crystallin comparative models.
The lowest energy comparative model was used to compare against the de novo Rosetta models. This model was based on the PDB structure 1gmeA (van Montfort, Basha et al. 2001). The model is 2.3Å RMSD to a previously published (Koteiche and Mchaourab 1999) comparative model based on a different template protein (Hsp16.5) but achieves a lower Rosetta energy after both models are refined at high-resolution.
The spin label “motion-on-a-cone” model
A simple cone model for the relative position of the spin label with respect to the Cβ of an amino acid was developed using three assumptions. First, the spin label's motion follows the perimeter of the base of a right circular cone with an opening angle of 90° whose vertex is the Cβ. The average position of this motion is √2/2 of length of the extended chain (8.5Å (Borbat, Mchaourab et al. 2002)) which gives a maximal effective distance between spin label and Cβ of 6Å (Figure 1A, B). Second, the protein is globular. Third, the angle defined by the center of the protein, the Cβ, and the spin label is between 120° and 180°, and, therefore, spin labels point away from the interior of the protein (Figure 1B, C). The “motion-on-a-cone” model can also be adapted for spin labels of different linking arms or ring substituents that restrict the amplitude of its motion.
Using the “motion-on-a-cone” model to translate EPR spin label distances into structural restraints
The difference between dSL and dCβ given by the model described above was analyzed using the software package Mathematica (2005):
An ellipsoid with the main radii 10Å ≤ rx ≤ ry ≤ rz ≤ 20Å was created with otherwise randomly chosen rx, ry, and rz. Its center is C.
Two points, Cβi and Cβj, on the surface of this ellipsoid were selected by randomly choosing the polar coordinates φi,j, and Ψi,j. From these points, dCβ is computed as the Euclidean distance.
Two numbers between 120° and 180° for the angle C–Cβi–SLi and C–Cβj–SLj are chosen randomly and the position of the spin labels, SLi and SLj, is computed. From these points, dSL is computed as the Euclidean distance.
The difference dSL–dCβ is computed.
Steps 1−4 are repeated 10,000 times and the values dSL–dCβ are plotted as a histogram (Figure 1D).
This analysis of the difference between dSL and dCβ showed that (dSL+2.5Å) ≥ dCβ ≥ (dSL−12.5Å) (Figure 1D).
σSL, which is the experimentally determined standard deviation in dSL, is a measure of the magnitude of the spin label's motion, or, its static distribution relative to the Cβ. Since increased magnitude an of motion increases the ambiguity of the derived dCβ, σSL is added as an additional allowance to the restraint which gives (dSL+σSL+2.5Å) ≥ dCβ ≥ (dSL–σSL–12.5Å).
Development of a model to translate EPR spin label solvent accessibility into structural restraints
Obtaining a structural restraint from EPR spin label solvent accessibility is accomplished by building a consensus linear regression relation of eSL to eCβ in a three step procedure:
Using the crystal structure of T4-lysozyme, eCβ was computed for all residues with known eSL (Table 2). A linear regression was fit to a plot of eCβ of a residue versus the corresponding eSL, yielding the relation eCβ = (0.71–eSL)•24.23 with a correlation coefficient of −0.80. Using this relation to calculate the number of neighbors for a residue gives eCβfit for that residue. The standard deviation (σCβ) of eCβ from eCβfit was calculated to be 1.65.
For those residues in αA-crystallin that have an experimentally determined accessibility (Table 4), eCβ was determined using the comparative model of αA-crystallin. In addition, the equation from 1) above was used to calculate the number of neighbors, eCβfit, for each residue. Amino acids were excluded from a linear fitting of eCβ versus eSL when |eCβ–eCβfit| > 2•σCβ. This procedure was necessary in order to exclude amino acids in αA-crystallin that show reduced experimental accessibility due to intermolecular contacts with other αA-crystallin units in the oligomeric protein (Figure 2F, H). Fitting a linear regression to the remaining data gives a relation similar to that seen for T4-lysozyme: eCβ = (0.72–eSL)•21.63 with a correlation coefficient of −0.87.
Combining the data for both proteins in a single consensus linear regression model yields eCβ = (0.76–eSL)•20.87 with a correlation coefficient of −0.83 (Figure 2D, and Figure 2H).
Implementation of structural restraints for de novo structure determination
The distance restraints are used as an additional penalty in the energy function of Rosetta. This penalty is zero if dCβ lay within the range predicted from dSL. As dCβ ventures outside this range a quadratic penalty function is applied. The detailed implementation of this penalty function and its use to guide the folding simulation is described in detail in the respective RosettaNMR publications (Bowers, Strauss et al. 2000; Rohl and Baker 2002).
Similarly, is used as a quadratic penalty function for the accessibility data. The relative weight of this penalty function was optimized by a series of experiments varying its weight in a wide range of two orders of magnitude.
Rosetta folding simulations
De novo model generation using Rosetta was performed in four steps:
The protein is folded using RosettaNMR with EPR distance restraints to guide the simulation (Bowers, Strauss et al. 2000; Rohl and Baker 2002). In this step, amino acid side chains are embraced in a single super-atom – a “centroid” (Simons, Kooperberg et al. 1997).
Choosing the models with lowest energy and best agreement with experimental restraints prunes the large number of ∼500,000 models from Step 1 to ∼10,000.
- Models obtained from Step 2 are refined to high-resolution. High-resolution refinement is described as follows:
- After replacing side chain centroids with full-atom side chain representations from a backbone dependent rotamer library (Dunbrack and Karplus 1993), an iterative protocol of all-atom gradient minimization and side chain repacking is repeated eight times. The details of the protocol are published elsewhere (Bradley, Misura et al. 2005; Misura and Baker 2005). No restraints were used during these refinement simulations in order to fully leverage the discriminative power of the Rosetta energy function (Kuhlman and Baker 2000; Bradley, Malmstrom et al. 2005; Bradley, Misura et al. 2005; Misura and Baker 2005; Misura, Chivian et al. 2006).
Models from Step 3 are again filtered for good agreement with the experimental restraints.
Specific standard Rosetta procedures were used which are described in detail elsewhere (Simons, Kooperberg et al. 1997; Simons, Ruczinski et al. 1999; Bowers, Strauss et al. 2000; Bonneau, Strauss et al. 2001; Rohl and Baker 2002; Meiler, Bradley et al. 2003; Rohl, Strauss et al. 2004; Bradley, Malmstrom et al. 2005). Secondary structure predictions were obtained from the primary sequence of the C-terminal 107 amino acids of T4-lysozyme and the C-terminal 88 amino acid primary sequence of αA-crystallin using Jufo (Meiler, Müller et al. 2001; Meiler and Baker 2003), PsiPred (Jones 1999), and Sam (Karplus, Sjolander et al. 1997). All T4-lysozyme and αA-crystallin homologs were excluded from the protein database prior to modeling in order to simulate structure elucidation of an unknown protein fold as closely as possible. A library of 200 fragments for each position was built.
Models were obtained in 500,000 independent simulations on a cluster in Vanderbilt University's Advanced Computing Center for Research & Education (ACCRE) using up to 300 parallel 2.2 GHz JS20 IBM PowerPC processors. The average time to complete a model was approximately 100s for T4-lysozyme and 180s for αA-crystallin. The high-resolution refinement protocol requires about 500s of computation time per model.
Acknowledgements
The authors would like to acknowledge Eduardo Perozo for collection of the T4-lysozyme accessibility data. This work was conducted in part using the resources of the Advanced Computing Center for Research and Education at Vanderbilt University, Nashville, TN. J. Meiler is supported by grant R01-GM080403 from the National Institute of General Medical Sciences. N. Alexander is supported by grant NIH T32 GM08320, the Molecular Biophysics Training Grant at Vanderbilt University. M. Bortolus and H.S. Mchaourab were supported by grant R01-EY12683.
Footnotes
Publisher's Disclaimer: This is a PDF file of an unedited manuscript that has been accepted for publication. As a service to our customers we are providing this early version of the manuscript. The manuscript will undergo copyediting, typesetting, and review of the resulting proof before it is published in its final citable form. Please note that during the production process errors may be discovered which could affect the content, and all legal disclaimers that apply to the journal pertain.
References
- Mathematica Champaign. Wolfram Research, Inc; Illinois: 2005. [Google Scholar]
- Altenbach C, Froncisz W, et al. Accessibility of nitroxide side chains: absolute Heisenberg exchange rates from power saturation EPR. Biophys J. 2005;89(3):2103–12. doi: 10.1529/biophysj.105.059063. [DOI] [PMC free article] [PubMed] [Google Scholar]
- Altenbach C, Oh KJ, et al. Estimation of inter-residue distances in spin labeled proteins at physiological temperatures: experimental strategies and practical limitations. Biochemistry. 2001;40(51):15471–82. doi: 10.1021/bi011544w. [DOI] [PubMed] [Google Scholar]
- Baker D. A surprising simplicity to protein folding. Nature. 2000;405(6782):39–42. doi: 10.1038/35011000. [DOI] [PubMed] [Google Scholar]
- Berman HM, Battistuz T, et al. The Protein Data Bank. Acta Crystallogr D Biol Crystallogr. 2002;58(Pt 6 No 1):899–907. doi: 10.1107/s0907444902003451. [DOI] [PubMed] [Google Scholar]
- Bonneau R, Ruczinski I, et al. Contact order and ab initio protein structure prediction. Protein Sci. 2002;11:1937–1944. doi: 10.1110/ps.3790102. [DOI] [PMC free article] [PubMed] [Google Scholar]
- Bonneau R, Strauss CEM, et al. Improving the Performance of Rosetta Using Multiple Sequence Alignment Information and Global Measures of Hydrophobic Core Formation. Proteins: Struct., Funct., Genet. 2001;43:1–11. doi: 10.1002/1097-0134(20010401)43:1<1::aid-prot1012>3.0.co;2-a. [DOI] [PubMed] [Google Scholar]
- Bonneau R, Tsai J, et al. Rosetta in CASP4: Progress in ab initio protein structure prediction. Proteins. 2001;45(Suppl5):119–126. doi: 10.1002/prot.1170. [DOI] [PubMed] [Google Scholar]
- Borbat P, Freed J. Measuring distances by pulsed dipolar ESR spectroscopy: spin-labeled histidine kinases. . Methods in Enzymology. 2007;423:52–116. doi: 10.1016/S0076-6879(07)23003-4. [DOI] [PubMed] [Google Scholar]
- Borbat PP, Mchaourab HS, et al. Protein structure determination using long-distance constraints from double-quantum coherence ESR: study of T4 lysozyme. J Am Chem Soc. 2002;124(19):5304–14. doi: 10.1021/ja020040y. [DOI] [PubMed] [Google Scholar]
- Bowers PM, Strauss CEM, et al. Denovo protein structure determination using sparse NMR data. J. Biomol. NMR. 2000;18:311–318. doi: 10.1023/a:1026744431105. [DOI] [PubMed] [Google Scholar]
- Bradley P, Chivian D, et al. Rosetta in CASP5: Progress in ab initio protein structure prediction. Proteins: Struct., Funct., Genet. 2003;53(Suppl 6):457–468. [Google Scholar]
- Bradley P, Malmstrom L, et al. Free modeling with Rosetta in CASP6. Proteins. 2005;61(Suppl 7):128–34. doi: 10.1002/prot.20729. [DOI] [PubMed] [Google Scholar]
- Bradley P, Misura KM, et al. Toward high-resolution de novo structure prediction for small proteins. Science. 2005;309(5742):1868–71. doi: 10.1126/science.1113801. [DOI] [PubMed] [Google Scholar]
- Brown LJ, Sale KL, et al. Structure of the inhibitory region of troponin by site directed spin labeling electron paramagnetic resonance. Proc Natl Acad Sci U S A. 2002;99(20):12765–70. doi: 10.1073/pnas.202477399. [DOI] [PMC free article] [PubMed] [Google Scholar]
- Bryson K, McGuffin LJ, et al. Protein structure prediction servers at University College London. Nucleic Acids Res. 2005;33(Web Server issue):W36–8. doi: 10.1093/nar/gki410. [DOI] [PMC free article] [PubMed] [Google Scholar]
- Chiang YW, Borbat PP, et al. The determination of pair distance distributions by pulsed ESR using Tikhonov regularization. J Magn Reson. 2005;172(2):279–95. doi: 10.1016/j.jmr.2004.10.012. [DOI] [PubMed] [Google Scholar]
- Dong J, Yang G, et al. Structural basis of energy transduction in the transport cycle of MsbA. Science. 2005;308(5724):1023–8. doi: 10.1126/science.1106592. [DOI] [PubMed] [Google Scholar]
- Dunbrack RL,, Jr. Rotamer libraries in the 21st century. Curr Opin Struct Biol. 2002;12(4):431–40. doi: 10.1016/s0959-440x(02)00344-5. [DOI] [PubMed] [Google Scholar]
- Dunbrack RL,, Jr., Karplus M. Backbone-dependent rotamer library for proteins. Application to side-chain prediction. J Mol Biol. 1993;230(2):543–74. doi: 10.1006/jmbi.1993.1170. [DOI] [PubMed] [Google Scholar]
- Fanucci GE, Cafiso DS. Recent advances and applications of site-directed spin labeling. Curr Opin Struct Biol. 2006;16(5):644–53. doi: 10.1016/j.sbi.2006.08.008. [DOI] [PubMed] [Google Scholar]
- Farahbakhsh ZT, Altenbach C, et al. Spin labeled cysteines as sensors for protein-lipid interaction and conformation in rhodopsin. Photochem Photobiol. 1992;56(6):1019–33. doi: 10.1111/j.1751-1097.1992.tb09725.x. [DOI] [PubMed] [Google Scholar]
- Finn RD, Mistry J, et al. Pfam: clans, web tools and services. Nucleic Acids Res. 2006;34(Database issue):D247–51. doi: 10.1093/nar/gkj149. [DOI] [PMC free article] [PubMed] [Google Scholar]
- Fischer D. Hybrid fold recognition: combining sequence derived properties with evolutionary information. Pac Symp Biocomput. 2000:119–30. [PubMed] [Google Scholar]
- Ginalski K, Elofsson A, et al. 3D-Jury: a simple approach to improve protein structure predictions. Bioinformatics. 2003;19(8):1015–8. doi: 10.1093/bioinformatics/btg124. [DOI] [PubMed] [Google Scholar]
- Ginalski K, von Grotthuss M, et al. Detecting distant homology with Meta-BASIC. Nucleic Acids Res. 2004;32(Web Server issue):W576–81. doi: 10.1093/nar/gkh370. [DOI] [PMC free article] [PubMed] [Google Scholar]
- Haley DA, Bova MP, et al. Small heat-shock protein structures reveal a continuum from symmetric to variable assemblies. J Mol Biol. 2000;298(2):261–72. doi: 10.1006/jmbi.2000.3657. [DOI] [PubMed] [Google Scholar]
- Harrison SC. Whither structural biology? Nat Struct Mol Biol. 2004;11(1):12–5. doi: 10.1038/nsmb0104-12. [DOI] [PubMed] [Google Scholar]
- Horwitz J. Alpha-crystallin can function as a molecular chaperone. Proc Natl Acad Sci U S A. 1992;89(21):10449–53. doi: 10.1073/pnas.89.21.10449. [DOI] [PMC free article] [PubMed] [Google Scholar]
- Horwitz J. Proctor Lecture. The function of alpha-crystallin. Invest Ophthalmol Vis Sci. 1993;34(1):10–22. [PubMed] [Google Scholar]
- Hubbell WL, Mchaourab HS, et al. Watching proteins move using site-directed spin labeling. Structure. 1996;4(7):779–83. doi: 10.1016/s0969-2126(96)00085-8. [DOI] [PubMed] [Google Scholar]
- Jeschke G. Distance measurements in the nanometer range by pulse EPR. Chemphyschem. 2002;3(11):927–32. doi: 10.1002/1439-7641(20021115)3:11<927::AID-CPHC927>3.0.CO;2-Q. [DOI] [PubMed] [Google Scholar]
- Jones DT. Protein Secondary Structure Prediction Based on Position-specific Scoring Matrices. J. Mol. Biol. 1999;292(2):195–202. doi: 10.1006/jmbi.1999.3091. [DOI] [PubMed] [Google Scholar]
- Karplus K, Karchin R, et al. Combining local-structure, fold-recognition, and new fold methods for protein structure prediction. Proteins. 2003;53(Suppl 6):491–6. doi: 10.1002/prot.10540. [DOI] [PubMed] [Google Scholar]
- Karplus K, Sjolander K, et al. Predicting protein structure using hidden Markov models. Proteins. 1997;(Suppl 1):134–9. doi: 10.1002/(sici)1097-0134(1997)1+<134::aid-prot18>3.3.co;2-q. [DOI] [PubMed] [Google Scholar]
- Kelley LA, MacCallum RM, et al. Enhanced genome annotation using structural profiles in the program 3D-PSSM. J Mol Biol. 2000;299(2):499–520. doi: 10.1006/jmbi.2000.3741. [DOI] [PubMed] [Google Scholar]
- Kim KK, Kim R, et al. Crystal structure of a small heat-shock protein. Nature. 1998;394(6693):595–9. doi: 10.1038/29106. [DOI] [PubMed] [Google Scholar]
- Koteiche HA, Berengian AR, et al. Identification of protein folding patterns using site-directed spin labeling. Structural characterization of a beta-sheet and putative substrate binding regions in the conserved domain of alpha A-crystallin. Biochemistry. 1998;37(37):12681–8. doi: 10.1021/bi9814078. [DOI] [PubMed] [Google Scholar]
- Koteiche HA, Mchaourab HS. Folding pattern of the alpha-crystallin domain in alphaA-crystallin determined by site-directed spin labeling. J Mol Biol. 1999;294(2):561–77. doi: 10.1006/jmbi.1999.3242. [DOI] [PubMed] [Google Scholar]
- Kuhlman B, Baker D. Native protein sequences are close to optimal for their structures. Proc. Natl. Acad. Sci. U. S. A. 2000;97(19):10383–10388. doi: 10.1073/pnas.97.19.10383. [DOI] [PMC free article] [PubMed] [Google Scholar]
- Langen R, Oh KJ, et al. Crystal structures of spin labeled T4 lysozyme mutants: implications for the interpretation of EPR spectra in terms of structure. Biochemistry. 2000;39(29):8396–405. doi: 10.1021/bi000604f. [DOI] [PubMed] [Google Scholar]
- Lesley SA, Kuhn P, et al. Structural genomics of the Thermotoga maritima proteome implemented in a high-throughput structure determination pipeline. Proc Natl Acad Sci U S A. 2002;99(18):11664–9. doi: 10.1073/pnas.142413399. [DOI] [PMC free article] [PubMed] [Google Scholar]
- Liu YS, Sompornpisut P, et al. Nat Struct Biol. 10. Vol. 8. 2001. Structure of the KcsA channel intracellular gate in the open state. pp. 883–7. [DOI] [PubMed] [Google Scholar]
- McGuffin LJ, Jones DT. Improvement of the GenTHREADER method for genomic fold recognition. Bioinformatics. 2003;19(7):874–81. doi: 10.1093/bioinformatics/btg097. [DOI] [PubMed] [Google Scholar]
- Mchaourab HS, Berengian AR, et al. Site-directed spin-labeling study of the structure and subunit interactions along a conserved sequence in the alpha-crystallin domain of heat-shock protein 27. Evidence of a conserved subunit interface. Biochemistry. 1997;36(48):14627–34. doi: 10.1021/bi971700s. [DOI] [PubMed] [Google Scholar]
- Mchaourab HS, Lietzow MA, et al. Motion of spin-labeled side chains in T4 lysozyme. Correlation with protein structure and dynamics. Biochemistry. 1996;35(24):7692–704. doi: 10.1021/bi960482k. [DOI] [PubMed] [Google Scholar]
- Meiler J. JUFO3D: Coupled Prediction of Protein Secondary and Tertiary Structure (server). 2003 doi: 10.1073/pnas.1831973100. www.meilerlab.org. [DOI] [PMC free article] [PubMed]
- Meiler J, Baker D. Coupled Prediction of Protein Secondary and Tertiary Structure. PNAS. 2003;100(21):12105–12110. doi: 10.1073/pnas.1831973100. [DOI] [PMC free article] [PubMed] [Google Scholar]
- Meiler J, Baker D. Rapid Protein Structure Elucidation Utilizing Unassigned NMR Data. PNAS. 2003;100(26):15404–15409. doi: 10.1073/pnas.2434121100. [DOI] [PMC free article] [PubMed] [Google Scholar]
- Meiler J, Baker D. The fumarate sensor DcuS: progress in rapid protein fold elucidation by combining protein structure prediction methods with NMR spectroscopy. J Magn Reson. 2005;173(2):310–6. doi: 10.1016/j.jmr.2004.11.031. [DOI] [PubMed] [Google Scholar]
- Meiler J, Bradley P, et al. ROSETTA in CASP5: Progress in de novo protein structure prediction (poster) Molecular Modeling Workshop.; Erlangen, Bavaria, Germany: 2003. [Google Scholar]
- Meiler J, Müller M, et al. Generation and Evaluation of Dimension Reduced Amino Acid Parameter Representations by Artificial Neural Networks. J. Mol. Model. 2001;7(9):360–369. [Google Scholar]
- Misura KM, Baker D. Progress and challenges in high-resolution refinement of protein structure models. Proteins. 2005;59(1):15–29. doi: 10.1002/prot.20376. [DOI] [PubMed] [Google Scholar]
- Misura KM, Chivian D, et al. Physically realistic homology models built with ROSETTA can be more accurate than their templates. Proc Natl Acad Sci U S A. 2006;103(14):5361–6. doi: 10.1073/pnas.0509355103. [DOI] [PMC free article] [PubMed] [Google Scholar]
- Nederveen AJ, Doreleijers JF, et al. RECOORD: a recalculated coordinate database of 500+ proteins from the PDB using restraints from the BioMagResBank. Proteins. 2005;59(4):662–72. doi: 10.1002/prot.20408. [DOI] [PubMed] [Google Scholar]
- Perozo E, Cortes DM, et al. Structural rearrangements underlying K+-channel activation gating. Science. 1999;285(5424):73–8. doi: 10.1126/science.285.5424.73. [DOI] [PubMed] [Google Scholar]
- Rabenstein MD, Shin YK. Determination of the distance between two spin labels attached to a macromolecule. Proc Natl Acad Sci U S A. 1995;92(18):8239–43. doi: 10.1073/pnas.92.18.8239. [DOI] [PMC free article] [PubMed] [Google Scholar]
- Rohl C, Baker D. De Novo Determination of Protein Backbone Structure from Residual Dipolar Couplings Using Rosetta. J. Am. Chem. Soc. 2002;124(11):2723–2729. doi: 10.1021/ja016880e. [DOI] [PubMed] [Google Scholar]
- Rohl CA, Strauss CE, et al. Protein structure prediction using Rosetta. Methods Enzymol. 2004;383:66–93. doi: 10.1016/S0076-6879(04)83004-0. [DOI] [PubMed] [Google Scholar]
- Rost B. Review: protein secondary structure prediction continues to rise. J Struct Biol. 2001;134(2−3):204–18. doi: 10.1006/jsbi.2001.4336. [DOI] [PubMed] [Google Scholar]
- Rost B, Sander C. Improved prediction of protein secondary structure by use of sequence profiles and neural networks. Proc. Natl. Acad. Sci. USA. 1993;90:7558–7562. doi: 10.1073/pnas.90.16.7558. [DOI] [PMC free article] [PubMed] [Google Scholar]
- Rost B, Yachdav G, et al. The PredictProtein server. Nucleic Acids Res. 2004;32(Web Server issue):W321–6. doi: 10.1093/nar/gkh377. [DOI] [PMC free article] [PubMed] [Google Scholar]
- Sale K, Song L, et al. Explicit treatment of spin labels in modeling of distance constraints from dipolar EPR and DEER. J Am Chem Soc. 2005;127(26):9334–5. doi: 10.1021/ja051652w. [DOI] [PubMed] [Google Scholar]
- Sali A. 100,000 protein structures for the biologist. Nature structural biology. 1998;5(12):1029–1032. doi: 10.1038/4136. [DOI] [PubMed] [Google Scholar]
- Shi J, Blundell TL, et al. FUGUE: sequence-structure homology recognition using environment-specific substitution tables and structure-dependent gap penalties. J Mol Biol. 2001;310(1):243–57. doi: 10.1006/jmbi.2001.4762. [DOI] [PubMed] [Google Scholar]
- Simons KT, Kooperberg C, et al. Assembly of Protein Tertiary Structures from Fragments with Similar Local Sequences using Simulated Annealing and Bayesian Scoring Functions. J. Mol. Biol. 1997;268:209–225. doi: 10.1006/jmbi.1997.0959. [DOI] [PubMed] [Google Scholar]
- Simons KT, Ruczinski I, et al. Improved Recognition of Native-Like Protein Structures Using a Combination of Sequence-Dependent and Sequence-Independent Features of Proteins. Proteins: Structure, Function, and Genetics. 1999;34:82–95. doi: 10.1002/(sici)1097-0134(19990101)34:1<82::aid-prot7>3.0.co;2-a. [DOI] [PubMed] [Google Scholar]
- Soding J, Biegert A, et al. The HHpred interactive server for protein homology detection and structure prediction. Nucleic Acids Res. 2005;33(Web Server issue):W244–8. doi: 10.1093/nar/gki408. [DOI] [PMC free article] [PubMed] [Google Scholar]
- Sompornpisut P, Mchaourab H, et al. Spectroscopically- determined solvent accessibilities as constraints for global fold discrimination in proteins. Biophysical Journal. 2002;82(1):474. [Google Scholar]
- Stamler R, Kappe G, et al. Wrapping the alpha-crystallin domain fold in a chaperone assembly. J Mol Biol. 2005;353(1):68–79. doi: 10.1016/j.jmb.2005.08.025. [DOI] [PubMed] [Google Scholar]
- Stevens RC, Yokoyama S, et al. Global efforts in structural genomics. Science. 2001;294(5540):89–92. doi: 10.1126/science.1066011. [DOI] [PubMed] [Google Scholar]
- Tusnady GE, Dosztanyi Z, et al. Transmembrane proteins in the Protein Data Bank: identification and classification. Bioinformatics. 2004;20(17):2964–72. doi: 10.1093/bioinformatics/bth340. [DOI] [PubMed] [Google Scholar]
- van Montfort RL, Basha E, et al. Crystal structure and assembly of a eukaryotic small heat shock protein. Nat Struct Biol. 2001;8(12):1025–30. doi: 10.1038/nsb722. [DOI] [PubMed] [Google Scholar]
- Weaver LH, Matthews BW. Structure of bacteriophage T4 lysozyme refined at 1.7 A resolution. J Mol Biol. 1987;193(1):189–99. doi: 10.1016/0022-2836(87)90636-x. [DOI] [PubMed] [Google Scholar]
- Westbrook J, Feng Z, et al. The Protein Data Bank and structural genomics. Nucleic Acids Res. 2003;31(1):489–91. doi: 10.1093/nar/gkg068. [DOI] [PMC free article] [PubMed] [Google Scholar]
- Wüthrich K. NMR of Proteins and Nucleic Acids (1H-NMR shifts of amino acids) John Wiley & Sons; New York, Chichester, Brisbane, Toronto, Singapore: 1986. [Google Scholar]