

Abstract
The “peroxy” intermediate (P form) of bovine cytochrome c oxidase was prepared by reaction of the two-electron reduced mixed-valence CO complex with 18O2 after photolytic removal of CO. The water present in the reaction mixture was recovered and analyzed for 18O enrichment by mass spectrometry. It was found that approximately one oxygen atom (18O) per one equivalent of the P form was present in the bulk water. The data show that the oxygen–oxygen dioxygen bond is already broken in the P intermediate and that one oxygen atom can be readily released or exchanged with the oxygen of the solvent water.
Bovine cytochrome c oxidase (CcO) catalyzes the oxidation of ferrocytochrome c and the reduction of dioxygen to water in a process that conserves a fraction of the energy released in the redox process by translocating protons across the inner membrane of the mitochondrion. For this process, the enzyme depends on four transition metal centers: cytochrome a, CuA, cytochrome a3, and CuB. Electrons from ferrocytochrome c are transferred to CuA and subsequently delivered to the cytochrome a3–CuB binuclear center via cytochrome a; the conversion of O2 to H2O is effected at this binuclear center.
When the enzyme is fully reduced (Fe+2aCu+AFe+2a3Cu+B), a process requiring four electrons, the reaction with O2 is fast, and detection of intermediates usually requires rapid kinetic techniques and transient spectroscopic methods. In contrast, when partially reduced oxidase reacts with O2, it is possible to obtain relatively stable oxygenated intermediates of the enzyme (1, 2). One of these intermediates, the “peroxy” or P form, is a product of the reaction of the two-electron reduced enzyme with O2. This P form is readily prepared on reaction of the two-electron reduced mixed-valence CO complex (MV-CO or Fe+3aCu+2AFe+2a3 CO Cu+B) with oxygen after photolytic removal of the bound CO (3–9). The same compound P can be observed after reaction of oxidized enzyme with hydrogen peroxide (10–14) and in mitochondria during reverse electron flow (15–17). Because the P form of the enzyme is formally at the two-electron reduced state, it was initially expected to have an intact oxygen–oxygen bond (e.g., Fe+3a Cu+2A Fe+3a3–O–O–Cu+2B; refs. 10, 12, 15, and 17–19). However, recent resonance Raman experiments (20–23) and data from reductive titrations of the P form (24) suggest that the O–O bond is broken, and the presence of H2O2 in this species could not be detected (25).
Cleavage of the oxygen–oxygen bond requires that an additional two reducing equivalents be available. These would need to be provided by one or more groups present in the enzyme. The reaction mechanism might then be analogous to the formation of compound I in heme peroxidases, during which reaction hydrogen peroxide is decomposed.
Because the nature of the P intermediate of CcO is controversial and our understanding of it is based entirely on spectroscopic observations, we have addressed the question directly as to whether the dioxygen bond is broken in this form of the enzyme by using mass spectrometry to search for the water that would be a product of this reaction.
When the production of P is carried out in the presence of 18O2 we find that one equivalent of H218O appears in the solvent. This observation implies that the O–O bond is split and that one of the oxygen atoms thus produced is either released as H2O or can equilibrate with H2O in the solvent.
Materials and Methods
18O2 (minimum enrichment 95%) was obtained from Stable Isotopes ICON (Mt. Marion, NY). 18O water was obtained from Cambridge Isotope Laboratories (Cambridge, MA), and n-dodecyl-β-d-maltoside was obtained from Anatrace (Maumee, OH).
Enzyme Isolation.
CcO was isolated by the method of Soulimane and Buse (26) with minor modifications (25). During the isolation of the enzyme, K2SO4 was used in place of chloride salts, and for the extraction of cytochrome bc1 complex and CcO by Triton X-100, the mitochondrial protein concentration was 20 and 10 mg⋅ml−1, respectively. Enzyme concentration was determined at pH 8.0 from the absorption spectrum of oxidized oxidase at 424 nm by using A = 158 mM−1⋅cm−1.
Preparation of P Intermediate With 18O2.
The following manipulations were performed by using a gas manifold that had connections for purified argon, carbon monoxide, the break-seal flask containing the 18O2, a source of vacuum, and a Thunberg-type optical cell. The P intermediate of the enzyme (CcO-607) was prepared in the optical cell from MV-CO. The enzyme was first made anaerobic under an argon atmosphere, and argon was then replaced with CO. The MV-CO was formed in 100% yield within 3–5 min at room temperature as gauged by optical changes at 590–630 nm. Spectral measurements in the Soret region showed that there was no reduction past the two-electron level.
The cuvette was quickly reattached to the manifold, and the concentration of CO was lowered to minimize overreduction by using two cycles of evacuation and exposure to argon. After the second cycle, the argon was removed, and the MV-CO derivative was cooled to 0°C. At this temperature, the dioxygen isotope 18O2 bled into the cell, and the sample was quickly mixed and exposed to a flash of light (Sunpak auto 544 at full setting; Tocad, Tokyo). The enzyme sample was then transferred into a precooled 50-ml round-bottom flask and shell frozen as a thin layer at −78°C. The time needed to introduce the 18O2, mix the sample, and freeze it was 1 min. In experiments in which the yield of P was verified by optical measurements, the time required before the sample was frozen was about 2 min.
The yield of the P form was estimated from the optical spectrum of P minus that of the oxidized enzyme by using ΔA607–630 = 11 mM−1⋅cm−1 (17); the yield was never less than 90%. All optical measurements were performed on a Hewlett–Packard Diode Array spectrometer (HP 8452A) by using anaerobic cuvettes with a 2-mm optical path. The temperature in the thermostated cuvette holder was 4°C. In all experiments, the buffer was 55 mM Tris-SO4 (pH 8.0) containing 0.1% n-dodecyl-β-d-maltoside; the enzyme concentration was 253 μM in all experiments, and the yield of P form was 228 ± 7 μM.
Distillation.
The distillation apparatus consisted of two connected vessels. The first was the round-bottom flask containing the enzyme. It was attached to the second, a water trap, with a standard taper joint. The second vessel was mounted in a dewar flask and connected to a vacuum pump. The distillation process was performed in three steps for each sample. The first step was to evacuate the apparatus for 15 min to remove both the residual water vapor in the trap and any remaining dioxygen and carbon monoxide present in the sample. During this stage, the sample was maintained at −78°C, and the water trap was kept at room temperature. In the second step, the trap was cooled down to liquid nitrogen temperature. The sample was held at −78°C, and the evacuation was continued for another 15 min. This step ensured that the trap flask had reached liquid nitrogen temperature before the distillation was started. No loss of water from the sample was observed at this temperature. In the third step, the distillation was initiated by raising the sample temperature to −35°C and keeping the trap immersed in liquid nitrogen. The distillation was continued for 90 min, which was sufficient time to lyophilize the enzyme completely. The vacuum was then turned off, and the trap was removed from the liquid nitrogen. Air immediately bled into the trap via a 2-μm filter, and then the system was closed while the trap warmed up to room temperature. When the collected water had drained to the bottom of the trap, the apparatus was disassembled, and the water was recovered and analyzed for 18O enrichment by mass spectrometry.
Gas-Isotope-Ratio Mass Spectrometry.
For oxygen-isotope-ratio measurements (27), 100 μl of water was allowed to equilibrate with 300 mbar (1 bar = 100 kPa) of CO2 of known 18O content at 25°C for 10 h by using a VG ISOPREP-18 water-CO2 equilibration system (VG Isogas, Cheshire, England). At the end of the equilibration, the 18O/16O isotope ratios of the CO2 were measured with a VG SIRA-12 gas-isotope-ratio mass spectrometer (VG Isogas). The results are expressed as δ values [in percent per thousand (‰) units], which are defined as follows:
 |
1 |
where Rx and Rs are the 18O/16O isotope ratios of the sample and standard, respectively. The δ18O values were normalized against two international water standards: Vienna-Standard Mean Ocean Water and Standard Light Antarctic Precipitation (28).
Results and Discussion
The strategy used in these experiments is straightforward. First, two-electron reduced cytochrome oxidase is prepared in a stable form as the MV-CO derivative. The MV-CO compound is exposed to 18O2, and the CO is photodissociated, whereupon the P form is generated in better than 90% yield. A sample of water is recovered from the reaction mixture and examined for the presence of H218O by mass spectrometry.
In this study, we had to avoid two main complications to obtain reliable data. We had to be sure first that there was no significant contribution to water production from turnover of the P form and second that the P form, once formed, is stable during the freezing and distillation procedure.
To assess the first of these complications, a sample of ≈230 μM P was interrogated with a Clark-type oxygen electrode, and it was found that there was a small but finite consumption of dioxygen by the enzyme derivative. At pH 8.0 and 24°C, we measured a rate of oxygen consumption of 3 × 10⁻³ s−1, which fell to 6 × 10⁻⁴ s−1 when the temperature was lowered to 4°C. From these data, we estimated that about 3.5% of the P form would decompose to yield oxidized enzyme plus water in 1 min at 4°C. Consequently, in the preparation of P, we kept the enzyme samples at 0°C after exposing MV-CO to 18O2 and froze the reaction mixture as quickly as possible; in those experiments in which the optical spectrum of the P form was not recorded, about 1 min elapsed between the addition of the labeled oxygen to MV-CO and the freezing of the P form. In experiments in which the optical spectrum was recorded, an additional minute was expended.
The second consideration is the stability of the P form during freezing and distillation. To evaluate the stability of P, we first determined the concentration of P by recording its visible spectrum. The sample was then frozen and lyophilized as described in Materials and Methods. At the conclusion of the distillation, the lyophilized powder was dissolved in the working buffer, and the amount of P present was determined spectrophotometrically once more. The data showed that the extent of decomposition of P was less than 10%. Moreover, we believe that this decrease is not a result of the decomposition of P while in the frozen state but that the decrease is caused by the decay of P during the several minutes needed to dissolve the lyophilized material. Thus, the P form is in fact quite stable, provided that the frozen enzyme and lyophilized powder are kept at temperatures below −30°C. When the sample was allowed to warm up to room temperature during lyophilization, the optical spectrum of the redissolved material was predominantly that of the oxidized enzyme.
The data obtained on 18O enrichment are presented in Table 1 as the average relative enrichment δ18O (defined in Materials and Methods) together with the number of replicates analyzed and the calculated standard deviation. All data come from the analysis of distillates and include seven controls, three H218O standards, and the P form. From the data shown in Table 1, we conclude, as expected, that the relative enrichment of 18O is almost the same in plain buffer, in buffer containing 20 mM CN, in buffer with oxCcO, and in samples of buffer containing oxCcO and oxCcO.CN that were exposed to 18O2. The buffer and oxCcO treated with 18O2 were prepared in exactly the same way as the P form, except that the treatment with CO was omitted. When the complete procedure was carried out with oxCcO.CN instead of CcO (such that MV-CO, and hence P, could not be made), the 18O enrichment is the same as the other controls, thus indicating that there is no nonspecific 18O release when the cytochrome a3–CuB binuclear center is blocked from reaction. The presence of enzyme in the medium does not change the δ18O enrichment in distillates, a fact which is shown by the same values for samples in which 300 μM H218O (final concentration) was added to 253 μM oxCcO (CcO + H218O) or to the buffer (buffer + 300 μM H218O). The data for buffer alone, for buffer with known amounts of H218O, and for the average of the P forms are presented in Fig. 1.
Table 1.
Summary of mass spectrometric data
| Sample description | No. of samples | Relative enrichment, δ18O, ‰ | Standard deviation, ‰ |
|---|---|---|---|
| Controls | |||
| Buffer* | 8 | 22.00 | 1.10 |
| Buffer + 18O2 | 2 | 20.89 | 0.06 |
| Buffer + CN | 2 | 20.69 | 0.53 |
| oxCcO | 4 | 22.85 | 0.40 |
| oxCcO + 18O2 | 2 | 22.70 | 0.25 |
| oxCcO.CN + 18O2 | 2 | 22.67 | 0.57 |
| oxCcO + 300 μM H218O | 2 | 26.63 | 0.06 |
| Calibrations | |||
| Buffer + 150 μM H218O | 6 | 23.48 | 1.88 |
| Buffer + 300 μM H218O | 10 | 26.52 | 1.09 |
| Buffer + 600 μM H218O | 6 | 28.94 | 0.45 |
| Compound P (228 μM) | 3 | 24.59 | 0.89 |
The buffer was composed of 55 mM Tris-SO4 (pH 8.0) containing 0.1% n-dodecyl-β-d-maltoside. (CN, cyanide; oxCcO, oxidized CcO; oxCcO.CN, oxCcO complexed with CN.
Figure 1.

Dependence of sample enrichment [δ18O] on 18O concentration for H218O (●); the solid line is a linear regression on these points. The average enrichment for the P samples vs. the concentration of P is plotted on the same graph (■). The interpolation of the mass spectrometric signal of P form onto the straight line indicates that the average H218O content of three P samples was 210 μM; the average concentration of P determined optically was 228 ± 7 μM.
Fig. 1 and Table 1 make it clear that the medium of the P form is more enriched with 18O than the natural abundance found in the control samples. Using the three samples of known concentrations of H218O, we have constructed a linear calibration curve (Fig. 1, straight line). The average 18O enrichment for the P samples vs. the concentration of P is plotted on the same graph (▪). The interpolation of the mass spectrometric signal of the P form onto the calibration curve shows that the average H218O content of three P samples was 210 μM. The actual concentration of P determined optically was 228 μM; this value represents 0.92 oxygen atoms released into the medium per equivalent of P form. The calculated standard deviation from the three measurements is ±0.32.
Because the P form is produced in the reaction of two-electron reduced enzyme with dioxygen, the original expectation was that it could be represented formally as peroxide bound to the binuclear center in which cytochrome a3 was in the ferric and CuB was in the cupric oxidation states (10, 12, 15, 17–19). However, we conclude that the one 18O atom detected in the solvent cannot originate from the intact peroxide in the binuclear center. First, in the minute time scale of the present experiment, the rate of oxygen exchange between bound peroxide and water should be negligible. The quantitative data on the rate of 18O exchange between peroxovanadium or peroxomolybdenum compounds and water show that the half-time is more than 10 h at room temperature (29). Second, resonance Raman data on P generated by reaction of MV-CO with oxygen and enzyme treated with H2O2 (20–23) consistently show the presence of a vibrational mode assigned as a Fe(IV)=O stretch. Third, reductive titrations of P indicated that only slightly more than one electron is needed to convert the visible spectrum of P into that of oxidized enzyme (24). Taken together, the experiments convincingly show that the oxygen–oxygen bond is already broken in the P form and that the iron of cytochrome a3 is in the ferryl state.
It therefore follows that the formation of P is a four-electron process. Two of these electrons are clearly provided by ferrous a3 and cuprous CuB, whereas the remaining two electrons must be provided by groups within the enzyme. One of these undoubtedly comes from the oxidation of the heme iron, from Fe(III) to Fe(IV), as is revealed by the Raman data. The fourth electron equivalent must be provided by some group, yet to be identified, located in the enzyme. One possibility is the oxidation of an amino acid, as has been suggested by EPR data (30–32). Thus, enzyme treated with hydrogen peroxide gives free-radical-like EPR signals (30, 32). The free radical seems to be located on Tyr-244 (Y0, neutral tyrosine radical; bovine sequence), whereas spin-trapping experiments have revealed that reaction with hydrogen peroxide generates an organic radical, probably centered on cysteine (31). These various radical signals seem to originate from the redox reaction of hydrogen peroxide in the binuclear center, because these radicals are absent in enzyme inhibited by CN (30–32). The two obvious possibilities for the group present in the binuclear cavity that initially reacts with hydrogen peroxide are CuB [which would have to be oxidized to Cu(III)] or an amino acid residue that would be oxidized to either a cationic radical or a neutral radical depending on whether the reaction also involved a proton.
From the crystal structures of bovine CcO and the related oxidase from Paracoccus denitrificans, it was concluded that there is a covalent bond between one of the CuB ligands, His-240, and Tyr-244 (33, 34). Recently, this conclusion has been supported by peptide sequencing data from four distantly related heme-copper oxidases (35). It is attractive to believe that this unique cross-linked His–Tyr structure present in the binuclear cavity is the required electron donor (36). We believe that the reaction we have studied can be summarized as shown in Scheme S1.
Scheme 1.
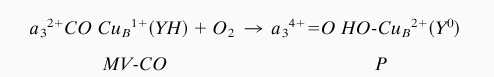
Transition of two-electron reduced mixed-valence CO complex of CcO to the “peroxy” intermediate.
The conversion of oxidized CcO to the MV-CO derivative seems to be accompanied by the uptake of two protons (M.F. and G.P., unpublished work), whereas the conversion of MV-CO to the P form occurs without any demonstrable change in pH (37). Thus, there are sufficient protons sequestered in the enzyme to support formation of either OH− or of H2O. The former would presumably be retained as CuB-OH.
Our scheme for the dioxygen cleavage reaction requires that one oxygen atom is retained by the heme iron in the oxyferryl structure. Resonance Raman data on the P form indicate that the oxygen atom in the Fe(IV)=O of P form is not exchangeable with the oxygen atoms of bulk water (22); thus, this oxygen atom is unlikely to be the one that we detect by mass spectrometry.
This behavior should be contrasted with the results of experiments in which fully reduced enzyme was allowed to react with 18O2; in these experiments, both atoms of oxygen could be accounted for as H218O released to the solvent (38). Thus, either both atoms of oxygen are bound within the binuclear center as exchange-labile species, plausibly Fe-OH and Cu-OH, that are able to undergo facile exchange with the bulk solvent, or one or both of the oxygen atoms are explicitly liberated to the solvent. Michel and colleagues (32) have interpreted electron density present between the Fe and Cu as arising from an arrangement such as Fe–OH2… HO–Cu, and recent x-ray absorption spectra of cytochrome bo3 from Escherichia coli (39) are consistent with such an interpretation.
Acknowledgments
R.B.G. thanks Dr. D. Zaslavsky for many helpful discussions. This research was supported by National Institutes of Health Grants GM 55807 (to G.P.) and HL 16101 (to R.B.G.) and Welch Foundation Grant C636 (to G.P.). The isotope ratio measurements (made by W.W.W.) were supported with federal funds from the U. S. Department of Agriculture, Agricultural Research Service, under Cooperative Agreement 58-6250-6-001.
Abbreviations
- CcO
cytochrome c oxidase
- compound P (P form)
peroxy intermediate of cytochrome c oxidase
- MV-CO
two-electron reduced mixed-valence CO complex (Fe+3aCu+2AFe+2a3 CO Cu+B)
- CN
cyanide
- oxCcO
oxidized CcO
Footnotes
See commentary on page 12971.
References
- 1.Witt S N, Blair D F, Chan S I. J Biol Chem. 1986;261:8104–8107. [PubMed] [Google Scholar]
- 2.Witt S N, Chan S I. J Biol Chem. 1987;262:1446–1448. [PubMed] [Google Scholar]
- 3.Greenwood C, Wilson M T, Brunori M. Biochem J. 1974;137:205–215. doi: 10.1042/bj1370205. [DOI] [PMC free article] [PubMed] [Google Scholar]
- 4.Chance B, Saronio C, Leigh J S., Jr J Biol Chem. 1975;250:9226–9237. [PubMed] [Google Scholar]
- 5.Clore M, Chance E. Biochem J. 1978;173:811–820. doi: 10.1042/bj1730811. [DOI] [PMC free article] [PubMed] [Google Scholar]
- 6.Chance B, Saronio C, Leigh J S., Jr Biochem J. 1979;177:931–941. doi: 10.1042/bj1770931. [DOI] [PMC free article] [PubMed] [Google Scholar]
- 7.Clore G M, Andreasson L E, Karlsson B, Aasa R, Malmström B G. Biochem J. 1980;185:155–167. doi: 10.1042/bj1850155. [DOI] [PMC free article] [PubMed] [Google Scholar]
- 8.Dennis M. Biochim Biophys Acta. 1981;634:30–40. doi: 10.1016/0005-2728(81)90125-0. [DOI] [PubMed] [Google Scholar]
- 9.Hill B, Greenwood C. Biochem J. 1983;215:659–667. doi: 10.1042/bj2150659. [DOI] [PMC free article] [PubMed] [Google Scholar]
- 10.Wrigglesworth J M. Biochem J. 1984;217:715–719. doi: 10.1042/bj2170715. [DOI] [PMC free article] [PubMed] [Google Scholar]
- 11.Kumar C, Naqui A, Chance B. J Biol Chem. 1984;259:11668–11671. [PubMed] [Google Scholar]
- 12.Vygodina T, Konstantinov A A. Biochim Biophys Acta. 1989;973:390–398. doi: 10.1016/s0005-2728(89)80380-9. [DOI] [PubMed] [Google Scholar]
- 13.Weng L, Baker G M. Biochemistry. 1991;30:5727–5733. doi: 10.1021/bi00237a014. [DOI] [PubMed] [Google Scholar]
- 14.Fabian M, Palmer G. Biochemistry. 1995;34:1534–1540. doi: 10.1021/bi00005a009. [DOI] [PubMed] [Google Scholar]
- 15.Wikström M. Proc Natl Acad Sci USA. 1981;78:4051–4054. doi: 10.1073/pnas.78.7.4051. [DOI] [PMC free article] [PubMed] [Google Scholar]
- 16.Wikström M. Chem Scr. 1988;28:71–74. [Google Scholar]
- 17.Wikström M, Morgan J. J Biol Chem. 1992;267:10266–10273. [PubMed] [Google Scholar]
- 18.Orii Y. Ann N Y Acad Sci. 1988;550:105–117. doi: 10.1111/j.1749-6632.1988.tb35327.x. [DOI] [PubMed] [Google Scholar]
- 19.Vygodina T, Konstantinov A. Ann N Y Acad Sci. 1988;550:124–138. doi: 10.1111/j.1749-6632.1988.tb35329.x. [DOI] [PubMed] [Google Scholar]
- 20.Proshlyakov D A, Ogura T, Shinzava-Itoh K, Yoshikawa S, Appelman E H, Kitagawa T. J Biol Chem. 1994;269:29385–29388. [PubMed] [Google Scholar]
- 21.Proshlyakov D A, Ogura T, Shinzava-Itoh K, Yoshikawa S, Kitagawa T. Biochemistry. 1996;35:76–82. doi: 10.1021/bi9511705. [DOI] [PubMed] [Google Scholar]
- 22.Proshlyakov D A, Ogura T, Shinzava-Itoh K, Yoshikawa S, Kitagawa T. Biochemistry. 1996;35:8580–8586. doi: 10.1021/bi952096t. [DOI] [PubMed] [Google Scholar]
- 23.Proshlyakov D A, Pressler M A, Babcock G T. Proc Natl Acad Sci USA. 1998;95:8020–8025. doi: 10.1073/pnas.95.14.8020. [DOI] [PMC free article] [PubMed] [Google Scholar]
- 24.Fabian M, Palmer G. Biochemistry. 1999;38:6270–6275. doi: 10.1021/bi982541v. [DOI] [PubMed] [Google Scholar]
- 25.Fabian M, Palmer G. FEBS Lett. 1998;422:1–4. doi: 10.1016/s0014-5793(97)01561-5. [DOI] [PubMed] [Google Scholar]
- 26.Soulimane T, Buse G. Eur J Biochem. 1995;227:588–595. doi: 10.1111/j.1432-1033.1995.tb20429.x. [DOI] [PubMed] [Google Scholar]
- 27.Wong W W, Lee L S, Klein P D. Am J Clin Nutr. 1987;45:905–913. doi: 10.1093/ajcn/45.5.905. [DOI] [PubMed] [Google Scholar]
- 28.Gonfiantini R. Report on Advisory Group Meeting on Stable Isotope Reference Samples for Geochemical and Hydrological Investigations. Vienna: Int. At. Energy Agency; 1984. [Google Scholar]
- 29.Bortolini O, Di Furia F, Modena G. J Am Chem Soc. 1981;103:3924–3926. [Google Scholar]
- 30.Fabian M, Palmer G. Biochemistry. 1995;34:13802–13810. doi: 10.1021/bi00042a011. [DOI] [PubMed] [Google Scholar]
- 31.Chen Y-R, Gunther M R, Mason R P. J Biol Chem. 1999;274:3308–3314. doi: 10.1074/jbc.274.6.3308. [DOI] [PubMed] [Google Scholar]
- 32.MacMillan F, Kant A, Behr J, Prisner T, Michel H. Biochemistry. 1999;38:9179–9184. doi: 10.1021/bi9911987. [DOI] [PubMed] [Google Scholar]
- 33.Ostermeier C, Harrenga A, Ermler U, Michel H. Proc Natl Acad Sci USA. 1997;94:10547–10553. doi: 10.1073/pnas.94.20.10547. [DOI] [PMC free article] [PubMed] [Google Scholar]
- 34.Yoshikawa S, Shinzawa-Itoh K, Nakashima R, Yaono R, Yamashita E, Inoue N, Yao M, Fei M J, Libeu C P, Mizushima T, et al. Science. 1998;280:1723–1729. doi: 10.1126/science.280.5370.1723. [DOI] [PubMed] [Google Scholar]
- 35.Buse G, Soulimane T, Dewor M, Meyer H E, Blüggel M. Protein Sci. 1999;8:985–990. doi: 10.1110/ps.8.5.985. [DOI] [PMC free article] [PubMed] [Google Scholar]
- 36.Gennis R B. Biochim Biophys Acta. 1998;1365:241–248. doi: 10.1016/s0005-2728(98)00095-4. [DOI] [PubMed] [Google Scholar]
- 37.Oliveberg M, Hallen S, Nilsson T. Biochemistry. 1991;30:436–440. doi: 10.1021/bi00216a019. [DOI] [PubMed] [Google Scholar]
- 38.Shaw R W, Rife J E, O’Leary M H, Beinert H. J Biol Chem. 1981;256:1105–1107. [PubMed] [Google Scholar]
- 39.Osborne J P, Cosper N J, Stalhandske C M V, Scott J O, Gennis R B. Biochemistry. 1999;38:4526–4532. doi: 10.1021/bi982278y. [DOI] [PubMed] [Google Scholar]